Abstract
Urban agriculture is essential in establishing a localized, sustainable food system due to its multifunctional nature in addressing various urban challenges. Despite the recognition that a localized, sustainable food system offers an opportunity to create shared value (CSV), where agriculture generates social and economic value, the impact of environmental and social sustainability practices on farm continuity remains unclear. This paper identifies the impact of sustainability practices on long-term farm development from the perspective of the strategic intentions of urban farmers using a questionnaire survey of 205 urban farms in Japan. Our primary findings are as follows. First, we found that strategic sustainability practices positively impact farm continuity, underscoring the significance of CSV management in sustainable urban farm development. Second, the cluster analysis revealed three strategic groups: socially conscious CSV farms (32.2%), environmentally friendly farms (47.3%), and less sustainable farms (20.5%). Consequently, the socially conscious CSV farms have higher farm continuity than the other groups. For policymakers, promoting awareness of environmentally friendly farms among urban residents and involving diverse stakeholders in supporting less sustainable farms are crucial measures to enhance farm continuity.
1. Introduction
As the establishment of a sustainable food system (SFS) is essential for achieving the Sustainable Development Goals (SDGs), international organizations and countries worldwide are undertaking research and development. In the food system, each company needs to adhere to the standards of responsible business conduct, including all enterprises in the supply chain, from small upstream farms to downstream retailers [1]. The Farm to Fork strategy emphasizes that SFS, which provides business opportunities to multiple stakeholders, is the most competitive in the long term [2].
Furthermore, it is crucial to acknowledge and appreciate localized SFS, in which small- and medium-sized farms play vital roles in the upstream process. For example, an international study on the sustainability of a short food supply chain revealed that a localized SFS is generally rated higher for social sustainability than a global food system [3]. Therefore, agriculture practiced inside and outside the city promotes the sustainability of localized urban food systems. Generally, the multifunctionality of urban agriculture is expected to solve various problems. Many studies have suggested its social functions (e.g., food security, education, social cohesion, job creation, human health, and community development) and its environmental functions (e.g., increasing ecosystem services, mitigating climate change, and efficient use of energy and resources) [4,5,6,7,8]. More recently, it has been mentioned that the value of these multifunctionalities can be further clarified by positioning urban agriculture as an essential factor in a localized urban food system [9].
When considering the sustainability of Japan’s localized urban food systems, the continuity of urban farms is an important factor. Rapid economic growth from the late 1950s onward has led to uneven growth in urban fringe areas, encroaching on large farmland areas. Therefore, the conservation of urban farmland strongly depends on the economic situation and will of the owner/farmers. Additionally, most urban farms in Japan possess minimal business scale, making it crucial to increase sales to generate agricultural income that can sustain family businesses. Securing agricultural successors is also essential to preserving farmland through smooth inheritance and developing farm businesses through intergenerational family entrepreneurship. While many empirical studies focus on specific factors such as succession [10,11], this paper attempts to quantify the concept of farm continuity through a comprehensive exploration of the aforementioned multifarious determinants.
In Japan, legislation aimed at utilizing the multifunctionality of urban agriculture was passed in 2015. Therefore, policymakers in Japan widely recognize that the continuity of urban farms is essential for the sustainability of localized urban food systems. This recognition is also important for other Asian megacities facing similar problems related to urban sprawl, as understanding how to best utilize the multifunctionality of farmland in urban areas can contribute to achieving sustainable urban development in these areas [12]. However, efforts to comprehensively assess the sustainability of urban farmers from an environmental and social perspective are limited to a few studies [13]. This paper further measures comprehensive sustainability practices, including the internal social aspects of considering employees, which is one of the sustainability themes not dealt with in previous studies. The nexus between sustainability practices and farm continuity can be quantitatively ascertained only through such thorough inquiry.
Furthermore, for sustainability practices to be linked to farm continuity, it is necessary to focus on the farmers’ strategic intentions. This concept is based on the theory of creating shared value (CSV), which highlights the importance of simultaneously creating economic and social values in management strategies [14]. A study on urban agriculture demonstrated that advanced farms are economically and socially viable [15]. However, the relationship between sustainability practices and management strategies has not yet been considered. Therefore, in this paper, each sustainability practice is weighted by its importance in the management strategy and vision, making it possible to evaluate the strategic nature of those practices.
Hence, this paper represents one of the studies that examines the linkages between practices related to the multifunctionalities of urban agriculture and farm continuity from a strategic management perspective. To achieve this objective, we first verified that farms that adopted strategic sustainability practices exhibited higher levels of continuity than those that did not. Second, we identified the existence of a cluster of CSV farms that effectively integrate sustainability practices and farm continuity. Our analysis focused on farms located in the suburban regions of central Tokyo, Japan, using data sourced from a questionnaire survey administered in 2022.
2. Conceptual Framework
2.1. Sustainability Practices of Urban Agriculture
The number of empirical studies on the multifunctionality of urban agriculture is still increasing. While local food production as an economic function is often excluded [16,17], it is important to note that most of the empirical studies mentioned below are focused on social sustainability. Firstly, participants in urban farming are motivated not only by fresh produce but also by social cohesion and cost saving [18]. Farming participation has been associated with promoting social involvement [19,20,21], as well as physical and mental health benefits [21,22,23,24,25].
Therefore, when considering the role of farms in improving SFS, a broader perspective than that of the multifunctionality of urban agriculture is needed. Table 1 summarizes the sustainable practices required for farms, based on the guidelines of international organizations and academic papers on sustainable agriculture, excluding the theme of economic sustainability. In the table, most of the abovementioned multifunctionalities of urban agriculture are categorized under the subthemes of environmental and external social sustainability. However, the concept of internal social sustainability is lacking. Therefore, urban farms cannot be considered sustainable unless they prioritize the welfare of the people engaged in urban agriculture.

Table 1.
Sustainability theme of the agricultural sector (excluding economic sustainability).
2.2. Continuity of Urban Agriculture
In this study, we analyzed the continuity of commercial urban farming by professional farmers [36], which differs from urban gardening by urban residents. For example, the number of farms in urban regions in Japan has been declining at an accelerating rate over the past decade: 18.6% from 2010 to 2015 and 22.2% from 2015 to 2020 (Census of Agriculture and Forestry 2020). From 2010 to 2020, there was a decline in the area of farmland by 11.8%. In 2020, only 30.5% of farming households had successors. This is partly because of the deterioration of the farming environment caused by urban sprawl resulting from the uneven growth of cities since the period of rapid economic growth in the 1950s [37,38]. According to the latest GIS-based research, urban sprawl has led to a reduction in the size of farming plots [39]. Similar problems have been observed not only in Japan but also in many other Asian megacities [12]. For example, empirical studies in China have demonstrated severe farmland dispersion and contamination in urban areas [40,41].
However, according to the Census of Agriculture and Forestry (2020), even within the densely inhabited districts (DIDs), regarded as urban areas in Japan, there are 47,037 farms cultivating 67,833 hectares of farmland. Moreover, 52.9% of farmers in areas with a population density of over 10,000 persons/km2 engage in direct marketing activities. This is because, in urban agriculture, farmers tend to conduct direct sales, and agricultural experience programs take advantage of their proximity to cities [39,42,43,44,45]. Thus, urban farmers are actively trying to build relationships with urban residents through diverse activities.
Sinclair noted that the conversion of farmland in urban areas has led to a coarsening of farmland management and a shift from farming to non-agricultural work [46]. Factors including road access [47], transportation access, and population growth rates contribute to high farmland prices [48]. These studies have demonstrated that the expectation of farmland conversion is high in urban areas, which can result in low farming productivity. Additionally, urban agriculture faces challenges related to farming conditions, including increased traffic, trespassing, and complaints from neighbors [49]. A recent study also demonstrated that an urbanized region in France has smaller farmland areas and a higher proportion of farmers without successors [50].
To maximize the role of urban agriculture in a sustainable urban food system, it is important to focus on farm continuity. This paper’s most important research question in this study is whether activities related to sustainability practices contribute to farm continuity. For example, a study evaluating urban agriculture by urban residents found that they particularly valued the sociocultural services provided by urban agriculture [51]. Similarly, it has been shown that increased interactions between urban residents and farmers foster understanding, satisfaction, and positive attitudes towards urban agriculture [52,53]. Additionally, a study analyzing factors influencing long-term farm development found that proactiveness in various sustainability practices positively correlated with farmers’ development prospects [54]. In summary, sustainability practices are expected to have external effects, such as improving understanding of urban agriculture, and internal effects, such as increasing the long-term motivation of farmers and their families. However, as urban residents may evaluate some activities more highly than others [36], farmers need to be clear about the strategic intent of their activities that contribute to farm continuity.
2.3. Creating Shared Value (CSV)
Creating shared value (CSV) is a concept that links sustainability practices with farm continuity. Shared value is defined as “policies and operating practices that enhance the competitiveness of a company while simultaneously advancing the economic and social conditions in the communities in which it operates” [14]. Therefore, farms that create shared value in urban agriculture would not only be economically viable but also contribute to the sustainability of urban food systems.
Therefore, this study aimed to ascertain the effectiveness of CSV management in urban agriculture. Although empirical studies on CSV have mainly focused on large corporations, we propose that the concept of CSV management is highly applicable to small- and medium-sized farms. This is because agriculture is an industry closely connected to the natural environment, and the goods and services it produces hold social value. Particularly, in the case of urban agriculture, which is located in close proximity to urban residents, practicing CSV management to improve farm continuity is expected to be highly effective. For example, a higher proportion of farmers in urban areas of Japan choose to diversify their businesses into environmentally friendly agriculture, direct marketing, and agritourism [39]. Additionally, the fact that advanced diversified urban farms have achieved economic efficiency and urban multifunctionality suggests the effectiveness of CSV management [15].
Empirical studies on CSV are lacking across various industries. Instead, many studies have focused on examining the impacts of corporate social responsibility (CSR) activities on management performance and resources. Firstly, several studies have demonstrated that CSR positively impacts firms’ economic outcomes [55,56,57]. Some studies have also suggested that firm size promotes CSR activities [58,59,60]. Other results have revealed that CSR and economic performance have a mutually causal relationship [61]. Secondly, studies have found that CSR activities are associated with management resources, especially intangible resources like human resources and firm brand value [62,63,64,65]. Pérez [63] demonstrated that CSR activities affect employees’ job satisfaction and organizational citizenship behavior. Furthermore, some studies have revealed that organizational CSR capabilities, activated by CSR, are linked to economic performance [63,66,67]. Therefore, we posit that strategic sustainability practices have a positive impact on continuity through the development of management resources.
3. Hypotheses
Before positing hypotheses, let us clarify the definition of CSV management within the context of this study. Successful CSV management is defined as the implementation of sustainability practices guided by the strategic intent of farmers, resulting in favorable economic outcomes. Our study explicitly emphasizes the improvement in farm continuity as a crucial economic outcome for urban farms. In this study, a farm that effectively implements successful CSV management is referred to as a CSV farm.
Next, this study focuses on the correlation between farm continuity and strategic sustainability practices. In urban agriculture, where the pressure of urbanization is particularly acute, farm sustainability relies not only on securing sufficient agricultural income but also on the protection of farmland. This study posits that the more society comprehends the environmental and social values of urban farmland, the weaker the farmers’ incentive to relinquish their farmland.
Securing farm successors is an essential component of farm continuity and management. Some argue that family businesses are more active in sustainability practices because they value their corporate identities and reputation [58,68]. Moreover, as Surroca [65] and Pérez [63] point out, sustainability practices increase employees’ job satisfaction and motivation, which should hold true for family staff. Therefore, this study assumes that CSV management strengthens the ethical leadership of farmers [69], thereby promoting prosocial motivations among potential successors [70].
Based on the above discussion, the indicators of farm continuity, including farmland preservation, securing successors, and business development, can be integrated into a farm continuity index. Therefore, we propose the following hypothesis:
Hypothesis 1.
Strategic sustainability practices have positive impacts on farm continuity.
After testing the hypotheses, the cluster analysis will investigate the distinctive attributes and obstacles faced by farms that adopt CSV management. If a management strategy focused on sustainability practices is prevalent in urban agriculture, it should be feasible to categorize these farms into strategic groups. A strategic group comprises firms that implement specific management strategies within an industry [71]. If the strategies of each group are difficult to replicate, certain strategic groups can achieve higher economic performance by creating barriers to entry [72,73,74,75]. In this study, the achievement of farm resilience is considered a crucial economic outcome.
4. Methodology
4.1. Analytical Framework
To test the aforementioned hypotheses, we selected 11 items regarding environmental sustainability (ecosystem services and circular agriculture), external social sustainability (agricultural understanding, food safety, social activities, and landscape management), and internal social sustainability (sustainable procurement, working conditions, mental health, family involvement in decision-making, and investment in human resources). A five-point Likert scale was used for each item to determine the level of engagement in each sustainability practice by the sample farms.
For each of the 11 sustainability practices, the respondents were asked to select the top five practices they considered essential for farm development and the achievement of their farm vision. The results were then used to construct a weighted sustainability practice index as a proxy variable for strategic sustainability practices. The formula used is as follows:
The sustainability practices are assigned values ranging from 1 to 5. The strategic weights are set from 0.1 to 1.0, where no choice = 0.1; the fifth rank = 0.2; the fourth rank = 0.4; the third rank = 0.6; the second rank = 0.8; and the first rank = 1.0. Therefore, the weighted sustainability practices have values ranging from 0.1 to 5.0. The sum of the weighted sustainability practices for each of the environmental, external social, and internal social items is also used in the analysis.
Subsequently, we will construct an index to comprehensively evaluate farm continuity. This study conducted a factor analysis to develop a comprehensive farm continuity index, using variables for farm development (one item), farmland preservation (two items), and securing successors (one item). For ordinal-scale variables, performing factor analysis using the conventional correlation matrix is not feasible. Therefore, in this paper, polychoric correlation analysis, which expresses the correlation between ordinal scales, was conducted. Factor analysis was then applied based on the results (statistical software R, package: psych).
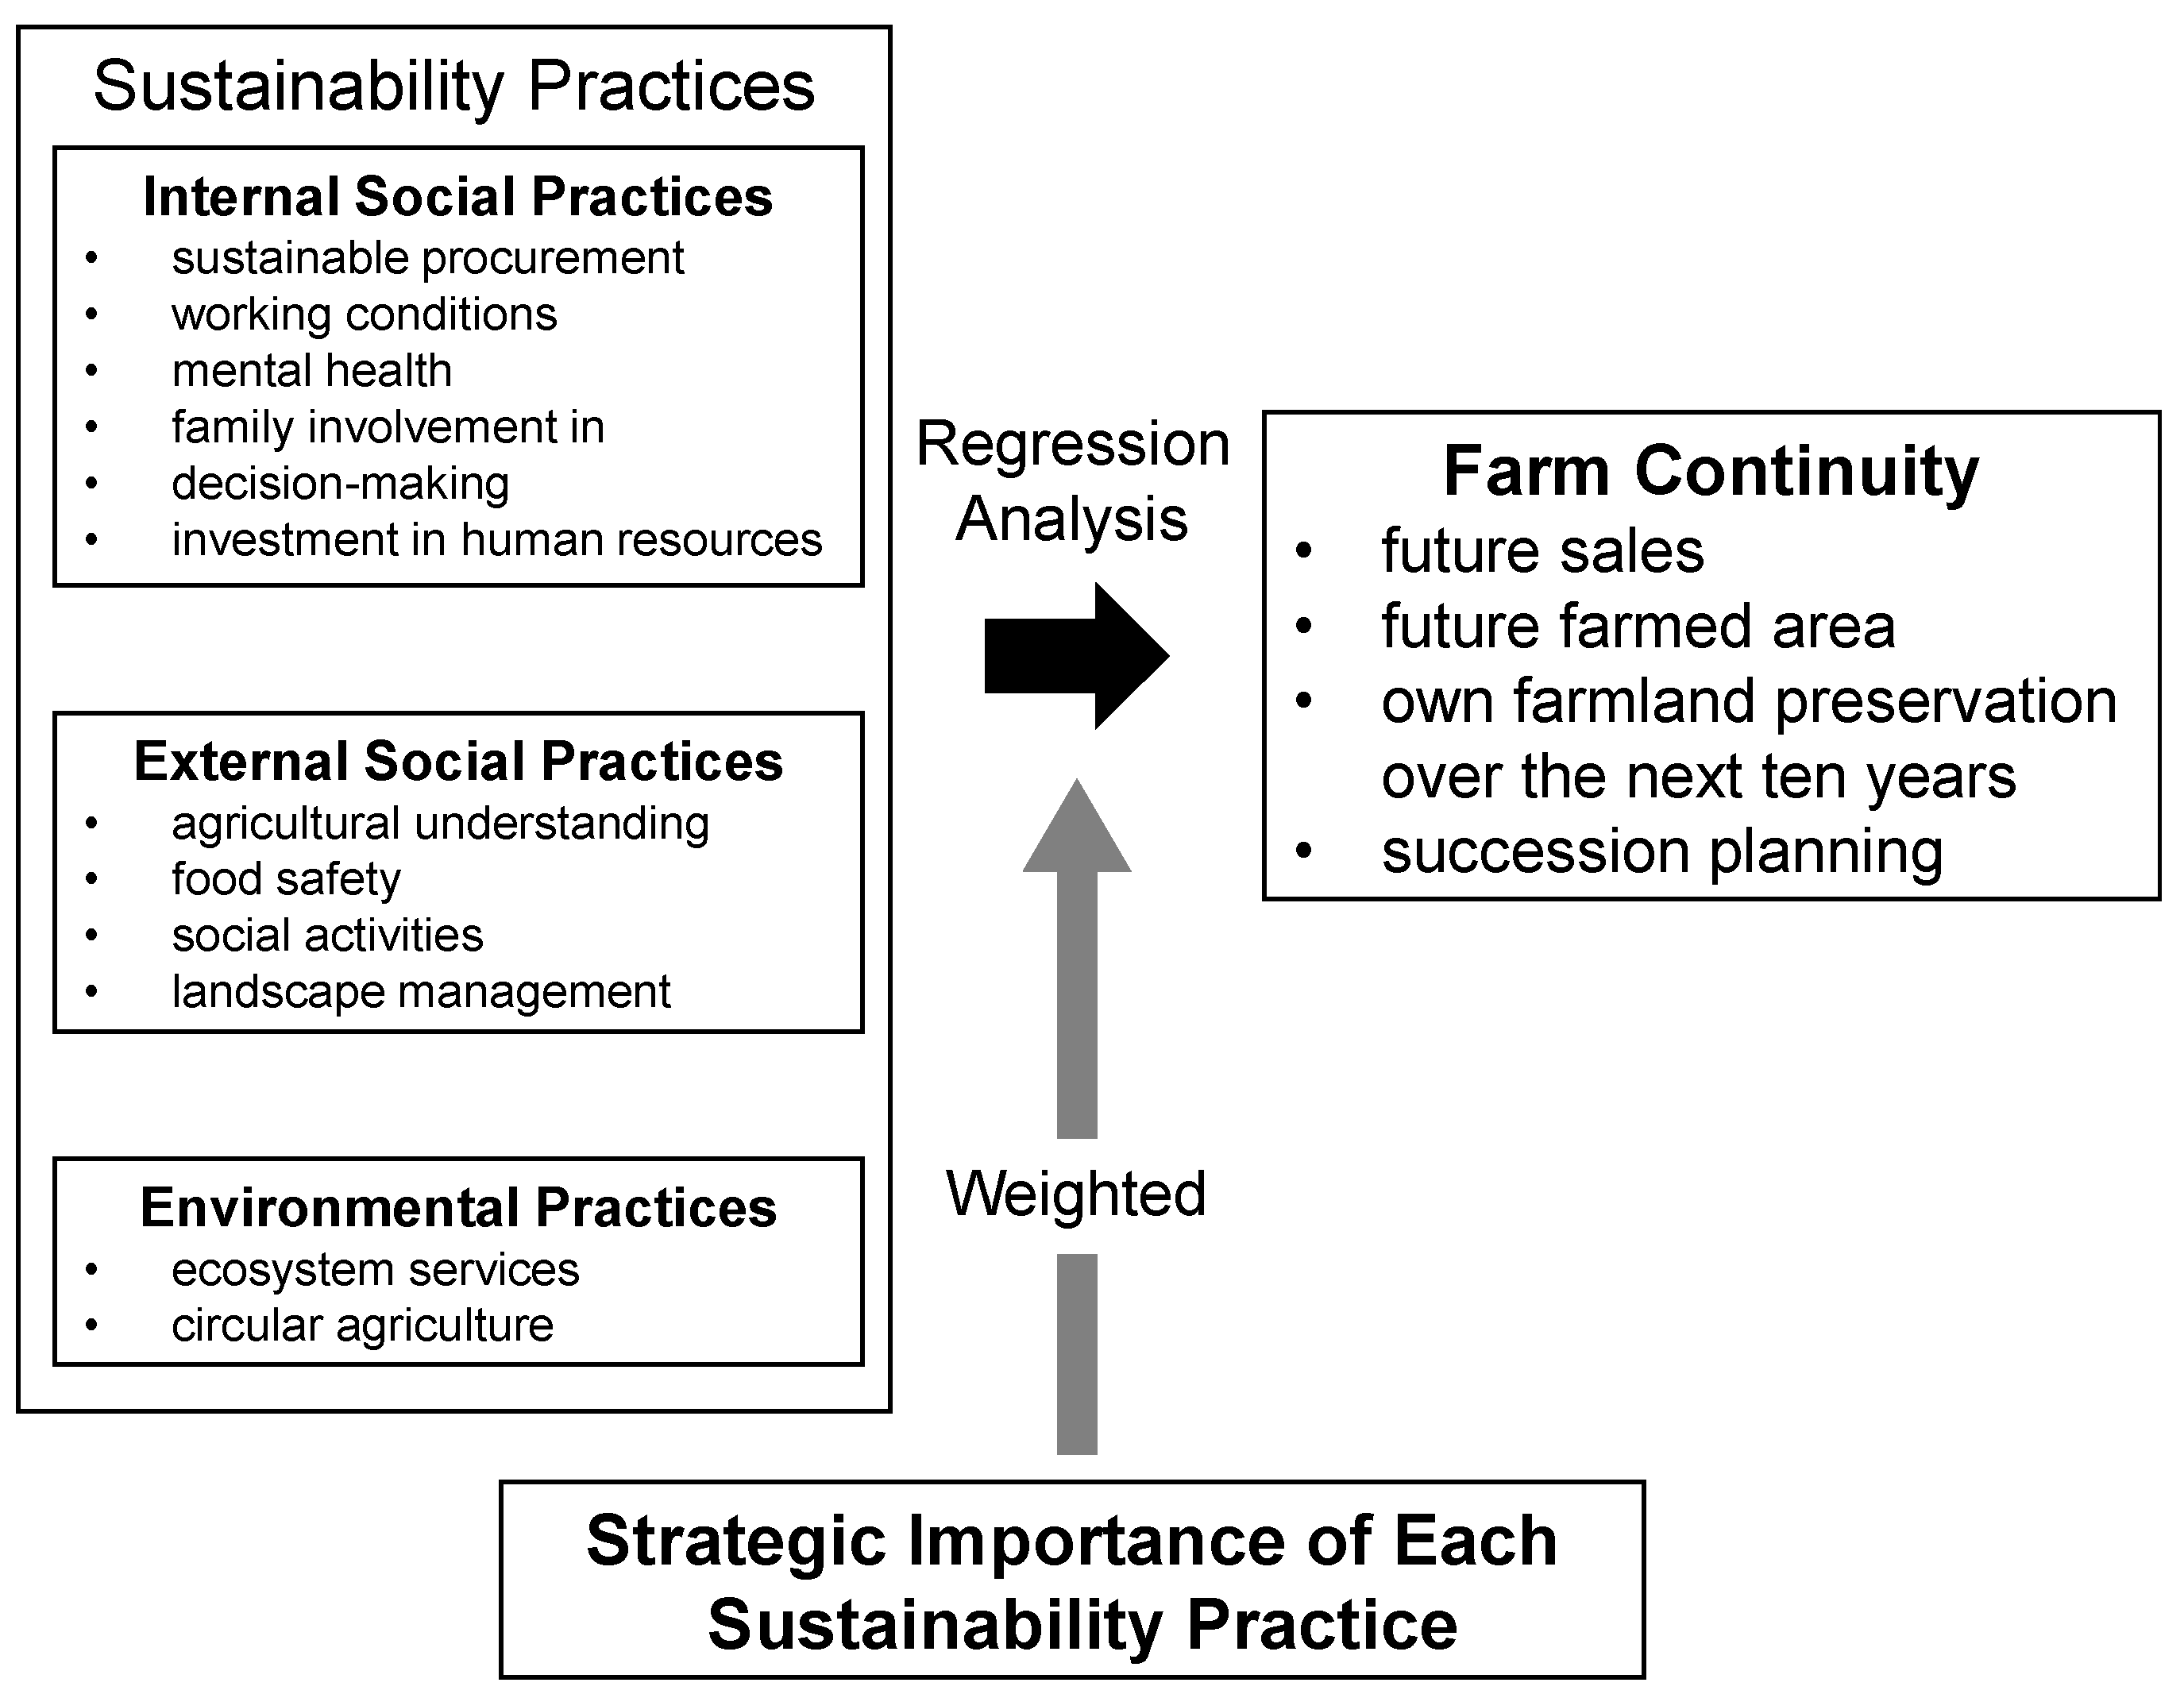
Figure 1 depicts the framework for analyzing the impact of each strategic (weighted) sustainability practice on farm continuity. Regression analyses (statistical software R, packages stats and lmtest) were used to verify the impacts of the weighted strategic sustainability practices on farm continuity. In addition to the base model, the effect of each sustainability theme index (environmental, external social, and internal social sustainability) on farm continuity will be assessed (Model 2). Furthermore, the relationship between each strategic sustainability practice and farm continuity will be clarified (Model 3). The control variables include management resources (social network, family motivation, and operational capability) (for details, see Supplemental S1), the farmland area, the farmer’s age, a sampling region dummy, and farm-type dummies.

Figure 1.
The analytical process of this study.
The characteristic of these models is to avoid missing variable bias by identifying management resources that could be determinants of sustainability practices and adding them to the explanatory variables. Additionally, to deal with the problem of heterogeneous variance in the error term, cluster robust standard errors were estimated, stratified by farm types, which are considered to impact the relationship between sustainability practices and farm continuity significantly. However, due to the limitation of identifying the exact causal relationship, this model cannot consider the mechanism that highly continuous farms are more active in sustainability practices.
After verifying these hypotheses, we ascertained the existence of a strategic group of the CSV farms using cluster analysis. The variables used in the cluster analysis were the weighted sustainability practices (11 items), the continuity index, and the management resources. The k-means ++ method was used for the cluster analysis (statistical software: R, packages: cluster and LICORS). This method solves the problem of the standard k-means method, where the results vary significantly depending on the initial values of the cluster centers. The number of clusters was determined based on the gap statistic (see details in [76]). Then, to analyze the differences between the strategic groups, analysis of variance was used for the continuous variables. Finally, we compared the requests for improving urban agriculture across each cluster to understand their characteristics.
4.2. Data
The analysis used data from a survey of 205 farms located near Tokyo’s urban areas. The survey was conducted in 2022 by distributing questionnaires to almost all types of farms through two organizations: the agricultural division of Higashimurayama city (465 farms) and the Japan Agricultural Cooperative (JA) Tokyo Midori (1084 farms). The proportion of valid responses was 12.8% (11.0% from Higashimurayama city and 13.6% from JA Tokyo Midori).
4.3. Characteristics of the Studied Areas
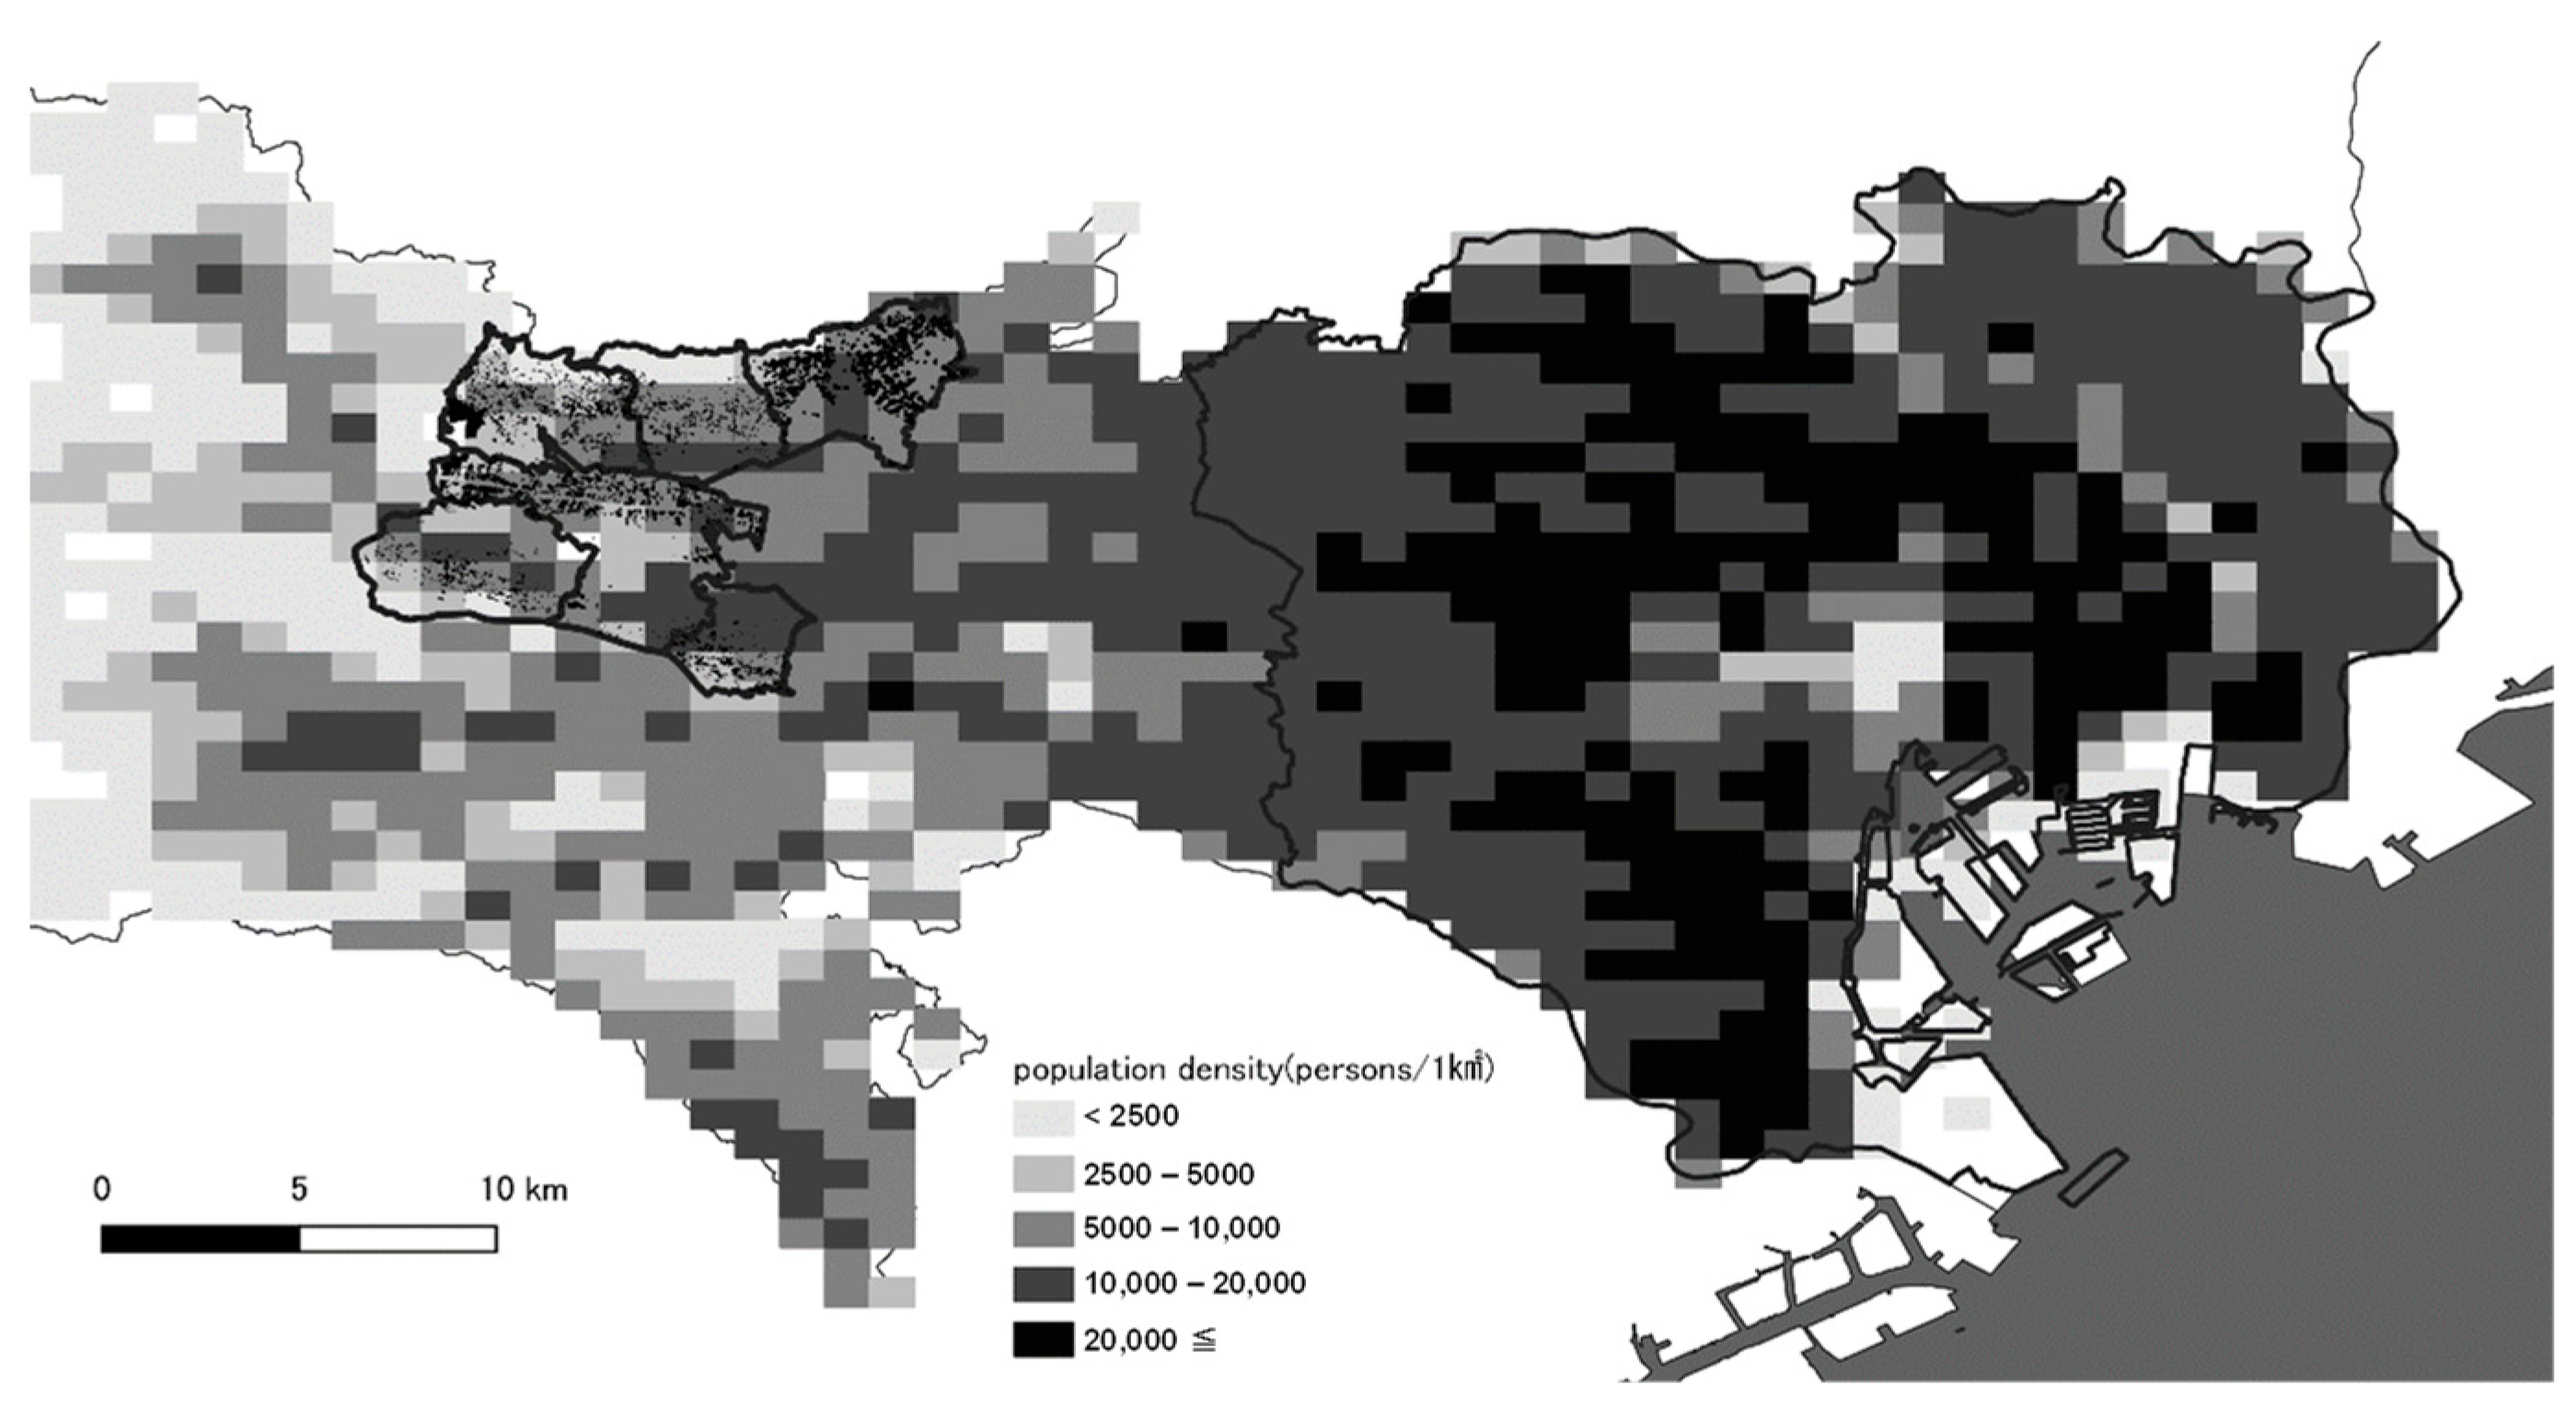
Figure 2 shows the locations and characteristics of the studied areas in Tokyo. First, in Japan, urban agriculture refers to urban farming practiced within the city and peri-urban farming practiced on the urban fringes. The most urbanized areas are situated in the eastern part of Tokyo, where the population density exceeds 10,000 persons/km2. As one moves westward, the population density gradually decreases, with the six cities under examination having a population density of approximately 5000 persons/km2. The scattered black dots representing the farmland location demonstrate the scarcity of farmland in the densely populated areas of each city, with farmland concentrated in the peripheral areas. Considering the above definition of urban agriculture, it is clear that most of the studied farms can be regarded as urban farms.

Figure 2.
Target areas and population density. Note: Black dots indicate the location of the plots, as indicated by farmland polygons (Ministry of Agriculture, Forestry and Fisheries, 2022). Black boxes indicate the areas analyzed. Population density indicates the population within each 1 km mesh (Ministry of Land, Infrastructure, Transport and Tourism, “Future Population Projections by 1km Mesh”).
Figure 3 shows the percentage of farms based on the extent of the farmland area. The sample in this study includes smaller farms with less than 0.3 ha of farmland. This result is attributed to the inclusion of smaller farms, which are typically excluded from Japan’s Census of Agriculture and Forestry. In other words, this study can analyze a broader range of size classes of urban farmers than government statistics.
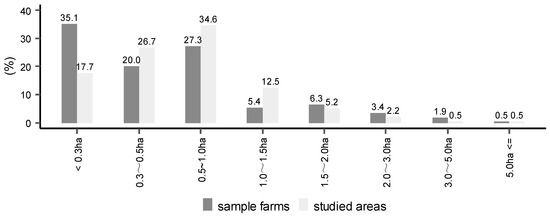
Figure 3.
The percentage of farms by the size of the farmland area for both the farms in all studied areas and the sample in this study. Note: n = 205 (sample farms) and 734 (all farms located in the studied areas from the census (2020)).
5. Results
5.1. Overview of Sample Farms
Table 2 presents an overview of the sample farms. The average farmland area is 0.65 ha, and the average age of the farmers is 64.7 years, suggesting that small-scale operations and aging farmers characterize urban farms. Approximately 56.6% of the respondents cultivated vegetables grown outdoors, followed by fruits grown outdoors (17.1%). These findings suggest that the target cities are typical urban farming regions that primarily produce fresh vegetables and fruits.
Table 2.
Descriptive statistics of the sample farms.
Table 3 illustrates the mean values of the farmers’ subjective evaluations of sustainability practices. The highest mean values were observed for social activities, ecosystem services, and circular agriculture. This result indicates an exceptionally high interest in external, social, and environmental sustainability. However, investment in human resources has a lower mean value than that of environmental and external social practices. This finding implies that insufficient human resource management is an urgent issue for urban farmers.
Table 3.
Statistics on farmers’ self-assessment of their sustainability practices.
5.2. Farm Continuity
Table 4 illustrates the results of the responses to the four items related to farm continuity. In terms of the extent of sales amount in the next ten years, 51.22% of the respondents answered “status quo”, followed by “decrease” (18.5%). Concerning the extent of farmed areas in the next ten years, 60.98% of the respondents answered “status quo”, followed by “downsize” (22.44%). Concerning preserving their farmland over the next ten years, only 39.02% of the respondents answered with “maintain all farmland”, and 43.90% answered with “maintain a part of farmland”. The sum of the percentages of “successor (already working)”, “successor (with a plan to work)”, and “successor (without a plan to work)” is 56.10%, indicating that about half of the farms have secured successors. The above results reveal that the likelihood of farm continuity varies considerably regarding the business size, farmland, and successors.
Table 4.
Factor analysis of the farm continuity index and the results of the polychoric correlation analysis.
As shown in Table 4, the polychoric correlation results indicated positive correlations among the four items. Then, using this correlation matrix, a factor analysis of the one-factor model was conducted. As a result, one factor with substantial factor loadings for all four items was considered the farm continuity index.
5.3. Sustainability Practices and Weighting
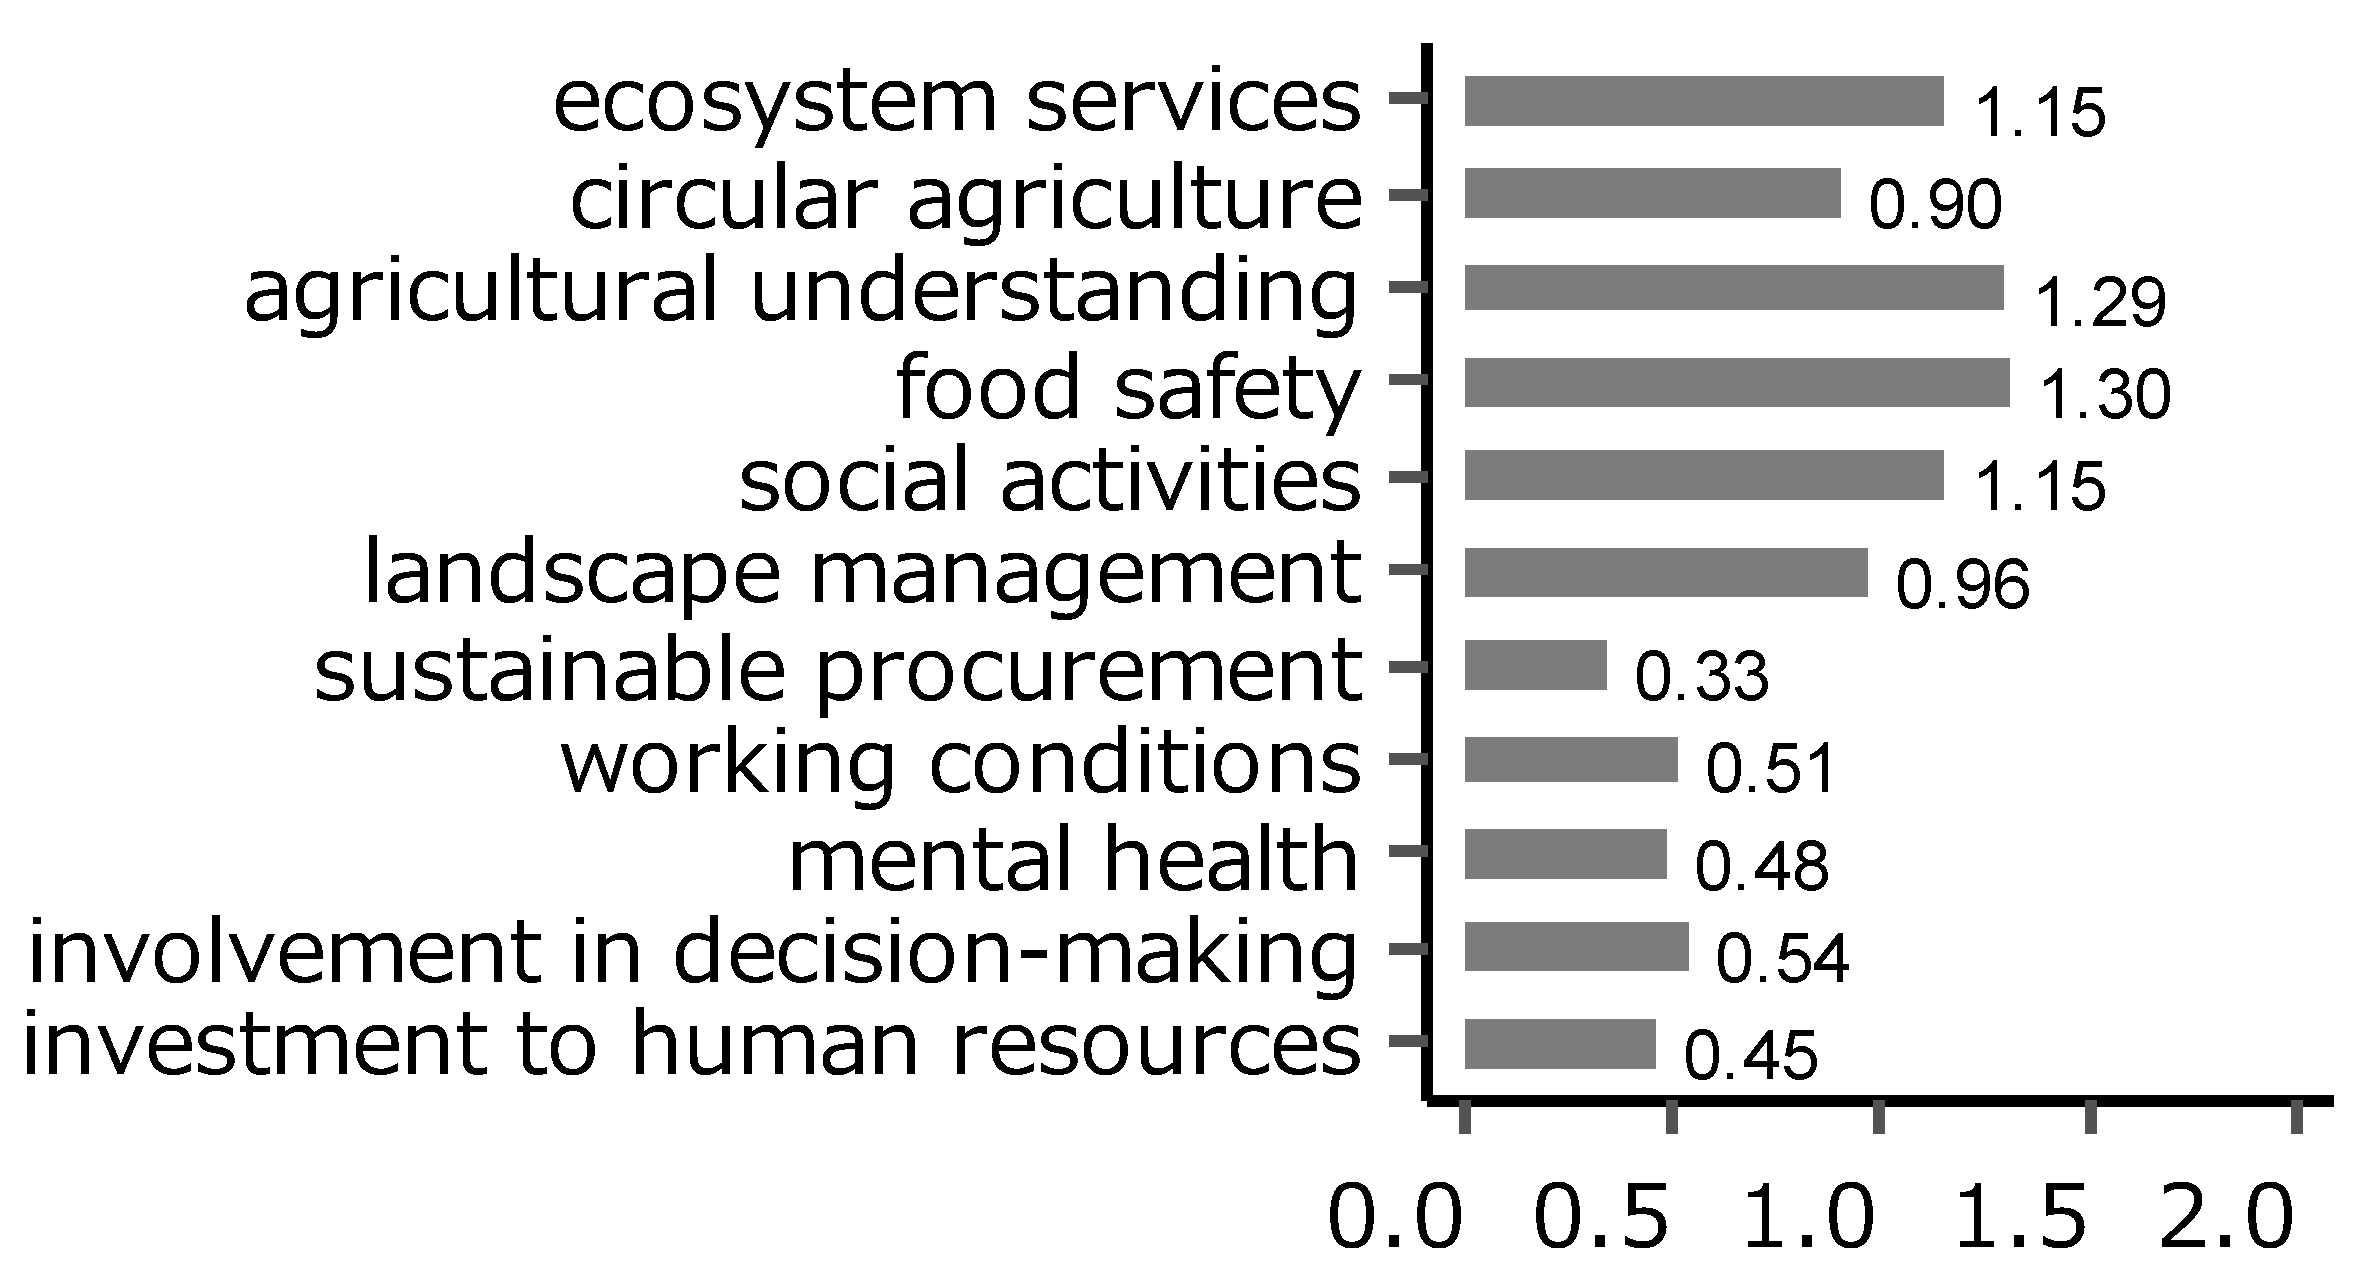
Table 5 presents the results of selecting the top five sustainability practices that farmers considered necessary for farm development and achieving their farm vision. For example, the most selected item for the first rank (weight = 1.0) is agricultural understanding (24.9%), followed by food safety (21.0%). The most selected item for the second rank (weight = 0.8) is ecosystem services (15.6%), followed by social activities (14.6%). The mean value of each weighted sustainability practice is depicted in Figure 4. The figure reveals that the most strategically implemented practices are external social practices, including food safety (1.30), agricultural understanding (1.29), and social activities (1.15). However, the mean values of the internal social practices are all less than 1.00, indicating that the sample farmers placed less emphasis on internal social sustainability.
Table 5.
Percentage of farmers who identified each variable as important for their farm development or farm vision (top five).
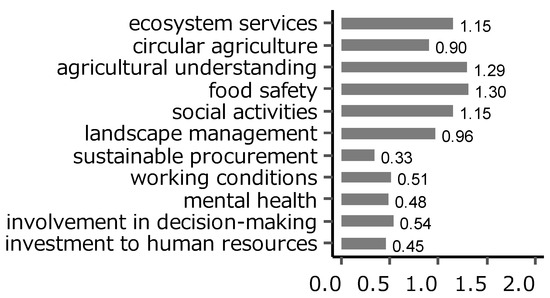
Figure 4.
Mean value of each variable in the weighted sustainability index.
5.4. Farm Continuity of CSV Management
We ascertained the effects of sustainability practices on farm continuity (see Table 6). First, model 1 demonstrates that highly continuous farms have large farmland areas, social networks, and motivated family members. Additionally, younger farmers showed higher farm continuity. Regarding the types of farms, farms growing fruits or vegetables outdoors have relatively higher continuity than other types of farms.
Table 6.
Effect of strategic sustainability indices on farm continuity.
According to Model 2, the coefficients of the external social practice index and environmental practice indices are also positive and significant. Additionally, the effect of the external social practice index is higher than that of the other two indices. In Model 3, the coefficients of the weighted sustainability practices, such as “circular agriculture”, “agricultural understanding”, “social activities”, and “investment in human resources” are positive and significant. Upon assessing the model’s goodness of fit, as measured by the adjusted R-squared statistic, it becomes evident that strategic sustainability practices serve as an effective means for appraising farm continuity, with selected practices demonstrating exceptional efficacy. This result suggests that the strategic sustainability practices of farms positively affect farm continuity, even when controlling for management resources, farm size, and farm type, thereby supporting our hypotheses.
5.5. Clustering of Strategic Groups
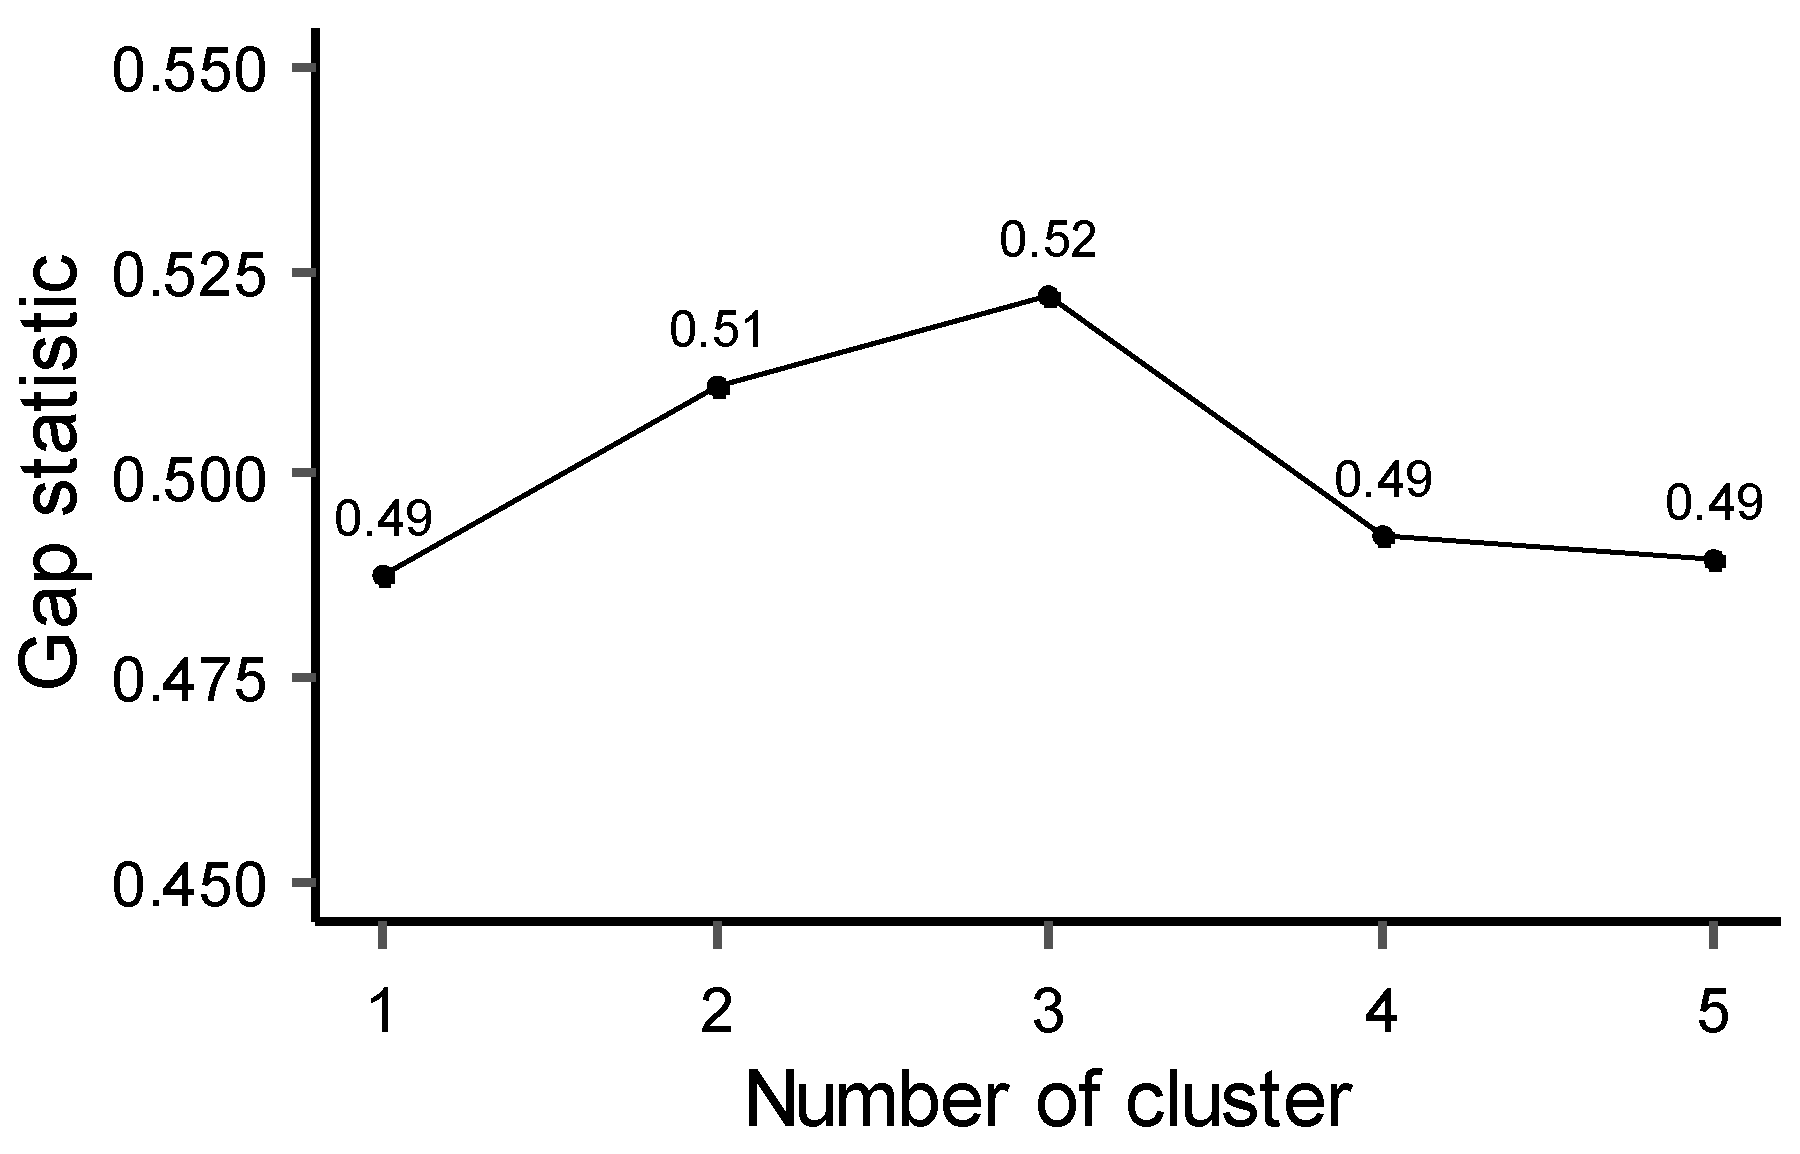
The k-means ++ method was used for the clustering analysis, employing the weighted sustainability practices, farm continuity index, operational capability, social network, and family motivation. As depicted in Figure 5, since the gap statistic is the maximum in the three-cluster model, the k-means ++ method with k = 3 was used in this study. The result reveals that Cluster A comprises 66 farms (32.2%), Cluster B comprises 97 farms (47.3%), and Cluster C comprises 42 farms (20.5%).
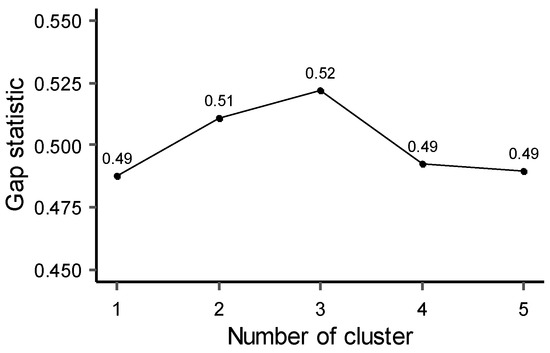
Figure 5.
Gap statistic that determines the ideal number of clusters for the k-mean method. The bootstrap numbers are 1000. The maximum number of clusters to consider is five.
Table 7 presents the mean values of each variable across the clusters. Firstly, the farm continuity index of Cluster A was the highest, followed by Cluster B. Moreover, the most salient feature of Cluster A was that the weighted external social practice index was higher than that of the other clusters. Additionally, the mean values of the three management resources—operational capability, social network, and family motivation—were also the highest in Cluster A. Cluster B tended to exhibit the highest mean value for environmental practices while maintaining a moderate level of management resources. In contrast, Cluster C demonstrated lower mean values for all variables.
Table 7.
Characteristics of each strategic group and analysis of variance.
Based on the above, if we name each cluster according to the direction of sustainability practices and the degree of farm continuity, Cluster A can be called “socially conscious CSV farms” because only Cluster A successfully exhibits external social practices and farm continuity simultaneously. This result is supported by the regression analysis, which showed that the positive coefficient of the external social practice index is higher than that of the other two indices. We also name Cluster B as “environmentally friendly farms” and Cluster C as “less sustainable farms”. The higher levels of management resources, larger farmland sizes, and younger farmers imply that socially conscious CSV farms are the strategic group that can most effectively implement strategic sustainability practices. According to an additional analysis, as expected, 28.8% of socially conscious CSV farms intend to expand the scale of sales, and 86.3% indicate the intention to maintain or expand their farmland. Furthermore, socially conscious CSV farms are particularly successful in securing successors (for details, see Supplemental S3).
Table 8 demonstrates the proportions of the requests chosen by each cluster to improve urban agriculture. Concerning the demands of the types of individuals or entities that should facilitate urban agriculture, all clusters strongly recognized the importance of new entrants and successors. However, less sustainable farms show higher expectations for agriculture from diverse actors such as off-farm corporations, non-profit organizations, and farming volunteers.
Table 8.
Requests for improving urban agriculture across each cluster.
Next, “activities to promote agricultural understanding of children” is listed as the most important sustainability practice that should be promoted in the future. In other words, many farmers consider that agricultural and food education affects the development of urban agriculture. Additionally, socially conscious CSV farms more frequently select activities related to external social sustainability, such as “Farming for school meals” and “Care farming and social farming”. This result indicates that socially conscious CSV farms understand the importance of these activities as elements of farm continuity.
Finally, “improving the farming environment” was the second most frequent choice in all clusters. As indicated in Table 3, the importance of employee-friendly activities is recognized, but there are disincentives for implementation. Additionally, the regression analysis suggests that “investment in human resources” contributes to farm continuity, highlighting the importance of working conditions as an essential sustainability issue for urban farms.
6. Discussion
This study demonstrates the positive correlation between sustainability practices implemented with strategic intent and the continuity of farms. The results are novel in that they show that sustainability practices are essential parts of business management that affect diverse aspects of urban agriculture continuity (sales, farmland, and succession). Moreover, this paper’s broad scope of sustainability practices reveals that external social activities strongly influence farm continuity. According to the clustering of strategic groups, socially conscious CSV farms have higher farm continuity compared to other strategic groups. This result is significant, as it illustrates the effectiveness of CSV management in urban agriculture. As previous studies have pointed out, social sustainability practices have external effects by directly encouraging urban residents to support urban agriculture. The importance of external social sustainability practices in agricultural management aligns with Hansson’s concept of the microsocial farm environment as a factor influencing the success of management strategies [77]. However, the study also confirms the importance of farmers’ strategic intentions through internal social and environmental sustainability practices. Therefore, this study illustrates that promoting corporate social responsibility (CSR) activities alone is inadequate for establishing a sustainable localized food system with the multifunctionality of urban agriculture. Instead, farms must prioritize resolving urban issues as a fundamental management strategy and generate shared values.
This study also demonstrates that only socially conscious CSV farms, which tend to continue their businesses, can contribute to the sustainability of localized urban food systems in the long run. Previous studies have suggested that urban residents highly value the sociocultural services of urban agriculture [51], and empirical studies have shown the importance of urban agriculture’s fresh food supply, social involvement, human health, and other social functions of urban agriculture. Moreover, this strategic group recognizes the importance of developing social activities, such as farming for school meals and care farming. In recent years, local governments have focused on these new activities. Additionally, shipping school meals is a business that can combine stable sales with educational functions. Similarly, care farming can serve the purposes of health promotion, community building, and social inclusion, while simultaneously aiming to alleviate severe labor shortages by involving diverse people in agriculture. In other words, both businesses are attracting the attention of socially conscious CSV farms as activities that can combine external social sustainability and economic benefits.
However, this cluster of socially conscious CSV farms represents only 32.2% of the total sample. This means that the farm continuity of environmentally friendly farms should be improved to achieve a sustainable urban food system. Although circular agriculture has been considered one of the essential functions of urban agriculture in previous studies (e.g., [4]), in the sample of this paper, the strategic group that emphasized such an environmental endeavor was inferior to the strategic group that emphasized social sustainability in terms of social networks and organizational capabilities. Some studies have found that urban residents’ evaluation of urban agriculture is also higher for social than environmental functions [51]. The first approach to augmenting the continuity of environmentally friendly farms is to combine environmental practices with external social practices. Sroka [53] found that making urban residents aware of the environmental practices implemented by farmers was an effective way to gain the community’s support. The findings of this paper suggest that promoting an understanding of environmentally friendly practices through interaction with consumers and participation in community activities can improve farm continuity. As pointed out by Diekmann [9], this mutual linkage between upstream agricultural production and downstream consumers and communities is likely to enhance the value of the multifunctional role of urban agriculture. Similarly, the results of this study suggest that environmentally friendly farms recognize the importance of activities that promote children’s agricultural understanding.
The regression analysis for internal social sustainability showed that “investment in human resources” was positively correlated with farm continuity. Internal social sustainability has not been a subject of research in the context of sustainability in urban agriculture. It has been pointed out as a limitation of urban agriculture that employment in urban agriculture needs to allow for sufficient human investment [7]. Thus, this paper’s contribution was to empirically show the role of human investment. However, the strategic weight given to internal social sustainability was small compared to other themes. On the other hand, more than half of the sample farms are interested in improving the farming environment in the future.
Consequently, urban farmers recognize the role of considering their employees in promoting continuity. For example, to encourage family participation in farm management through flexible decision-making structures, farmers should use a bottom–up organizational structure that listens to the opinions of family members. Active investment in human resources is necessary to improve the abilities and skills of family members, creating more opportunities for them to actively participate in farm management.
Regarding the preservation of urban farmland, socially conscious CSV farms play a significant role in conserving a large amount of urban farmland. On the contrary, less sustainable farms have smaller farmland areas and produce less social and environmental value. To establish a sustainable food system centered on urban agriculture, an important measure is to make use of farmland cultivated by farmers who find it difficult to continue their businesses. Therefore, urban agriculture policies should be modified to diversify the types of organizations that facilitate urban agriculture, including off-farm corporations, nonprofit organizations, and farming volunteers. According to this study, there are relatively high expectations of these new entrants in less sustainable farms. However, previous studies have shown that urban farmland lenders strongly demand that borrowers manage farmlands in a way that does not damage the local landscape and is in harmony with the local community [78]. In other words, policies to conserve urban farmland should increase the number of farmers who can maintain their farmland through sustainable practices and, at the same time, promote the leasing of farmland in a way that meets the needs of farmers who already have low continuity potential.
7. Limitations of This Study and New Prospects
Finally, we discuss the prospects of this study. As the theme of this study is the continuity of CSV management, we did not analyze the impacts of CSV on farm development. CSV management provides opportunities for urban farms to expand in various dimensions such as developing new marketing channels, enhancing agricultural products’ value, and auguring customer loyalty. Considering the findings of this study, it is imperative to examine how socially conscious CSV farms achieve farm development, from both qualitative and quantitative perspectives. Therefore, it is crucial to emphasize the causal relationship between sustainable practices and farm development. This study needs to elucidate the background and determining factors of CSV practices, taking into account various characteristics, such as farm type, location, farmers’ preferences and capabilities, and social networks. From a policymaking perspective, it is crucial to clarify these factors to establish a sustainable and localized urban food system.
8. Conclusions
This study focuses on creating shared value (CSV) management to enhance farm continuity in urban agriculture. It analyzes the results of a questionnaire survey of farms in Tokyo, Japan, conducted in 2022. Regarding analytical methods, the study measured a wide range of practices not used in previous urban farmers’ sustainability studies. Another novel feature is the multifaceted assessment of the continuity of urban farmers.
The main results are as follows: first, sustainability practices, considered essential management strategies, positively influence farm continuity. Among these practices, external social sustainability and environmental sustainability, guided by the strategic intent of farmers, such as practices for “circular agriculture”, “agricultural understanding”, and “social activities”, had a significant impact on farm continuity. Very few studies have quantitatively demonstrated the relationship between these sustainability practices and farm continuity. Furthermore, this finding verifies the importance of CSV farm management for sustainable farm development.
Second, the cluster analysis revealed three strategic groups: socially conscious CSV farms, environmentally friendly farms, and less sustainable farms. Among them, socially conscious CSV farms are characterized by abundant intangible resources, large farmlands, and younger farmers. Furthermore, socially conscious CSV farms demonstrated higher farm continuity than the other groups. This finding indicates the importance of CSV management as a farm strategy that can contribute to the long-term sustainability of localized urban food systems. In particular, the demonstration of the importance of social sustainability is novel in that it confirms that the social value of urban agriculture, which urban residents have highly valued, is also linked to the continuity of farm management.
According to previous studies, external social practices contribute to the multi-functionality of urban agriculture, which is highly valued by urban residents. The farms that recognize the importance of these practices and incorporate them into their management strategies show the highest level of continuity. While socially conscious CSV farms account for approximately 30% of all farms, the number of environmentally friendly farms that actively engage in environmental practices remains low. Identifying the characteristics of strategic groups with issues of sustainability and farm continuity is a significant result that can be applied to a framework for selecting targets for future support of urban agriculture. Policymakers must take measures to increase urban residents’ awareness of environmentally friendly farms and enhance their farm continuity.
Supplementary Materials
The following supporting information can be downloaded at: https://www.mdpi.com/article/10.3390/su152115463/s1.
Author Contributions
Conceptualization, S.Y.; methodology, S.Y.; software, S.Y.; validation, H.Y.; formal analysis, S.Y.; investigation, S.Y.; resources, S.Y.; data curation, S.Y. and H.Y.; writing—original draft preparation, S.Y.; writing—review and editing, S.Y.; supervision, H.Y.; project administration, S.Y. and H.Y.; funding acquisition, H.Y. All authors have read and agreed to the published version of the manuscript.
Funding
This research was funded by the Japan Society for the Promotion of Science (grant number 19KT0007).
Data Availability Statement
Data sharing is not applicable to this study. The data used in this study were collected from farmers who required confidential data.
Conflicts of Interest
The authors declare no conflict of interest. The sponsors played no role in the design, execution, interpretation, or writing of the study.
References
- OECD/FAO. OECD-FAO Guidance for Responsible Agricultural Supply Chains; OECD Publishing: Paris, France, 2016. [Google Scholar]
- European Commission. Farm to Fork Strategy for a Fair, Healthy and Environmentally-Friendly Food System. Available online: https://food.ec.europa.eu/horizontal-topics/farm-fork-strategy_en (accessed on 1 September 2023).
- Doernberg, A.; Piorr, A.; Zasada, I.; Wascher, D.; Schmutz, U. Sustainability Assessment of Short Food Supply Chains (SFSC): Developing and Testing a Rapid Assessment Tool in One African and Three European City Regions. Agric. Hum. Values 2022, 39, 885–904. [Google Scholar] [CrossRef] [PubMed]
- Lovell, S.T. Multifunctional Urban Agriculture for Sustainable Land Use Planning in the United States. Sustainability 2010, 2, 2499–2522. [Google Scholar] [CrossRef]
- Nicholls, E.; Ely, A.; Birkin, L.; Basu, P.; Goulson, D. The Contribution of Small-Scale Food Production in Urban Areas to the Sustainable Development Goals: A Review and Case Study. Sustain. Sci. 2020, 15, 1585–1599. [Google Scholar] [CrossRef]
- Piorr, A.; Zasada, I.; Doernberg, A.; Zoll, F.; Ramme, W. Research for AGRI Committee-Urban and Peri-Urban Agriculture in the EU; European Parliament: Strasbourg, France, 2018. [Google Scholar]
- Santo, R.; Palmer, A.; Kim, B. Vacant Lots to Vibrant Plots: A Review of the Benefits and Limitations of Urban Agriculture; Johns Hopkins Center for a Livable Future: Baltimore, MD, USA, 2016. [Google Scholar]
- Teitel-Payne, R.; Kuhns, J.; Nasr, J. Indicators for Urban Agriculture in Toronto: A Scoping Analysis; Toronto Urban Growers: Toronto, ON, Canada, 2016. [Google Scholar]
- Diekmann, L.O.; Gray, L.C.; Thai, C. Le More than Food: The Social Benefits of Localized Urban Food Systems. Front. Sustain. Food Syst. 2020, 4, 169. [Google Scholar] [CrossRef]
- Chang, H.-H.; Mishra, A.K.; Lee, T.-H. A Supply-Side Analysis of Agritourism: Evidence from Farm-Level Agriculture Census Data in Taiwan. Aust. J. Agric. Resour. Econ. 2019, 63, 521–548. [Google Scholar] [CrossRef]
- Sroka, W.; Pölling, B.; Mergenthaler, M. City Adjustments as the Main Factor of Success of Urban and Peri-Urban Farms--Empirical Evidence from the Ruhr Metropolis. NJAS Wagening. J. Life Sci. 2019, 89, 100299. [Google Scholar] [CrossRef]
- Yokohari, M.; Takeuchi, K.; Watanabe, T.; Yokota, S. Beyond Greenbelts and Zoning: A New Planning Concept for the Environment of Asian Mega-Cities. In Urban Ecology; Springer: Berlin/Heidelberg, Germany, 2008; pp. 783–796. [Google Scholar]
- Zasada, I.; Weltin, M.; Zoll, F.; Benninger, S.L. Home Gardening Practice in Pune (India), the Role of Communities, Urban Environment and the Contribution to Urban Sustainability. Urban Ecosyst. 2020, 23, 403–417. [Google Scholar] [CrossRef]
- Porter, M.E.; Kramer, M.R. Creating Shared Valuee. Harv. Bus. Rev. 2011, 89, 2–17. [Google Scholar]
- Yoshida, S.; Yagi, H.; Kiminami, A.; Garrod, G. Farm Diversification and Sustainability of Multifunctional Peri-Urban Agriculture: Entrepreneurial Attributes of Advanced Diversification in Japan. Sustainability 2019, 11, 2887. [Google Scholar] [CrossRef]
- Ikejima, Y. Measuring Elderly People’s Food Access in Urban Food Environments: The Potential Benefits of Urban Agriculture. Int. J. Sociol. Agric. Food 2019, 25, 21–41. [Google Scholar] [CrossRef]
- Pulighe, G.; Lupia, F. Multitemporal Geospatial Evaluation of Urban Agriculture and (Non)-Sustainable Food Self-Provisioning in Milan, Italy. Sustainability 2019, 11, 1846. [Google Scholar] [CrossRef]
- Guitart, D.; Pickering, C.; Byrne, J. Past Results and Future Directions in Urban Community Gardens Research. Urban For. Urban Green. 2012, 11, 364–373. [Google Scholar] [CrossRef]
- Litt, J.; Soobader, M.-J.; Turbin, M.S.; Hale, J.W.; Buchenau, M.; Marshall, J.A. The Influence of Social Involvement, Neighborhood Aesthetics, and Community Garden Participation on Fruit and Vegetable Consumption. Am. J. Public Health 2011, 101, 1466–1473. [Google Scholar] [CrossRef]
- Litt, J.S.; Schmiege, S.J.; Hale, J.W.; Buchenau, M.; Sancar, F. Exploring Ecological, Emotional and Social Levers of Self-Rated Health for Urban Gardeners and Non-Gardeners: A Path Analysis. Soc. Sci. Med. 2015, 144, 1–8. [Google Scholar] [CrossRef] [PubMed]
- Soga, M.; Cox, D.T.C.; Yamaura, Y.; Gaston, K.J.; Kurisu, K.; Hanaki, K. Health Benefits of Urban Allotment Gardening: Improved Physical and Psychological Well-Being and Social Integration. Int. J. Environ. Res. Public Health 2017, 14, 71. [Google Scholar] [CrossRef] [PubMed]
- Barton, J.; Pretty, J. What Is the Best Dose of Nature and Green Exercise for Improving Mental Health? A Multi-Study Analysis. Environ. Sci. Technol. 2010, 44, 3947–3955. [Google Scholar] [CrossRef]
- Harada, K.; Hino, K.; Iida, A.; Yamazaki, T.; Usui, H.; Asami, Y.; Yokohari, M. How Does Urban Farming Benefit Participants’ Health? A Case Study of Allotments and Experience Farms in Tokyo. Int. J. Environ. Res. Public Health 2021, 18, 542. [Google Scholar] [CrossRef]
- Spano, G.; D’Este, M.; Giannico, V.; Carrus, G.; Elia, M.; Lafortezza, R.; Panno, A.; Sanesi, G. Are Community Gardening and Horticultural Interventions Beneficial for Psychosocial Well-Being? A Meta-Analysis. Int. J. Environ. Res. Public Health 2020, 17, 3584. [Google Scholar] [CrossRef]
- van den Berg, A.E.; van Winsum-Westra, M.; De Vries, S.; Van Dillen, S.M.E. Allotment Gardening and Health: A Comparative Survey among Allotment Gardeners and Their Neighbors without an Allotment. Environ. Heal. 2010, 9, 74. [Google Scholar] [CrossRef]
- FAO. Sustainability Assessment of Food and Agriculture Systems (SAFA) Tool User Manual Version (Version 2.2.40); FAO: Rome, Italy, 2014. [Google Scholar]
- Lebacq, T.; Baret, P.V.; Stilmant, D. Sustainability Indicators for Livestock Farming. A Review. Agron. Sustain. Dev. 2013, 33, 311–327. [Google Scholar] [CrossRef]
- Meul, M.; Van Passel, S.; Nevens, F.; Dessein, J.; Rogge, E.; Mulier, A.; Van Hauwermeiren, A. MOTIFS: A Monitoring Tool for Integrated Farm Sustainability. Agron. Sustain. Dev. 2008, 28, 321–332. [Google Scholar] [CrossRef]
- Bacon, C.M.; Getz, C.; Kraus, S.; Montenegro, M.; Holland, K. The Social Dimensions of Sustainability and Change in Diversified Farming Systems. Ecol. Soc. 2012, 17, 41. [Google Scholar] [CrossRef]
- Van Calker, K.J.; Berentsen, P.B.M.; Giesen, G.W.J.; Huirne, R.B.M. Identifying and Ranking Attributes That Determine Sustainability in Dutch Dairy Farming. Agric. Hum. Values 2005, 22, 53–63. [Google Scholar] [CrossRef]
- Gómez-Limón, J.A.; Sanchez-Fernandez, G. Empirical Evaluation of Agricultural Sustainability Using Composite Indicators. Ecol. Econ. 2010, 69, 1062–1075. [Google Scholar] [CrossRef]
- Hani, F.; Braga, F.S.; Stampfli, A.; Keller, T.; Fischer, M.; Porsche, H. RISE, a Tool for Holistic Sustainability Assessment at the Farm Level. Int. Food Agribus. Manag. Rev. 2003, 6, 78–90. [Google Scholar] [CrossRef]
- Ripoll-Bosch, R.; Díez-Unquera, B.; Ruiz, R.; Villalba, D.; Molina, E.; Joy, M.; Olaizola, A.; Bernués, A. An Integrated Sustainability Assessment of Mediterranean Sheep Farms with Different Degrees of Intensification. Agric. Syst. 2012, 105, 46–56. [Google Scholar] [CrossRef]
- Sustainability Accounting Standards Board (SASB). Agricultural Products Sustainability Accounting Standard; Sustainability Accounting Standards Board (SASB): San Francisco, CA, USA, 2018; Available online: https://sasb.org/standards/download/ (accessed on 6 January 2023).
- GRI standards. GRI 13: Agriculture, Aquaculture and Fishing Sectors; GRI standards: Amsterdam, The Netherlands, 2022; Available online: https://www.globalreporting.org/search/?query=GRI+13 (accessed on 6 January 2023).
- Zasada, I. Multifunctional Peri-Urban Agriculture—A Review of Societal Demands and the Provision of Goods and Services by Farming. Land Use Policy 2011, 28, 639–648. [Google Scholar] [CrossRef]
- Kurita, H.; Yokohari, M.; Bolthouse, J. The Potential of Intra-Regional Supply and Demand of Agricultural Products in an Urban Fringe Area: A Case Study of the Kanto Plain, Japan. Geogr. Tidsskr. J. Geogr. 2009, 109, 147–159. [Google Scholar] [CrossRef]
- Yokohari, M.; Amati, M.; Bolthouse, J.; Kurita, H. Restoring Urban Fringe Landscapes through Urban Agriculture: The Japanese Experience. Disp Plan. Rev. 2010, 46, 51–59. [Google Scholar] [CrossRef]
- Yoshida, S. Effects of Urbanization on Farmland Size and Diversified Farm Activities in Japan: An Analysis Based on the Land Parcel Database. Land 2020, 9, 315. [Google Scholar] [CrossRef]
- Li, W.; Wang, D.; Li, Y.; Zhu, Y.; Wang, J.; Ma, J. A Multi-Faceted, Location-Specific Assessment of Land Degradation Threats to Peri-Urban Agriculture at a Traditional Grain Base in Northeastern China. J. Environ. Manag. 2020, 271, 111000. [Google Scholar] [CrossRef] [PubMed]
- Xu, W.; Jin, X.; Liu, J.; Zhou, Y. Analysis of Influencing Factors of Cultivated Land Fragmentation Based on Hierarchical Linear Model: A Case Study of Jiangsu Province, China. Land Use Policy 2021, 101, 105119. [Google Scholar] [CrossRef]
- Lange, A.; Piorr, A.; Siebert, R.; Zasada, I. Spatial Differentiation of Farm Diversification: How Rural Attractiveness and Vicinity to Cities Determine Farm Households’ Response to the CAP. Land Use Policy 2013, 31, 136–144. [Google Scholar] [CrossRef]
- Pölling, B.; Mergenthaler, M. The Location Matters: Determinants for “Deepening” and “Broadening” Diversification Strategies in Ruhr Metropolis’ Urban Farming. Sustainability 2017, 9, 1168. [Google Scholar] [CrossRef]
- Boncinelli, F.; Bartolini, F.; Casini, L. Structural Factors of Labour Allocation for Farm Diversification Activities. Land Use Policy 2018, 71, 204–212. [Google Scholar] [CrossRef]
- Ilbery, B.W. Farm Diversification as an Adjustment Strategy on the Urban Fringe of the West Midlands. J. Rural Stud. 1991, 7, 207–218. [Google Scholar] [CrossRef]
- Sinclair, R. Von Thünen and Urban Sprawl. Ann. Assoc. Am. Geogr. 1967, 57, 72–87. [Google Scholar] [CrossRef]
- Chen, Y.-H.; Lee, C.-L.; Chen, G.-R.; Wang, C.-H.; Chen, Y.-H. Factors Causing Farmland Price-Value Distortion and Their Implications for Peri-Urban Growth Management. Sustainability 2018, 10, 2701. [Google Scholar] [CrossRef]
- Delbecq, B.A.; Kuethe, T.H.; Borchers, A.M. Identifying the Extent of the Urban Fringe and Its Impact on Agricultural Land Values. Land Econ. 2014, 90, 587–600. [Google Scholar] [CrossRef]
- Bryant, C.R.; Johnston, T.R.R. Agriculture in the City’s Countryside; Belhaven Press: London, UK, 1992. [Google Scholar]
- Duvernoy, I.; Zambon, I.; Sateriano, A.; Salvati, L. Pictures from the Other Side of the Fringe: Urban Growth and Peri-Urban Agriculture in a Post-Industrial City (Toulouse, France). J. Rural Stud. 2018, 57, 25–35. [Google Scholar] [CrossRef]
- Sanyé-Mengual, E.; Specht, K.; Krikser, T.; Vanni, C.; Pennisi, G.; Orsini, F.; Gianquinto, G.P. Social Acceptance and Perceived Ecosystem Services of Urban Agriculture in Southern Europe: The Case of Bologna, Italy. PLoS ONE 2018, 13, e0200993. [Google Scholar] [CrossRef] [PubMed]
- Sharp, J.S.; Smith, M.B. Social Capital and Farming at the Rural--Urban Interface: The Importance of Nonfarmer and Farmer Relations. Agric. Syst. 2003, 76, 913–927. [Google Scholar] [CrossRef]
- Sroka, W.; Bojarszczuk, J.; Satoła, Ł.; Szczepańska, B.; Sulewski, P.; Lisek, S.; Luty, L.; Zioło, M. Understanding Residents’ Acceptance of Professional Urban and Peri-Urban Farming: A Socio-Economic Study in Polish Metropolitan Areas. Land Use Policy 2021, 109, 105599. [Google Scholar] [CrossRef]
- Yoshida, S.; Yagi, H. Long-Term Development of Urban Agriculture: Resilience and Sustainability of Farmers Facing the Covid-19 Pandemic in Japan. Sustainability 2021, 13, 4316. [Google Scholar] [CrossRef]
- El Ghoul, S.; Guedhami, O.; Wang, H.; Kwok, C.C.Y. Family Control and Corporate Social Responsibility. J. Bank. Financ. 2016, 73, 131–146. [Google Scholar] [CrossRef]
- Hull, C.E.; Rothenberg, S. Firm Performance: The Interactions of Corporate Social Performance with Innovation and Industry Differentiation. Strateg. Manag. J. 2008, 29, 781–789. [Google Scholar] [CrossRef]
- Russo, M.V.; Fouts, P.A. A Resource-Based Perspective on Corporate Environmental Performance and Profitability. Acad. Manag. J. 1997, 40, 534–559. [Google Scholar] [CrossRef]
- Dyer, W.G., Jr.; Whetten, D.A. Family Firms and Social Responsibility: Preliminary Evidence from the S&P 500. Entrep. Theory Pract. 2006, 30, 785–802. [Google Scholar] [CrossRef]
- Jones, S.; Wright, C. Fashion or Future: Does Creating Shared Value Pay? Account. Financ. 2018, 58, 1111–1139. [Google Scholar] [CrossRef]
- Lerner, L.D.; Fryxell, G.E. An Empirical Study of the Predictors of Corporate Social Performance: A Multi-Dimensional Analysis. J. Bus. Ethics 1988, 7, 951–959. [Google Scholar]
- Waddock, S.A.; Graves, S.B. The Corporate Social Performance—Financial Performance Link. Strateg. Manag. J. 1997, 18, 303–319. [Google Scholar] [CrossRef]
- Brammer, S.J.; Pavelin, S. Corporate Reputation and Social Performance: The Importance of Fit. J. Manag. Stud. 2006, 43, 435–455. [Google Scholar] [CrossRef]
- Pérez, S.; Fernández-Salinero, S.; Topa, G. Sustainability in Organizations: Perceptions of Corporate Social Responsibility and Spanish Employees’ Attitudes and Behaviors. Sustainability 2018, 10, 3423. [Google Scholar] [CrossRef]
- Saeidi, S.P.; Sofian, S.; Saeidi, P.; Saeidi, S.P.; Saaeidi, S.A. How Does Corporate Social Responsibility Contribute to Firm Financial Performance? The Mediating Role of Competitive Advantage, Reputation, and Customer Satisfaction. J. Bus. Res. 2015, 68, 341–350. [Google Scholar] [CrossRef]
- Surroca, J.; Tribó, J.A.; Waddock, S. Corporate Responsibility and Financial Performance: The Role of Intangible Resources. Strateg. Manag. J. 2010, 31, 463–490. [Google Scholar] [CrossRef]
- Li, L.; Li, G.; Tsai, F.-S.; Lee, H.-Y.; Lee, C.-H. The Effects of Corporate Social Responsibility on Service Innovation Performance: The Role of Dynamic Capability for Sustainability. Sustainability 2019, 11, 2739. [Google Scholar] [CrossRef]
- Sharma, S.; Vredenburg, H. Proactive Corporate Environmental Strategy and the Development of Competitively Valuable Organizational Capabilities. Strateg. Manag. J. 1998, 19, 729–753. [Google Scholar] [CrossRef]
- Sharma, P.; Sharma, S. Drivers of Proactive Environmental Strategy in Family Firms. Bus. Ethics Q. 2011, 21, 309–334. [Google Scholar] [CrossRef]
- Brown, M.E.; Treviño, L.K. Ethical Leadership: A Review and Future Directions. Leadersh. Q. 2006, 17, 595–616. [Google Scholar] [CrossRef]
- Grant, A.M. Does Intrinsic Motivation Fuel the Prosocial Fire? Motivational Synergy in Predicting Persistence, Performance, and Productivity. J. Appl. Psychol. 2008, 93, 48. [Google Scholar] [CrossRef]
- Porter, M.E. Competitive Advantage: Creating and Sustaining Superior Performance. N. Y. Free. 1985, 43, 214. [Google Scholar] [CrossRef]
- Dornier, R.; Selmi, N.; Delécolle, T. Strategic Groups Structure, Positioning of the Firm and Performance: A Review of Literature. Int. Bus. Res. 2012, 5, 27. [Google Scholar] [CrossRef]
- Ketchen, D.J., Jr.; Combs, J.G.; Russell, C.J.; Shook, C.; Dean, M.A.; Runge, J.; Lohrke, F.T.; Naumann, S.E.; Haptonstahl, D.E.; Baker, R.; et al. Organizational Configurations and Performance: A Meta-Analysis. Acad. Manag. J. 1997, 40, 223–240. [Google Scholar] [CrossRef]
- Leask, G.; Parker, D. Strategic Groups, Competitive Groups and Performance within the UK Pharmaceutical Industry: Improving Our Understanding of the Competitive Process. Strateg. Manag. J. 2007, 28, 723–745. [Google Scholar] [CrossRef]
- Short, J.C.; Ketchen, D.J.; Palmer, T.B.; Hult, G.T.M. Firm, Strategic Group, and Industry Influences on Performance. Strateg. Manag. J. 2007, 28, 147–167. [Google Scholar] [CrossRef]
- Tibshirani, R.; Walther, G.; Hastie, T. Estimating the Number of Clusters in a Data Set via the Gap Statistic. J. R. Stat. Soc. Ser. B Stat. Methodol. 2001, 63, 411–423. [Google Scholar] [CrossRef]
- Hansson, H. Strategy Factors as Drivers and Restraints on Dairy Farm Performance: Evidence from Sweden. Agric. Syst. 2007, 94, 726–737. [Google Scholar] [CrossRef]
- Yoshida, S.; Yagi, H. Lease and Usage Conditions of Productive Green Land by Urban Farms. J. Rural Plan. Stud. 2022, 2, 44–53. [Google Scholar] [CrossRef]

Disclaimer/Publisher’s Note: The statements, opinions and data contained in all publications are solely those of the individual author(s) and contributor(s) and not of MDPI and/or the editor(s). MDPI and/or the editor(s) disclaim responsibility for any injury to people or property resulting from any ideas, methods, instructions or products referred to in the content. |
© 2023 by the authors. Licensee MDPI, Basel, Switzerland. This article is an open access article distributed under the terms and conditions of the Creative Commons Attribution (CC BY) license (https://creativecommons.org/licenses/by/4.0/).