Article

Resource Utilization Potential of Red Mud: A Study on the Micro-Mechanism of the Synergistic Effect of Multiple Solid Waste Filling Materials

School of Mining Engineering, Taiyuan University of Technology, Taiyuan 030024, China
*
Authors to whom correspondence should be addressed.
Sustainability 2023, 15(21), 15532; https://doi.org/10.3390/su152115532
Submission received: 4 October 2023 / Revised: 27 October 2023 / Accepted: 30 October 2023 / Published: 1 November 2023
(This article belongs to the Section Waste and Recycling)

Abstract

:
Red mud (RM) is a common industrial byproduct that is characterized by high alkalinity, high pollution, and difficult utilization. In this paper, gangue (CG), flue gas desulfurization gypsum (FGD), and silicate cement (PC) were used to assist red mud in the preparation of red mud-based composite filler material (RMC), aiming at the large-scale resource utilization of RM. The effects of the mass ratio of RM/CG, the mass ratio of FGD/(RM + CG), and the water–solid ratio (WCR) on the multi-angle properties of RMC were investigated and the optimal ratios were determined. The results showed that the RM/CG was 7:1, FGD/(RM + CG) was 4%, and WCR was 0.51 (RMC8), and the system could increase the RM content to 70%. The microstructural analysis of RMC using a specific surface area and porosity analyzer (BET), X-ray diffractometer (XRD), and scanning electron microscope (SEM) showed that its hydration products could remodel the pore structure, encapsulate and cement the coarse and fine particles into a dense matrix, and play a certain alkali reduction role, which revealed the microscopic synergistic mechanism between multiple solid wastes. The study shows that the comprehensive disposal of RM reduces the pollution released into the environment and provides new ideas for the green development of mines.

1. Introduction

RM is a solid industrial waste discharged in large quantities by alumina plants after treating bauxite with alkali to extract alumina. For every 1 t of alumina produced, about 0.8 to 1.5 t of RM is discharged [1]. At present, the world’s alumina is mainly produced through the Bayer method, accounting for more than 90% of the production, which has led to the global stock of RM reaching 4.6 billion tons, and China’s alumina production accounted for about 55% of the global production. With the development of the economy, since 2017, China’s annual RM production has exceeded 100 million tons, and RM has long been one of the bulk solid wastes in China’s industrial production [2,3]. RM is characterized by low activity and high alkalinity and is difficult to be used directly. At the same time, red mud contains As, Cd, Cr, Pb, and other toxic heavy metals. If it is not handled properly, when it meets water, the toxic heavy-metal elements can easily leach out and cause serious pollution to the ecological environment (especially water bodies) [4]. However, at present, our country’s treatment of RM is mainly based on stockpiling. However, stockpiling not only occupies a lot of land, but also seriously pollutes the land and water. Therefore, the reasonable treatment of RM is a great challenge, and it is urgent to pay attention to the comprehensive treatment of RM [5]. We can consider turning RM into a treasure and utilizing it as a potential resource treatment.
China is a major consumer and producer of coal resources; 95% of its total coal production comes from underground mining [6]. However, large mining goaf is generated in underground mining, which can cause significant damage to the surface, groundwater and surface water loss, and pollution both to buildings and the environment. This has become a serious issue that cannot be ignored for the country’s economy and people’s livelihoods [7,8,9]. Fill mining is an effective roof control technology that can prevent surface subsidence from the source and obtain coal resources with minimum ecological damage [10]. However, the lack of filling materials and high cost are important reasons that have hindered the popularization and application of coal mine filling mining technology in China. Developing new cheap and high-performance composite filling materials using existing large-scale red mud can not only solve the problem of bulk solid waste treatment but also promote the safe and green production of coal mines [11].
Through a statistical analysis of a large amount of the relevant literature on red mud, it was found that the utilization of red mud in China is mainly concentrated in three areas [12]: material preparation in the construction and chemical industries [13,14,15,16,17,18,19], environmental governance [20,21,22,23,24], and metal recovery in metallurgical fields [25,26,27,28,29,30,31,32]. Although RM has been widely used in these fields, its utilization rate is very low. Until now, many researchers have made effective research progress in the extensive utilization of RM. Zhang et al. studied the replacement of fillers in building materials with RM waste and found that the addition of a suitable amount of RM solid waste improved the stiffness and elasticity of asphalt mortar [33]. Wang et al. used solid wastes such as fly ash, RM, blast furnace slag, and FGD as reaction materials, and utilized alkali and sulfate materials in the composite system to stimulate the activity of the silicate minerals to prepare ecological slope protection materials [34]. Zhang et al. studied the preparation of geopolymers from industrial solid waste RM and other solid wastes, and the results showed that it has a good prospect in road construction [35]. Chen et al. utilized the alkaline environment of RM and cement to stimulate the pozzolanic activity of fly ash, resulting in a filling material that can be used not only for mine filling but also to solve the problem of large-scale industrial solid waste disposal [36]. Ye et al. synthesized a single-component geopolymer using hot alkali-modified Bayer RM and silica and found that the prepared geopolymer had a more stable structure [37]. Wang et al. explored the possibility of improving the reuse ability of Bayer RM using fly ash and cement as raw materials to prepare mine filling materials and expanded the potential of resource utilization of solid waste RM [38].
However, all of the above studies have the problem of low utilization of RM, so in this study, we prepared a filling material with 50–80% RM content, which has the advantages of high performance, low cost, and environmental friendliness. A three-factor, four-level orthogonal test with the mass rate of RM/CG, the mass rate of FGD/(RM + CG), and WSR was designed to analyze the RMC prepared from RM and CG, PC, and FGD with different levels of particle sizes, to test and analyze the compressive properties of the RMC and to study the synergistic effect and the activation mechanism. This work is expected to solve the problem of pollution caused by solid waste accumulation, provide theoretical guidance for the application of RM in the preparation of composite filling materials for mines, and also promote the sustainable development of green mines.

2. Materials and Methods
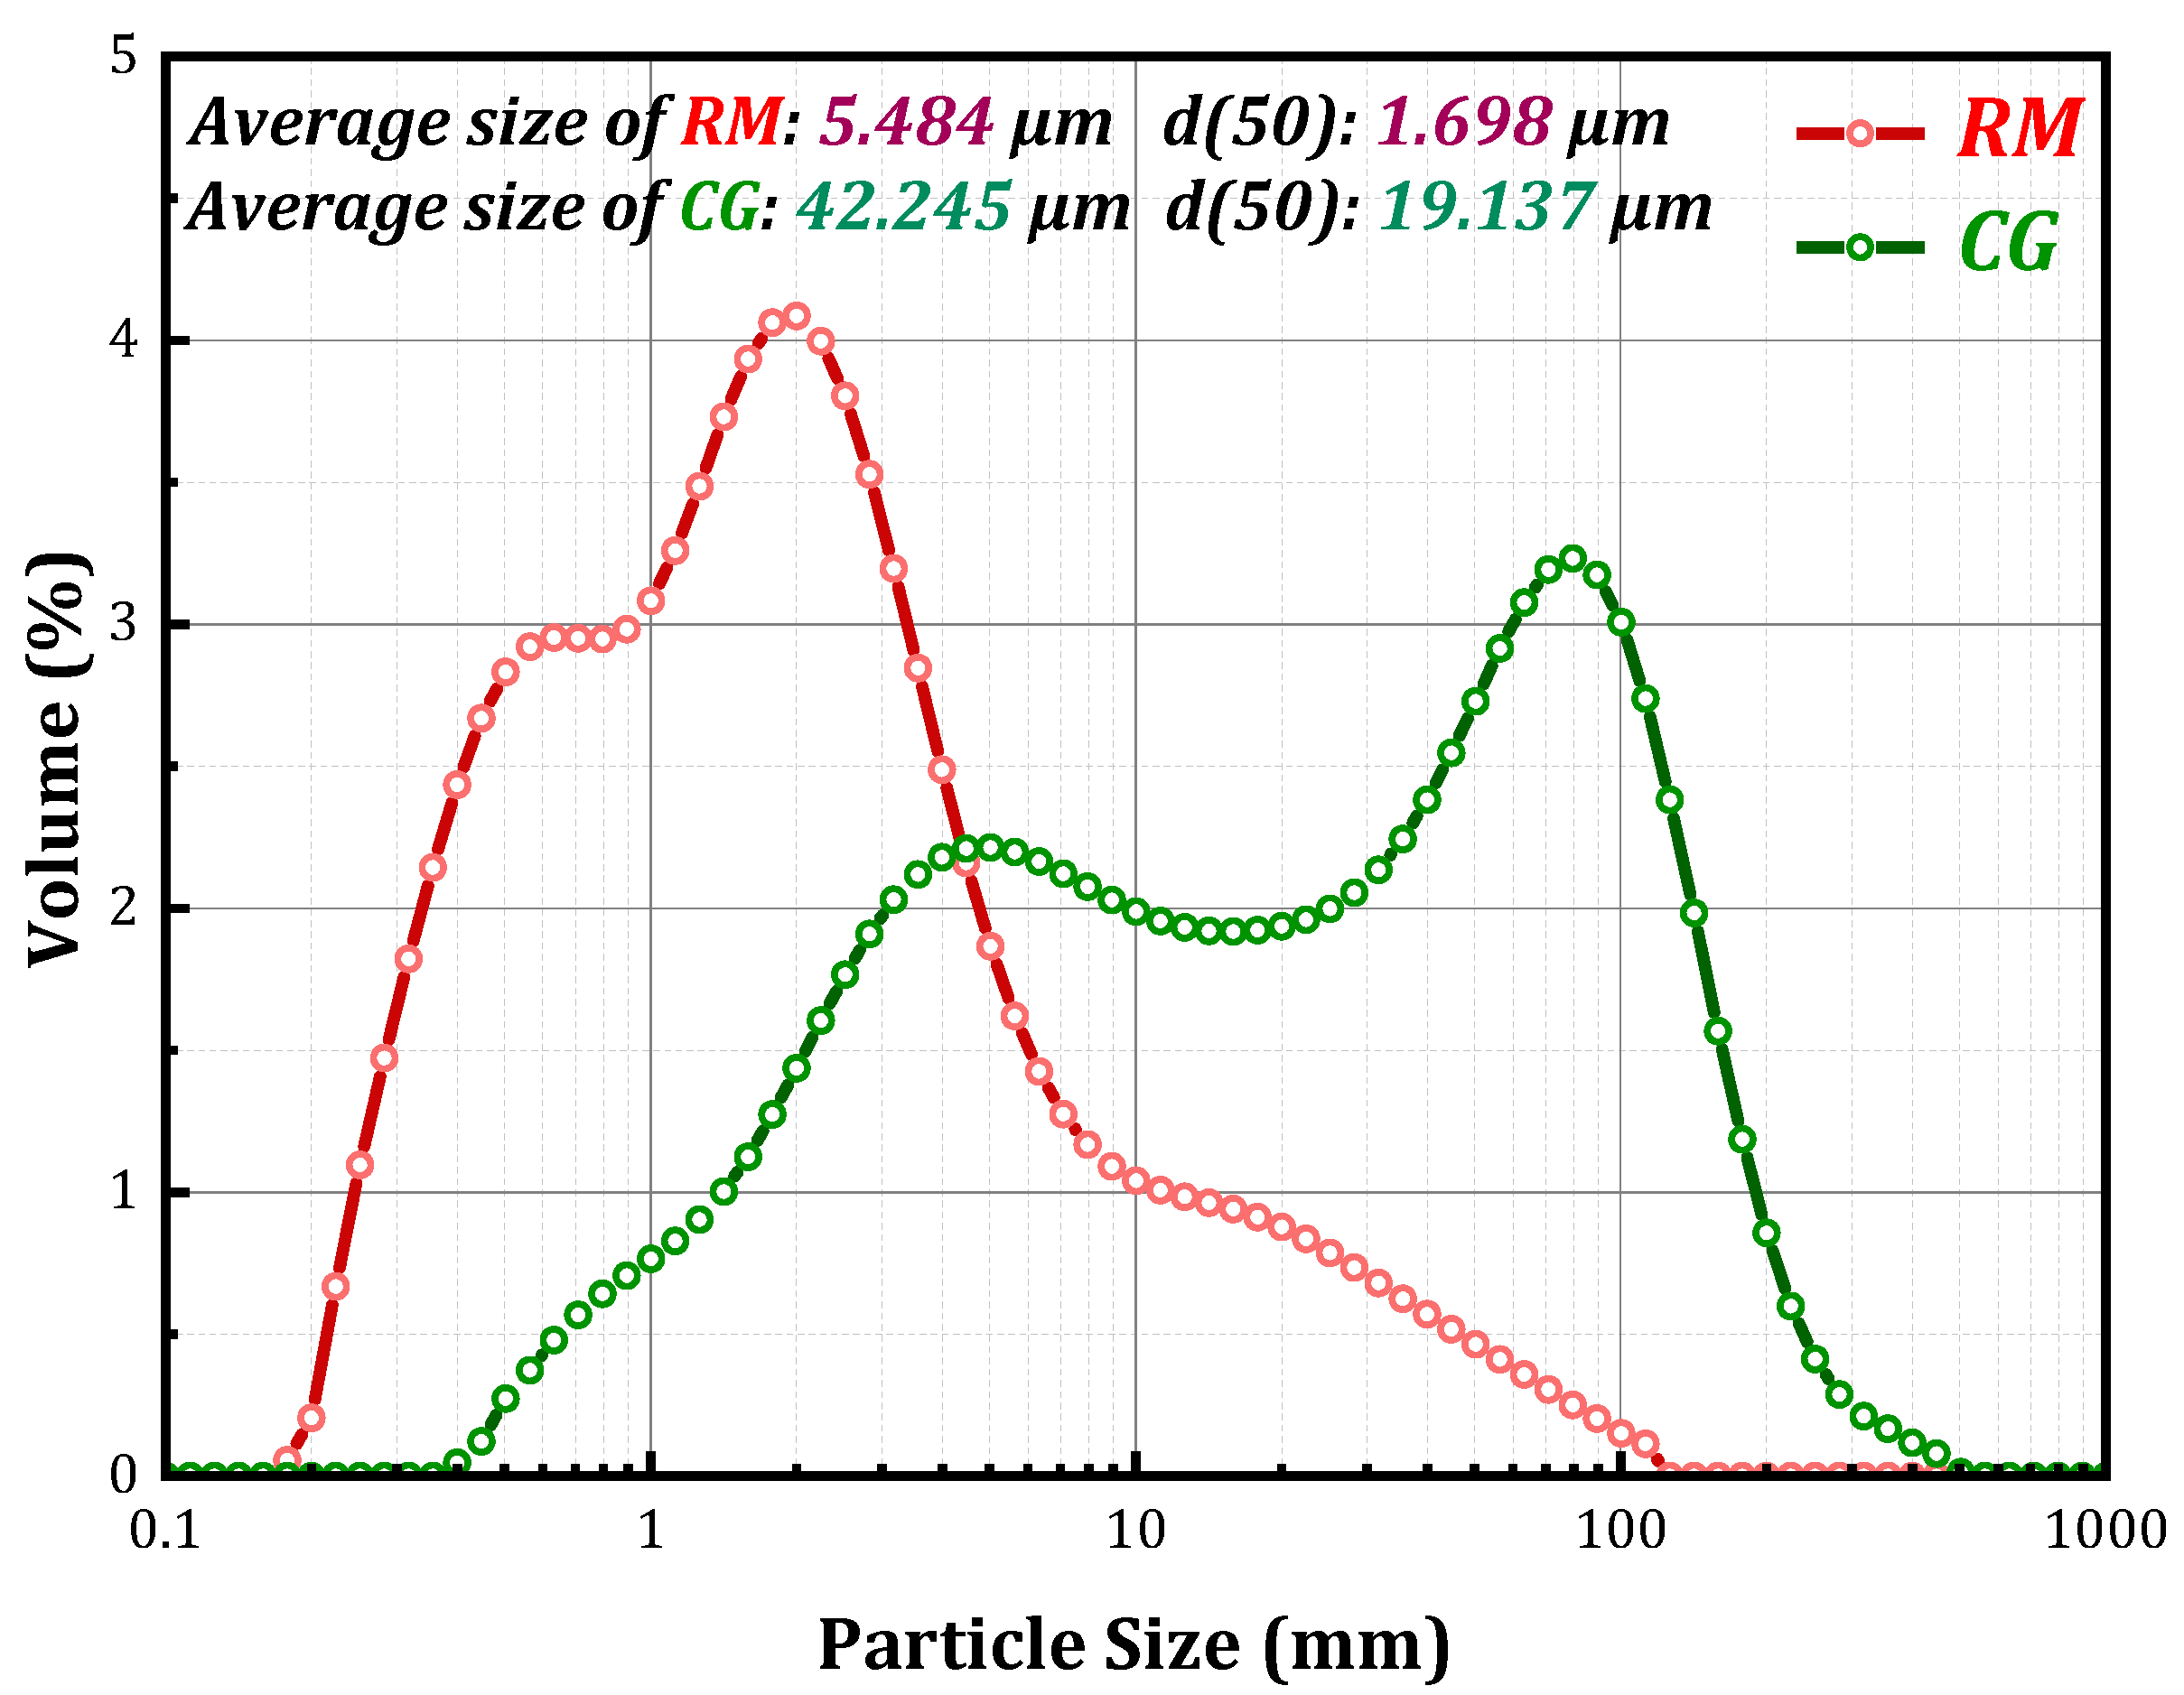
2.1. Materials

Experimental materials mainly consisted of RM, CG, FGD, and PC. Their chemical composition was analyzed with X-ray fluorescence (XRF) using a PANalytical Axios sequential X-ray fluorescence spectrometer made in the Netherlands (presented in Table 1). RM was obtained from the Shandong Xinfa Group Aluminum Factory and the main components were Fe2O3, Al2O3, SiO2, Na2O, and TiO2, accounting for 97.83% of the total mass fraction. Coal gangue was divided into coal gangue powder (CGP) and coal gangue granules (CGG). CGP was purchased from Hebei Lingshou County Jixi Mineral Products Co., Ltd. (Shijiazhuang, China), with SiO2 and Al2O3 as the main components, accounting for 83.35% of the total mass fraction. CGG was selected from a coal mine in Shanxi Province, and two types of CGG with particle sizes of 5-10mm (CGG1) and 10–15 mm (CGG2) were screened using a graded sieve as the coarse aggregate. FGD was taken from Hebei Shengyun Mining, and CaO and SO3 accounted for 99.83% of the total mass fraction, with the rest present as trace elements accounting for less than 0.2%. The PC was 42.5 ordinary silicate cement commonly found in the market, and the main components, CaO and SiO2, accounted for 84.92% of its composition, providing a large amount of calcium and silicon for the reaction. The water used in the experiment was tap water. As shown in Table 1, the RM and CG were enriched with cementitious agents such as SiO2 and Al2O3, and FGD was enriched with large amounts of CaO and SO3, whereas the cement was enriched with large amounts of CaO. Mineralogically, the main phases of the RM were hematite, zoisite, calcite, hydrogrossular, gibbsite, and calcite, while quartzite and calcium feldspar were the phases of CG. The FGD phase was dehydrated calcium sulfate while the phases of cement were tricalcium silicate and dicalcium silicate. The mineral phases of RM, CG, FGD, and PC were analyzed using XRD (Panalytical Empyrean, Almelo, The Netherlands), and their XRD patterns are shown in Figure 1.
The particle size distribution of RM and CGP was tested using a Malvern Mastersizer 2000 Laser particle analyzer (LPA) that is manufactured by Malvern Instruments Ltd of Malvern City, UK,, with a range of particle sizes from 0.02 to 2000 μm. As shown in Figure 2, the average particle size of the RM was 5.484 μm, and the median diameter d (50) was 1.698 μm. The average particle size of the CGP was 42.245 μm and the median diameter d (50) was 19.137 μm.

2.2. Orthogonal Experimental Design

Orthogonal experimental design is a commonly used method for studying and processing multifactor experiments. It can select representative experimental plans from a large number of trial plans, and the selected plans are evenly distributed throughout the entire range. Through the analysis of the results of these trial plans, the optimal plan can be inferred, making it an efficient and cost-effective scientific research method [39].
Based on the characteristics of the filling materials in this study, a three-factor, four-level test, orthogonal table L16(43), was designed with MINITAB (Minitab 21). The three factors in this experiment were the mass rate of RM/CG (X1), the mass rate of FGD/(RM + CG) (X2), and WSR (X3), and the two constants were the constant PC/(RM + CG) (C1) and the fixed CGP/CGG1/CGG2 (C2), the corresponding values of that are shown in Table 2. A total of 16 sets of protocols were used for the experiment.
The intuitive analysis method is commonly used for analyzing the results of orthogonal experiments. In this study, range analysis is used, where the range is the difference between the extreme values of the data. By judging the size of the range, the primary and secondary influencing factors can be determined. The larger the range, the greater the influence of the factor. The calculation process is shown in the equation [40,41] below.
  k n = K n / 4 n = 1 ,   2 ,   3 ,   4
R B = max k 1 , k 2 , k 3 , k 4 ; R S = min k 1 , k 2 , k 3 , k 4
R = R B R S
In Equation (1), Kn and kn represent the sum and average of the experimental results at each level of factor X, respectively. In Equation (3), R represents the extreme values of factor X at each level. A larger extreme value R indicates that the influence degree of factor X is greater.

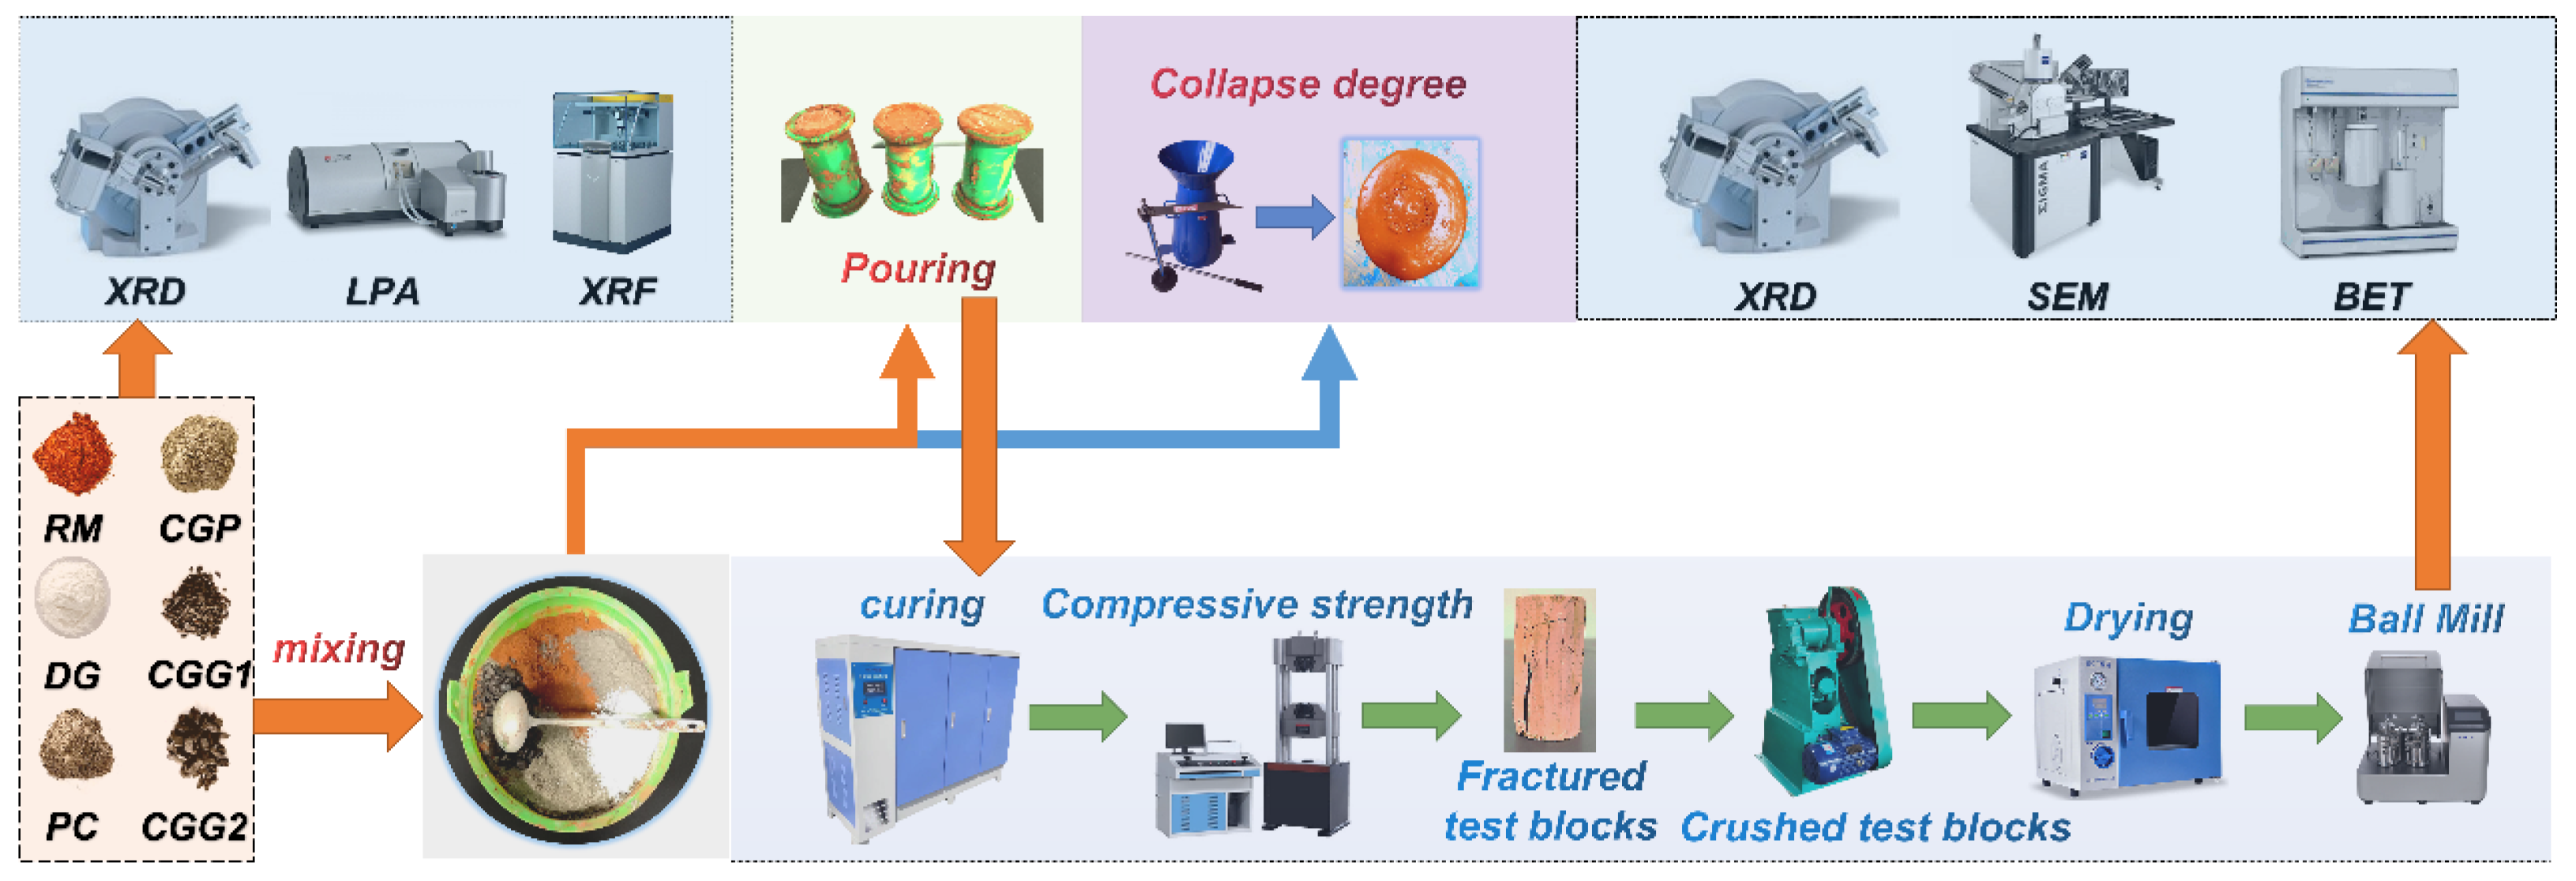
2.3. Experimental Procedure

First, according to the parameter combinations in the orthogonal Table 2, each component of RM, CG, FGD, and PC was proportionally mixed and stirred by weighing it with an electronic balance (YP-6002; Tianjin Tianma Hengji Instrument Co., Ltd., Tianjin, China) to form the dry material of RMC, and then made into RMC by mixing and stirring it in accordance with the corresponding WSR. Then, the RMC was tested for its fluidity and setting time, and the standard specimens were prepared for the uniaxial compressive strength test after curing in a curing box for a specified time. Then, standard specimens were prepared for the uniaxial compressive strength test after curing in a curing box for a specified period of time. According to the test results of the first two stages, four groups of specimens with better results were preferably selected, and the center parts of the specimens after uniaxial compression at different ages were taken and crushed using a jaw crusher (EP-2; Hebi Innovative Instrumentation Co., Ltd., Hebi, China). Third, the crushed material was placed in an electric digital-display blast-drying oven (101-2A; Hebi City Innovative Instrumentation Co., Ltd.) and dried at 80 °C for 24 h. The dried, crushed specimens were put into a planetary ball mill with a stainless-steel grinding jar (YXQM-4L; Changsha Miqi Instrument and Equipment Co., Ltd., Changsha, China) and run at 500 rpm for 10 min. Finally, the samples that passed the 200-mesh sieve were selected for XRD, SEM, and BET tests and micro-mechanism studies. The specific experimental flow chart is shown in Figure 3.

2.4. Experimental Methods

2.4.1. Flow and Setting Time Tests

First, the collapse cylinder (top diameter 100 mm, bottom diameter 200 mm, height 300 mm, wall thickness no less than 1.5 mm) was placed on solid (non-absorbent), horizontal ground. Then, stepping on both sides of the foot pedal, the RMC was introduced into the cylinder. During loading, the cylinder is kept in a fixed position and a stick is used for insertion and tapping when the composite is loaded every third of its height until it is full. After filling, we smoothed the top of the cylinder with a small shovel and removed the composite filling material on the bottom plate on the cylinder side. Finally, we lifted off the slump cylinder vertically within 3–5 s and measured the height difference between the simple height and the highest point of the composite cemented test body after slumping, which is the value of the collapse degree. The whole process from the beginning of loading to lifting the slump cylinder away was carried out without interruption and was completed within 150 s [42]. We measured the two diameters of the expansion surface perpendicular to each other after the termination of the RMC expansion and took the average value, that is, the value of the degree of expansion, and recorded the RMC’s initial setting time and final setting time (ZKS-100 coagulation time tester).

2.4.2. Uniaxial Compressive Strength Test

RMC was poured into the standard specimen mold (50 mm × 100 mm) and fixed on the vibration table for molding; 9 specimens were made for each group and demolded after 24 h. They were then numbered and placed in the curing box (YH-60B; Beijing CCCC Jianyi Science and Technology Development Co., Ltd., Beijing, China) and cured at 95% humidity and 22 °C. The curing time was 3 d, 7 d, and 28 d, respectively. We used the DKDW-10D microcomputer-controlled electronic universal testing machine for the uniaxial compressive strength test, taking the average value of 3 specimens of each age as the final strength.

2.4.3. Microstructure Characterization

The mineral phases of the 3 d, 7 d, and 28 d old samples were analyzed using X-ray diffraction (Panalytical Empyrean, Almelo, The Netherlands). Cu Kα was used as the X-ray source, and the samples were scanned from 5 to 90° at a speed of 2°/min over a scanning range of 2θ. Meanwhile, the samples prepared has ethanol dispersion were metallized under vacuum and photographed for micro-morphology using a scanning electron microscope (ZEISS Sigma 300, Oberkocken, Germany) at an accelerating voltage of 3 KV. The Quantachrome Nova 4000e (Boynton Beach, FL, USA) from the United States was used to degas the samples at a 120 °C degassing temperature for 6h, and N2 adsorption was used to test the specific surface area and pore size distribution of the samples at the age of 28 d, and to analyze the effects of pore size, porosity, pore size distribution, and other factors on the compressive strength and durability.

3. Results and Discussion

3.1. Flow and Setting Time Analysis

Flowability is an indicator of the ease of transporting fill materials in pipeline construction. The thinner the slurry, the greater the fluidity and the higher the water bleeding rate, but a too-thin slurry cannot effectively connect to the roof during filling. The thicker the slurry, the worse the fluidity, and the poor pumpability of the slurry makes it difficult to transport and prone to pipe blockage [43]. Slump and extension are some of the main methods for measuring the fluidity of slurry, which can directly reflect the cohesion and frictional resistance of the composite filling materials [44,45]. The results of the slump and extension tests for this RMC are shown in the orthogonal test results in Table 3. The slump was 12–288 mm and the extension was 109–431 mm. In production practice, the filling material with a slump of between 160 mm and 250 mm has good pumpability in the transportation pipeline [46]. By performing extreme value analysis on the above test results, the impact of each factor on the test indicators can be visually reflected. The analysis of the extreme values of slump and spreading degree is shown in Table 4. The maximum difference in the slump value of X1(RM/CG) was 151, indicating that factor X1 (RM/CG) had the greatest impact on the slump of the filling material, followed by factor X3 (WSR) and factor X2 FGD/(RM + CG), with extreme values of 67.5 and 55, respectively. Therefore, the order of influence of each factor on the slump of the filling material slurry is RM/CG > WSR > FGD/(RM + CG). The same pattern was observed in the impact of each factor on the degree of extension, with X1 (163.25) > X3 (136.75) > X2 (50). The results of the flowability at each level of the orthogonal test generally showed a trend of increasing first and then decreasing, which may be caused by the mixing of RM and CG. Specifically, RM fine aggregate has the characteristics of a small particle size, large specific surface area, and strong ability to bind to water [47], while large CGG particles, as coarse aggregate, do not participate in the reaction in the hydration system. Therefore, as the mass rate of RM/CG decreases, the increase in coarse aggregate content reduces the water requirement of the composite dry material, resulting in better wetting of the powder material, thereby improving the flowability of the RMC. In addition, under a certain WSR, the slurry bleeding rate increases with the increase in coarse aggregate content, resulting in significant stratification of the filling slurry (the upper slurry flowing and filling, and the lower particles precipitating and remaining), and the overall fluidity deteriorates. Therefore, it can be seen that the addition of CG optimizes the grading of the composite system, improves the rheological properties of the slurry, and reduces the plastic viscosity of the slurry, but the overall rheological properties vary with the change in the mass rate of RM/CG of the composite system [48].
Setting time is the key factor to judge whether the filling material can be normally delivered to the hollow area over medium and long distances. As shown in Table 3, the initial setting time of the RMC was 125–331 min and the final setting time was 234–454 min. The results of the extreme value analysis of the setting time are shown in Table 5. The extreme values of the factors X1, X2, and X3, corresponding to the initial setting time, were 141.25, 49.5, and 10.75, respectively, and the extreme values of the factors X1, X2, and X3, corresponding to final setting time, were 131.25, 70.5, and 22.75, respectively. Therefore, it can be seen that the order of influence of each factor on the initial and final setting time of RMC is RM/CG > FGD/(RM + CG) > WSR. The factor mean curve for each level is shown in Figure 4, with both initial and final setting times increasing as the level values of each factor increase. This is due to the characteristics of fine aggregates such as RM, CGP, and PC, which have large specific surface areas and strong abilities to bind free water. The rate of paste setting increases with the increase in fine aggregate content. Second, it can be seen that the setting time of the RMC increases with the increase in FGD/(RM + CG), which is due to the fact that FGD tends to adhere to the surface of particles during the early hydration reaction process with the product of PC, ettringite crystals, which hinders the progress of the reaction and thus increases the setting time [49,50].

3.2. Analysis of Uniaxial Compression Results

Figure 5 shows the physical drawings of RMC specimens during the curing period and uniaxial compressive test. The compressive strength test results are shown in Figure 6, and the specimens basically showed a pattern of compressive strength enhancement with the increase in the age of curing (3 d, 7 d, and 28 d), but the first group showed that the early compressive strength (7 d: 3.95 MPa) was higher than the final strength (28 d: 3.9 MPa). The reason for this phenomenon may be that the system WSR was the smallest at this level, and all of them are fine aggregates (no incorporation of coarse aggregates), which means that the water content of the system was not sufficient to support the complete hydration reaction. This caused an incomplete reaction or late reaction, terminated due to the lack of reactant (water), which is in line with the results of the level of mobility and the degree of collapse (12 mm). With the increase in the mass rate RM/CG, the uniaxial compressive strength of RMC showed a trend of first increasing and then decreasing. When the ratio of RM/CG was 7:1, the FGD/(RM + CG) was 4%, and the WSR was 0.51 (RMC8), the compressive strength of the test piece was the highest, and the compressive strengths after curing for 3 d, 7 d, and 28 d were 5.35 MPa, 6.91 MPa, and 8.58 MPa, respectively. This is because, with the increase in the proportion of CG, CGG coarse aggregate particles accumulate to form a skeleton to play a supporting role, and other raw materials participate in the hydration reaction as fine aggregates to generate gel to fill the porous structure of CG and the original pores of the composite system, forming a dense structure between the particles and improving the compressive strength of the RMC. This indicates that good grading can reduce porosity, as the failure of the test specimen is related to the grading of the aggregate, and the compressive load is shared by the aggregate and composite paste [51,52]. However, with the increase in the proportion of coarse and fine aggregates, the gel generated by the hydration reaction cannot fully fill the gaps between the particles, resulting in the failure to form close contact between the particles, thus reducing the strength of the composite filling materials. In addition, we found that the final compressive strength of the system with 3–4% FGD was higher than that of the system with 1–2% FGD, which indicates that FGD can stimulate the pozzolanic activity of RM to a certain extent, causing it to produce many C-S-H (hydrated calcium silicate) gels in the hydration process and enhancing the compressive strength of the RMC.
The surface crack propagation of the test piece is shown in Figure 7. Taking RMC8 as an example, when the strength of the test piece is low, the surface of the loaded specimen has a single form of fracture. The failure surface of the 3 d old specimen mainly exhibits a single approximately inclined or two approximately parallel through-going main cracks in the axial direction. The specimen mainly fails due to cleavage and has large cracks. With the increase in the curing time, the test specimens exhibit various forms of damage, with apparent cracks on the surface primarily forming and penetrating in a vertical or nearly vertical direction, then spreading and intersecting in a horizontal direction. The specimens primarily suffer from cleavage failure and shear failure [53]. The number and length of cracks with larger damage states on the surface of the specimen gradually decrease, which may be due to the low degree of the early hydration reaction, the high porosity and low compactness of the specimen, and the rapid loss of the load-bearing capacity and large damage cracks in the uniaxial compression process, based on initial defects such as pores. As the hydration reaction continues, the hydration products fill the original pores of the porous structure and composite system of coal gangue, resulting in a high density of the sample. The synergy between coarse and fine aggregates enhances the compressive bearing capacity of the composite system. With the application of continuous load, the specimen gradually reaches the bearing limit, manifested by the continuous development of surface cracks, which intersect and connect until the specimen completely loses its bearing capacity (compared to the lowest degree of crack shape damage) [54,55]. The remaining groups exhibit similar patterns.

3.3. Microstructure Analysis

When the participating substances in the hydration reaction of the composite system are different, the types of hydration products generated are also different. Therefore, based on the principle of the same materials participating in the proportioning of the composite system, the 16 groups of results from the orthogonal experiment were divided into four categories according to the RM/CG ratios of 8:0, 7:1, 6:2, and 5:3, and the most optimal one for uniaxial compressive strength was selected from each category based on the fluidity and setting time that meet the requirements of mine filling. Then, microscopic structure analysis was conducted on RMC3, RMC8, RMC11, and RMC15 to reveal the micro-synergistic mechanism between multiple solid wastes and clarify the hydration reaction process of RMC.

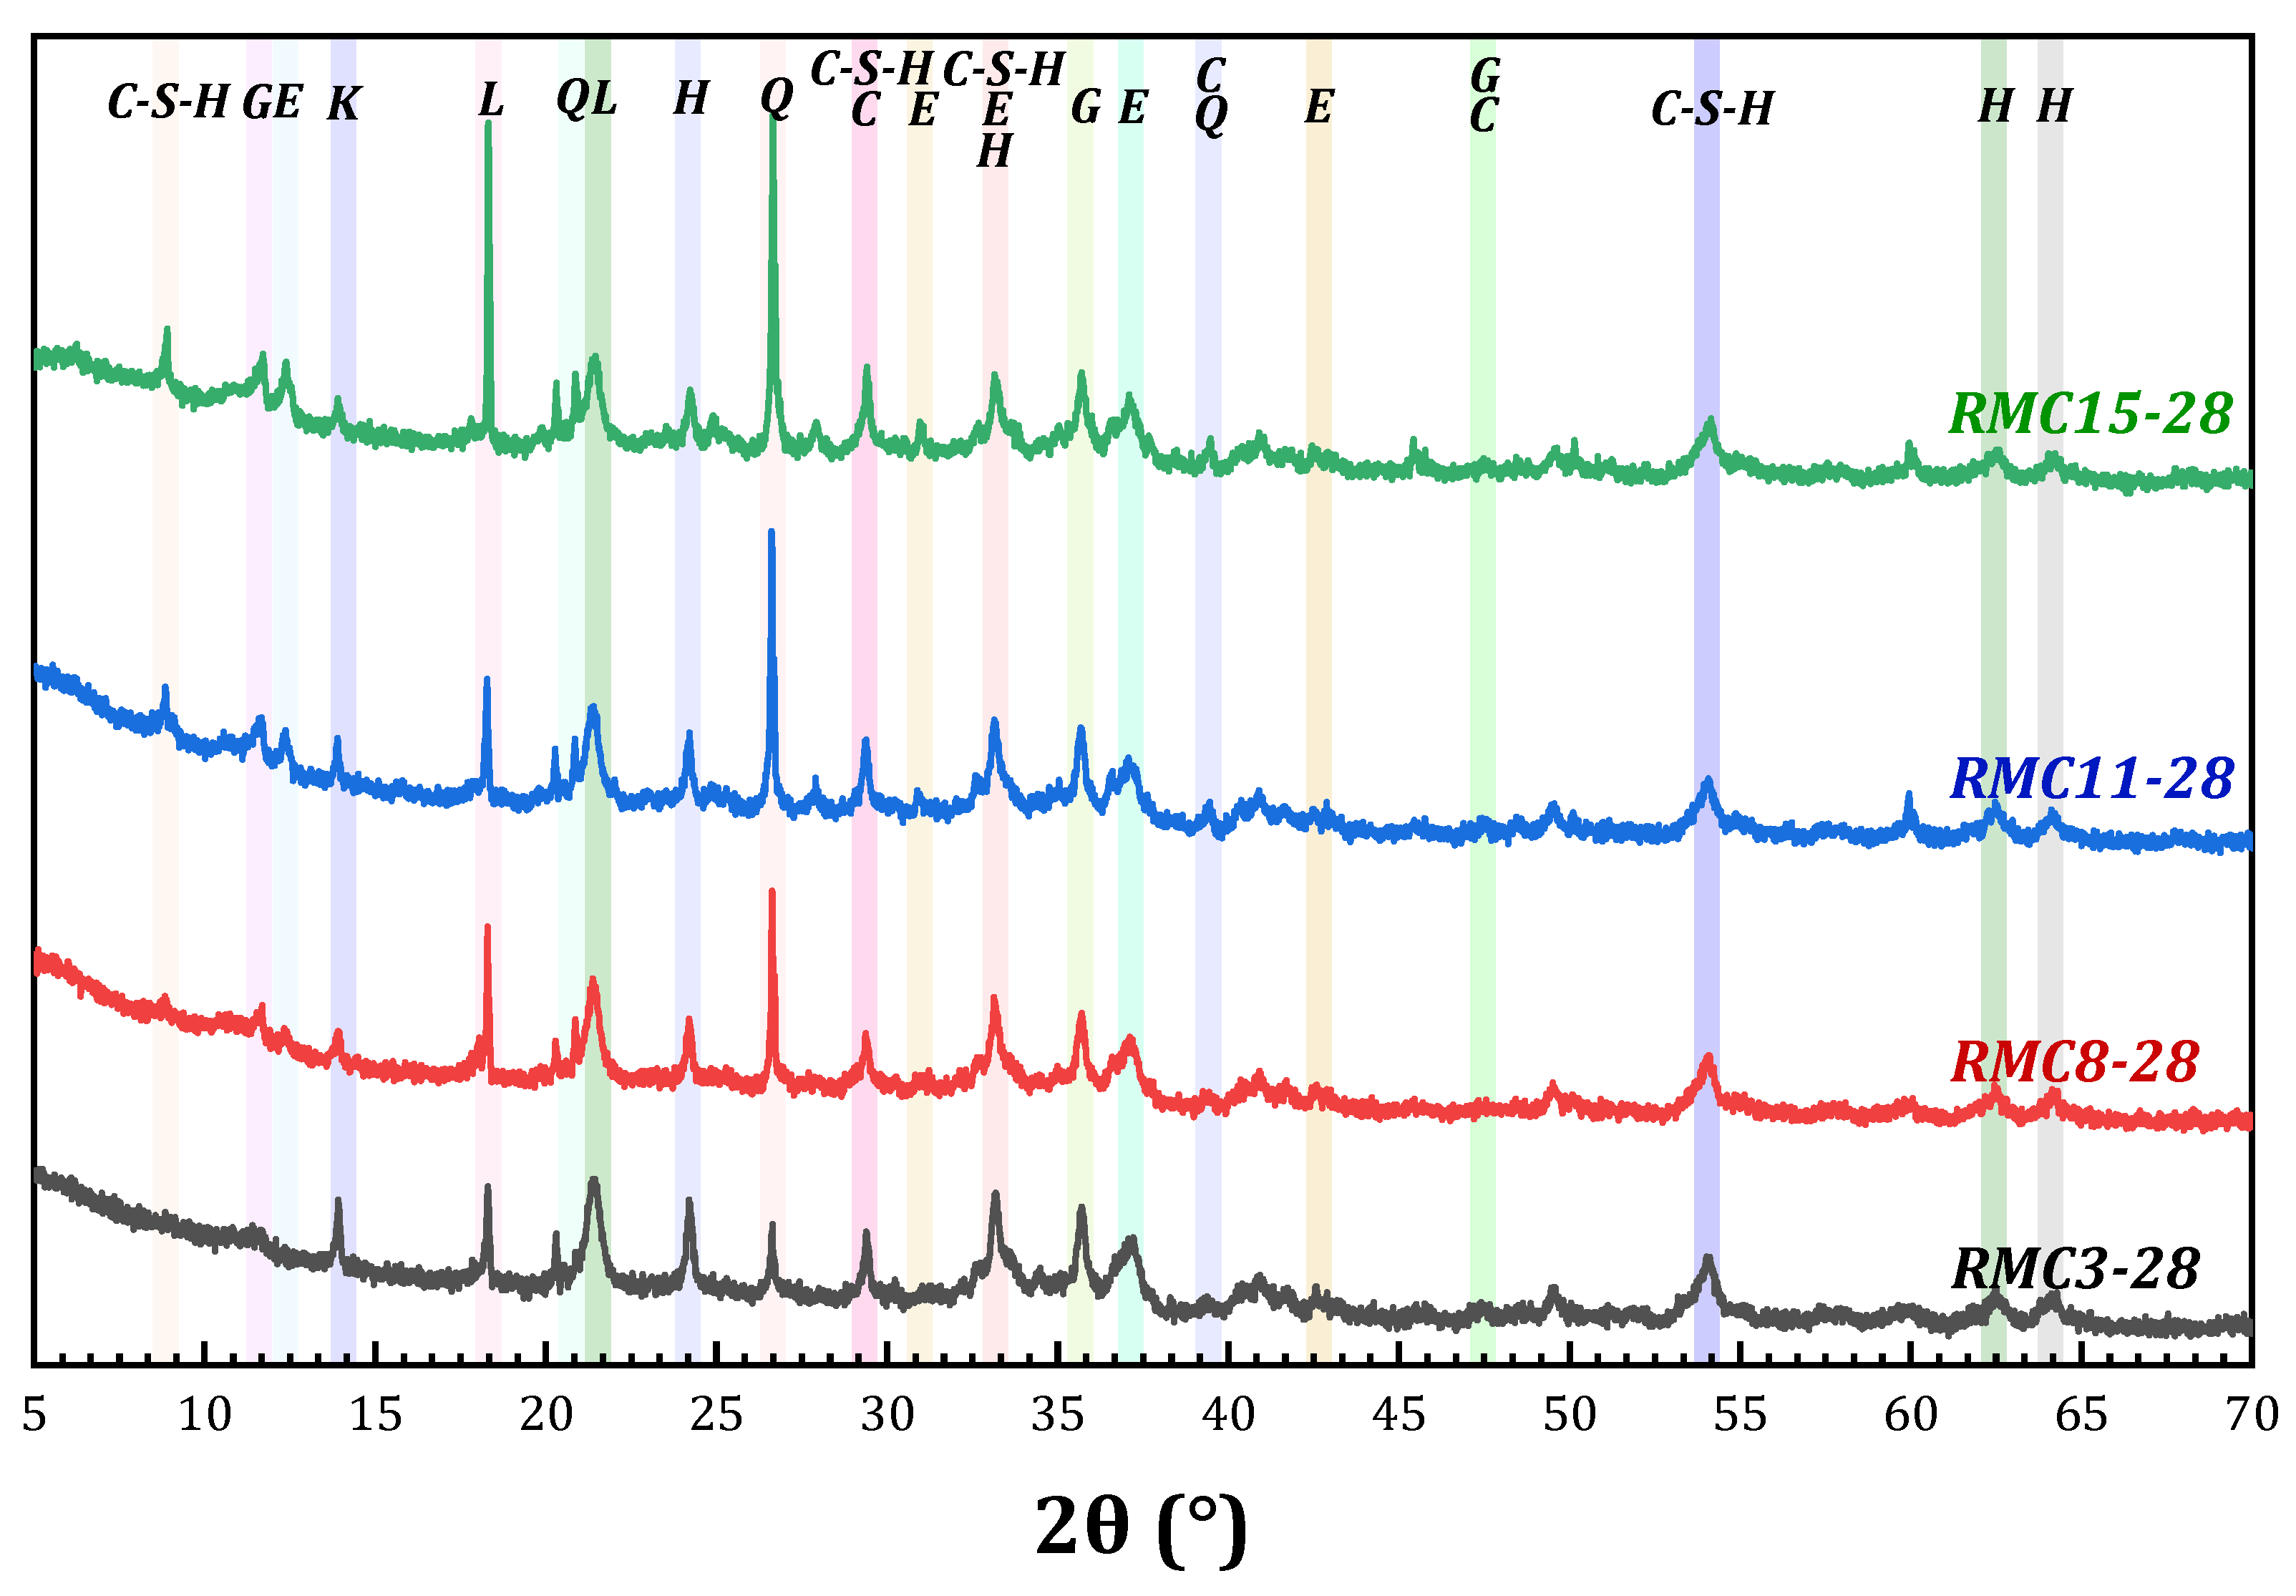
3.3.1. Analysis of Hydration Products

The mineral composition of the preferred four groups of RMC was analyzed using an X-ray diffractometer. The XRD patterns after 28 days of maintenance are shown in Figure 8, showing that the mineral compositions of RMC3, RMC8, RMC11, and RMC15 are basically the same, and the main hydration products are C-S-H gel, ettringite, lawsonite, calcite, gmelinite, quartzite, and hematite. Among them, hematite, which is the main product of bauxite after strong alkali dissolution, is inactive and therefore cannot participate in the hydration reaction of the material. Quartzite has more diffraction peaks and is presumed to be the main physical phase of the large CGG particles. Compared with the XRD spectrum of PC, it can be seen that dicalcium silicate and tricalcium silicate in PC are largely involved in the hydration reaction. The generated C-S-H gel and ettringite can provide early strength for the composite system, and their hydration reaction is inevitably accompanied by the generation of Ca(OH)2, which is detrimental to the strength of the filling material. This is because under the alkaline environment provided by RM and PC, Ca(OH)2 breaks the Si-O-Si and Al-O-Al covalent bonds in the glass phase. This can stimulate the volcanic ash activity of RM and CGP, thereby promoting dissolution and secondary hydration reactions [56]. This is due to the fact that a large quantity of Ca(OH)2 can act as a reactant to produce key products that enhance compressive strength (C-S-H gel) later in the hydration process. At 26.6°, the diffraction peak of quartz increases as the mass rate of RM/CG decreases, resulting in RMC3 < RMC8 < RMC11 < RMC15. This is because the higher the content of CGG, the larger the distribution area in the system, and the more it is incorporated into the sample during crushing, resulting in a stronger diffraction peak for quartz. Conversely, as the mass rate of RM/CG increases, there is more participation of RM and CGP fine particles in the hydration reaction, leading to dissolution of more reactive Al2O3 and SiO2 in the alkaline environment. These generate amorphous hydration products mainly composed of [SiO4] and [AlO4] tetrahedra, which then bind with free Ca2+, S O 4 2 , and Na+ in the system to form C-S-H gel, ettringite, and Na-gmelinite [57]. These gelling substances have a large specific surface area, which not only wraps the fine aggregates in the system, but also plays a bonding role between the coarse aggregates and between the coarse and fine aggregates, enhancing the overall connectivity of the material and thus improving the compressive strength of the filling material. The appearance of the hydration products, gmelinite and kroehnkite, suggests that the composite system may increase the alkali fixation and heavy-metal effect, which is expected to reduce the impact on the environment, but further research is needed to investigate the solidification mechanism of Na+ during the RMC hydration process [58].

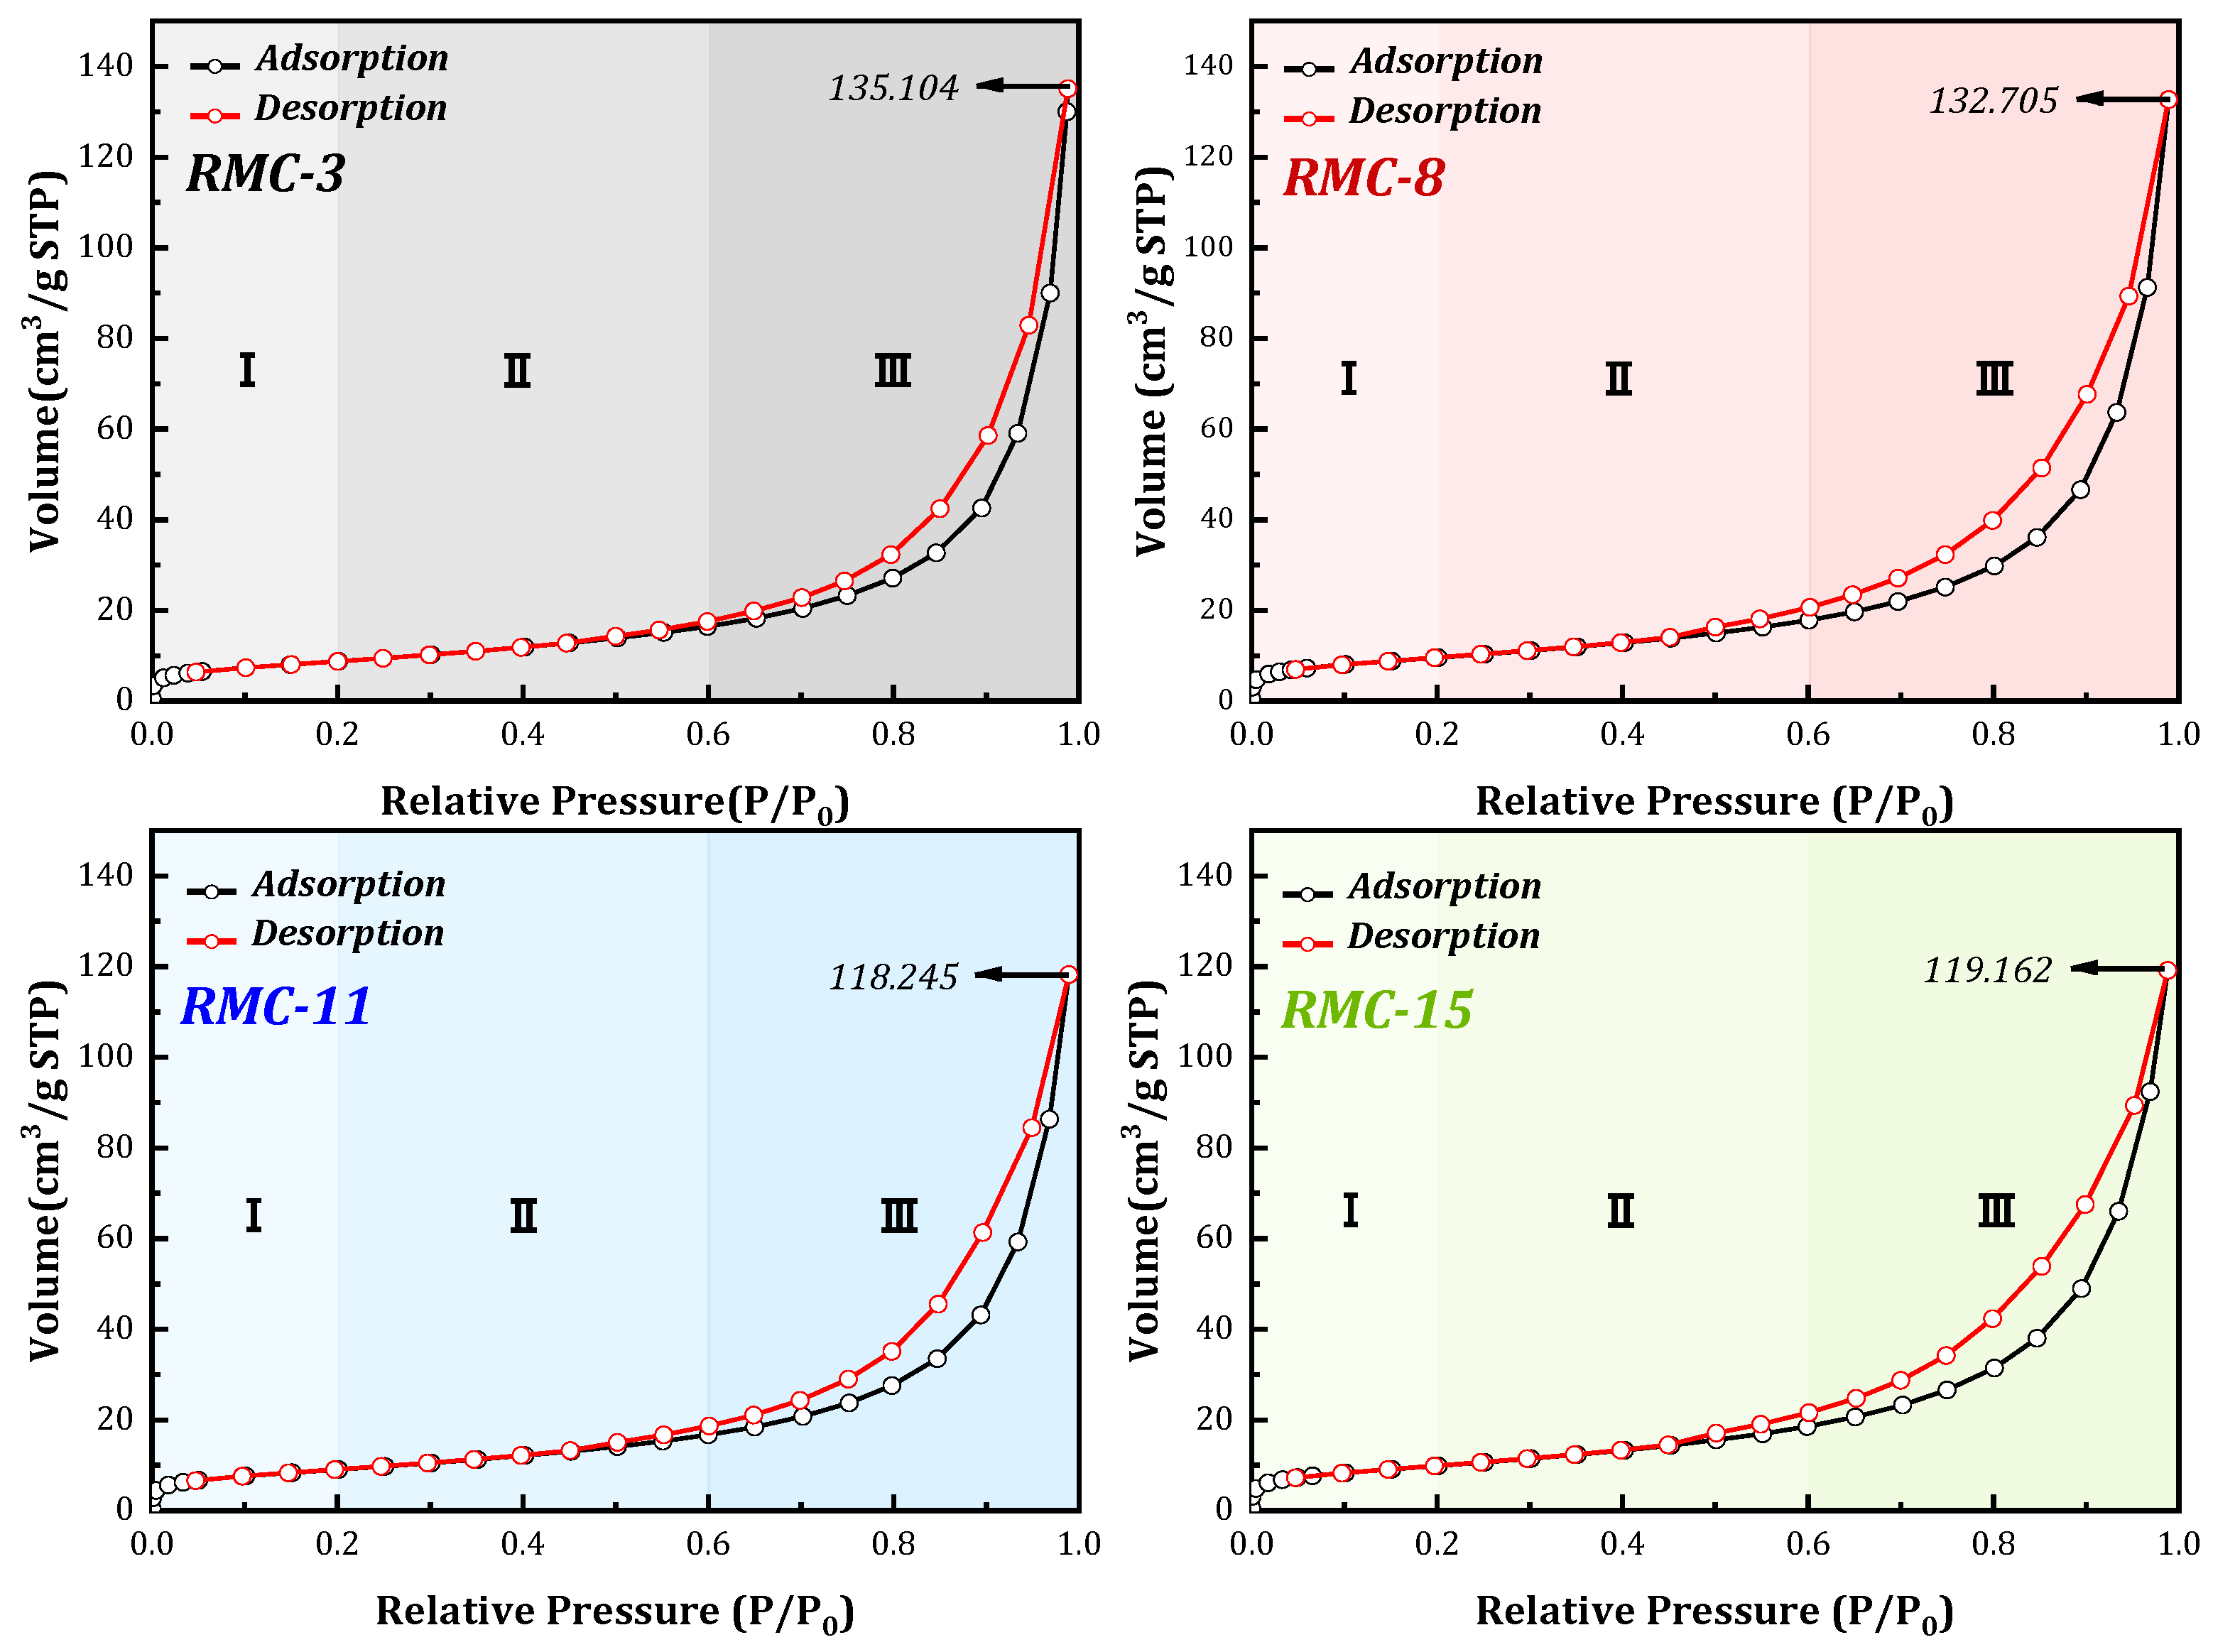
3.3.2. N2 Adsorption Curves and Pore Distribution Analysis
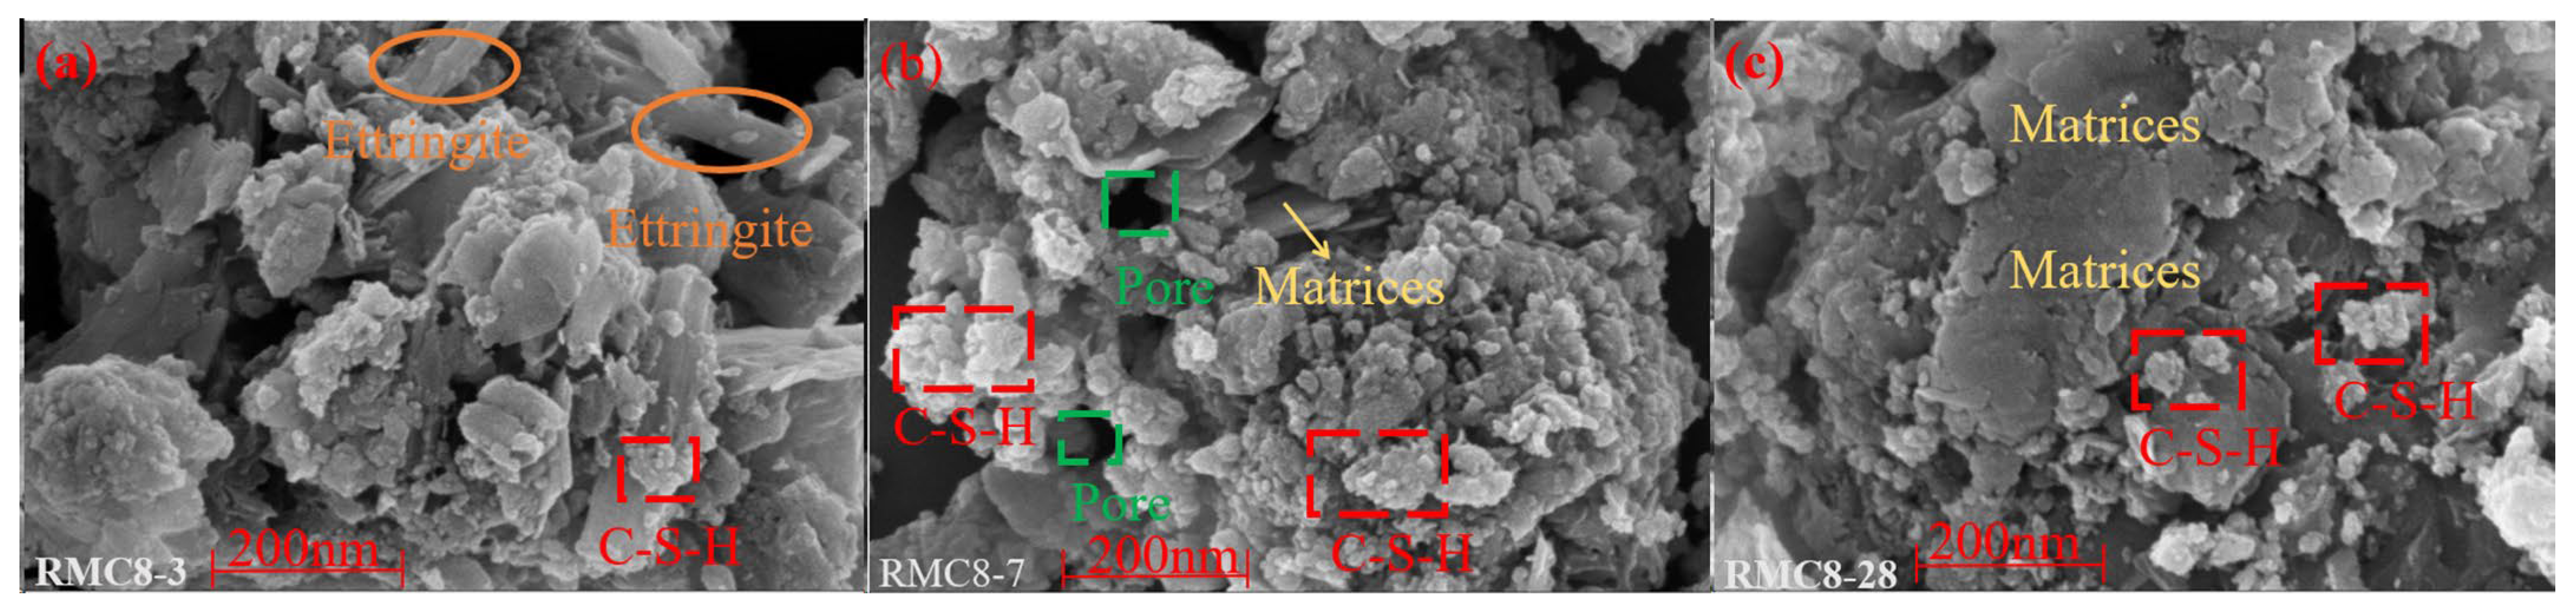
In this experiment, the adsorption mechanism of the gelling substances on the pore structure of the filling body was explored by performing N2 adsorption/desorption isotherms on the preferred four groups of specimens. The N2 adsorption/desorption isotherms are shown in Figure 9. According to the Brunauer–Deming–Teller classification, the adsorption/desorption isotherms are of type II, which indicates the multilayer adsorption of N2. The adsorption/desorption isotherms were divided into three stages: P/P0 < 0.2 for stage I, 0.2 < P/P0 < 0.6 for stage II, and 0.6 < P/P0 < 1 for stage III.
In stage I, N2 forms a typical monolayer adsorption in the micropores on the RMC surface. With the increase in relative pressure, it can enter stage II (steady rise) more quickly, and then rise sharply (stage III). The insignificant change in curvature at point B of the four sets of adsorption/desorption isotherms indicates a substantial overlap of the monolayer coverage and the onset of multilayer adsorption. The sharp increase in the curvature of the adsorption/desorption isotherms is due to the gradual formation of the multilayer adsorption structure and unrestricted adsorption close to the N2 saturation vapor pressure. When P/P0 = 1, the thickness of the adsorbed multilayer film generally showed an unlimited increase. At this vapor pressure, the amount of N2 adsorbed by the RMC reached 153.1039 cm3/g, 132.705 cm3/g, 118.2449 cm3/g, and 119.1624 cm3/g, respectively. From the adsorption/desorption curves, the presence of H3-type hysteresis loops (IUPAC classifications) indicated the presence of fissure structures, cracks, and a wedge-shaped RMC structure [59].
It is well known that the compactness (compressive strength) of a material is inversely proportional to its pore volume [60]. As shown in Figure 9, the maximum N2 adsorption of the four groups of filling materials can be arranged as RMC3 (135.104) > RMC8 (132.705) > RMC15 (119.162) > RMC11 (118.245). Specifically, RMC3 are fine aggregates with a large specific surface area, the hydration reaction is not complete in the same WSR case, and the formed, filled body specimen contains a large number of small pores, which provides a large amount of adsorption space for N2 and is consistent with its uniaxial compressive strength being the lowest among the four groups. In contrast, the RMC8 aggregate grading mechanism can carry out a sufficient hydration reaction, generating more gelling products, which, cross-climbing, close the lap to form a uniform network structure. This type of network structure can greatly enhance the adsorption capacity of N2 hydration products to fill the primary pore space and remodel the pore structure so that the primary pore structure is stable and has a more uniform distribution, improving its structural densities. Macroscopically, this shows the improvement of compressive strength. The hydration degrees of RMC11 and RMC15 are close to each other, and the difference in the number of gels produced is small, which has a weak effect on the N2 adsorption; in contrast, the raw materials in RMC15 have a more porous structure (coarse aggregate); the original microporous structure of the system is more porous after crushing, and the adsorption amount of N2 is larger.
The specific pore distribution of RMC is shown in Figure 10. As shown in Figure 11, the approximate locations of the pore distributions in the four groups of specimens after uniaxial compressive testing were simulated and plotted in this study based on the specimen compression damage physical diagrams, where the large pore aggregation site is called the highly fragile area and the medium pore aggregation site is called the fragile area. According to the pore distribution and pore size in the four groups of RMC, they were categorized into three regions: region I, 2 nm < PD < 50 nm; region II, 50 nm < PD < 125 nm; and region III, PD > 125 nm.
According to the pore size distribution curve, it can be seen that the pores of the four groups of specimens are mainly distributed in region I, and the peak size classification is RMC15 (0.00422) > RMC8 (0.00375) > RMC11 (0.00355) > RMC3 (0.00329). The reason for this pattern may be caused by the different contents of the porous structures of the raw materials. The higher the content of coarse aggregate, the more primary small pores it contains, and the larger the volume of pores in region I, which should be manifested as RMC15 > RMC11 > RMC8 > RMC3. However, the reason for the opposite pattern of RMC11 and RMC8 is that the RMC8 system is able to carry out a more complete hydration reaction under the optimal gradation. Therefore, it produces more gel, meaning a large number of gel filling packages bond to the original coarse aggregate surface or pores, forming a stable dense overall structure-a “false”-type coarse aggregate. Thus, after crushing, it shows the original coarse aggregate properties and increases its small pore content. In region II, the mesopore distribution curves are parallel and not very different. In region III, macropores exist only in the RMC3 group and not in the remaining three groups. This is because the system only contains fine aggregate, which requires too much water during the hydration reaction, making it difficult to fully react. The amount of gel generated is extremely low, which makes it impossible to closely lap the original powder materials to form a stable structure, resulting in many large holes in its interior. When the load is applied, the easily broken area collapses, so the compressive strength is relatively low.
As shown in the distribution of pores in the simulated sample in Figure 11, the RMC3 sample simultaneously exhibits highly breakable and breakable regions. During the experiment, the highly breakable region first collapses, followed by the breakage of the breakable region, leading to the overall instability of the sample and internal loosening after the crushing. This is due to the extremely low production of gel material, which cannot integrate the RMC3 into a whole. The fragile areas generated by the cross-aggregation of the mesopores are distributed inside the RMC11 and RMC15 samples. During the compressive testing, the fragile areas of RMC15 and RMC11 collapse first, leaving the interior relatively intact, which is caused by excessive coarse aggregate content and poor grading. In contrast, the pores of RMC8 are evenly distributed, and the small- and medium-sized pores are cross-distributed. It may be that the RMC8 group has the best aggregate grading and can produce a large number of gel and coarse and fine aggregates to cross-climb and closely lap to form a stable structure. This is consistent with the compressive strength results described above.

3.3.3. SEM Analysis

All the above experiments proved that RMC8 has superior performance in all the indices, so the SEM images of the 3-, 7-, and 28-day-old RMC8 specimens were studied with the aim of revealing the hydration process and the microreaction mechanism at the optimal ratio. As shown in Figure 12, a large number of ettringite and C-S-H gels are present in the SEM image (a) of the specimen at 3 days of curing, indicating that in the early stage of the reaction, the hydration reaction products of PC and FGD provided the specimens with early strength. In the SEM image (b) of the specimen at the age of 7 days, a large number of C-S-H gels are shown to have aggregated to fill in the pore spaces, but pores still existed, which was attributed to the fact that hydration is a relatively slow process, and in the pre-conservation period, fewer C-S-H gels were produced. With the increase in curing age, SEM image (c) shows that the C-S-H gel produced by the hydration reaction gradually increased and gathered together to fill the pores between the aggregates, reduce the total porosity, and produce a dense matrix to make the specimen more stable, which is macroscopically manifested in the increase in specimen strength. SEM images and discussions of RMC3, RMC8, RMC11, and RMC15 are shown in the Supplementary Materials.

3.4. Cost Analysis

Although red mud is one of the largest industrial wastes produced annually, its greatest advantage is its use as a resource to increase its utilization and thus reduce costs. Through market research, we found that the cost of solid-waste RM and CG mainly comprises artificial treatment and transportation fees, which are 20 CNY/ton and 40 CNY/ton, respectively. The price of 42.5 PC is 300 CNY/ton, and the price of FGD is 80 CNY/t. Upon calculation, the price of producing each ton of RMC is between 76.8 CNY/ton and 85.2 CNY/ton. Considering the huge demand for material usage in mine fill mining, it is economically feasible to utilize solid wastes such as RM and CG for the preparation of mine fill materials.

3.5. Leachate Testing

Table 6 shows the results of heavy-metal-concentration ions, pH, and conductivity tests of leachate from RM and RMC samples. The leaching concentration of heavy-metal ions after the hydration of RMC was in accordance with the limiting range of the GB8978-1996 comprehensive sewage discharge standard [61]. The leaching concentrations of As, Cr, and Mn were effectively reduced through the synergistic curing of raw-material RM with CG, FGD, and PC, and the leaching concentration of Mn was below the detection limit. The experimental results show that the use of RMC for mine filling is environmentally friendly. The pH test results of the leachate showed that the RMC of different ratios were less than the raw-material red mud. This is because the sodium in the composite system reacts with alumina and silica to produce gmelinite ( N a 2 A l 2 S i 4 O 12 · 6 H 2 O ), which is insoluble in water. This suggests that the hydration reaction effectively sequesters soluble bases in RM to some extent. Conductivity reflects the magnitude of the salt concentration of RMC leachate from the side, and the conductivity of RMC leachate is elevated compared to that of RM (1.9 ms/cm). This indicates that the raw materials in the composite system (Fe and K ions that do not participate in the hydration reaction) increase the salt concentration of the leach solution. The test results showed that the electrical conductivity of the RMC leachate was inversely proportional to the CG content. This is due to the fact that the insoluble substances generated by the hydration reaction and the increase in CGG content reduced the dissolution of the salts.

3.6. Strengthening Mechanism Analysis of RMC

3.6.1. Early Intensity

In the initial reaction stage of the RMC system, tricalcium silicate (C3S) and dicalcium silicate (C2S) in the PC undergo a hydration reaction to produce C-S-H gel and Ca(OH)2 [62]. In addition, the addition of FGD can enhance the early strength of the material to a certain extent, which is due to the fact that it belongs to a kind of sulfate, which can be combined with water and tricalcium aluminate (C3A) in PC to produce calcium alumina crystals as shown in Equations (5) and (6). Calcite crystals continue to fill the pores by growing inside the cementitious material, increasing the denseness of the material and improving its mechanical properties [63]. As shown in Equations (4) and (5), the more C3S and C2S, the more violent the reaction, the more C-S-H and Ca(OH)2 are generated, and the less free water is generated, which gradually loses its mobility. However, the large amount of generation of ettringite, an initial product of hydration, precipitates when attached to the surface of unhydrated particles, blocking the entry of water, leading to an incomplete hydration reaction and delaying the rate of RMC condensation. This is also consistent with the results in Figure 4, where the larger the FGD mass fraction, the longer the time required for RMC coagulation.
  2 3 C a O · S i O 2 + 6 H 2 O 3 C a O · 2 S i O 2 · 3 H 2 O + 3 C a O H 2
  2 2 C a O · S i O 2 + 4 H 2 O 3 C a O · 2 S i O 2 · 3 H 2 O + C a O H 2  
  3 C a O · A l 2 O 3 + 6 H 2 O 3 C a O · A l 2 O 3 · 6 H 2 O
3 C a O · A l 2 O 3 · 6 H 2 O + 3 ( C a S O 4 · 2 H 2 O ) + 6 H 2 O 3 C a O · A l 2 O 3 · 3 C a S O 4 · 32 H 2 O

3.6.2. Final Intensity

The alkalinity in RM reacts with Ca2+ to generate Ca(OH)2. Under the synergistic effect of the high alkalinity of RM and the OH provided by PC, the Si-O-Si and Al-O-Al bonds are broken, which stimulates the volcanic ash activity of RM and CGP. The reactive silicon and reactive silica–alumina components were hydrolyzed by OH to generate free cations (Al3+, etc.), and the reactive ions were aggregated by diffusion through the concentration difference to undergo a secondary hydration reaction, as shown in Equations (8)–(11). That is, Ca(OH)2 reacts with active silica–alumina substances to produce hydration products such as C-S-H gels, ettringite, and sodium rhodochrosite zeolites [57,64]. The generated hydration products fill in the pores, increasing the degree of densification and ensuring the growing strength of the filling body.
  m C a O H 2 + S i O 2 + n 1 H 2 O m C a O · S i O 2 · n H 2 O
  x C a O H 2 + A l 2 O 3 + y 1 H 2 O x C a O · A l 2 O 3 · y H 2 O
  3 C a O H 2 + A l 2 O 3 + 3 C a S O 4 + 29 H 2 O 3 C a O · A l 2 O 3 · 3 C a S O 4 · 32 H 2 O
  4 S i O 2 + A l 2 O 3 + 2 N a O H + 5 H 2 O N a 2 A l 2 S i 4 O 12 · 6 H 2 O
Through the analysis of the above RMC enhancement mechanism, the hydration process model of the RMC is shown in Figure 13. In the early stages, the vigorous reaction of the feedstock is mainly the hydration reaction of PC and FGD. The hydration products, fine-needle-like calcite, fibrous C-S-H gel, and raw material particles, lap and intertwine to provide a certain degree of stable structure for the system. As the hydration reaction proceeds, the active substances in RM and CGP dissolve in the alkaline environment to participate in the hydration reaction. A large number of chalcocite crystals grow continuously to fill the pores in the system and reduce the proportion of harmful pores. The fine, fibrous C-S-H gel develops from an amorphous shape to a reticular structure and gels the unreacted loose particles to form a dense structure.

4. Conclusions

In this paper, the preparation of RMC from RM and PC synergized with other industrial wastes was investigated through orthogonal tests, aiming to improve the comprehensive solid waste utilization of RM. The relevant performance indices of red mud composite filling materials were investigated through macroscopic experimental means such as flowability, setting time, and a uniaxial compressive strength test. At the same time, the microscopic perspectives of XRD, BET, and SEM experiments were used to compare the preferred groups (RMC3, RMC8, RMC11, and RMC15), and the following conclusions were finally drawn:
(1)
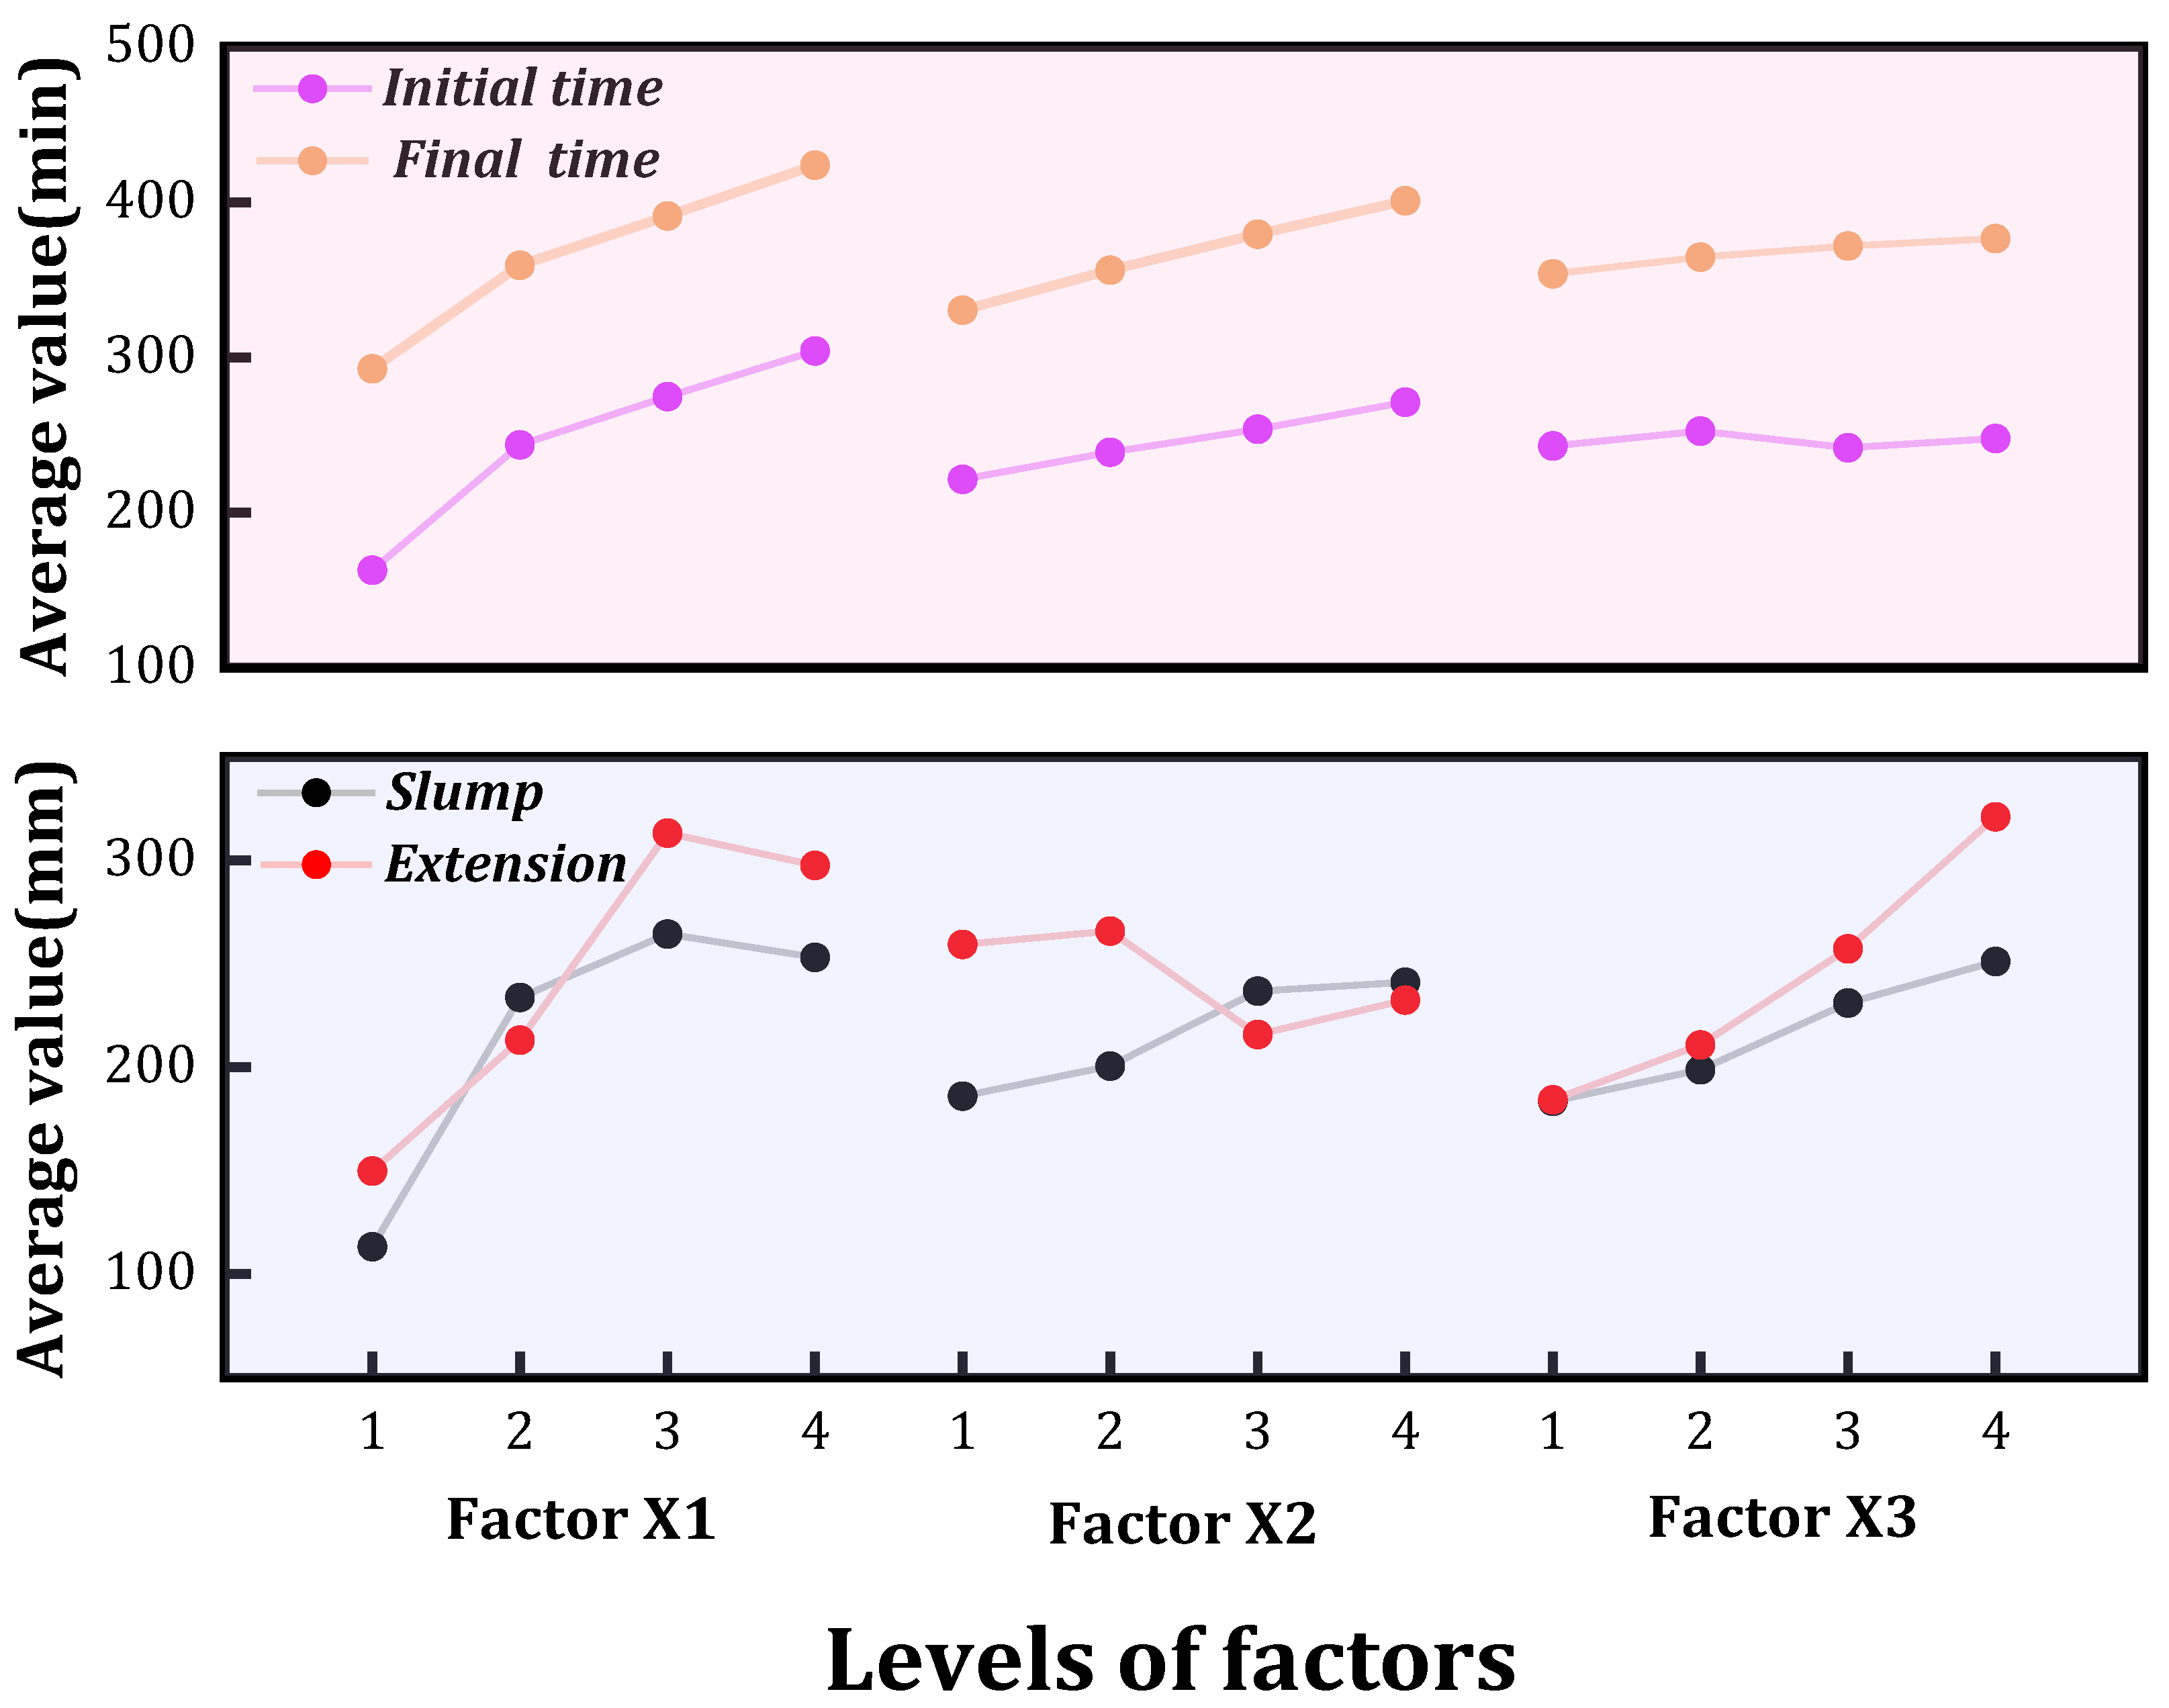
The macroscopic experimental results show that the mass ratio of RM/CG has the greatest influence on the flow properties of RMC. In terms of setting time, both initial setting time and final setting time increase with the increase in the level values of each factor. The order of influence of each factor on the initial setting time and final setting time is X1 > X2 > X3. This is because coarse aggregate does not participate in the hydration reaction, so the mass ratio of RM/CG determines the mass of the material participating in the hydration reaction. The more fine the aggregate, the faster the setting rate. The hydration products of FGD in the composite system hinder the progress of the hydration reaction and play a role in slowing the setting process.
(2)
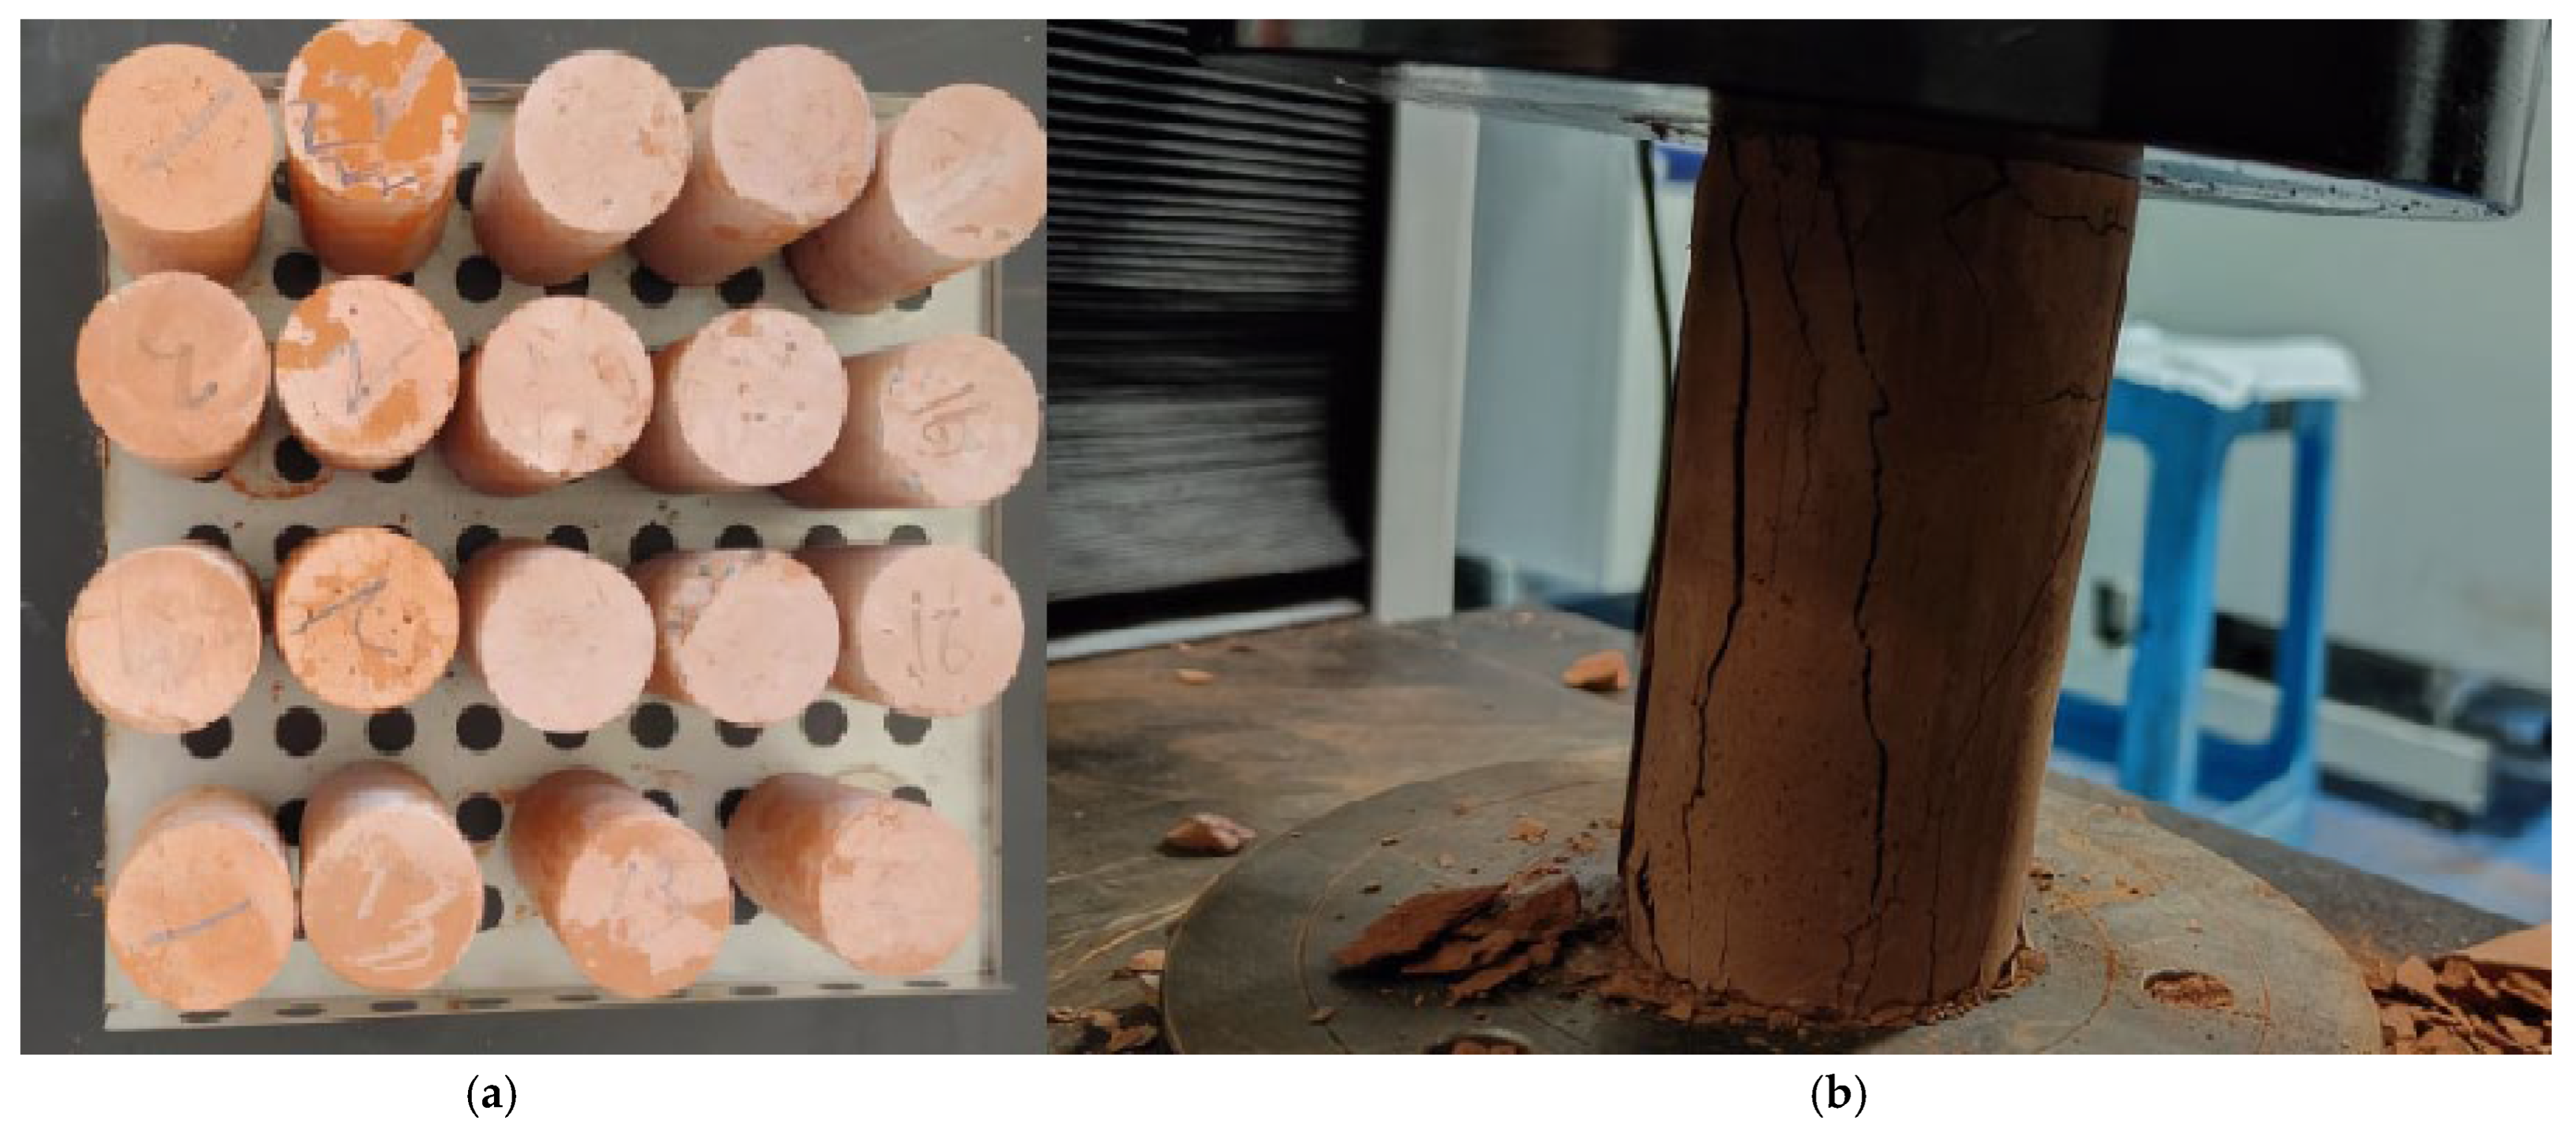
The uniaxial compressive strength test results indicate that the compressive strength of RMC generally follows the rule of increasing with the increase in curing time. Among them, RMC8 has the best compressive strength, with a compressive strength of 8.58 MPa after 28 days of curing. The crack propagation on the surface of the specimen shows that the failure mode of the specimen surface is single under early strength, but as the curing time of the specimen increases, the surface cracks first form in an approximately vertical direction and gradually appear, and then spread and intersect in a horizontal direction. The failure mode changes from cleavage failure to a combination of cleavage and shear failure, and the crack width decreases.
(3)
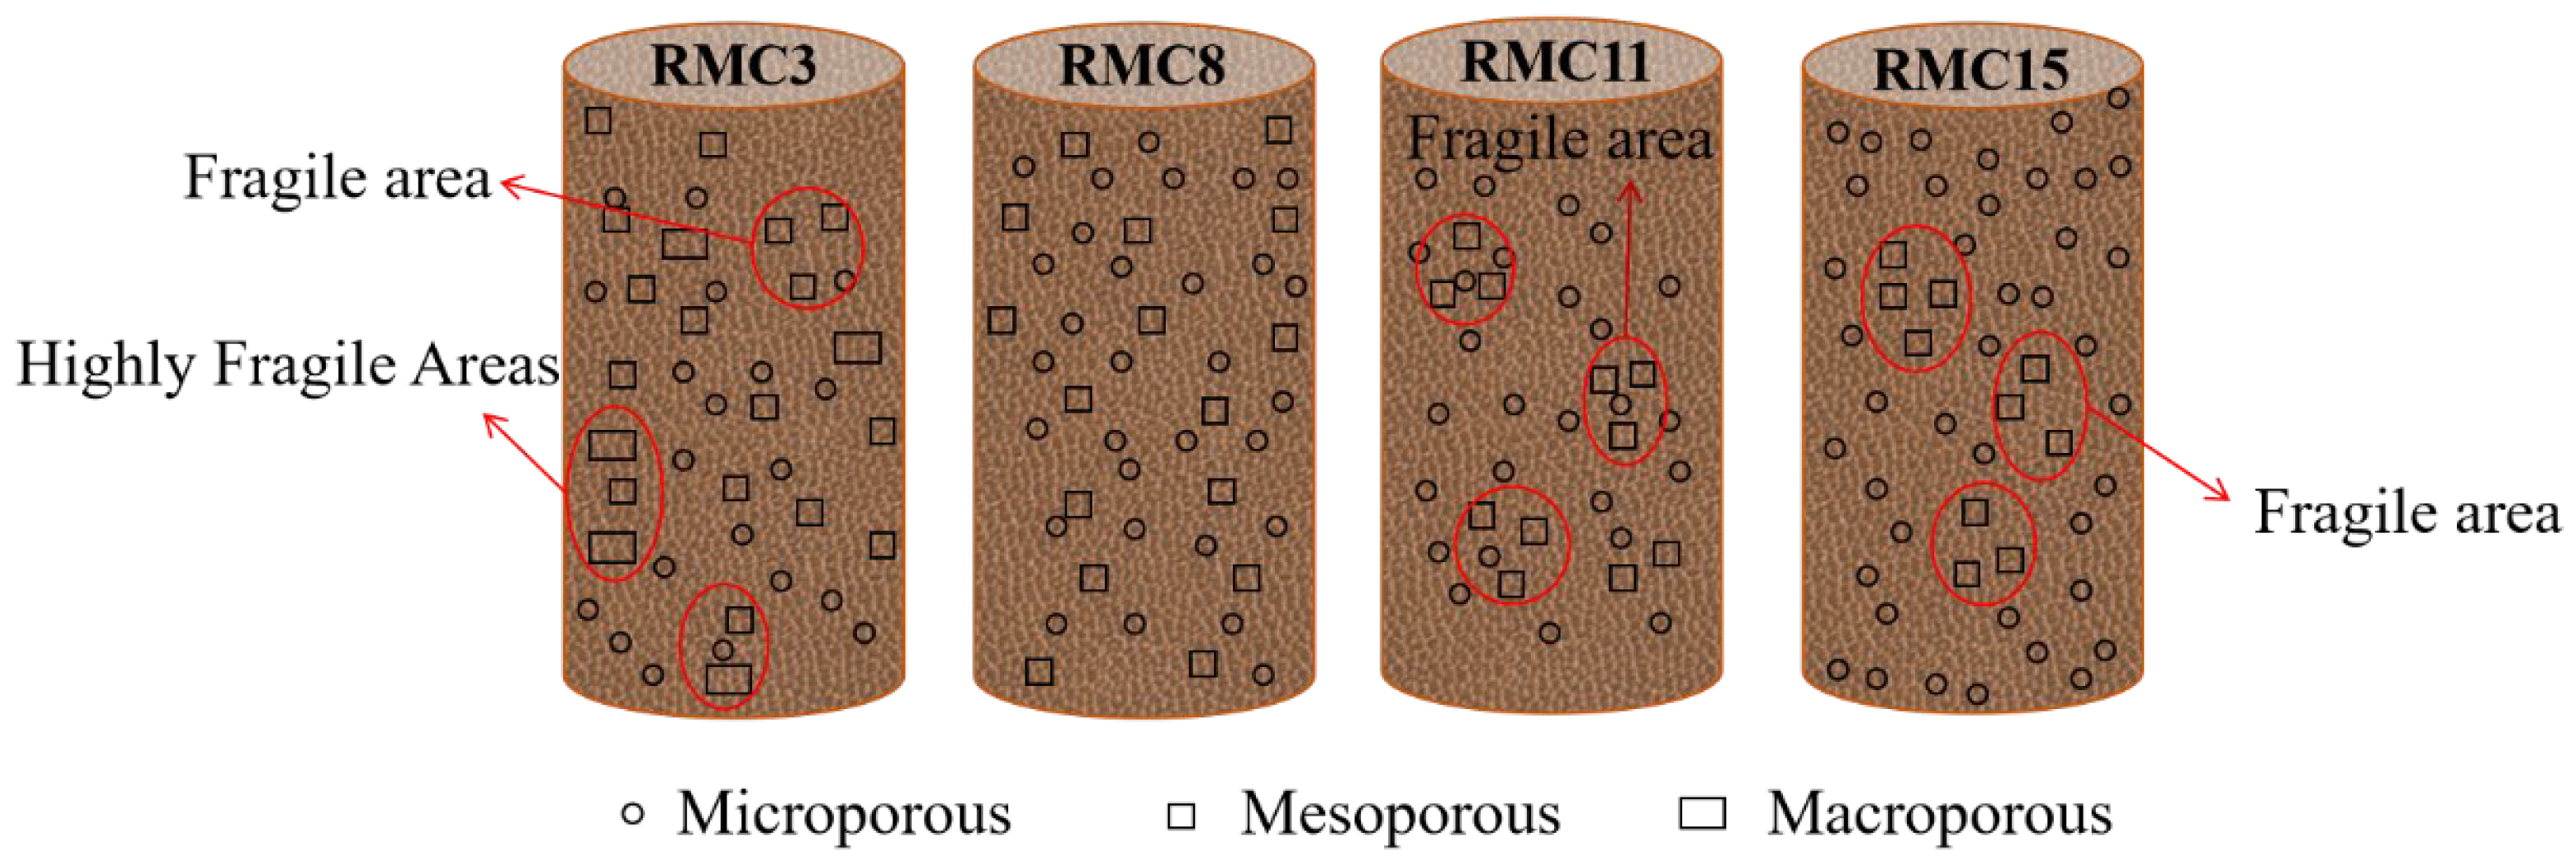
The microscopic analysis shows that the XRD patterns of the samples of the preferred group (cured for 28 days) reveal that the hydration products are basically the same, and C-S-H gel and ettringite play key roles in the compressive strength of the composite system. The BET test revealed that coarse aggregate and hydration products (gel) increased the number and volume of pores in RMC. It was found that large pores and mesopores gathered to form highly fragile and fragile regions, respectively. The SEM observation of the pore analysis found that there is a critical value for the mass ratio of RM/CG, which is the optimal aggregate grading. A value higher or lower than this critical value in this system will have a detrimental effect on compressive strength.
(4)
The strengthening mechanism analysis showed that the early strength of the composite system was provided by the hydration products of PC and FGD (ettringite, lawsonite, and C-S-H gel). The alkaline environment provided by RM and PC stimulated the pozzolanic activity of RM and CGP, which led to the secondary hydration of silica and aluminum oxides in the system and promoted the late strength of RMC to increase. At the same time, the formation of hydration products (gmelinite) increased the solid alkali effect of the gelling system, which can reduce the pH value of RMC to a certain extent and reduce the adverse impact on the environment.
In summary, the red mud composite filling material prepared in this study increases red mud doping to 70%, which meets the requirements of mine filling. This shows that it is feasible to utilize a large amount of red mud waste to prepare composite filling materials, which is expected to solve the soil and water pollution problems brought on by red mud stockpiling. At the same time, the resource utilization of red mud solves the problem of the high cost of mine filling materials and also provides a great impetus to promote the sustainable development of green mines.

Supplementary Materials

The following supporting information can be downloaded at: https://www.mdpi.com/article/10.3390/su152115532/s1, Figure S1. SEM images of RMC3, RMC8, RMC11 and RMC15 cured for 28d.

Author Contributions

J.Z.: Conceptualization, Methodology, Writing—original draft preparation. G.Y.: Validation, Formal analysis, Supervision, Funding acquisition. X.B.: Writing—original draft preparation, Validation. S.K.: Data curation, Investigation, Editing. J.L.: Investigation, Writing—original draft preparation. G.L.: Writing—original draft preparation, Validation. Z.G.: Writing—review and editing, Data curation. J.H.: Data curation, Validation. All authors have read and agreed to the published version of the manuscript.

Funding

This research was funded by the National Natural Science Foundation of China (Grant No. 51974195) and supported by Shanxi Provincial Department of Education’s 2022 Scientific and Technological Innovation Plan for Colleges and Universities in Shanxi Province-Project No.: 2022L055 and project support from Shanxi Science and Technology Department’s 2022 Basic Research Plan (Free Exploration)-Project No.: 20220302122099.

Institutional Review Board Statement

Not applicable.

Informed Consent Statement

Not applicable.

Data Availability Statement

The authors do not have permission to share data.

Conflicts of Interest

The authors declare that they have no known competing financial interest or personal relationships that could have influenced the work reported in this study.

References

  1. Panda, I.; Jain, S.; Das, S.K.; Jayabalan, R. Characterization of red mud as a structural fill and embankment material using bioremediation. Int. Biodeterior. Biodegrad. 2017, 119, 368–376. [Google Scholar] [CrossRef]
  2. Mustafa, J.; Mourad, A.; Al-Marzouqi, A.H.; El-Naas, M.H. Simultaneous treatment of reject brine and capture of carbon dioxide: A comprehensive review. Desalination 2020, 483, 114386. [Google Scholar] [CrossRef]
  3. Li, X.-F.; Zhang, T.-A.; Lv, G.-Z.; Wang, K.; Wang, S. Summary of Research Progress on Metallurgical Utilization Technology of Red Mud. Minerals 2023, 13, 737. [Google Scholar] [CrossRef]
  4. Pan, X.; Wu, H.; Lv, Z.; Yu, H.; Tu, G. Recovery of valuable metals from red mud: A comprehensive review. Sci. Total Environ. 2023, 904, 166686. [Google Scholar] [CrossRef]
  5. Liu, D.-Y.; Wu, C.-S. Stockpiling and Comprehensive Utilization of Red Mud Research Progress. Materials 2012, 5, 1232–1246. [Google Scholar] [CrossRef]
  6. Liu, H.B.; Liu, Z.L. Recycling utilization patterns of coal mining waste in China. Resour. Conserv. Recycl. 2010, 54, 1331–1340. [Google Scholar]
  7. Hu, Z.; Hu, F.; Li, J.-H.; Li, H. Impact of coal mining subsidence on farmland in eastern China. Int. J. Surf. Min. Reclam. Environ. 1997, 11, 91–94. [Google Scholar] [CrossRef]
  8. Wang, A.; Ma, L.; Wang, Z.; Zhang, D.; Li, K.K.; Zhang, Y.; Yi, X. Soil and water conservation in mining area based on ground surface subsidence control: Development of a high-water swelling material and its application in backfilling mining. Environ. Earth Sci. 2016, 75, 698. [Google Scholar] [CrossRef]
  9. Guo, W.; Guo, M.; Tan, Y.; Bai, E.; Zhao, G. Sustainable Development of Resources and the Environment: Mining-Induced Eco-Geological Environmental Damage and Mitigation Measures—A Case Study in the Henan Coal Mining Area, China. Sustainability 2019, 11, 4366. [Google Scholar] [CrossRef]
  10. Liu, J.-G.; Li, X.-W.; He, T. Current situation and development of coal mine filling mining application in China. J. China Coal Soc. 2020, 45, 141–150. [Google Scholar]
  11. Chen, S.-J.; Yin, D.; Cao, F.; Liu, Y.; Ren, K. An overview of integrated surface subsidence-reducing technology in mining areas of China. Nat. Hazards 2015, 81, 1129–1145. [Google Scholar] [CrossRef]
  12. Wang, S.; Jin, H.; Deng, Y.; Xiao, Y. Comprehensive utilization status of red mud in China: A critical review. J. Clean. Prod. 2021, 289, 125136. [Google Scholar] [CrossRef]
  13. Dodoo-Arhin, D.; Nuamah, R.A.; Agyei-Tuffour, B.; Obada, D.O.; Yaya, A. Awaso bauxite red mud-cement based composites: Characterisation for pavement applications. Case Stud. Constr. Mater. 2017, 7, 45–55. [Google Scholar] [CrossRef]
  14. Sushil, S.; Batra, V.S. Catalytic applications of red mud, an aluminium industry waste: A review. Appl. Catal. B Environ. 2008, 81, 64–77. [Google Scholar] [CrossRef]
  15. López, A.; de Marco, I.; Caballero, B.M.; Laresgoiti, M.F.; Adrados, A.; Aranzabal, A. Catalytic pyrolysis of plastic wastes with two different types of catalysts: ZSM-5 zeolite and Red Mud. Appl. Catal. B Environ. 2011, 104, 211–219. [Google Scholar] [CrossRef]
  16. Senff, L.; Hotza, D.; Labrincha, J.A. Effect of red mud addition on the rheological behaviour and on hardened state characteristics of cement mortars. Constr. Build. Mater. 2011, 25, 163–170. [Google Scholar] [CrossRef]
  17. He, J.; Jie, Y.; Zhang, J.; Yu, Y.; Zhang, G. Synthesis and characterization of red mud and rice husk ash-based geopolymer composites. Cem. Concr. Compos. 2013, 37, 108–118. [Google Scholar] [CrossRef]
  18. Singh, M.; Upadhayay, S.N.; Prasad, P.M. Preparation of iron rich cements using red mud. Cem. Concr. Res. 1997, 27, 1037–1046. [Google Scholar] [CrossRef]
  19. Aygörmez, Y. Evaluation of the red mud and quartz sand on reinforced metazeolite-based geopolymer composites. J. Build. Eng. 2021, 43, 102528. [Google Scholar] [CrossRef]
  20. Bonenfant, D.; Kharoune, L.; Sauvé, S.; Hausler, R.; Niquette, P.; Mimeault, M.; Kharoune, M. CO2 Sequestration by Aqueous Red Mud Carbonation at Ambient Pressure and Temperature. Ind. Eng. Chem. Res. 2008, 47, 7617–7622. [Google Scholar] [CrossRef]
  21. Gupta, V.K.; Gupta, M.; Sharma, S. Process development for the removal of lead and chromium from aqueous solutions using red mud—An aluminium industry waste. Water Res. 2001, 35, 1125–1134. [Google Scholar] [CrossRef] [PubMed]
  22. Wang, S.; Boyjoo, Y.; Choueib, A.; Zhu, Z.H. Removal of dyes from aqueous solution using fly ash and red mud. Water Res. 2005, 39, 129–138. [Google Scholar] [CrossRef] [PubMed]
  23. Yadav, V.S.; Prasad, M.; Khan, J.; Amritphale, S.S.; Singh, M.; Raju, C.B. Sequestration of carbon dioxide (CO2) using red mud. J. Hazard. Mater. 2010, 176, 1044–1050. [Google Scholar] [CrossRef] [PubMed]
  24. Sahu, R.C.; Patel, R.K.; Ray, B.C. Neutralization of red mud using CO2 sequestration cycle. J. Hazard. Mater. 2010, 179, 28–34. [Google Scholar] [CrossRef]
  25. Liu, W.; Yang, J.; Xiao, B. Application of Bayer red mud for iron recovery and building material production from alumosilicate residues. J. Hazard. Mater. 2009, 161, 474–478. [Google Scholar] [CrossRef]
  26. Liu, Y.; Naidu, R. Hidden values in bauxite residue (red mud): Recovery of metals. Waste Manag. 2014, 34, 2662–2673. [Google Scholar] [CrossRef]
  27. Agatzini-Leonardou, S.; Oustadakis, P.; Tsakiridis, P.E.; Markopoulos, C. Titanium leaching from red mud by diluted sulfuric acid at atmospheric pressure. J. Hazard. Mater. 2008, 157, 579–586. [Google Scholar] [CrossRef]
  28. Pasechnik, L.A.; Skachkov, V.M.; Bibanaeva, S.A.; Medyankina, I.S.; Bamburov, V.G. Composition and Properties of Iron Oxides in the Products of Hydrothermal Treatment of Red Mud and Bauxites. Russ. J. Inorg. Chem. 2022, 67, 1101–1107. [Google Scholar] [CrossRef]
  29. Zinoveev, D.; Pasechnik, L.; Fedotov, M.; Dyubanov, V.; Grudinsky, P.; Alpatov, A. Extraction of Valuable Elements from Red Mud with a Focus on Using Liquid Media—A Review. Recycling 2021, 6, 38. [Google Scholar] [CrossRef]
  30. Pasechnik, L.A.; Skachkov, V.M.; Chufarov, A.Y.; Suntsov, A.Y.; Yatsenko, S.P. High purity scandium extraction from red mud by novel simple technology. Hydrometallurgy 2021, 202, 105597. [Google Scholar] [CrossRef]
  31. Grudinsky, P.; Zinoveev, D.; Yurtaeva, A.; Kondratiev, A.; Dyubanov, V.; Petelin, A. Iron Recovery from Red Mud Using Carbothermic Roasting with Addition of Alkaline Salts. J. Sustain. Metall. 2021, 7, 858–873. [Google Scholar] [CrossRef]
  32. Pyagai, I.N.; Pasechnik, L.A.; Yatsenko, A.S.; Skachkov, V.M.; Yatsenko, S.P. Recovery of sludge from alumina production. Russ. J. Appl. Chem. 2012, 85, 1649–1653. [Google Scholar] [CrossRef]
  33. Zhang, J.; Liu, S.; Yao, Z.; Wu, S.; Jiang, H.; Liang, M.; Qiao, Y. Environmental aspects and pavement properties of red mud waste as the replacement of mineral filler in asphalt mixture. Constr. Build. Mater. 2018, 180, 605–613. [Google Scholar] [CrossRef]
  34. Wang, Y.; Liu, X.; Tang, B.; Li, Y.; Zhang, W.; Xue, Y. Effect of Ca/(Si + Al) on red mud based eco-friendly revetment block: Microstructure, durability and environmental performance. Constr. Build. Mater. 2021, 304, 124618. [Google Scholar] [CrossRef]
  35. Zhang, G.; He, J.; Gambrell, R.P. Synthesis, Characterization, and Mechanical Properties of Red Mud–Based Geopolymers. Transp. Res. Rec. 2010, 2167, 1–9. [Google Scholar] [CrossRef]
  36. Cheng, W.; Yuan, S.-S.; Yuan, B. Design of red mud-excited fly ash filling material and excitation mechanism. J. Wuhan Univ. Technol. 2019, 41, 20–23+32. [Google Scholar]
  37. Ye, N.; Yang, J.; Liang, S.; Hu, Y.; Hu, J.; Xiao, B.; Huang, Q. Synthesis and strength optimization of one-part geopolymer based on red mud. Constr. Build. Mater. 2016, 111, 317–325. [Google Scholar] [CrossRef]
  38. Wang, Z.; Wang, Y.; Wu, L.; Wu, A.; Ruan, Z.; Zhang, M.; Zhao, R. Effective reuse of red mud as supplementary material in cemented paste backfill: Durability and environmental impact. Constr. Build. Mater. 2022, 328, 127002. [Google Scholar] [CrossRef]
  39. Zou, G.; Xu, J.; Wu, C. Evaluation of factors that affect rutting resistance of asphalt mixes by orthogonal experiment design. Int. J. Pavement Res. Technol. 2017, 10, 282–288. [Google Scholar] [CrossRef]
  40. Deng, L.; Feng, B.; Zhang, Y. An optimization method for multi-objective and multi-factor designing of a ceramic slurry: Combining orthogonal experimental design with artificial neural networks. Ceram. Int. 2018, 44, 15918–15923. [Google Scholar] [CrossRef]
  41. Li, X.; Hao, J. Orthogonal test design for optimization of synthesis of super early strength anchoring material. Constr. Build. Mater. 2018, 181, 42–48. [Google Scholar] [CrossRef]
  42. Mu, J.; Li, Y.; Hao, J.; Liu, Y.; Shen, J. Research on discrete element simulation of slump test for fresh self-compacting concrete. J. Build. Eng. 2023, 70, 106464. [Google Scholar] [CrossRef]
  43. Zhou, L.-B.; Sun, X.-H.; Liu, Z.; Wang, D.-M.; Zhu, L. Preparation, workability and microstructure of heavily doped fly ash-based mine filling materials. J. China Coal Soc. 2022, 359, 132043. [Google Scholar]
  44. Creber, K.J.; McGuinness, M.; Kermani, M.F.; Hassani, F.P. Investigation into changes in pastefill properties during pipeline transport. Int. J. Miner. Process. 2017, 163, 35–44. [Google Scholar] [CrossRef]
  45. Qu, H.-S.; Suo, Y.-L.; Liu, L.; Zhou, W.-W.; Yang, P.; Zhang, C.-X. Preparation and properties of modified coal gasification slag-based mining filling materials. J. China Coal Soc. 2022, 47, 1958–1973. [Google Scholar]
  46. Zhou, N.; Zhang, J.; Ouyang, S.; Deng, X.; Dong, C.; Du, E. Feasibility study and performance optimization of sand-based cemented paste backfill materials. J. Clean. Prod. 2020, 259, 120798. [Google Scholar] [CrossRef]
  47. Wang, P.; Liu, D.-Y. Physical and Chemical Properties of Sintering Red Mud and Bayer Red Mud and the Implications for Beneficial Utilization. Materials 2012, 5, 1800–1810. [Google Scholar] [CrossRef]
  48. Liu, H.; Sun, X.; Wang, Y.; Lu, X.; Du, H.; Tian, Z. Study on the Influence of Silica Fume (SF) on the Rheology, Fluidity, Stability, Time-Varying Characteristics, and Mechanism of Cement Paste. Materials 2022, 15, 90. [Google Scholar] [CrossRef]
  49. Wang, J.; Ma, T.; Luan, Y.; Wang, S.; Zhang, Y. Investigation on the effects of desulfurization gypsum on the engineering properties of ternary geopolymers: Improving the utilization of industrial wastes. J. Clean. Prod. 2023, 414, 137638. [Google Scholar] [CrossRef]
  50. Caillahua, M.C.; Moura, F.J. Technical feasibility for use of FGD gypsum as an additive setting time retarder for Portland cement. J. Mater. Res. Technol. 2018, 7, 190–197. [Google Scholar] [CrossRef]
  51. Wang, Z.; Zhao, N. Influence of coal gangue aggregate grading on strength properties of concrete. Wuhan Univ. J. Nat. Sci. 2015, 20, 66–72. [Google Scholar] [CrossRef]
  52. Tabsh, S.W.; Abdelfatah, A.S. Influence of recycled concrete aggregates on strength properties of concrete. Constr. Build. Mater. 2009, 23, 1163–1167. [Google Scholar] [CrossRef]
  53. Zhao, Y.-H.; Ran, H.-Y.; Feng, G.-R.; Guo, Y.-X.; Fan, Y.-J. Study on damage evolution and damage characteristics of gangue cemented filler with different aspect ratios under uniaxial compression. J. Min. Saf. Eng. 2022, 39, 674–682. [Google Scholar]
  54. Feng, G.; Du, X.; Zhang, Y. “Optical-acoustic-stress” responses in failure progress of cemented gangue-fly ash backfill material under uniaxial compression. Nondestruct. Test. Eval. 2019, 34, 135–146. [Google Scholar] [CrossRef]
  55. Feng, G.-R.; Xie, W.-S.; Guo, Y.-X.; Guo, J.; Ran, H.-Y.; Zhao, Y.-H. Influence of early loading on gangue cemented filling physical and mechanical properties and damage disruption. Chin. J. Rock Mech. Eng. 2022, 41, 775–784. [Google Scholar]
  56. Zhang, N.; Li, H.-X.; Liu, X.-M. Hydration kinetics of cementitious materials composed of red mud and coal gangue. Int. J. Miner. Metall. Mater. 2016, 23, 1215–1224. [Google Scholar] [CrossRef]
  57. Liu, S.-L.; Wang, Y.-M.; Wu, A.-X.; Zhang, M.-Z.; Wang, Z.-K.; Wu, L.-B. Leaching behavior and curing mechanism of red mud composite filling materials. Acta Mater. Compos. Sin. 2023, 40, 6736–6746. [Google Scholar]
  58. Zhang, N.; Sun, H.; Liu, X.; Zhang, J. Early-age characteristics of red mud–coal gangue cementitious material. J. Hazard. Mater. 2009, 167, 927–932. [Google Scholar] [CrossRef]
  59. Thommes, M.; Kaneko, K.; Neimark, A.V.; Olivier, J.P.; Rodriguez-Reinoso, F.; Rouquerol, J.; Sing, K.S.W. Physisorption of gases, with special reference to the evaluation of surface area and pore size distribution (IUPAC Technical Report). Pure Appl. Chem. 2015, 87, 1051–1069. [Google Scholar] [CrossRef]
  60. Koshy, N.; Dondrob, K.; Hu, L.; Wen, Q.; Meegoda, J.N. Synthesis and characterization of geopolymers derived from coal gangue, fly ash and red mud. Constr. Build. Mater. 2019, 206, 287–296. [Google Scholar] [CrossRef]
  61. GB 8978 1996; Comprehensive Sewage Discharge Standards. China Standard Press: Beijing, China, 1996.
  62. Mukiza, E.; Liu, X.; Zhang, L.; Zhang, N. Preparation and characterization of a red mud-based road base material: Strength formation mechanism and leaching characteristics. Constr. Build. Mater. 2019, 220, 297–307. [Google Scholar] [CrossRef]
  63. Yin, L.; Boqiang, C.; Changxiang, W.; Yao, L.; Ning, J.; Zhanxin, L. Effect of Desulfurization Gypsum and Quicklime on Performance of Fly Ash Filling Paste. In Proceedings of the 9th China-Russia Symposium “Coal in the 21st Century: Mining, Intelligent Equipment and Environment Protection” (COAL 2018), Qingdao, China, 18–21 October 2018; Atlantis Press: Amsterdam, The Netherlands, 2018; pp. 262–269. [Google Scholar]
  64. Ruan, S.; Liu, L.; Zhu, M.; Shao, C.; Xie, L.; Hou, D. Application of desulfurization gypsum as activator for modified magnesium slag-fly ash cemented paste backfill material. Sci. Total Environ. 2023, 869, 161631. [Google Scholar] [CrossRef] [PubMed]
Figure 1. XRD patterns of RM (a), CG (b), FGD (c) and PC (d).
Sustainability 15 15532 g001
Figure 2. Particle size distribution of RM and CGP.
Sustainability 15 15532 g002
Figure 3. Experimental flow chart.
Sustainability 15 15532 g003
Figure 4. Factor mean plot of levels.
Sustainability 15 15532 g004
Figure 5. Preparation of specimens and experiments: (a) Specimens during the curing period; (b) Uniaxial compression test.
Sustainability 15 15532 g005
Figure 6. Compressive strength of RMC.
Sustainability 15 15532 g006
Figure 7. Failure forms of backfill specimens of RMC8.
Sustainability 15 15532 g007
Figure 8. XRD patterns of RMC3, RMC8, RMC11, and RMC15 after 28 curing days (Q: quartz; H: hematite; E: ettringite; G: gmelinite; P: portlandite; C: calcite; L: lawsonite; K: kroehnkite).
Sustainability 15 15532 g008
Figure 9. Adsorption/desorption isotherms of RMC at 28 days of curing.
Sustainability 15 15532 g009
Figure 10. Pore size distribution of RMC at 28 days of curing.
Sustainability 15 15532 g010
Figure 11. Pore size distribution of simulated specimens.
Sustainability 15 15532 g011
Figure 12. SEM images of RMC8 cured for different ages: (a) 3 d; (b) 7 d; and (c) 28 d.
Sustainability 15 15532 g012
Figure 13. Modeling of RMC hydration processes.
Sustainability 15 15532 g013
Table 1. Chemical compositions of raw materials.
Components
(wt%)
Fe2O3Al2O3SiO2Na2OTiO2CaOSO3P2O5K2O
RM49.8419.3312.208.537.930.870.550.190.16
CG6.0222.0961.260.951.552.690.230.153.42
FGD0.000.030.040.060.0049.1950.640.000.00
PC3.354.2216.150.210.4268.773.410.080.67
Table 2. Arrangement of experiment factors and levels.
LevelFactorsC1C2
X1X2X3
18:01%0.471:41:1:3
28:02%0.491:41:1:3
38:03%0.511:41:1:3
48:04%0.531:41:1:3
57:11%0.491:41:1:3
67:12%0.471:41:1:3
77:13%0.531:41:1:3
87:14%0.511:41:1:3
96:21%0.511:41:1:3
106:22%0.531:41:1:3
116:23%0.471:41:1:3
126:24%0.491:41:1:3
135:31%0.531:41:1:3
145:32%0.511:41:1:3
155:33%0.491:41:1:3
165:34%0.471:41:1:3
Table 3. Results of orthogonal design.
LevelSlump
(mm)
Extension
(mm)
Setting Time (min)
Initial TimeFinal Time
RMC112109125234
RMC 231117157267
RMC 3189151173327
RMC 4221222196342
RMC 5232205237332
RMC 6228188235347
RMC 7250246249373
RMC 8225213253385
RMC 9255338246363
RMC 10288431268399
RMC 11245214281380
RMC 12269269304422
RMC 13245385278392
RMC 14255327295412
RMC 15263252312437
RMC 16249226331454
Table 4. Analysis of extreme liquidity differences.
IndicatorSlump/mmExtension/mm
X1X2X3X1X2X3
k1113.25186183.5149.75259.25184.25
k2233.75200.5198.75213265.75210.75
k3264.25236.75231313215.75257.25
k4253241251297.5232.5321
R1515567.5163.2550136.75
Table 5. Analysis of the extreme differences in setting time.
IndicatorInitial Setting Time/minFinal Setting Time/min
X1X2X3X1X2X3
k1162.75221.5243292.5330.25353.75
k2243.5238.75252.5359.25356.25364.5
k3274.75253.75241.75391379.25371.75
k4304271247.75423.75400.75376.5
R141.2549.510.75131.2570.522.75
Table 6. Results of leachate testing.
SampleLeaching Ion (mg/L)pHConductivity
(ms/cm)
AsCdCrPbMnCuHg
RM0.0335<0.00120.145<0.00420.01720.01080.000012.341.9
RMC30.0106<0.00120.133<0.0042<0.00360.02230.000510.374.2
RMC80.0056<0.00120.0754<0.0042<0.00360.01180. 000410.553.7
RMC110.0053<0.00120.0780<0.0042<0.00360.00780. 000110.343.2
RMC150.0034<0.00120.0802<0.0042<0.00360.00600. 000110.173.0
GB8978-1996 limits0.50.11.51.02.00.50.05//
Disclaimer/Publisher’s Note: The statements, opinions and data contained in all publications are solely those of the individual author(s) and contributor(s) and not of MDPI and/or the editor(s). MDPI and/or the editor(s) disclaim responsibility for any injury to people or property resulting from any ideas, methods, instructions or products referred to in the content.

