1. Introduction
Wetland ecosystems represent a vital global resource and provide a wide range of ecosystem services. However, wetland areas are declining across the globe, in part due to increased urbanization and its associated pressures for land conversion [
1]. In this context, sustainable design approaches that holistically map, maximise and link urban and wetland ecosystem services may help mitigate threats to this ecosystem while accommodating both urban and wetland growth. This paper details the development and testing of an interactive tool designed to foster sustainable strategies for conserving and expanding wetlands amidst urban development. The tool targets early design stages, providing a simple graphical interface and a system-level assessment method holistically accounting for a multitude of urban and wetland services. This complements other existing modelling approaches by: focusing on systemic urban-wetland interdependencies; providing an accessible graphical interface and system map; including small-scale and user behaviour aspects; and alternative wetland uses.
The vast majority of existing models are more detailed in terms of inputs and calculations but focus on a limited number of functions and benefits rather than systemic links. Some examples include the SUWMBA V2 2020 model [
2] which focuses on site-scale water cycles, and energy modelling software such as PHPP V9.6a [
3] or INFEWS V2020.1 [
4] which focuses on benefit cost analysis for water-sensitive urban designs. The tool is designed to provide an overview of the relationships between these different sub-systems and allows for inputs to be adjusted according to more accurate calculations conducted with other software.
The need for tools that manage trade-offs in a systemic way is also highlighted by Hamel et al. [
5] and He et al. [
6], who propose similar holistic modelling approaches. InVEST V3.13.0 [
5] is a GIS-based software that combines various models (including urban, green infrastructure, and community functions) to assess trade-offs, benefits, and ecosystem service provision and can include but is not exclusively focused on wetlands. The software combines the individual models via GIS mapping, but each assessment is modelled separately, and use of the software requires specific modelling skills. In contrast, while the urban-wetland tool does require some general knowledge for user inputs, the graphical interface and its design make it intuitive and accessible for a wider range of users, with no specific modelling skills required. In terms of outputs, despite the exclusive focus on coastal wetlands, the tool includes impacts of user behaviour (e.g., water consumption), provides information regarding per-person consumption, benefits, and costs, and includes alternative wetland uses such as mangrove-derived foods, highlighting ecosystem functions less commonly considered for wetland services models. The tool provides an alternative perspective, complementing the larger scales and conventional ecosystem functions included in other software (e.g., InVEST) with small-scale user-centred approaches and alternative wetland uses. Focusing specifically on urban wetlands, He et al. [
6] highlight the potential for integrating ecosystem functions and valuation within building information models (BIM). Connecting spatial design and wetland functions across scales directly through BIM would indeed provide a valuable way of parametrically designing to maximise wetland services. However, this is an emerging research direction and has yet to be implemented in practise. In this regard, the tool methodology could be interpreted as a stepping stone, with the assessment criteria and approach in general providing a potential direction for future BIM implementation methods.
This paper builds on a previously published literature review and analysis [
7], which mapped urban-wetland interactions and developed a graphical system thinking concept map describing urban-wetland relations as a single connected system. The concept map was based on a comparative analysis of key state-of-the-art theoretical urban design principles, which were then used to link urban functions with practical design parameters and wetland functions. The theoretical background and current state of research in this area are discussed in detail in the review paper (see [
7]), which also identified two key opportunities and further research directions.
The first opportunity identified was that the integration of practical parameters allows for the map to be weighted quantitatively, providing further definition regarding the links and contributions of each sub-node to the entire system. A second, further opportunity consists of adapting the permaculture “fair share” (FS) ethical principle, which implies a fair distribution of resources and surplus to support people and nature [
7,
8]. Within the tool, FS ratios (percentages) are used as indicators for the degree of contribution of natural, urban, and hybrid functions supporting the system. The use of the FS ratio as an assessment criterion allows for various quantitative inputs to be normalized, thus providing a homogenous and simple method of assessing the contribution of individual nodes as well as the system-wide division of supporting urban, ecological, and hybrid elements.
Small-scale development, especially when located within conservation area buffer zones, can have a marked impact on the future development of conservation areas, having the potential to limit climate change adaptation strategies for flora and fauna [
7]. At the same time, given the profit-driven and time-constrained nature of small-scale development, managing complex urban-ecological interactions by involving various experts within an interdisciplinary design team may be an untenable strategy towards practically achieving synergies between natural wetlands and urban developments.
In this context, the development of the concept map as a design and planning tool that relies on quantitative information but provides system-level assessment criteria may create opportunities for managing complexity and achieving synergies between small-scale development and adjacent wetland areas. Additionally, the application of the FS principle for weighting inputs presents an opportunity for early-stage assessment of benefit-cost (BC) contributions using a weighted average approach. This responds directly to the profit-driven nature of small development and, by assigning monetary value to ecological services, may aid in creating and highlighting incentives for more ecologically sound solutions.
To achieve this, an algorithm that allows the input of quantitative values and expresses the weighted FS and BC contributions for each of the concept map nodes was developed. Given that managing complexity was a key challenge identified for small developers [
9], the algorithm was integrated within an interactive digital tool that allows user input and provides a graphical interface for visualizing the impact of various design parameters through the concept map.
In overview, the tool focuses on small-scale development and aims to provide an interface that targets decision-makers in early design stages, helps manage complexity, and provides a method of assessing design directions in terms of their BC ratios and potential ecological impact (FS ratio).
To test and optimise the design of the tool, an Australian case study site was used (
Figure 1). The site was selected based on two key criteria: proximity to a natural wetland conservation area and opportunity for small-scale development. The selected plot is located near the northern border of the Gold Coast administrative area of SE Queensland, with the region being located along the corridor linking Brisbane to the City of Gold Coast.
Although presently characterised by rural and agricultural development, the area’s strategic location along the Brisbane-Gold Coast corridor suggests a high likelihood of future suburban residential expansion. This study site has a total area of approximately 7 ha and adjoins the Moreton Bay RAMSAR reserve, Cabbage Tree Point Conservation Park, and the residential area of Cabbage Tree Point (
Figure 1). Its positioning, therefore, meets the two selection criteria. Additionally, proximity to the RAMSAR international reserve provides a further opportunity to explore the potential of supporting global wetland networks through adjacent small-scale development.
3. Model and Interface Development
This section describes the weighting algorithm modelling phase and interface development that relate directly to the main tool inputs and calculations for individual sub-branches. The underlying calculations and assumptions for each area type are detailed in the
Supplementary Files—File S1. The user-defined design specification and site characteristics inputs relate to the so-called food, water, and energy nexus as well as urban land use and building typologies. The impact of these decisions at the urban level is detailed below and can be traced across natural ecosystem service contribution percentages derived through the urban and natural area calculations described below as well as FS and BC ratio calculations (see
Section 5). The tool, therefore, includes animals and plants as functional ecosystem service providers and inhabitants of the urban-wetland system.
3.1. Urban Development Areas
According to the classification derived from the concept map and associated theoretical principles, the system functions considered were split into three distinct categories: natural, hybrid, and urban functions. The three categories are applied to all functions that support five key system purposes: protection, productivity, transmission, security, and community (see [
7]). Urban development area calculations include all strictly urban areas such as housing or access roads but also include some hybrid technical areas such as constructed wetlands for water filtration, roof raingardens, or renewable energy infrastructure. The hybrid areas included here are considered a spatial subtype of urban development because, although they may aid in increasing biodiversity (e.g., constructed wetland) or decreasing overall resource consumption (e.g., energy infrastructure), the sub-systems connect directly to the functioning of urban fabric and are linked only indirectly to ecosystem processes.
The tool calculates total urban areas and their associated footprints (see
File S1—3.1) as a sum of three types of urban areas: housing, access, and community. Technical areas are not added to the total urban footprint calculation but form a subcategory of urban-hybrid footprints. The extent to which the addition of these urban-hybrid functions can help tilt the balance of the resulting urban versus natural footprint can be tracked within the concept map across several nodes, such as food and water supply, rainwater catchment areas, or as a means of diversifying site functions to include research, education, and alternative revenue streams. The areas required for each of the four functional types (housing, access, community, and technical urban-hybrid) vary according to the specifications selected in the interface. The tool specification options and system-level implications for each of the four functional types are described below.
3.1.1. Housing Areas
The calculation for required housing areas is dependent on the number of people inhabiting a given site and user options for the compactness of the design. The number of occupants can be selected through the interface. The compactness options define low and medium floor area per person requirements based on Australian averages and high compactness required area per UK Nationally described space standards [
11]. Within the tool, the low, medium, and high compactness options correspond to single-detached, duplex, shop-top, and high-rise housing typologies.
The resulting total housing areas (see
File S1—3.1.1) represent gross internal areas calculated as a function of the selected number of people and compactness options. However, in terms of defining the urban-natural balance, building footprints represent a more robust metric. A generic, indicative occupancy and massing were therefore assumed for each of the compactness scenarios (
Figure 4).
In the context of the case study site, the low and medium compactness options reflect a business-as-usual scenario for the area, while the high compactness allows exploration of medium-rise (3–6 storeys) and high-rise (7+ storeys) options as defined through local planning guidelines [
12].
The housing footprints and areas calculated connect directly to the energy demand of the site (see
Section 3.3.3) and, in conjunction with the access and community space options discussed in the following sections, reflect the total urban footprint of a proposed development. Additionally, the potential to enhance ecosystem services through urban insertions will vary depending on the relative location of the wetland ecosystem. The tool provides options for locating housing along four key site elevation zones (
Figure 4D). The housing area assigned to each zone is calculated as an even split. Although real-life scenarios would likely entail uneven distribution, the assumption allows for exploring system impacts. For example, locating stilt housing within wetland areas can contribute to coastal protection by enhancing accretion or forming wind and wave buffers. This may imply higher costs for foundations and limitations in terms of achievable heights and the number of units. However, inhabiting only dryland areas entails a smaller number of interventions supporting coastal protection and redundancies for the system. This may result in increased stress on the ecosystem and an overall less robust system that lacks redundancies. These trade-offs can be assessed through the concept map and can inform decision-making in later project stages.
3.1.2. Access Areas
The interface provides options for access and transport types required, which may aid in decreasing the total urban footprint and may have an impact on the type of community inhabiting the site. In relation to the above example of the impacts of housing location along site gradients, a potential solution to obtaining a higher number of units (higher occupancy) while also accounting for cost savings, redundancy, and additional coastal protection interventions may entail retaining denser housing typologies within dryland areas but deploying light access infrastructure to support wetland areas. The tool, therefore, allows a degree of exploration through access and transport options. Access type options include private, mixed, and public access to the site, while transport options allow for provisioning for car, boat, or walking/cycling access (see
Figure 4C). Each of the options assumes a different distribution and associated access footprint based on the selected housing area typology (see
File S1—3.1.2).
Depending on the transport type selected (car, boat, cycling/walking), infrastructure relating to each transport mode would be included or omitted from the calculation of the total access area footprint. Although the access area calculation is a rough estimate, it provides an indication of the scale and contribution of different access scenarios to the overall urban footprint, as well as other systemic implications for other functions of the site. An example is the impact that the location and type of access can have on the recreation and environmental quality (community health) values assigned to the site. These functions are supported by alternative transport means that are linked to outdoor activities and can be enhanced by considering alternative access scenarios. A second relevant example is that of nearshore area access paths, which can positively contribute to coastal protection measures. However, the coastal protection benefit needs to be balanced against the impact on the transmission functions. Under the transmission-infrastructure impact sub-node, the proportion of areas affected or altered by urban interventions is weighed against the number of natural tidal creek areas, giving an indication of the scale of the urban impact on the natural system. Highlighting these multiple impacts and interactions can help optimise design to achieve a healthier, more diverse, and more productive profile for a given site.
3.1.3. Technical Urban-Hybrid Areas
Technical urban-hybrid areas, as previously described, relate to infrastructure that provides some biodiversity or consumption reduction benefit but does not directly connect with the natural ecosystem. The urban-hybrid areas that entail an additional hybrid footprint are those of water and energy infrastructure, with roof raingardens and vertical farms assumed to be integrated within the design of the housing areas, thus creating no additional footprint. The areas for raingardens and vertical farms, however, have an impact on the overall system character and can impact flood and storm surge protection strategies as well as the overall research or education potential of the site.
The interface provides several options for constructed wetland types and food species cultivated in the vertical farm, while the options for roof raingardens only allow for inclusion or exclusion. Constructed wetland and vertical farm areas are therefore calculated according to the food and water demands of the site, considering the filtering capacity of wetlands and the yield of selected vertical farm species. The calculations and assumptions for food, water, and energy are discussed separately in
File S1—3.3. If included, roof raingardens are assumed to cover the entire roof of all housing units, the area being a function of the compactness options and site occupancy discussed above.
Technical areas such as wetlands, raingardens, or vertical farms connect to the system community node and contribute to the site’s potential use for research and education. The potential use of these site areas for research and education creates a further link to the productivity node, mapping the potential revenue diversity of the site. At the same time, from an ecological perspective, the technical areas help to increase diversity and create additional habitat for plants and animals. This impact can also be mapped under the plant and animal diversity nodes linked to overall site productivity.
Roof raingardens and constructed wetlands also have an impact on the storm protection function of the site. The contribution of each area can be assessed under the urban catchment node of the concept map, which considers the number of permeable surfaces that act to mitigate runoff during storms, therefore decreasing flood risk.
Additionally, the vertical farming areas play a role in achieving system resilience in terms of food security by diversifying food supply sources and types. The water and energy infrastructure areas play a similar role, aiding to diversify water supply and treatment methods, ensuring redundancies for energy supply, as well as providing cost savings and ecological benefits.
Figure 5 provides a visual representation of the nodes discussed above and highlights which subsystems they can contribute to.
3.1.4. Community Areas
The tool provides a series of options relating to wetland-derived community activities (e.g., wetland citizen science research, educational activities, leisure, mangrove food and dye processing, ecotourism, etc.) as possible alternative site uses and potential additional revenue streams for the inhabitants of the site. Community areas include generic community areas and community research, education, and retail areas.
The generic community space options are linked to the recreation and community interaction nodes of the system map, allowing for the selection of either indoor or outdoor space provision (
Figure 6). The tool aims to provide flexibility for the use and activity types associated with community spaces, considering potential uses as reading rooms, show rooms, meeting rooms, or coworking spaces. Due to the type of potential uses considered, indoor community spaces are linked to the community interaction map node and are weighted against outdoor research, education, and retail community areas, reflecting the balance of human-to-human and human-to-nature degrees of interaction specific to the design. If selected, the generic outdoor community space is counted as a hybrid type of land use and aims to provide outdoor community recreation areas that accommodate outdoor picnic areas. The recreation potential of the site can be assessed from the community point of view as the ratio and balance between outdoor natural areas and the sum of outdoor community, cycling, footpath, and shared tidal creek (water access) areas.
The options for community research and monitoring relate to specific site areas, which may provide data of research interest. Depending on the combination of selected areas and uses, the sites’ research potential can be assessed in terms of the balance of contribution between urban, hybrid, or natural areas of the site.
For the urban environment, monitoring of energy-efficient housing, roof raingarden, and constructed wetland performance is considered. For hybrid land use monitoring and research around sustainable on-site farming such as vertical dryland farms as well as salt marsh, mangrove, and nearshore-derived food cultures, these were considered and integrated within the interface options. Lastly, monitoring and research surrounding natural habitats in connection with the RAMSAR and local conservation area were considered.
In terms of the total urban footprint component, research activities in constructed wetland, natural, and hybrid cultured wetland areas entail the insertion of additional infrastructure for access and maintenance (see
File S1—3.1.4 for assumptions and dimensions). Therefore, the tool calculation of the total urban area necessary to accommodate the various community options may be used to assess the resulting urban-ecological balance of specific designs. At the same time, the individual area type calculations that form the sum total urban footprint allow for mapping interrelations and assessing trade-offs between community and ecological benefits via the concept map. This allows for selecting and optimising general design strategies that may be used in later spatial design processes.
3.2. Natural Environment Areas
Natural area calculations provide a counterpoint to the previously discussed urban development areas and are used to highlight the balance of contribution between urban and natural elements to the system as a whole, using footprints. Natural areas fall into four different categories, which subdivide the site based on elevation and, implicitly, salinity, PH, and inundation levels and frequency. The four categories are dryland, salt marsh, mangrove, and nearshore areas, of which the last three form the wetland ecosystem (
Figure 7).
Dryland areas refer to areas not subject to tidal inundation. Salt marsh and mangrove areas are characterised by infrequent and frequent inundation, respectively, while nearshore areas are permanently submerged. The gradient of inundation and the hydrological cycle in turn determine the salinity and other soil characteristics that have been linked to vegetation distribution in various research studies over the past decades [
13]. Although the biological processes impacting vegetation distribution are complex, site zoning based on elevation and inundation frequency provides a good indication of possible distribution and natural area extents. The extent and type of vegetation are important factors in determining the type and amount of contribution each natural area can make to the entire system.
Total natural areas are calculated as a sum of user inputs regarding the initial extent (m
2) of each natural site zone from which urban and hybrid areas are subtracted based on the specific design configuration and urban footprints assigned to each zone. In terms of hybrid areas, the natural environment includes hybrid area subgroups used for alternative food cultures. In line with the approach detailed for urban-hybrid areas, natural-hybrids form a distinct sub-category and are subtracted from the total natural footprint calculation. In contrast to urban-hybrid areas, natural-hybrid subtypes connect directly to the surrounding ecosystem, sharing hydrological and nutrient cycles. For this reason, all hybrid culture options included within the tool focus on sustainable farming techniques (e.g., techniques that do not require external nutrient and fertilizer inputs) using adapted and endemic species as alternative nutrient sources. The specific calculations for natural-hybrid areas are discussed in
File S1—3.3.1 as part of the food-water-energy nexus [
14].
Preliminary findings derived from the initial development of the tool showed that of the services and functions identified through the literature review, 48% can be supported through hybrid urban-ecological processes and applications, 27% can be supported strictly by natural ecosystems, and only 25% require strictly urban processes and applications [
9]. This indicates a high potential for providing a large portion of urban services via natural and hybrid processes and infrastructure. Compared to traditional approaches, where most of these services do not contribute to the conservation and expansion of surrounding ecosystems, maximising the use of natural and hybrid services opens the possibility for urban development to support and enhance adjoining ecosystems through a higher degree of urban-natural symbiosis, which would benefit both the natural and the urban.
Figure 8 provides an example, highlighting the system-wide impacts that natural and hybrid mangrove areas can have. As evidenced in the diagram, mangrove areas can partly support all the key urban system purposes identified.
From coastal protection strategies to food production, alternative leisure activities, community building, and creating research and education interest, hybrid and natural mangrove areas could provide a huge number of services that can be exploited through sensible design strategies. At the same time, implementing and simultaneously harnessing all these services depends on a balanced approach, careful consideration of both natural and urban needs, and the complex interrelationships that define them.
In terms of mediating urban-natural interactions, hybrid processes and infrastructure can provide a valuable connection point, as evidenced by the large number of services and functions that they support. From the perspective of urban use of the site, the combined hybrid infrastructures and applications describe the food-water-energy nexus and how the sites’ resources are managed. The following section discusses the impacts of urban and natural-hybrid food, water, and energy systems and available tool options, with calculations and assumptions detailed in
File S1—3.3.
3.3. Food, Water, and Energy Nexus
Urban and natural footprint balances have a marked impact on the type of community, research, education, and revenue potential, as well as the type of ecosystem services that can be supported. The way in which these activities and the site inhabitants relate to the ecological resources of the site is important in terms of achieving synergies and maintaining a balanced human-natural use of the site. These aspects are further discussed here through the lens of the food, water, and energy nexus.
The in-tool options for food, energy, and water can be adjusted through the “People” tab, which relates to the use of the site by people and links to the output map and system-wide impacts, as well as the “Plants” and “Animals” tabs through the on-site food culture options.
Figure 9 shows a snapshot of the interface and identifies the various menus in relation to each of the three topics.
In terms of the systemic impact of these options, the food, water, and energy subsystems connect primarily to the transmission and security nodes of the map, which can be used to assess the balance of on-versus off-site resource use as well as the overall independence and potential resilience of the system achieved through diversifying resource supply. As seen in the previous section, there are also various secondary implications in terms of opportunities for community activities, coastal protection, and increased productivity for the site.
All three categories include both resource supply and waste or recycling streams. For energy, this entails energy production and excess energy, which could be stored or sold back to the grid. Water services, mains, and alternative supply sources are considered in conjunction with the resulting wastewater, which can be recycled for toilet use or fed into the main sewage system as waste. For food production, off- and on-site food supply are considered in conjunction with the different resulting household waste types, which, depending on the waste type, can be recycled off-site or, for organic waste, reused in situ.
The calculations for supply and demand for each of the three systems are based on per person demands and an adjustable target percentage of the demand that is met through on-site applications, assuming that the total demand is met fully throughout the year. Given that the performance of water filtration and energy generation systems depends on the technology used, various combinations of water and energy generation technologies can be selected through the top drop-down menus (
Figure 9D). Assumptions, options, and calculation methods for each subsystem are described in more detail in
File S1—3.3.
3.3.1. Food
The concept map and identified links reveal that food sub-systems, especially on-site hybrid culture areas, have multiple implications relating to all five system purposes. To assess and weigh the corresponding system nodes, the tool uses per-person demands to calculate required crop areas and resulting waste streams (see
File S1—3.3.1) based on a series of possible user options.
Food sourcing can be tailored based on user input within the “People” tab of the interface (see
Figure 9C
2). The percentage of the total demand to be produced via on-site cultures can be adjusted for each food group, determining the on-site food demand as a function of the total yearly demand for a given number of site occupants. The on-site food production targets relate to more detailed options in the “Plants” and “Animals” tabs, which allow for selecting cultured species (see
File S2 for a species list) and provide information regarding required culture areas and energy values for each species. The general food options menu (
Figure 9C
1) allows users to select the types of cultures by wetland zone. Further to the selection of species and adjustment of on-site production percentages, the required crop area for each selected species is displayed in the afferent plant or animal tab (
Figure 10).
The detailed information provided in the animal and plant tabs can help tailor on-site food supply strategies and understand the relationship between food demand, plant yields, nutrition values, and required crop areas. For example, crop species can be strategically selected to minimise crop areas while maximising the nutritional value and diversity of the crop. At the same time, the editable base data file allows for flexibility and can be adjusted based on crop optimisation software output or to include endemic species for different site locations.
The concept map, on the other hand, allows for an understanding of how cultured areas affect the overall performance of the system through hybrid, natural, and urban system balances and possible benefits for each sub-system. Further opportunities relating to community activities, possible alternative revenue streams, research and education potential, coastal protection opportunities, and resource diversification can also be linked to hybrid food culture areas. The implications and opportunities vary depending on the cultured species, their location within the four site zones, and the type of agriculture practised. For example, innovative or sustainable farming practises may play a role in the site’s research and educational values, while the culture of endemic or unusual food species may create opportunities for on-site retail and other revenue-generating activities. Therefore, the tool outcomes and analysis can inform on-site food production design decisions and strategies in relation to both sub-system optimisation (optimal crop selection and areas) and whole system implications (e.g., community, research, or educational benefits).
In conjunction with food production strategies, the tool provides several waste management options, including composting, the use of crop residues as feed, and the use of farm manure as fertilizer (see
Figure 9C
2). In terms of the systemic implications, waste streams, composting, and feed recycling options impact cost savings (see
Section 6.3 and
File S6), as well as natural-urban balances supporting transmission and security system purposes through waste reduction and creating incentives to minimize non-native feed and fertilizer use and their impact on the health of adjoining ecosystems.
3.3.2. Water
Water sourcing, supply, and waste stream treatments are key design factors that influence the resilience of the system as a whole as well as having an impact on resource use and possible environmental contributions that offset this use. In relation to this, the tool provides various options for exploring the system-wide implications of both conventional and alternative water supply and treatment strategies (
Figure 11). The impact of each option is dependent on its quantitative weight, which is calculated based on some basic assumptions and formulae detailed in
File S1—3.3.2.
All the water treatment options are based on technologies that can be used to generate potable water from their respective sources. Less common applications such as grey to drinking water conversion through combined wetland and purifying filtration [
15] as well as low-tech options such as solar distillation [
16] were included in the technology list among examples of typical small-scale RO desalination units and wetland configurations reflecting the major types of constructed wetlands (e.g., free, subsurface, horizontal, and vertical constructed wetlands). While the list is not exhaustive, the selection currently included in the tool (see
File S3) represents the key technology types presently available for small-scale use and allows for assessing the overall difference in terms of water output, required footprints, contribution to the system, and overall health of the surrounding environment. Excess supply also has an impact on system resilience via the security purpose node, where excess water and energy contribute to diversifying security functions and improving FS ratios. Similarly, the tool assigns monetary equivalent benefits (current market cost) from excess supply, which can improve the BC ratio of the security purpose node (see also
Section 6.4).
Aside from the supply and treatment of water for human use, the tool also considers natural waterways and their role in maintaining continuous, healthy nutrient cycles. The total area of a site’s natural tidal creeks can be introduced through the interface and is weighted against total areas of shared waterways (e.g., for boating or agricultural usage) and urban infrastructure as contribution (FS) percentages. As nutrient cycles are complex processes and are not contained within rigid spatial boundaries, the tool only accounts for the afferent area that supports nutrient cycles but not nutrient compositions and levels. However, numerically comparing natural and hybrid use area sizes offers an indication as to the levels of disturbance that specific design options might create.
3.3.3. Energy
Energy consumption is the third major way in which people interact with and may utilise the natural resources of the site. At a systemic level, energy production impacts the site’s urban-natural balance, with off-site energy generation categorised as an urban function, regardless of the type of municipal or other public infrastructure. This is in line with theoretical principles and system aims of maximising site usage, as well as redundancies identified through the literature review underpinning the development of the concept map. Source diversity and redundancies impact the resilience of the system, linking to the sites’ overall security measures. At the same time, on-site energy infrastructure may also present opportunities to improve wetland processes through strategic placements that work with existing hydrological cycles.
Energy demand is closely linked to the applied construction standard (tool housing options) as well as the performance of appliances. The tool allows for selecting amongst average, good, and best practise construction energy performance standards, with the total demand varying according to the number of people and implicitly required construction areas. To meet the resulting energy demand, energy sourcing options are provided through the interface (
Figure 11). Target percentages for the amounts of energy demand met via four types of conventional and alternative sources (grid, solar, wind, and hydro) can be adjusted. The energy demand calculations (see
File S1—3.3.3) give an indicative consumption value, sufficient for the purpose of exploring the impacts and trade-offs for specific built standards, performance configurations, and choices of energy generation technologies (see
File S4 for products included in the tool). Later design stages should include design and site-specific energy modelling, the results of which could be fed back into the tool for a more accurate calculation and re-evaluation of the FS and BC criteria.
The tool provides insights into the system-wide implications of common alternative energy generation strategies as well as allowing a comparison between the performance and footprints of different currently available products. Key systemic implications include the relationship between investment costs and long-term savings from on-site energy generation, the potential for community research activities in relation to innovative energy generation systems, and, most importantly, the overall system resilience, which can be improved by diversifying energy sources and through added redundancies. At the same time, solutions catering to urban energy demand should be considered in relation to the overall impact on the urban-ecological footprint balance, which in turn impacts the ability of the surrounding ecosystem to provide vital services.
3.4. Summary and Subsystem Level Output
The calculations and assumptions described above define the underlying method for quantitatively weighting the system concept map function nodes (outermost circle of the map diagram). Although several simplifications and assumptions were made, overall, the interface provides ample opportunity for comparative appraisal of different design options, both at the level of system-wide implications and for individual sub-system optimisation.
Due to the complex interrelationships formed, it is not a foregone conclusion that optimising each subsystem individually will lead to the best overall system design outcome. The tool, however, allows for the various system-wide implications and implicit trade-offs between the different site functions and their natural-urban footprint balance to be assessed through the system map.
Although the tool makes specific recommendations for required areas, the recommended areas are not prescriptive in terms of their spatial design. In other words, the strategies derived from the tool output in the early design stages can be further enhanced through considered spatial design. In a spatial design, the idealized tool output areas could be minimized by integrating separate functions within the built fabric or could be divided and distributed across the site to support specific ecosystem functions. The tool, therefore, provides a basis for developing coherent systemic design strategies that inform the goals and priorities considered in later spatial design stages.
To assist with the testing and implementation of the tool outputs in the context of spatial design, the tool provides a subsystem-level output file that can be exported from the interface. The file contains the output calculations for each of the key nodes impacting urban, hybrid, and natural function footprints. The output file summarises calculation outputs in a format that may be used as a design brief component, highlighting required spatial areas and indicative specifications for spatial design.
Figure 12 shows the content, parameters, and overall structure of the output file.
The calculations, interface design, and sub-system outputs presented thus far formed the basis of the initial tool development phase. The testing and improvement of the interface, FS and BC algorithm development, as well as system-level output generated by the tool, are discussed in the following sections.
4. Feedback and Optimisation
The initial tool development phase included partial quantitative calculation scripting and weighting of the system map, interface design and development, and conceptual development of the FS and BC algorithm logic. Following this phase, feedback was sought through two conference presentations and one focus group. While the conference presentations provided a broad range of more informal feedback, the focus group specifically targeted key stakeholders for the case study site and, more generally, the Australian context. The following sections describe the conference presentation and paper content in relation to tool development, feedback, and subsequent optimisation of the tool.
4.1. Conference Presentations
Preliminary findings based on the initial tool development were presented at two conferences in 2021. Both conference presentations included round-table discussions and peer feedback following the presentation sessions. The IAAC Responsive Cities Design with Nature Symposium [
17] was an international conference targeting an expert audience in the field of architecture, specifically the theme of design with nature. The presentation and associated conference paper (see Giurgiu and Baumeister [
9]) introduced the tool development methodology, key interface structure, and features, as well as preliminary testing outcomes.
The second presentation took place at the International Association for Hydro-Environment Engineering and Research’s (IAHR) first conference of the IAHR Queensland Young Professional Network in 2021 and included a published, peer-reviewed extended abstract and presentation [
18]. The event targeted early-career researchers and provided an opportunity for feedback and discussion with senior field-related experts. The presentation focused more on the links and preliminary findings relating to the water and built environment aspects of the tool.
In both cases, the tool was deemed to have the potential to provide relevant information in early design stages and, in particular, to assist in correlating and optimising early design aims to prepare and coordinate interdisciplinary collaborations necessary for later project stages. At the same time, the question of validating results was raised in both discussions with distinct nuances. The IAAC panel raised the question of implementation and aspects such as achieving the envisioned community involvement and necessary lifestyle adjustments in practise, while the IAHR panel focused on validating outputs and calculations, suggesting the use of modelling, and comparing existing cases.
The suggestion for validation via modelling was included in the methodology and forms the topic of future work on spatial testing, as described in
Section 3.1. The practical implementation verification would require further research, which may form a subsequent development stage that goes beyond the proof of concept that the project currently aims to provide.
4.2. Focus Group
While the two conference presentations provided an international and academic perspective revolving around the perceived usefulness of the tool and potential steps to verify results, the formal focus group focused on key stakeholders specific to the Australian context and the chosen case study site. Key stakeholders identified were split into three types of interest groups: ecological, urban, and social. The ecological interest group included animal and ecosystem conservation, permaculture, and climate change adaptation sub-groups. The urban interest group focused on urban development in general and included land developers, local planners, managers, and economic consultants as key sub-groups. Lastly, the social interest group included local farmers, academics, and community engagement experts as key subgroups.
The focus group was structured as a half-day workshop that aimed to bring together a small number of stakeholders, with one or two stakeholders representing each subgroup. The call for participants and information sheet (see
File S5—Information Sheet) were sent to approximately twenty organisations and individuals, and a group of eight stakeholders representing the majority of the sub-groups participated in the workshop (
Figure 13). Due to a lack of response, wildlife conservation, permaculture, and local management groups were not represented at the workshop. However, the combined experience of each interest group was deemed sufficient to provide insight into all aspects of the interest group.
A brief presentation was given, which introduced the tool scope, preliminary findings, and concept for assessment criteria. This was followed by a demonstration of the initial tool, group discussion, and individual testing of the tool by each participant. Following individual testing, each participant was asked to complete a written questionnaire (see
File S5—Questionnaire) addressing four key topics: perceived utility and ease of use of the tool as a planning and design aid; perception of how fairly the agenda of the interest group was represented through the tool; perceived gaps and opportunities for developing the tool; perceived opportunities for other applications of the tool. Following the workshop, a summary of the key topics and feedback points discussed was provided to each of the participants to allow for any corrections or clarifications (see
File S5—Key Discussion Points).
In relation to the interface design, stakeholders indicated that, although it may require some prior training, the interface had an appropriate level of complexity for professionals such as planners, developers, land managers, businesses, academics, and researchers. It was noted that the interface may require further simplification if the intended user group is expanded to include members of the community or other laypersons.
In general, the information provided through the tool was deemed useful, and stakeholders suggested several possible applications for the current format of the tool but also highlighted the potential to adapt the underlying script for other applications. The opportunities for the current format were centred around the use of the tool as a visioning tool for planning applications, an enabler for engagement between stakeholders, or a planning tool for developing existing dryland areas into new wetlands. Alternative applications included adapting the tool for other types of ecosystems and using the tool as an educational module.
Key suggestions for improvements came from the community social sub-group and the developer urban sub-group. From a land developer perspective, it was suggested that FS assessment criteria should be more closely aligned with the current legal, planning, development, and financial context, providing insight into the relationship between the output of the tool and current prescriptive targets, a view that was also supported by the representative for the local farmer sub-group. At the same time, the panel noted that, as an assessment criterion, the FS concept could provide exciting potential to streamline planning processes through the use of a single indicator. The BC assessment criteria were deemed aligned with current practise.
This feedback was subsequently integrated by adjusting the ranges used for the base data files to include local targets such as energy caps, average housing footprints, and spatial regimens. Additionally, the spatial testing design phase will include a comparison between FS and spatial outcomes based on the tool and existing approved proposals in relation to the current planning and development strategies, which should improve correlation and clarify how the FS criteria may relate to the current indicators and strategies.
From the perspective of the community sub-group, it was suggested that the quantitative approach created somewhat of a bias in terms of representing community interests, which are not easily quantifiable. The initial tool version included a prescriptive approach to community spaces, reflecting quantifiable aspects for specific functions. It was suggested that this may be overcome through the tool by providing a simple yes/no option to include, for example, indigenous heritage present or adjacent to the site, which could further be supported through other references external to the tool. This suggestion was integrated partly into the main tool output, which, based on the options selected, provides some guidance in terms of design strategies. Additionally, the approach to community space calculations was adjusted to allow a range of possible functions. A quantifiable footprint can still be calculated as described in the previous sections, but the specific function of community space is not prescriptive.
Overall, both conference presentations and focus group provided a diverse range of feedback from international and local peers as well as key local stakeholders. This allowed for some optimisation of the basic assumptions and underlying workings of the tool, as well as identification of testing strategies and key points to be addressed in the following project phase of spatial testing.
6. Scenario Testing Results
The following test scenarios implement the FS and BC algorithms described and aim to provide further definition of the applicability and interpretation of the proposed assessment criteria and tool output validation. To provide comparison with typical developments in the case study area and a means of validation, a business as usual (BAU) scenario is first developed. Individual testing of the impact of the food-water-energy nexus and community parameters will then be used to determine the optimal BC and FS balances as well as the maximum on-site supply and occupancy levels for each parameter. The optimised individual parameters derived will then be applied concomitantly to assess trade-offs and whole system impacts, with adjustments made to maximise the performance of the system as a whole and derive optimised alternative future development options.
The optimised design options will target two key outcomes: maximising economic benefit and maximising ecosystem footprints and services. Finally, the optimised design options will be compared against the BAU scenario and assessed against the key principles derived from the literature review of theoretical frameworks [
7].
All the design scenarios are based on the spatial dimensions of the Cabbage Tree Point case study site, with a starting site occupancy derived from the residential area adjoining the site. Site dimensions were calculated according to the elevation zones (dryland, salt marsh, mangrove, and nearshore areas) as per the main tool inputs (
Figure 16).
The nearshore area stretches inland from a 35 m distance off the shoreline, matching the extent of adjoining property jetties (
Figure 17), to the average low tide level. The mangrove area was measured from the average low to high tide levels, while the salt marsh area spans from the average high tide to the average king tide level, and dryland occupies the remaining site area.
Although the tool input divisions suggest a distinct separation between zones, mangrove and salt marsh vegetation will mix across both areas, as evidenced by the satellite image overlay seen in
Figure 16. However, the elevation-based zoning provides an educated guess with regard to the degree and frequency of inundation of specific areas of the site and the likelihood of the area accommodating particular vegetation. With regard to inundation, it is interesting to note that the dryland area marked in
Figure 16 was delimited from the average king tide elevation to the historical maximum king tide elevation line, which suggests that the site as well as the adjoining residential area may be prone to flooding in extreme weather conditions.
Elevation data were sourced from the City of Gold Coast Digital Elevation Model (DEM), with a 1 m resolution. Tide levels were calculated as a 20-year average based on Gold Coast Seaway data, with levels adjusted from the tide reference Lowest Astronomical Tide datum (LAT) to the Australian Height Datum (AHD).
In terms of the planning context and existing site zoning, the case study site area was expanded beyond the existing prescribed lots to include the tidal creek bordering the north-eastern side of the plot, a feature that may impact BC and FS balances. Currently, the north-eastern area of the site is zoned partly as a conservation area (Cabbage Tree Point Conservation Park) and partly as a rural zone, with the rest of the site zoned as a waterfront and marine industry zone. Both conservation and rural zoning codes limit development density to a dwelling with a maximum height of 9 m; however, the waterfront and marine industry codes limit building height to 15 m but have no restriction on density [
19]. While the scenarios interpret the entire site area as a single development plot, existing codes are taken into account within the BAU scenario and final scenario comparison and analysis.
The occupancy levels of the scenarios were derived from the Cabbage Tree Point residential area adjacent to this study site. The residential area has a mixture of single- and double-story detached dwellings, broadly matching the low and medium compactness options included in the tool. An area of approximately the same size as this study site dryland area was considered to determine the site occupancy (
Figure 17). To estimate occupancy levels, each single-story building was assigned as a single household, while two-story dwellings were assigned as two households, each with an average occupancy of 2.5 persons per household [
20]. The total occupancy of the 3.26 ha dryland site was thus estimated at 170 people, which is equivalent to an occupancy of c.a. 52 people per ha and is further used to inform tool inputs for each scenario.
6.1. Business as Usual (BAU) Scenario
The BAU reference scenario envisages the redevelopment of the site as a residential area. The scenario is based on the 52 people/ha occupancy and single detached dwelling typology of the adjoining residential area. Given the rising population, urbanization, and housing demand, the existing rural and waterfront/marine industry zones may be repurposed as residential areas in the future, resulting in an urban configuration similar to the existing neighbouring areas (
Figure 17). The redevelopment of the adjoining agricultural areas has been under constant debate over the past years, including proposals for new satellite cities [
21] and industrial estates [
22]. Given the shorefront location, however, we deemed it more likely that this study site will be converted to residential rather than industrial use. The BAU scenario assumes the retention of Cabbage Tree Point Conservation Park as a conservation area and the infilling and urbanisation of the remaining site area, leading to a total development area of ca 5 ha and an occupancy of 260 people.
To reflect the configuration of existing development types in the area, the BAU scenario incorporates low compactness (the tool equivalent of single detached dwelling typology), private-type car-based access, and average values for the building standards relating to energy and water consumption. Energy and water supply are also based on the current typical configurations in the area and assumed to be entirely grid-based, respectively, with no food being grown on site.
The scenario does not include any on-site waste recycling, alternative flood/coastal protection measures (e.g., green roofs, permeable paving, etc.), or community education and research spaces. It also assumes that the development is not used for rental purposes.
Based on these inputs, the resulting FS ratios indicate that the system is supported by a total of 71% urban, 29% natural, and no hybrid functions. The system BC ratio is 0.08, with an average yearly cost of living of 28,290 AUD per person. The living cost aligns broadly with poverty line benchmarks, which estimate the income required to support the basic needs of a single working adult at 611 AUD per week [
23] or 29,328 AUD per year. The poverty benchmark value, including housing, was selected as a comparison value due to the fact that the BC calculation includes annualised investment costs for housing construction. The resulting site cover of 49.7% also aligns with the 50% limit specified in the Township Zone Code [
19] applicable for the sample area that informed the BAU scenario occupancy. This suggests that the tool can provide realistic outputs.
To gain insight from these results, the distribution of both BC and FS ratios across the system must be examined further.
Figure 18 summarizes the key parameters of the BAU scenario and shows how the system’s costs, benefits, and natural/urban shares are distributed among the five purposes of the system.
The transmission purpose, which incorporates food, water, and energy consumption as well as transport and mobility, accounts for 72% of the entire system and is 90% reliant on urban functions, external to the site, to meet the demand. However, the security functions that describe the systems’ robustness and resilience by tracking redundancies and alternative resource sourcing only make up 11% of the entire system and are predominantly (65%) supported by natural functions. Taking both transmission and security ratios into account, the results suggest that the BAU off-site food, water, and energy supply approach has a strong impact on the system in general and may decrease overall system resilience if not well distributed amongst natural, urban, and hybrid supporting functions. The transmission purpose also accounts for an indicative balance between urban and natural infrastructure, which may hinder or enable natural nutrient and other cycles. The high reliance on urban functions indicates a high potential for disturbance of natural cycles. Depending on the particular design (e.g., materials, permeability, location, and orientation relative to water flows), the urban infrastructure may have both positive and negative effects on the ecosystem. The result indicates a marked impact of urban interventions and the need for aligning infrastructure design with natural processes, an aspect not commonly considered in typical developments. Therefore, it can be argued that the BAU design option provides little opportunity to support ecosystem transmission functions and cycles.
The lack of community, security, productivity, and protection function provision typical for the BAU scenario, in conjunction with the significant decrease in ecosystem areas, leads to a smaller system contribution and a greater reliance on natural supporting functions for each of these system purposes, indicating an unsustainable scenario. For example, the site provides some intrinsic amenity and benefits through its natural areas, location (seafront access), and inclusion of foot and cycle paths. These aspects are recorded via the community purpose node, which accounts for 9% of the entire system and relies on natural functions in a 71% proportion.
However, the scenario does not include any research, monitoring, or education activities that could provide opportunities for the community to, in turn, support the growth and maintenance of the ecosystem, thus forming an inequitable relationship and increasing risks to the ecosystem’s future survival. A similar relationship can be observed in the case of the protection purpose node, which accounts for coastal and flood protection measures and contributes only 3% to the entire system, relying fully on natural functions. Given the sites’ vulnerability to flooding, the combination of low contribution and high reliance on natural protection means indicates an increase in risk, as ecosystems require relatively large areas to effectively provide coastal protection services. This effect can also be observed within the security node, where the high proportion of natural supporting services is due to the coastal protection potential of the site conservation zone.
In summary, it can be argued that the BAU scenario works cross-purpose as a design approach. In other words, the BAU urban system relies on the natural system to achieve resilience, but by allocating insufficient areas for the functioning of the ecosystem and focusing design options on urban aspects, it undermines its effectiveness and whole system impact potential, in turn undermining its own resilience. The reduced impact of natural areas also has a marked effect on the system BC balance, which indicates high costs deriving from urban functions and high benefits associated with natural functions. A higher reliance on natural services for community, protection, and security purposes could therefore help to balance system costs by allocating sufficient areas for the ecosystem and implicitly increasing the system impact and ecosystem-derived benefits. On the other hand, FS and BC balances for the transmission and productivity purposes of nodes could be enhanced through hybrid uses of the site. For example, the productivity purpose accounts for overall diversity in terms of natural habitat provision for the ecosystem but also includes urban revenue diversity and monetization of the hybrid uses of the site. The BAU urban design options, however, do not contribute to the site productivity node, which relies entirely on natural functions and does not take advantage of the full potential of the site. While it may be argued that hybrid site uses could adversely impact the ecosystem, associating revenue with diversity and ecosystem health may also provide valuable incentives to conserve and support ecosystem functions. Similarly, the potential provision of food, water, and energy through hybrid sites that use affluent resources for transmission purposes may increase BC balances while encouraging more sustainable relationships between the urban and natural systems. These potential alternative design solutions are analysed in the following sections.
6.2. Individual Parameter Balances
To derive improved design scenarios, individual sub-system optimisation should be balanced out with the whole system performance. Ideally, the design options should lead to the best possible BC ratios, the most diverse distribution of urban, natural, and hybrid FS ratios, and the highest achievable level of self-reliance. Based on the BAU scenario findings, there is potential to improve the system BC ratio by maximising ecosystem functions across the community, protection, and security nodes and maximising hybrid functions across the productivity and transmission nodes. These hypotheses are tested here through the individual parameters representing food, water, and energy supply as well as community functions.
The individual parameter scenarios consider alternative options for residential development on the case study site that do not require infilling and conversion of the existing wetland zones but either maintain or expand the ecosystem. The development area is thus limited to the existing dryland area, and, to enable comparison, the same occupancy level of 260 people as in the BAU scenario is retained. At this occupancy level, the reduced development area is insufficient to accommodate a low-compact configuration with private car access. The required occupancy can, however, be met by either switching to a medium compactness (equivalent to five people per single two-story dwelling) with private car access or retaining the low compactness typology and switching to public transport access only, thus reducing the access area footprint.
Given the prevalence of private car transport in Australia, the medium compactness and private car access option was deemed more realistic and selected as a starting point and baseline reference for the individual parameter test scenarios.
Figure 19 shows the impact of the two changes (switch to medium compactness and retention of original wetland areas) and the resulting baseline system balance and configuration before parameter optimisation.
Compared to the BAU scenario, the additional natural areas increase the ecosystem contributions to community and security functions, as well as the system impact of natural productivity and protection. The resulting fair share ratio shows that the system is supported by 49% natural and 51% urban functions, with a site coverage of 23.7%.
In economic terms, the additional natural areas improve the system BC ratio to 0.13, an improvement that is equivalent to a reduction of 12,060 AUD in the yearly cost of living per person and is a result of both the decrease in construction and energy consumption costs and the added value of the ecosystem. It is, however, important to note that the ecosystem component costs and benefits include non-market values (e.g., the value of supporting migratory bird flyways, biodiversity, or leisure amenities), accounting for various services that may benefit the community but do not directly translate into income. In the BAU case, the reduced ecosystem function minimised the impact of non-market values across the system, yielding a baseline cost of living that reflected household expenditures and was thus comparable to existing benchmarks such as the poverty line. In contrast, in scenarios with increased ecosystem contributions, the BC impact of natural components described through non-market values and their associated cost of living should be interpreted as the monetary equivalent of indirect benefits.
Starting from this baseline scenario, individual parameters will be further explored to identify optimum configurations. For food, water, and energy supply, each parameter will first be tested to ascertain the maximum level of self-sufficiency that can be achieved given the occupancy of the site and the design parameters required to accommodate this. The results will then be assessed against the resulting BC ratios, formulating an optimal scenario for each parameter. Assessing BC ratios, diversity of FS ratios (implicit redundancies), and self-sufficiency were chosen as testing criteria that reflect the five key system objectives identified through the theoretical framework literature review: “maximize connectivity; minimize impact; maximize diversity; integrate multifunctionality and redundancy; use decentralized, locally adaptive elements” [
7]. Potential conflicts between parameters will be assessed, considering these factors in relation to the resulting system and sub-branch BC and FS impacts.
6.3. Food
On-site food production has a marked impact on both the system FS and BC ratios. At the level of purpose nodes, hybrid agricultural areas have both positive and negative impacts. The most prominent positive impact is felt on the transmission purpose node, where agricultural areas can greatly improve BC ratios by decreasing costs of purchasing food off-site while also distributing supporting functions more evenly among urban, hybrid, and natural parts of the system. A positive impact is also achieved in both protection and security purpose nodes, where hybrid areas provide additional alternative protection strategies and, in combination with alternative food sourcing, increase the overall number of redundancies and resilience of the system. This is reflected in a more even distribution of the purpose node FS ratios and an increase in the overall system contribution of the nodes. However, for both security and protection, there is a trade-off between increasing the diversity of strategies and their associated costs. Although the benefits for each purpose node still outweigh the costs, the BC ratio is reduced for both nodes. This is due to the fact that, initially, both nodes were supported almost exclusively by natural functions, which have very low costs and equally high benefits compared to hybrid areas. The positive impact of a more robust and diverse protection and security strategy therefore has an associated cost but provides a more sustainable, long-term strategy for both protection and security. The negative impacts of the hybrid agricultural areas are felt in the community and productivity nodes, both of which experience a reduction in the BC ratio. In both cases, this is due to a reduced area of the natural ecosystem, which, for the community nodes, translates into a reduced amenity area (implicit reduced system contribution) and, for the productivity node, reflects the reduced biodiversity of hybrid systems compared to natural systems. The impact on the community node could be offset by introducing community areas and activities (e.g., research and education) that connect to the hybrid environment (see
Section 6.6 and 6.7), while the impact on productivity could partially be offset by maximising cultured species to achieve a more diverse hybrid environment.
Individual parameter testing was conducted to determine the achievable level of food self-sufficiency at the site as well as the overall impacts of these measures on the system FS and BC ratios. Required food crop areas and system impacts were first tested for each food group separately and then combined into the best self-sustaining food production scenario for the site. As evidenced in
Table 1, each food group accounts for a different percentage of the total food requirement (proportional to energy values recommended by NHMRC [
10]) and will thus have a different impact in terms of BC. Also, due to different species and their specific area requirements, there will be variation in terms of FS percentage, especially hybrid contribution. To capitalise on the positive impacts described above, both individual food groups and combined scenarios aimed to increase diversity by maximising the number of cultured species and increasing the benefits of the transmission node by maximising crop areas and the percent of food produced on site.
With the site dimensions of the baseline scenario, the site can meet a maximum of 9% of the grains and 100% of all other food group requirements for its 260 occupants. However, given that the grain crops are based on mangrove-derived flour products, increasing the percentage of grains produced on site would imply an increase in the sites’ mangrove areas. The required crop areas for the adjoining salt marsh and nearshore zones are much smaller and thus could be appropriated for mangroves. Additionally, without further reducing the compactness of the housing areas, land could also be appropriated from the baseline development zone. In total, by expanding both in-land and towards the sea, the mangrove zone could be expended to 2.94 ha, which would allow for 30% of the required grains to be produced on site while also fully covering the demand of the other food groups. While areas of existing salt marsh and nearshore areas can be easily converted through mangrove planting, converting the dryland area would require lowering site levels and possibly forming new tidal creeks along the eastern development area boundary.
In terms of system-wide impacts, the two combined options (
Table 1 existing site and extended mangrove scenarios) have different FS distribution values, with the extended mangrove zone option relying more heavily on hybrid functions. The BC system values show very little variation, with both options nearing equal costs and benefits. If crop, food, and farm waste recycling options are included, however, the system becomes profitable in both scenarios, and here, the extended mangrove zone scenario performs much better (equivalent to an extra yearly benefit of 2330 AUD per person). In both cases, the waste recycling options were 60% conversion of crop residues into feed, full use of farm manures for soil fertilisation and composting of the remaining organic wastes from both farm and human food consumption. Additionally, waste recycling has the indirect impact of reducing packaging waste proportionally to the amount of food produced on site, as well as reducing general landfill waste through composting. For the 260-person occupancy, composting food organics would reduce landfill waste by c.a. 28 tonnes per year, while growing food on site would reduce waste by c.a. 21 tonnes of packaging waste per year.
In summary, both options provide a fair BC improvement over the baseline scenario. The extended mangrove zone scenario involves more risk due to the unknown costs of lowering site levels (not included in tool calculations) and the higher reliance of the entire system on the hybrid culture areas, resulting in less evenly distributed roles for natural, hybrid, and urban components. The key advantage of this extended mangrove area, however, is the increased system benefit, which indicates not only the impact on occupant revenues but, through the inclusion of non-market values in the CB calculations, also the broader positive impact of the additional mangrove on the surrounding conservation areas. In terms of the relationship between the site and its adjoining wetland reserves, the extended mangrove area scenario can be described as actively contributing to the propagation and overall expansion of the wetland areas, while the existing site scenario represents a more passive approach.
6.4. Water
Similar to the food nodes, water sourcing and treatment have a strong impact on the transmission and security purpose nodes. To increase system resilience, the options explored focus on maximising the number of alternative sources while at the same time maximising benefits and minimising footprint impact. In terms of footprint, the tool considers alternative water sources as hybrid-urban types of land use, given that each alternative water source also provides an indirect environmental benefit. The strategies employed to achieve a positive impact, however, should be tailored to harness benefits and decrease trade-offs specific to each technology type. To identify the system impact of each alternative source, testing was first conducted for 100% supply for each individual source. Based on the results, a combined optimum water self-sufficiency scenario was proposed (
Table 2).
The tool provides options for using mains, rainwater, seawater, or recycling water on-site as key alternative sources. Rainwater sourcing assumes treatment through solar still (SS) distillation, seawater sourcing through small-scale reverse osmosis (RO) desalination, and recycled water sourcing assumes treatment through constructed wetlands (CW) and additional secondary purification processes.
The main advantages of SS distillation are the passive nature of the process and low maintenance and cost, which need to be balanced with the low daily output, which, for large systems, entails increased areas needed to accommodate the stills. At the same time, the low investment and maintenance costs of SS systems are greatly reduced when upscaling. For the individual SS testing scenario, water demand is assumed to be met fully through rainwater collection and SS distillation.
Two SS panel types, representing the best performance and minimum required area option (SS1) and the best BC ratio (SS2), were selected from the tool technology list (
File S3). SS1 was the experimental multi-effect active solar still described in Karimi et al. [
24], while SS2 was the double basin solar still with vacuum tubes described by Panchal [
25]. As evidenced in
Table 2, even with the decrease in consumption achieved through the AECB standard and WELS tool options (see
Section 3.3.2), both SS1 and SS2 entail higher yearly per person costs than the standard main supply as well as requiring large areas ranging from a minimum of 0.26 ha to a maximum of 0.79 ha to meet the demand of the 260 site occupants. However, the SS2 option improves the overall BC ratio of the system, likely due to the added benefit of the security node and overall system resilience. The combined scenario therefore attempts to minimise footprint impact but retain the overall system resilience benefit, which can be achieved by reducing the demand for distilled rainwater and retaining a smaller SS distillation system that provides redundancy and alternative water sourcing.
Compared to SS distillation, the CW scenarios show a similar positive impact on the overall system BC ratio but much more efficient use of land areas. In general, constructed wetland systems have a good benefit-cost balance, and among the options included in the tool database, the differences in benefit-cost ratio between different wetland types are minimal. The required area and land use therefore took precedence in selecting the CW types for scenario testing. Opposed to SS distillation, where the infrastructure displaces part of the ecosystem, CW provides greater benefits in terms of habitat and diversity, contributing more to the ecological richness of the site. A larger CW area may, therefore, have a positive impact on the system as a whole, populating dryland areas and extending wetlands across the site. The two test scenario options therefore explored the impacts of both the minimum area requirement (CW1) and the maximum area requirement (CW2). From the options included in the tool, CW1 was identified as a subsurface horizontal flow CW as described by Katsenovich et al. [
26], while CW2 was represented by the subsurface French vertical flow (2-stage STP-HF) described by Stefanakis [
27]. In terms of yearly costs per person, fully recycled water sourcing with CW filtration still leads to a greater cost than solely using mains supply. However, the cost difference is far less than in the SS scenario, achieving a minimum increase of only 1330 AUD per year in the CW1 scenario with reduced consumption deriving from the best AECB and WELS standards applied, with a marginal difference in the same standard in the CW2 scenario.
Among the available alternative water sources, CW represents the only land use that contributes to the system productivity node, adding a hybrid element and therefore a contribution to the site productivity. This positive impact is proportional to the wetland area, supporting the potential for positive environmental impacts of CW. To capitalise on this effect, the combined scenario therefore considers CW2 wetland type, maximising CW areas.
Lastly, RO desalination represents the most efficient option in terms of land use and daily water production quantities, but it also entails the highest investment and maintenance costs. The investment costs of the system can be balanced out by monetising excess water produced, with the cost effectiveness of the system increasing proportionally with the permeate flow rate. The RO scenarios therefore explore the system impacts of the smallest and largest capacity desalination plants included in the tool database. Both options are based on the small-scale MAK Water reverse osmosis plants [
28]. As shown in
Table 2, the larger capacity RO scenario has the highest system BC ratio improvement, with the smallest option providing similar BC ratio improvements as the CW scenarios but at a much higher per-person cost. The BC improvement is linked to the excess water produced by the system, which is accounted for in the tool benefits at the rate of mains water supply. The combined scenario therefore attempts to maximise the economic benefits provided by the larger system by specifying a smaller demand.
Based on the results above, the combined scenario employs all the available water sources to increase the system’s resilience and maximise redundancy while applying different demand proportions that help minimise negative and maximise positive impacts of each technology type. The scenario therefore employs mains and SS distillation to each meet 5% of the total demand, which offsets the SS impact on the area and provides a strategy for increasing the overall resilience of the system. It is interesting to note the overall impact of applying water standards to reduce consumption on the yearly system costs per person. While in the main scenario, applying AECB standards and increasing appliance WELS ratings did not produce a marked effect, the alternative supply scenarios are far more sensitive to changes in consumption levels. Indeed, the only scenarios less costly than the baseline mains supply option were the combined source scenarios with the best WELS rating and AECB Good or Best Practise standards.
In terms of the FS system balance, enabling alternative water sourcing results in only marginal (1–2%) differences between the various alternative source options. However, when compared to the mains-only option, the additional alternative source can increase the hybrid supporting functions by up to 17%, depending on the demand apportioned to each source. This leads to an overall more balanced system by allowing for more support from hybrid-urban functions, which can contribute to both ecosystems and urban needs.
6.5. Energy
As some of the main supporting functions of the transmission purpose, energy supply and consumption, have a high impact on the overall performance of the system, similar to water and food supply, aside from the BC impacts on the transmission node and system, energy source diversity can have a marked influence over the overall resilience and degree of self-reliance of the system. Compared to the food and CW systems, energy generation technologies have a smaller environmental benefit for the site. The resilience and self-reliance benefits therefore need to be balanced against infrastructure footprints, aiming to minimise required areas while increasing diversity, maximising on-site energy production, diversifying sources, and maximising financial benefits. Due to the environmental conditions of the case study site (water speeds), hydroelectric energy is not a viable alternative in this case, leaving solar and wind energy as alternative options. To arrive at an optimal balance, each source was first tested individually in the case of fully meeting the sites’ energy demand. For each source, two products were selected from the tool database to represent the minimum required area (best performance) and best product BC ratio scenarios. For solar energy, the best-performing panel included in the database was the SunPower Maxeon 5AC 400–420 W panel [
29], while the best BC ratio was recorded for the TrinaSolar Vertex 600 W panel [
30]. For wind energy, the best performance and minimum required area of the included turbines were achieved by the Solazone Q5-600 W turbine [
31], while the best product BC ratio was that of the Skystream 3.7 1.8 kW residential turbine [
32].
As shown in
Table 3, fully supplied solar energy is comparable in terms of yearly cost to the grid-only option but has an almost double BC system ratio, indicating a positive impact on the overall system. The required areas show slight variation between the two panels; however, the resulting footprint without any energy consumption reduction measures is comparable to the entire combined footprint of the housing and access development area. With medium compactness and 260 occupants, housing occupies c.a. 0.72 ha, with a further 0.35 ha accounting for access areas. Reducing the energy consumption by applying the PHI Low Energy or Passivhaus building standards also reduces the required solar panel area to an area that can be accommodated considering a standard roof-mounted option. In contrast, wind turbines (assumedly roof-mounted) have a much smaller footprint and have the advantage of freeing some ground/roof space for other uses. However, the BC ratio of wind energy is also far smaller due to the higher initial investment and maintenance costs. A result comparable to the PV and grid-only scenarios can, however, be obtained using the turbine with the best product BC ratio in conjunction with a Passivahus Classic building standard (
Table 3 WE max benefit scenario). This suggests that, for the small-scale turbines considered in the tool, wind energy can be employed to diversify the system’s energy sources, but this needs to be balanced out with BC performance, which is higher with lower rates of consumption.
Based on the above observations, the combined scenario assigns a majority (85%) of energy demand to solar panels, which have the most potential to save costs while increasing energy source diversity. A further 10% is assigned to wind turbines, which, at this low demand, provide an overall system benefit while also helping to decrease required solar panel areas. Lastly, as the scenario aimed to diversify energy sources as much as possible, 5% is assigned to grid supply, which is included as an added redundancy and resilience strategy but also implies a slight reduction in the footprint of wind and solar infrastructure. While the yearly system cost per person varies marginally between the grid-only and combined scenarios, the improved system BC ratio reflects an overall positive impact of alternative energy sourcing, albeit with the added initial investment costs. It is also interesting to note the relationship between occupancy density, energy consumption, and system BC values, where yearly costs and footprints can be significantly reduced by increasing the building’s compactness. The option shown in
Table 2 entails a high compactness scenario (55 m
2/person) with housing distributed as 3-story high-density apartment blocks rather than high-rise. Limiting the footprint by increasing the maximum floors does not have any further positive impact on reducing energy consumption.
In terms of the FS impact of energy supply, there is only marginal variation in the combined scenario; however, in relation to the grid-only option, including alternative energy sources can increase the hybrid function contribution by up to 12% and may help to increase the productive urban contribution to the system.
Based on the above analysis, the combined simple and high compactness scenarios to the PHI Low Energy standard will be used as starting points for energy supply in the final scenario.
6.6. Community and Urban Configuration
This section discusses the impact of tool options relating to community and urban design parameters, focusing on the parameters with the most impact potential. Urban design parameters include the provision of rooftop raingardens and permeable paving as hybrid-urban elements that contribute to the system’s water management strategies, including storm protection, and add to the overall diversity of security and productivity purposes. The impact on security reflects the resilience of the system, while productivity tracks overall biodiversity for natural and hybrid components and productive revenue generation for urban components. The tool also allows for housing areas to be distributed across the four site elevation zones, with nearshore housing having the most impact due to its potential to contribute to the system’s coastal protection strategies. Additionally, a percentage rental may be defined through the interface, shifting some of the community-purpose costs towards rented property and thus migrating a fraction of the costs and benefits associated with housing towards the site productivity purpose. The community options that have the strongest impact in terms of the system BC ratio are the inclusion of generic community space (indoor or outdoor) and the options to include ecotourism and producing wetland-based products for sale on site (see
Section 3.1.4 for details). Research and education community options tie in to specific urban, hybrid, or natural areas of the site and have a smaller impact in terms of BC ratios. However, the research and education functions influence the distribution of FS ratios across the system, highlighting an opportunity to deploy research and education activities within areas or to support nodes that are less balanced in terms of their FS ratio. Therefore, the options with the strongest BC impact were tested individually, while the balancing functions of community research and education will be explored through the final combined scenario.
To arrive at an optimised combination of urban and community parameters, each option was first tested individually, starting from the baseline scenario.
Table 4 shows the results of individual testing, highlighting trade-offs and the scale of improvements that can be achieved through each measure.
The largest improvement in terms of the overall system BC ratio was achieved through the wetland product retail options, followed by the inclusion of 40% rental areas and the switch to permeable paving for all access areas. While all the options improved the overall performance of the system, the indoor community space and wetland retail options also had the effect of significantly raising the yearly living cost per person. Additionally, due to the large investment costs relative to achievable benefit rates, the indoor community space was the only measure resulting in a significant decrease in the system BC ratio. The combined best outcome scenario, therefore, includes all measures with a positive system BC impact and excludes the interior community space. For the wetland retail option, although higher per-person yearly costs are involved, when coupled with ecotourism and other options, the cost per person can be reduced while retaining the overall positive system impact. Indeed, with the introduction of further benefits from food, water, and energy production in the final scenario, it may be possible to include both wetland retail and indoor community spaces without adversely affecting yearly living costs.
In terms of FS ratios, both urban and community options generally have the effect of diversifying the supporting functions of the strategies and purposes they relate to, therefore increasing system resilience and balance. Given the polarization of the baseline scenario between urban and natural supporting functions, hybrid components, such as raingardens, have the most impact in terms of the system FS balance.
6.7. Good and Best Practise Scenarios
To achieve an optimised alternative scenario, the combined best options for each sub-system should be tested and applied in tandem. Given that each subsystem test aimed to achieve the maximum benefit and supply values, it is possible that the concurrent application of all optimisation measures will require some adjustments. Decisions to reduce subsystem functions should be assessed in accordance with the key system behaviour findings identified through the individual tests.
Individual subsystem tests revealed that the strongest impact on system BC ratios and yearly cost of living can be achieved through on-site food production, followed by combining urban design and community options. Alternative energy and water supply strategies can provide further improvements, with water supply strategies having a larger impact on the system BC ratio but a higher implicit cost of living than alternative energy generation strategies. The impact scale of each of the subsystems indicates that hybrid components tend to have a positive effect that is proportional to the degree of ecosystem support they provide. BC and FS ratios are more strongly influenced by hybrid components such as constructed wetlands or hybrid agriculture areas, which provide both ecosystems and urban services. Priority should, therefore, be given to such hybrid infrastructure while taking the BC, yearly living cost, and conservation of system diversity (balanced FS ratio) into account for any necessary reduction decisions. At the same time, subsystem components may have an indirect impact for a variety of purposes. To account for the indirect implications of each configuration, design decisions should be assessed not only against the system BC and FS ratios but also against the five key purpose node ratios, as a similar system BC may have quite different implications for the FS and BC ratios of each purpose. Due to the inclusion of non-market values in the BC algorithm, the BC ratio is not simply reflecting revenues but may include wider community benefits. For this reason, some functions, such as those supported by natural components, may have extremely high benefits that are passed on to their associated purpose node if the node is dominated by the natural component.
A very high or very low purpose node BC value may thus indicate an imbalance in the FS ratios and overall purpose diversity and resilience. The individual parameter testing indeed revealed that optimised options tend to increase the percentage of system contribution of their associated purpose nodes while balancing urban and natural supporting functions through hybrid components.
Taking the observations above into account, two separate optimised scenarios were developed based on the combined results for each subsystem. The overall configurations and system characteristics of the resulting good and best practise scenarios are shown in
Figure 20 and
Figure 21.
The two optimised scenarios, good and best practise, reflect the water and energy standards applied and the degree of site potential achieved. The good practise scenario is a more passive approach that follows current building typologies and land use approaches more closely. The best practise scenario, however, strives to explore the maximum potential of the site by employing active strategies such as land use and nearshore area conversion to expand wetland coverage, high-compactness building typologies, and switching to alternative means and types of transport.
Both scenarios start with the combined best options for the urban and community parameters. Energy and water options apply the optimal sourcing percentage and technologies applicable to each of the combined individual testing options. The good practise scenario applies the AECB good practise water standard, PHI low energy standard, and median values for both WELS and energy appliance ratings. The best practise scenario includes the AECB best practise water standard, the PHI Classic energy standard, and the best WELS and energy appliance rating.
In terms of land use, the two scenarios employ different strategies based on the two combined food production options. The good practise scenario reflects the more passive approach of utilising site areas to their existing extent (
Table 1: Existing site—9% grain combined parameter options), while the best practise scenario considers the expansion of existing wetland areas as described in the food parameter testing section (
Table 1: Extended mangrove—30% grain combined parameter options).
In terms of research and monitoring community options, the balancing effects can be observed in the FS ratio of the community node, where these functions have the most impact.
As monitoring, education, and research can also be linked to ecosystem health and good management practises, both scenarios utilise the full range of monitoring and education opportunities provided via the tool.
Compared to the individual parameter optimisations, for the best practise scenario, the initial combined application of the parameter optimisations resulted in the protection node being supported by nearly 80% of hybrid functions. In the case of other nodes, hybrid functions are themselves more diverse, allowing for a higher dominance. For the protection function, the mangrove culture areas add the bulk of hybrid support. Taking the site location and flood risk into account, grain production for the best practise scenario was reduced to 25%, and additional urban housing areas were assigned to the mangrove and nearshore areas, resulting in an increase in both urban and natural protection functions. Although the best practise scenario is based on a high-compactness, medium-rise (five-storey) urban typology option, it should be possible to accommodate the additional urban areas within the mangrove and nearshore zones. While the tool does not account for design solutions with mixed typologies, any solution that would retain the overall footprint and surface area (impact on energy consumption) would still perform at the same level. It is also interesting to note that reducing on-site grain production to 15% with the same urban typology and the removal of two of the cultured species would allow the same site to accommodate an extra 140 people, a total of 400 occupants or 184 people per ha, with a similar FS ratio, a smaller (1.05) but positive BC ratio, and a yearly benefit per person of c.a. 2730 AUD. To enable comparison, the best practise scenario was kept at the same occupancy level as the BAU and good practise scenarios. The finding, however, highlights the potential to sustainably increase site density while retaining ecosystem services and benefits.
7. Discussion
7.1. Scenario Comparison
In comparing the results of the tool calculations, it is apparent that the good and best practise scenarios offer significant improvement both in terms of FS and BC over the BAU scenario. As shown through the individual testing, the BC and yearly per-person cost of living values are sensitive to both actual revenues and wider community and ecological benefits resulting from non-market valuation. When applied within a sustainable design, BC ratios reflect the degree of sustainability, allowing for comparison between the achievable benefits. However, improved BC ratios could in principle be achieved in unsustainable scenarios (e.g., BAU with 100% rental), where the design measures do not take ecological impact and system resilience into account. It is therefore important to consider BC and the yearly cost of living together with FS ratios and system-purpose contributions. FS ratios can be interpreted as indicators of resilience, diversity, and self-sustenance. The more distribution and variety can be seen among urban, natural, and hybrid supporting functions, the more diverse, resilient, and self-sustaining the design scenario. Given that strictly urban components tend to have negative environmental impacts, the hybrid component FS ratio can be interpreted as an indicator of the degree of support that urban functions direct towards supporting natural ecosystem services. Maximising hybrid and especially natural-hybrid components within the limits of sustained diversity can therefore lead to a more symbiotic urban-natural relationship and increased system benefits.
These findings are evidenced through the overview comparison of the three scenarios (
Figure 22) which shows that significant improvements can be achieved when optimising BC and FS ratios to achieve the most benefits within a resilient, self-sustaining system where urban and ecosystem processes are both supported through hybrid components.
In terms of system BC ratios, the good practise scenario was 12 times better performing than the BAU scenario, with a yearly cost of living reduction equivalent to 26,990 AUD per site inhabitant (a 95% improvement compared to BAU). The best practise scenario performed even better, resulting in a negative yearly cost of living, indicating a yearly benefit equivalent to 6420 AUD per site inhabitant rather than a cost (a 122% improvement compared to BAU).
While it is more difficult to quantify the degree of diversity obtained through the FS distribution, the purpose node distribution diagrams (
Figure 22), clearly show that the optimised solutions have a more even distribution of natural, urban, and hybrid functions across the system while reducing the impact (contribution%) of the transmission purpose and increasing the impact of the remaining purpose nodes.
In terms of land uses, the scenario comparison reveals that optimised solutions entail a more active use of both dryland and wetland zones.
Figure 23 shows the area (ha) afferent to each function type for both dryland and wetland, allowing a comparison between the three scenarios. In the BAU scenario, the dryland zone is dominated by the urban development (housing and access) footprint of a small natural zone. In contrast, both good and best practise scenarios decrease the urban footprint by adding active and hybrid uses (e.g., food crops and constructed wetland for water filtration). The diversity of the FS ratio, therefore, also entails the diversity and distribution of land uses in order to achieve higher benefits. At the same time, the addition of constructed wetlands and polyculture dryland food production zones may boost the overall biodiversity of the site, thus indirectly supporting the wider ecosystem.
At first glance, the BAU scenario provides a larger natural wetland area. However, when compared to the original site dimensions (without any development), it can be observed that the BAU scenario decreases the total wetland area by 2.1 ha, while the good practise scenario decreases the wetland area by 0.36 ha, and the best practise scenario increases the wetland area by an additional 0.76 ha. The benefits obtained from the total wetland areas, however, are dependent on the sustainability of the active wetland uses. In the optimised scenarios, the slight decrease in fully natural wetland area (conservation zone) is compensated through the addition of hybrid active uses such as silvofisheries, oyster and halophyte crops, wetland ecotourism, research, and education activities. Both hybrid and natural wetland-derived benefits therefore depend on the impacts of these activities.
Strategies such as crop rotation, limiting the amount of material harvested for food and retail uses, as well as the frequency of ecotourism, research, and education activities, should be carefully considered in the later design stages. This aspect is already partially reflected in the tool unit costs and benefit values, which apply conservative estimates regarding production quantities for retail as well as the frequency and number of people that would use the site outside of the 260 inhabitants. Although the active use of wetlands implies some degree of risk, achieving a configuration that allows the increase of wetland areas through sustainable urban development provides a valuable means of decreasing competition between urban and natural growth, increasing the chances of adapting to predicted future population increases in a way that also increases natural areas and supports ecosystem processes.
Another aspect to consider is the impact of each type of measure, which may aid decision-making processes. As evidenced through the individual parameter testing, design options can have varying effects on the system BC, yearly cost of living, and FS.
Figure 24 summarises the measures applied in each optimised scenario and shows the percent of system BC ratio improvement resulting from each measure. Similar to the individual parameter test results, the optimised scenarios, show that on-site food production has the biggest impact in terms of system benefits. Water and energy supply vary only marginally between the two optimised scenarios while the impact of altering urban form, rental percent, and community functions varies greatly between the two scenarios. The urban form includes water-sensitive design features, compactness levels, housing typology, and location, as well as key access modes for the site. While the decrease in footprint between the good and best practise cases allows for benefits to be harnessed from other natural and hybrid functions, it also results in a reduced overall impact of the housing and rental improvement measures. As the investment costs for these interventions may not vary proportionally to their associated benefits, it is possible to obtain a negative impact value with a reduced footprint. This is a similar situation to the cost-benefit balance of community wetland retail and indoor coworking space functions discussed in the previous sections, where certain components have great potential to improve the overall system performance but also have a high associated cost that needs to be mitigated through other means.
In the best practise scenario, the impact of urban form improvement is mitigated by the % rental benefits. The variation in community node impact is due to the inclusion of wetland retail options and indoor community spaces, with costs being absorbed through the combined effect of other functions.
In summary, the scenario comparison shows that the use of FS ratios as assessment criteria for diversity, resilience, and level of support for surrounding ecosystems, in conjunction with BC ratios as a means of quantifying the degree of impact and sustainability, may greatly improve the benefits created by a particular development site and design solution. It is interesting to note the implications in relation to current planning assessment processes and zoning codes. For example, both BAU and good practise scenarios would be fully compliant with the current township zoning code of the area, highlighting a lack of recognition of these types of benefits and approaches within the current planning paradigm. Indeed, while, due to climatic pressures such as increased flooding, some measures (e.g., water-sensitive design options) are recognised within current planning discourse, other factors such as on-site food production, non-market value benefit generation and site potential, system resilience, and, most importantly, the level of support offered by the development to the surrounding ecosystem services are not accounted for in the design and development of current urban areas. The tool and use of FS and BC ratios as assessment criteria may therefore provide an additional dimension and incentive for more sustainable future development.
7.2. Tool Opportunities
The comparison of tool outputs and scenario testing provide proof of concept for the underlying algorithm and proposed assessment criteria, highlighting the potential benefits of using the tool outputs to inform design processes. At the same time, the testing and comparison also point to some strategies and opportunities to broaden tool applications.
The key advantage of the tool is the editability and flexibility of the inputs. This aspect relates to the base data approach, which allows for inputs to be adjusted according to user requirements. This entails flexibility in terms of accommodating various site conditions, target standards, species, technologies, and BC values. As long as the information is formatted to follow the file structure (e.g., average, good, and best practise target ranges for energy), the target values can be modified for each factor. Energy and water efficiency standards can be modified to reflect any applicable international or local standards. This provides a degree of flexibility in terms of applying the tool in different legal, planning, and other coastal wetland contexts. The same principle applies for cultured species, where inputs and tool options can be modified through the csv files to include appropriate endemic species for other sites.
Similarly, climate data inputs can be adjusted to reflect the specific conditions of any given site, providing an opportunity to test a particular design configuration against different or changing conditions. For example, by changing the climate input file, the performance of a design configuration could be assessed under future climatic conditions (e.g., drought or change in temperature) or sea level rise. There is also an opportunity to create feedback loops between tool outputs and iterative spatial design development to determine the systemic impact of potential design compromises arising from spatial configurations.
Another important aspect relating to flexibility is the numerical approach and minimally prescriptive spatial configuration. As the algorithm works on a quantitative numerical basis, the assessment outputs remain valid as long as the spatial design keeps to the numerical rather than spatial assumption in the tool. For example, as shown in the case study site analysis, vegetation can extend across mixed zones. An accurate representation of benefits and FS ratios for a given site can still be obtained by inputting real areas of vegetation cover instead of elevation zone areas. By adjusting these inputs, the tool could also be used to inform decisions across later design and implementation stages. Another pertinent example is that of energy consumption and spatial housing area design. While spatially, the tool assumptions provide a reduced range of options, spatial design configurations need not follow the tool spatial assumptions to maintain tool scenario benefits. In other words, any design configuration that numerically keeps the same floor area and total footprint for each site zone selected will retain the energy and system performance envisaged through the tool.
Lastly, the flexibility of tool inputs also allows for the tool to be easily used in addition to other existing software or informed by specialist design team members. For example, benefit and cost values, target energy and water efficiency ranges, and crop species mix could be determined using specialist inputs or outputs from other more detailed models. The tool, therefore, provides an opportunity to explore and coordinate the systemic impacts of the various sub-systems.
7.3. Limitations and Future Work
With appropriate inputs, the tool algorithm can be applied to a variety of different sites internationally. However, the calculations and interface design only target coastal wetland sites. This is due to the inclusion of coastal protection functions and specific wetland-related functions. While other configurations can be numerically modelled through the tool, the results have yet to be tested within a different context and may not accurately reflect system BC and FS ratios for other site types. Additionally, the current tool version includes a limited range of site-specific base data. The information used was tailored to the case study site and only expanded to the extent of providing sufficient relevant input to provide proof of concept for the tool algorithm. In terms of applicability and flexibility, this entails a high degree of user input necessary for applications on other coastal sites. While the default inputs provided for water (e.g., user behaviour parameters) and energy generation are based on internationally applicable standards, data relating to vegetation and cultured species is site-specific and may need specialist input to ensure accurate results in different conditions. To make the tool more accessible, a wider range of databases for specific site typologies may need to be developed in the future.
One of the key limitations of the tool algorithm is that, while the simplified calculations allow for an intuitive interface, some factors such as soil characteristics, water quality (chemical composition and nutrients), scale limits for BC values and ecosystem functions, as well as climate-site-vegetation compatibility, are not accounted for. For example, the tool does not account for the survivability of cultured species in inappropriate climates. The results are therefore only relevant if the site conditions are appropriate for the proposed options. This again leads to the necessity of more advanced user knowledge and input. The limitation could be mitigated by further developing connections to other existing software. Comparison to other software (e.g., InVEST, BIM, and function-focused tools) was only briefly touched upon upon reflecting on the key existing application types in relation to the tool, but was not the main focus of this paper, which aimed to test and demonstrate the viability of the tool algorithm. Future work may, however, focus on a more in-depth review of other applications to determine the exact differences and overlaps with other algorithm outputs and potentially identify opportunities for improving compatibility and the tool’s value as complementary software.
Lastly, the tool outputs represent idealised areas, which can be interpreted as a design brief. Further testing is required to determine how the tool outputs can be deployed spatially and identify potential feedback loops, improvements, or strategies to mitigate compromises through design. At the same time, while the numerical approach provides flexibility and design freedom, simply meeting the required areas may not be sufficient to successfully retain the benefits highlighted in later phases. Future work may therefore include exemplars for design typologies and strategies to support the tool.


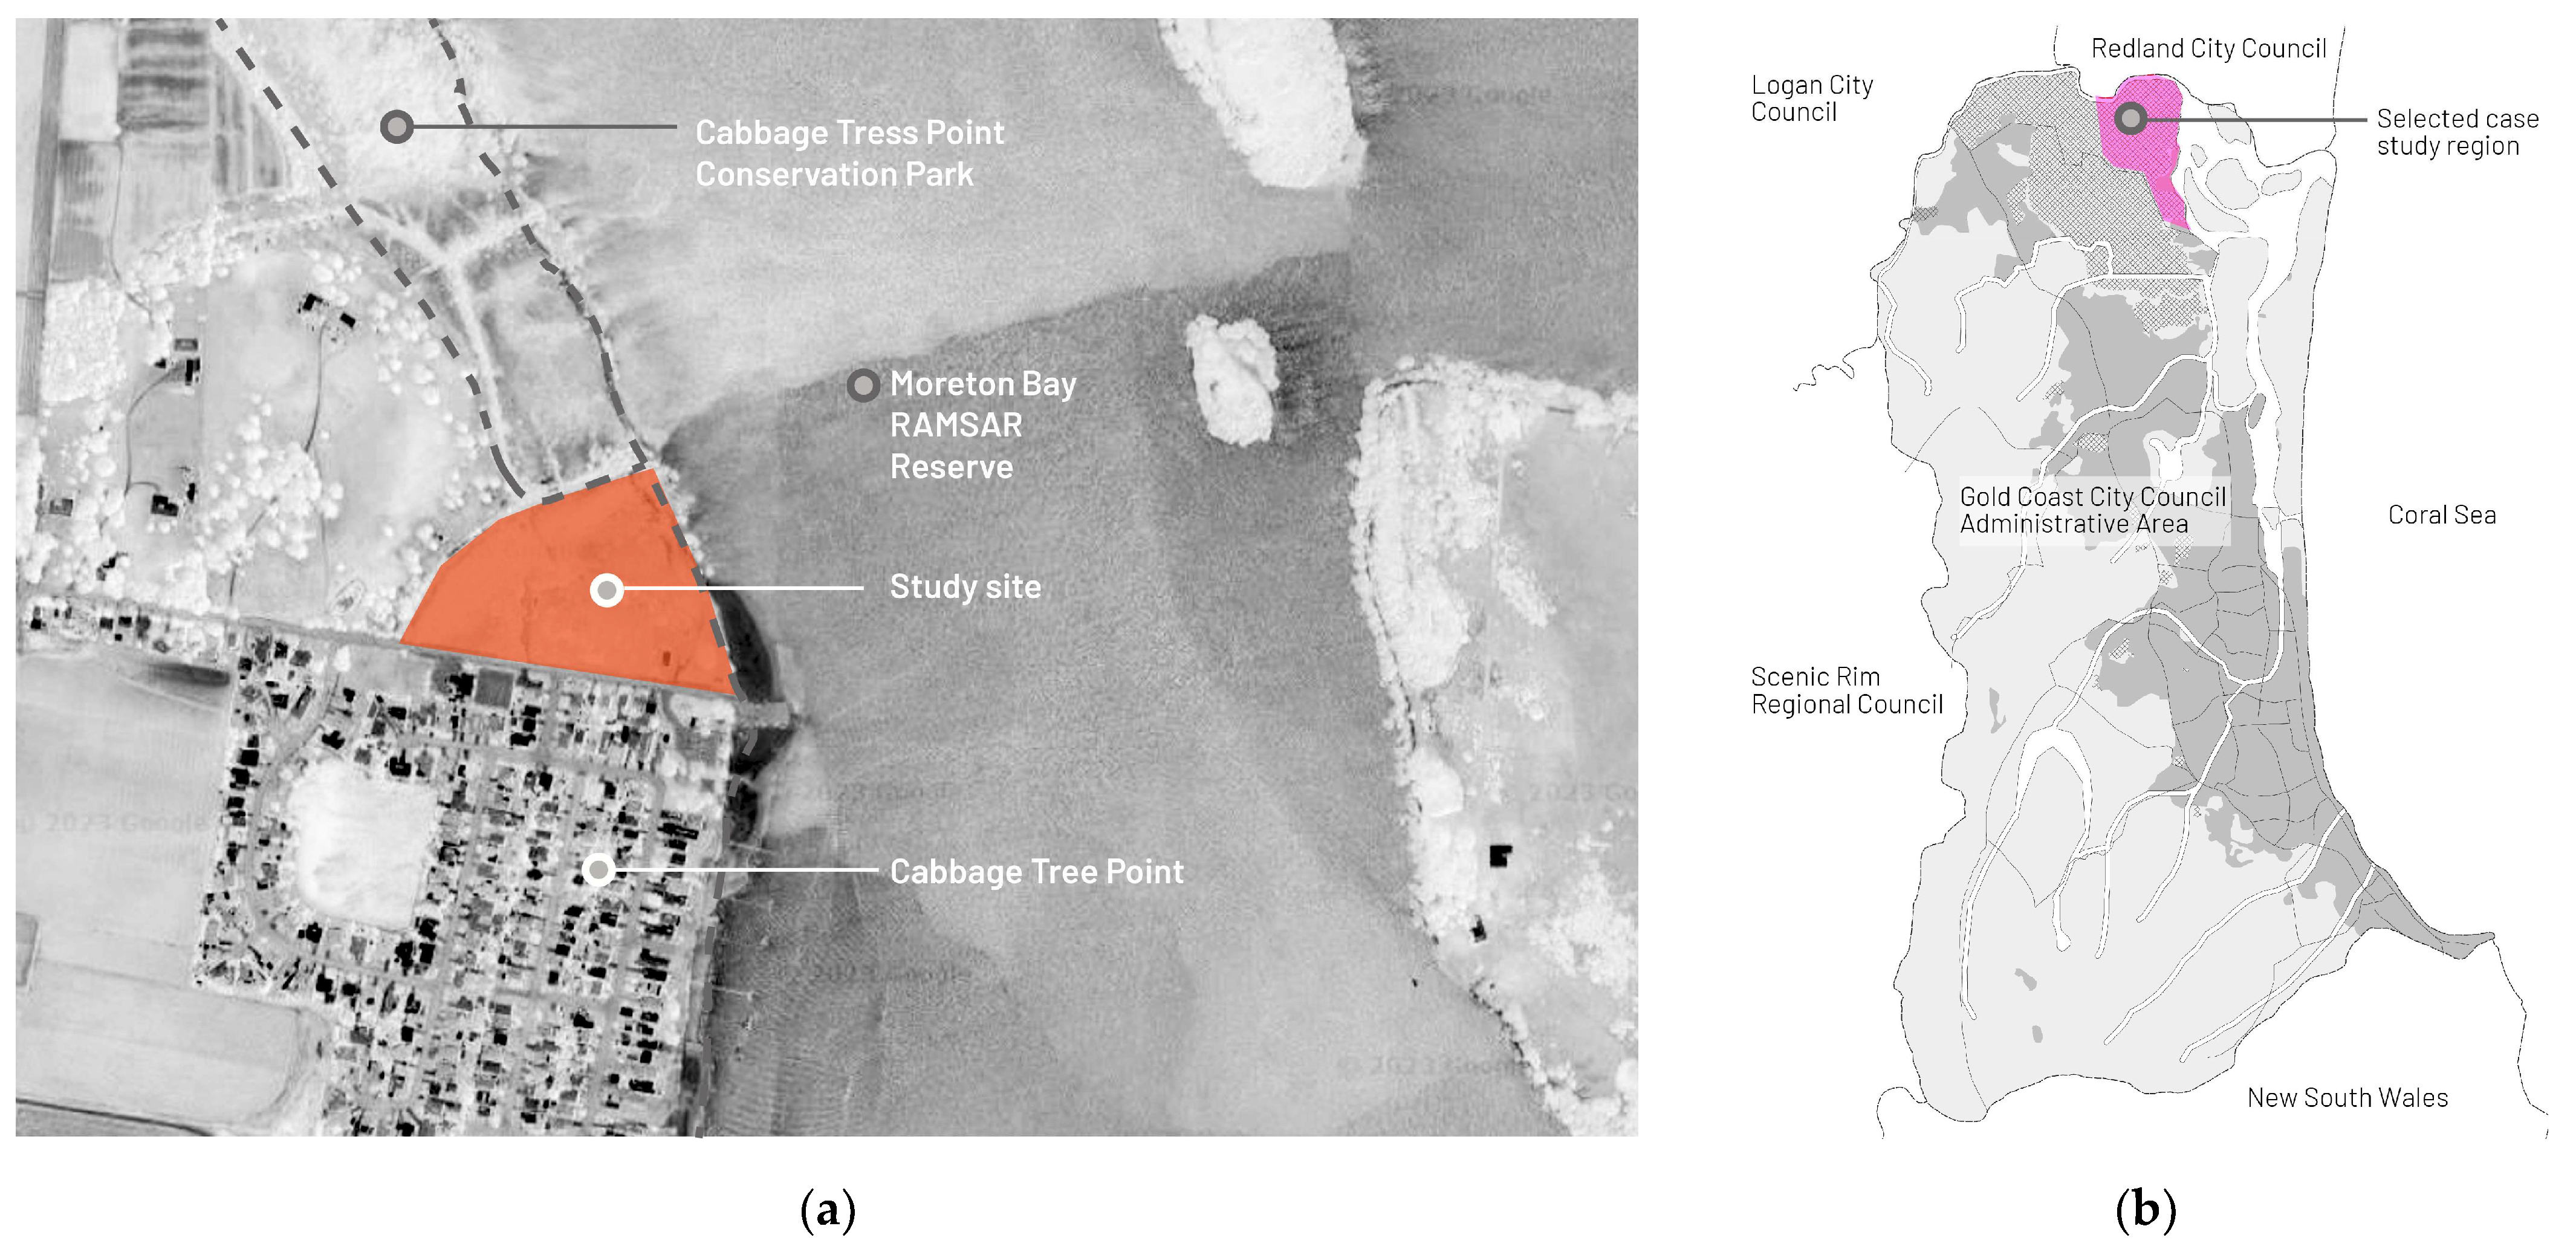


