Article

How to Capture Place Identity Contents? A Tool for Planning Interventions

1
Department of Psychology, University de Évora, 7000-803 Évora, Portugal
2
CiTUA, Technical Institute, University of Lisbon, Av. Rovisco Pais 1, 1049-001 Lisboa, Portugal
3
Department of Civil Engineering Architecture and Environment, IST, University of Lisbon, 1049-001 Lisbon, Portugal
*
Author to whom correspondence should be addressed.
Sustainability 2023, 15(21), 15535; https://doi.org/10.3390/su152115535
Submission received: 17 September 2023 / Revised: 24 October 2023 / Accepted: 26 October 2023 / Published: 1 November 2023
(This article belongs to the Section Psychology of Sustainability and Sustainable Development)

Abstract

:
Research into place identity has mainly focused on its intensity rather than its contents. Place identity measurement is relatively mature, and the scales have been used in many literatures. However, the contents of place identity are rarely addressed, and if so, only in qualitative studies, constraining comparative studies. Thus, the purpose of the current paper was to develop a measure of place identity contents that elucidates the dimensions that contribute most to place identity in different urban contexts. The three studies described here developed and implemented a place identity contents scale. The scale was designed and validated amongst a sample of 422 residents in Study 1, with the identification of an eight-factor structure consistent with the literature review. Study 2 replicated the factor structure and confirmed correlations with place identity, place satisfaction and quality of life in the place. Study 3 explored the applicability of the PIC scale in a field study investigating three parishes that differed significantly in their physical and social features. Overall, the results suggest that place identity is a flexible and dynamic process and that, in order to form a bond with a place, people make use of those available features (both physical and social) that better contribute to a positive place identity. The results also suggest which place identity contents better favor identification and may, therefore, contribute to improving the quality of places and human well-being.

1. Introduction

Since its introduction [1], the concept of place identity has been addressed from different perspectives; the individualistic point of view focuses on the impact of place on residents’ identity, while the social perspective emphasizes the nature of relationships between individuals, identities and places [2,3,4,5]. It is argued here that these approaches are interconnected. We defined place identity as those features of individual and social identity related to the perception of belonging to a specific place [6], those that are shared by groups identified with the place. Place identity is constructed by way of a long-term and complex process of individuals and groups interacting with the physical and symbolic features of places [7,8].
Identity comprises two components: the intensity, or the strength of belief, and the degree of positive connection with the object of identity [9] (Barney et al., 1998), and the contents of the schemata which compose the identity, i.e., the characteristics used by people to define their identity [10]. In a broader sense, we can think of “the meaning of a collective identity” or the contents associated with a specific identity [11]. Despite being related, these different components may operate relatively independently [12].
Place identity contents encompass a constellation of characteristics [13,14] that make a place unique for its inhabitants, who, in turn, are marked as unique. This set of contents is organized and “can be characterized in terms of the degree of centrality, the hierarchical arrangements of elements and the relative salience of components” (p. 208, [14]). This sort of self-stereotype may include different features of the physical and social environments, including place history, emblems and cultural icons [15], plus the values and norms associated with this category [16].
Psychology research has tended to downplay identity contents [17,18], focusing instead on the processes. This neglect has taken place despite the central role of particular contents and meanings which underlie identification and intergroup relationships [19]. Moreover, these contents are key to understanding the strategies used to combat threats to group identity [10], as well as particular forms of intergroup behavior [19]. We further argue that understanding contents is crucial to learning the extent to which significant changes in places may impact residents’ identity.

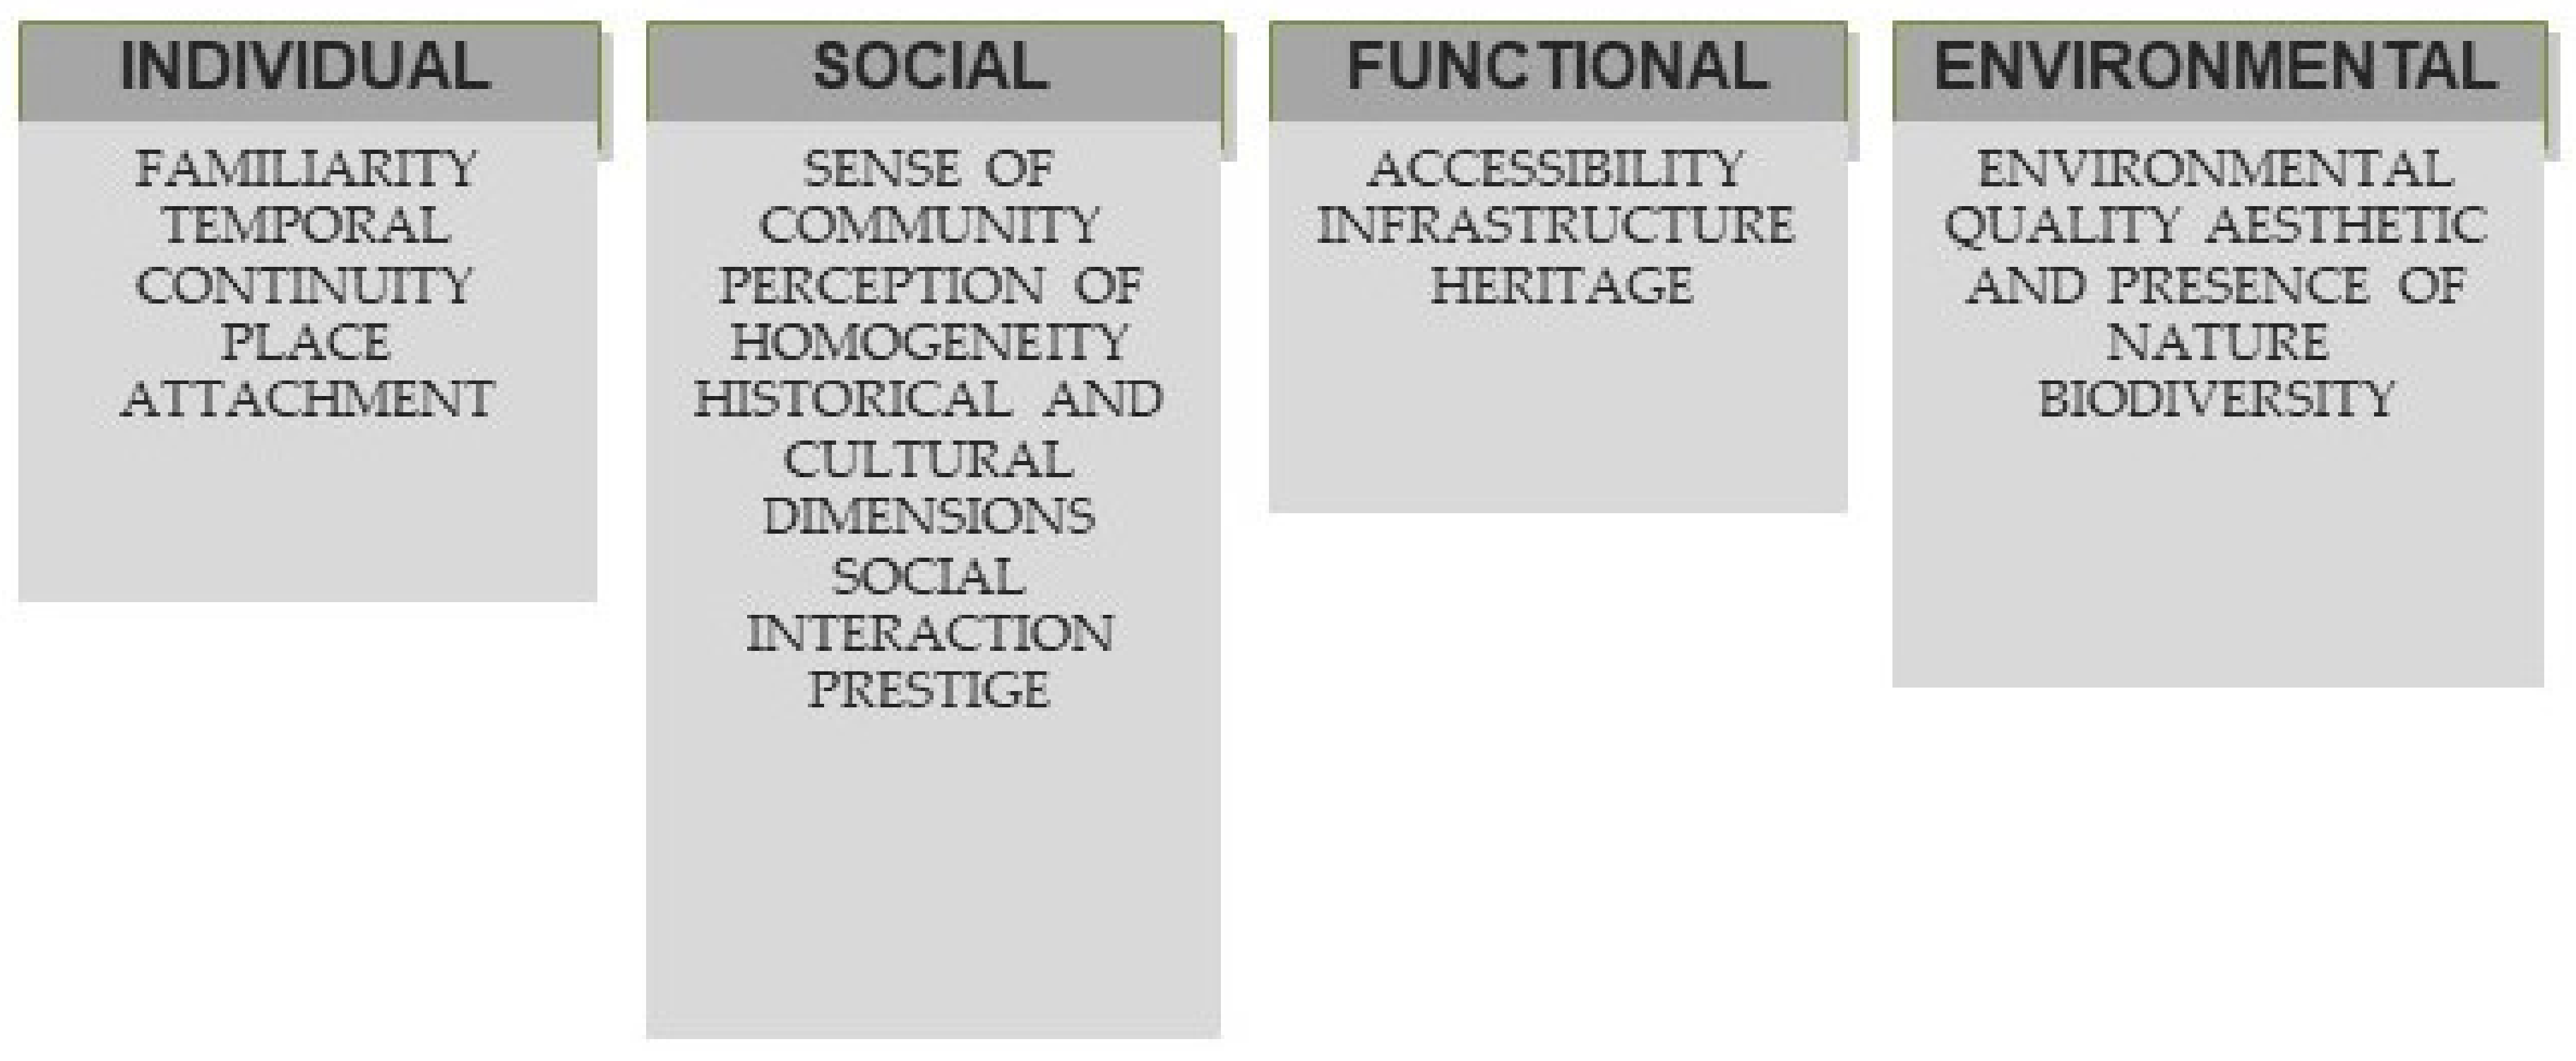
1.1. Place Identity Contents

Research to date has focused little on the contents of identity, its structure or the motives underlying people’s relationship and identification with places. However, some studies have tangentially revealed some contents and enabled us to draw analogies, particularly Droseltis and Vignoles [20], Gustafson [21] and Belanche et al. [2,22].
Droseltis and Vignoles [20] drew up a model of dimensions and predictors of place identification, establishing two categories of predictors: (a) individual motives and needs; and (b) social and symbolic links to places. The first category emerges from social and personality psychology, in particular from Breakwell’s [13,23] and Maslow’s [24] work on basic human needs. The second category emerges from Low’s works [25], which called attention to six kinds of symbolic linkage between people and the environment. Each identified dimension is predicted by different combinations of needs, motives and social and symbolic links. Gustafson [21] took a more qualitative, anthropological approach and drew up an analytical framework looking at the spontaneous assignment of meanings to places. He mapped out respondents’ answers in a tri-polar model: “self”, “others” and “environment”. The meanings assigned to the places are located not only in the poles, but also along the lines of their interconnections. The study revealed not only a wide range of meanings attributed to places by individuals but also that these meanings differed according to the size of the place. He found that smaller places often attribute meanings along the self and self–other poles while larger places locate more meanings along the other and environmental axes. These results echoed those of Duarte and Lima [26] showing that meanings of place identity contents differ according to the size of the localities.
In their study of Zaragoza, Spain, Belanche et al. [2] studied five components of the city’s identity: cultural, historical, political, social and environmental, as suggested by Lalli [27]. Additional research has looked into place identity contents as they relate to residential satisfaction [28,29,30]. Most of these results reinforce the idea that different dimensions contribute differently to the relationships between people and places.
We drew from the literature four categories of place identity contents: (1) individual, (2) social, (3) functional and (4) environmental (Figure 1).
The first, or individual, category corresponds to Gustafson’s “self” pole [21] and resembles the “self” extension dimension defined in Droseltis and Vignoles [20]. It refers to a personal dimension resulting from interaction with a certain place. The basic connection is anchored in affectivity and involves experience, personal history and memory (e.g., [6,31,32]). It also encompasses features of perceived familiarity [33] (Lalli, 1988) and temporal continuity [33,34,35,36]. Place attachment is highly representative of this category and has made key contributions to understanding place identity, although the relationship between these two concepts is debated. Hernández and colleagues [6] published results showing that place attachment precedes the formation of place identity, revealing that affective bonds serve as a strong anchor for people’s relationships with significant places. Place attachment is associated with variables including age, mobility, time of residence, meaning of places and social belonging, and others [37,38,39]. For example, place of birth is an important determining factor that influences place identity [40,41].
The second category deals with the social aspects of a relationship with place and resembles Gustafson’s “others” pole and the “self–other” interactions [21]. It moreover bears similarity with one of Droseltis and collaborators’ identity of place predictors [20] called social links to places.
The relationship with place has commonly been seen as a social construct resulting from shared behavior and cultural processes and rooted in the physical characteristics of space [39,42]. These two place components usually appear together, revealing a general affective feeling towards the place of residence that is anchored in social and physical features. A range of factors contributes to the social construction of a place. Internal aspects include social relations and a common history, while those like age and other people’s stereotypes of the place are thought to be external [43]. Historical past events and heritage features help shape socio-cultural place identities by establishing a narrative of continuity from the past to present [44], even though building on tangible material features heritage is more about the meanings placed upon them, projecting a present-day collective set of norms and values [45]. Thus, heritage becomes a vehicle for memory as the “collective understandings of the past” [46].
Research has looked into various features influencing the social construction of places including social interaction [20,28,29,42,47], which deals with relationships established between the self and others; perceived homogeneity [28,43], which looks into the perceived characteristics of the group and the individuals associated with a certain place; the external image of a place or its prestige [20,30,43,48]; genealogical relations, traditions and relevant historical-cultural aspects [20,49]; lifestyle and use of public space [50]; and a sense of community [51,52,53]. Social aspects have been found particularly relevant to place identity and to residential satisfaction, and geographical features, in turn, have been shown to serve as a primary catalyst for social processes (e.g., [30,54]).
The last two categories (functional and environmental) generally resemble Gustafson’s environmental pole [21], as well as Scannel and Gifford’s physical component of place [55] in their “tripartite organizing framework” of place attachment. Due to the importance of looking at the physical and/or geographical influence of residents’ identification with places [55,56], we decided to separate the functional features of the physical space (functional dimension) from the environmental, or natural, ones such as nature, biodiversity and environmental quality (environmental dimension). The functional dimension comprises items such as infrastructure, accessibility and services [28,29,32,57] as well as the existence of public green spaces [28,30,58] and heritage. For instance, Stefaniak and colleagues [59] propose that discovering local history may result in a greater place attachment.
Although the physical, natural and built environment appears to be of key importance, it is frequently treated as a mere stage for social processes [60]. Some physical environmental factors like size, density, proximity, amenities, type of organization or consistency of architecture [61] can act not only as facilitators of social interaction [62] but also as the external perception of a certain place (see, for example, Brewer [63] and the identification of the subject with space).
Some authors highlight the contribution of the physical characteristics of a place as central to people’s connection with it. This is the case in the concept of “place dependency”, which argues that place contributes to identity insofar as it provides resources to support residents’ needs and goals [64]. A comparative study between people’s processes of identification and their residential satisfaction in three major French cities revealed the importance of place functionality, namely, services (proximity to health services and availability of public transport) and green areas (availability and quality of public gardens and the amount of green space) [30]. The functionality of places has also been shown to predict residential satisfaction in semi-rural contexts and, particularly, among the elderly population [29]. Among other conclusions, Duarte and Lima [26] found that the participants identifying most closely with their place of residence assess their locality as being significantly more functional, more beautiful and pleasant, better satisfying their basic needs, and having fewer environmental problems. A recent experimental study also pointed out that the perception of loss of physical and social characteristics of a place has an immediate negative effect on place attachment [65].
Finally, the fourth, environmental, dimension refers mainly to environmental features, bringing it a little closer to the interconnection between Gustafson’s poles of the “environment–self” and “other–environment” relations [21]. It also encompasses contents such as heritage and/or natural elements, proximity to nature, aesthetics and perceived environmental quality [28]. Environmental identity, which refers to the incorporation of the relationship with nature into self-concept, has also been shown to be of importance [56]. Self-definitions arising from the natural environment have been found to result from people’s general connection with nature [66]. Both the link to nature and place identity prioritize emotional connections over physical configurations. The authors also recognized the existence of relationships between the bond to nature and the social bond to the physical environment, which provides the context for the resulting experiences and social bonds [66].
Another line of work has focused more on cognitive dimensions of environmental identity, in order to understand the extent to which individuals incorporate nature into their cognitive self-representation. Schultz and colleagues [67] suggest that individuals who have implicit connections with nature report more environmental concerns.
This categorization served as a basis for the scale used in studies 1 and 2.

1.2. Current Research

The goal of the current studies was to develop a measure of place identity contents that would elucidate which dimensions contribute most to place identity in any location, closing the gap created by the absence of studies and measurement tools in this field. Thus, three studies are presented. The first two developed a scale to measure the contents of place identity. The third study aimed to understand the contents contributing to varying place identities by way of field studies in three distinct parishes within the Lisbon metropolitan area that differed in many of their physical and social characteristics.

2. Study 1

2.1. Study Objectives

Study 1 drew up a place identity contents scale comprising four categories taken from the literature. Correlations between the place identity contents subscales with place identity and sociodemographic variables such as age, gender and size of the place of residence were also explored.

2.2. Method

2.2.1. Participants

Four hundred twenty-two residents from different Portuguese cities participated in the study, through a snowball process. Thirty individuals were dropped from the study due to incorrect completion of the materials, leaving 392 subjects.
The sample consisted of 63.0% women (n = 266) and 37% men (N = 156), with an overall mean age of 37.8 years (SD = 17.79). Of them, 29.9% (N = 126) were less than 24 years of age, 46.2% (N = 195) were aged from 25–49, 14.5% (N = 61) were in the 50–65 age range and 9.5% (N = 40) were older than 65 (Table 1).
Using the breakdown of the National Statistics Institute (2011), the following professions were represented: 52 (13.7%) were intellectual and scientific specialists, 29 (6.9%) were technicians and associate professionals, 25 (5.9%) were administrative workers, 38 (9%) employees of personal services, protection and security and salespeople, 2 (0.5%) worked in farming, fishing or forestry sectors, 12 (2.8%) were industrial or construction workers or craftspeople, 40 (9.5%) were unskilled workers, 174 (34.8%) were students, 38 (9%) were retired and 19 (4.5%) were unemployed.
Participants were also categorized according to the size of their city of residence in the identity contents, as displayed in Table 1. Medium-sized cities were defined as having a population ranging from 10,000 to 100,000 inhabitants.

2.2.2. Instruments and Procedures

Four categories were selected based on the literature review (see Figure 1). Several methods were devised to generate the definitions and contents of each category. Extensive reading in psychology and other fields (e.g., architecture, geography, history, landscape architecture, sociology) addressing place identity contents was complemented by the existing measures in the literature (e.g., [11,20,27,30,68]). The first version of the identity contents scale included 62 items.
All participants answered a three-part paper-based questionnaire. Part 1 assessed identity contents using a 62-item place identity contents scale (PICS) using a six-point response scale (from 1, strongly disagree, to 6, strongly agree). Participants then responded to two place identity statements (“I identify with this neighborhood” and “I feel I belong to this neighborhood”) [6]. The last section gathered socio-demographic data, namely, age, gender, profession and/or occupation, place of birth and place and length of residence. To participate in the study, residents had to have lived in the area for at least 10 years.
Before filling in the questionnaire, participants were informed of the study’s general goals and asked to focus on the characteristics of the place in which they lived. Afterwards, they were debriefed about the specific aims and expected results of the study and were thanked for participating.

Place Identity Contents Scale (PICS)

A 62-item place identity contents scale (PICS) was drawn up covering four major dimensions of place identity: (a) the individual dimension asked seven questions related to familiarity, continuity with the past and connection to the place; (b) the social cluster comprised 32 items dealing with a sense of community, perceived homogeneity, historical-cultural dimension, social interaction and external evaluation of the place; (c) the functional group asked about the instrumental dimension, namely, accessibility, infrastructure and services, built heritage and public spaces; and (d) the environmental posed twelve questions regarding environmental quality, aesthetics and the presence of nature and biodiversity.

2.3. Results

2.3.1. Place Identity Contents Scale

The initial frequency analysis led to the elimination of 12 items that lacked discriminatory power, with 75% agreement. Subsequently, an exploratory varimax rotation factor analysis of the remaining 50 questions was performed (IBM SPSS Statistics 25). Five factor analyses were carried out until a coherent and satisfactory solution was reached. An additional 26 items were deleted for various reasons: (1) low factor weights (<0.40) (5 items); (2) contributing to the explanation of more than one factor (3 items); and (3) contributing to weak internal consistency within a factor (15 items). Table 2 displays the final results: eight factors, on a scale of 24 items, explaining 71.61% of the total variance of the scale.
The environmental dimension explained 20.8% of this variation and presented two associated factors: factor 1, “Environmental Quality”, with 4 items related to environmental quality issues, and factor 3, “Biodiversity”, with 3 items related to biodiversity, nature and aesthetics. The functional dimension presented only one factor, factor 2, designated “Functionality”, with 4 items related to infrastructures, services and accessibility, explaining 9.71% of the total variation of the scale. The social dimension presented four associated factors, which together explained 34.31% of the total variance of the scale: factor 4, designated “Genealogy”, contained 3 items associated with origins and familiarity with the place; factor 5, “Historical-Cultural”, gathered 3 items referring to the history and traditions of the place; factor 6, “Social Networks”, with 3 items referring to the quality of social connections; and factor 7, “ Homogeneity”, presented 2 items referring to the similarity between residents’ traits and lifestyle. Finally, the individual dimension had factor 8, “Attachment”, expressed in 2 items related to the emotional attachment established with the place of residence. Cronbach’s alpha for all scales was >0.70.
Each factor comprised a subscale. In order to enhance comparability, an item mean for each factor was calculated so that all scores ranged from 1 to 6. Correlations between the subscales, along with means and standard deviations, appear in Table 4.

2.3.2. Contents of Place Identity Contents, Place Identity Intensity

Table 3 shows correlations between place identity and the eight subscales of the place identity contents scale. Place identity correlated positively with all the subscales, except homogeneity. The correlation was very strong with attachment and strong with biodiversity and genealogy.

2.3.3. Place Identity Contents and Socio-Demographic Variables

No significant gender differences appeared for any of the subscales. Age differences arose regarding genealogy, social networks and attachment (Table 4). The youngest cohort reported significantly higher genealogy and social network values than the others. The two oldest age groups scored significantly higher regarding attachment.

2.3.4. Place Identity Contents, Place Identity Intensity and Town Size

A one-way ANOVA analyzed whether identity contents varied according to sites’ population size (Table 5). Significant differences were uncovered for all contents except for the historical-cultural factor. Significant differences appeared for environmental quality and biodiversity between large cities and towns or villages and between the latter and medium-sized cities. Significant differences also arose for functional and genealogical factors according to size, as did those for social networks. Attachment factor differences were also significant.
It is important to point out that the various identity content scores increased inversely relative to locality size, with the same pattern appearing for place identity. This applied for all items except the functional ones, which increased as the size of the place increased.

3. Study 2

Study 2 aimed to replicate Study 1 but with the final version of the place identity contents scale. A confirmatory factor analysis (CFA) confirmed the scale structure.

3.1. Method

3.1.1. Participants

A total of 594 residents of the Lisbon metropolitan area answered the paper-based questionnaire. The sample consisted of 53% women (n = 315) and 47% men (n = 279), with a mean overall age of 48.19 years (SD = 18.15). Most had less than nine years of formal schooling (37.7%), 27.4% had completed nine years, 18.5% had finished secondary school, 14.4% had completed a first-cycle or vocational degree, and 2% had a master’s degree.
As for their professional breakdown, 4.5% of the sample were intellectual and scientific specialists, 9% were technicians and associate professionals, 5.1% administrative workers, 29.8% worked in personal services, protection and security and sales, 7.3% were in the farming, fishing and forestry sectors, 16.7% were industrial and construction workers and craftspeople, 9.4% were unskilled workers, 4.9% students and 13.3 were either unemployed, retired, or in the other category.

3.1.2. Measures

Participants completed Study 1′s finalized place identity contents scale (PICS), with 24 items divided into eight subscales. They also completed Study 1′s place identity scale. For questions asked about place satisfaction (“How satisfied are you with the place where you live?”) and quality of life in the place (“In general, how do you assess the quality of life in your area of residence?”), a six-point scale was used for place satisfaction and quality of life (from 1, not at all satisfied, to 6, strongly satisfied, and from 1, very bad, to 6, excellent, respectively).

3.2. Results

AMOS was used for the confirmatory factor analysis (CFA) procedures (IBM SPSS Amos 25). Multiple fit indices evaluated the model in addition to the chi-square, as per Kline (2005). The fit indices included the root mean square error of approximation (RMSEA), the comparative fit index (CFI) and the Tucker–Lewis index (TLI). Values greater than 0.90 and 0.95 for the CFI and TLI indicated acceptable and good fit, respectively. RMSEA values less than 0.08 reflected a reasonable fit, while those less than 0.05 were defined as a good fit [69]. Standardized factor loadings were also considered.
The model from Study 1 demonstrated a good to acceptable or reasonable fit to the data: χ2/df = 2.79, p < 0.000, CFI = 0.93, TLI = 0.91, RMSEA = 0.05. All factor loadings were >0.40 (see Table 6). CPIS subscale scores correlated with place identity, place satisfaction and quality of life in the place.
PIC subscales were correlated to explore the concurrent and discriminant validities. Table 3 shows that place identity results were generally similar to those of Study 1, although additional correlations were found with environmental quality, functionality and newly introduced variables. Significant positive correlations appeared between place satisfaction and quality of life and all PIC subscales except homogeneity.
As in Study 1, no gender differences arose for any subscales. Age did differ significantly for genealogy (F(3.590) = 6.31, p < 0.001) and attachment (F(3590) = 19.28, p < 0.001), while a marginal difference also appeared regarding biodiversity (F(3590) = 2.51, p < 0.058) and social networks (F(3590) = 2.52, p < 0.058). As in Study 1, place attachment rose together with age, while genealogy and social network scores were also higher in the oldest and youngest cohorts.

4. Study 3

4.1. Study Objectives

Study 3 explored the applicability of the PIC scale and whether it would prove useful for understanding place identity contents in diverse locations. A field study took place in the highly distinct parishes of the metropolitan area of Lisbon, Portugal.

4.2. Method

4.2.1. Case Studies

A field study was conducted in different types of periurban areas in the Lisbon metropolitan area [70]: Poceirão, Agualva and Anunciada (Figure 2).
Anunciada is located within the coastal city of Setúbal. It has a high population density (508.4 inhab/km2 as of 2011) and good road and railway connections to the capital. The neighborhood of Troino has roots dating back to the Roman occupation. In the 16th and 17th centuries, a strong fisherman community arose that was stigmatized by the local bourgeoisie and competed intensely with rival fishing communities on the other side of the city. Since the 1980s, fishing activity has declined while fish restaurant tourism has grown. The parish also includes part of the Arrábida/Espichel EU Natura 2000 site (PTCON0010) with its remarkable Mediterranean habitats and marine ecosystems.
Poceirão is a more rural, less populated parish (32.4 inhab/km2) on the outskirts of the Lisbon metropolitan area. Its history is relatively recent, dating back to the early 20th century when people emigrated from other regions to settle and take up agriculture and winemaking. The railway station has been deactivated and local facilities are few, which leads to car dependency as residents seek services and commerce in nearby cities like Setúbal.
Agualva is a high-density (7787.3 inhab/km2), low-quality suburban area located along the main rail and highway lines linking Lisbon to Sintra. It depends functionally on the city of Lisbon, notably for employment. Despite the existence of a megalithic dolmen and the Roman site of Colaride, its urban occupation is recent. Before the 1960s, these lands were agricultural (Figure 2). An urban park has recently been created along the Jardas stream with public investment and it is very much valued by the population.

4.2.2. Participants

A total of 345 residents answered the questionnaire. The sample consisted of 54% women (n = 185), with a mean age of 49.41 years (SD = 18.15) (Table 7). Most had not completed nine years of schooling (38.8%), 28.1% had completed the ninth form, 15.7% had finished secondary school, 15.7% had a first-cycle or vocational degree and 1.7% had a master’s degree.
The sample comprised 3.7% intellectual and scientific specialists, 8.3% technicians and associate professionals, 5.9% administrative workers, 31% workers in personal services, protection and security and sales, 6.6% farm, fishing and forestry workers, 16.7% industrial and construction workers and craftspeople, 8.9% unskilled workers, 4.0% students and 14.9 unemployed, retired people or other.

4.2.3. Instruments and Procedure

Participants completed a three-part paper-based questionnaire. Part 1 used Study 1′s 24-item place identity contents scale (PICS) with a seven-point scale to record their answers (from 1, strongly disagree, to 7, strongly agree). As in Study 1, place identity data were collected in Part 2 and, as in Study 2, place satisfaction and quality of life information were requested as well. Part 3 gathered socio-demographic information, namely, age, gender, profession/occupation, level of education, place of birth, place of residence and length of residence. The length of residence had to be at least 10 years. After completing the questionnaire, participants were debriefed about the specific aims of the study and expected results and were thanked for their participation.

4.3. Results and Discussion

Place Identity Contents and Place Identity Intensity

Table 8 displays the wide range of identity contents between the three parishes. In all features except homogeneity, Agualva tended to receive the lowest scores and Anunciada the highest (Figure 3). Agualva scored significantly lower in the following sub-scales: environmental quality, biodiversity, genealogy, history–culture, social networks and attachment. Poceirão scored significantly lower than the other two parishes for functionality. Anunciada received the highest scores for all sub-scales, with significantly greater values for history and culture. Agualva scored significantly lower for place identity and satisfaction, and significantly lower than Anunciada regarding quality of life.
The application of the PIC scale to three different physical and social parishes made it possible to verify that every parish displays a highly distinct identity profile with easily identifiable characteristics. Anunciada received reliably high ratings for identity structure, which may be explained by its strong sense of community, which yielded high values for the historical-cultural dimension, social network and genealogy, as well as its centrality-supporting functionality. Anunciada, however, is very diverse. It extends from the center of the city of Setúbal to the coast and covers partially the Arrábida/Espichel NATURA 2000 site. It is well-known and valued regionally, and local people are well aware of the contribution of the ocean and nature to its environmental quality and biodiversity [71].
Poceirão only surpasses Anunciada regarding genealogy, social network and environmental quality, which may be traceable to the relatively small community size and its geographic isolation, which may lead residents to become more interdependent and to value social relationships. Although the environment was not found to vary in biodiversity, there are vast natural and semi-natural areas. Low historical-cultural and functionality ratings related to the parish’s short history [72] and to the lack of transportation infrastructure and other facilities. Despite these drawbacks, residents reported very high levels of attachment, similar to those of Anunciada, which shows that a strong identity can be associated with different contents and that even contexts without great external prestige and without physical characteristics that make it unique can be associated with a strong identity.
Agualva reported a very low level profile. All dimensions except functionality received low ratings. The high dependency on the city of Lisbon and the consequently intense commuting patterns leave the area empty during the daytime. There is no social value attached to the existing heritage. Moreover, as residents are mostly migrants, either those who came from rural Portugal in the 1960s or from former Portuguese colonies starting in the 1970s, people here reported hardly any family ties, giving very low scores both to genealogy and historic-cultural features. Rather unexpectedly, the new park did not contribute to a higher value for the perceived environmental quality.

5. General Discussion

The main objective of the presented set of studies was to explore ways of measuring the contents of place identity to support the process of planning interventions in the context of a human-centered approach. Based on the existing literature, we proposed and tested a new empirical tool to measure place identity contents, the PIC scale.
The results suggest that place identity contents can be identified and reliably measured, and they also reinforce the complexity of the notion of identity contents [14]. Eight place identity contents were revealed, fitting into four categories initially identified from the literature review: individual, social, functional and environmental.
This place identity contents structure aligns with Breakwell’s theoretical proposal [13,23,73], as shown below. The functional dimension and social networks include items referring to efficacy, i.e., the ease of dealing with everyday practical issues in that location. The same occurs to a certain extent with perceived environmental quality, even though this dimension is presented through negative characteristics of the environment (e.g., “There is a lot of traffic here”). Perceived homogeneity and the historical-cultural dimension seem to be related to the functions of distinctiveness, since the items that comprise them refer to a basis for individuals to distinguish the place and its residents from others (e.g., “I feel that people are very similar to each other”) and also to functions of self-esteem (e.g., “It has an interesting historical past”) and a sense of continuity revealed through the relationship it establishes with the history and past of the place.
On the other hand, the function of continuity is still evident in the attachment and genealogy dimensions, both of which include items of past continuity (e.g., “Many things here remind me of my past”). Attachment also included functions of self-esteem (e.g., “Living here is very important to me”).
These studies reinforce the idea that how individuals make use of these contents to characterize the places where they live is influenced by factors such as the intensity of place identity [3,14], the place dimension [26] and individuals’ age [6,37,38].
Analyzing the contents and degree of identity revealed that more closely identified individuals perceive places more positively than less identified ones, resulting in the amplification of positive characteristics and the minimization of negative ones. In this respect, ingroup bias or favoritism [74] appears to be at work, which, in turn, reinforces the notion that environmental characteristics influence identity and contribute to self-esteem [4,14].
This work aligns with previous research showcasing the flexibility [65,75] and dynamism of place identity processes [35]. To build a bond with a place, people use the available characteristics (physical and social) that can best contribute to a positive place identity, while devaluing any feature that might threaten said identity. Thus, a positive or prestigious identification contributes to the enhancement of the self-esteem of the individual and their group. These processes are similar to those identified by social identity theory concerning group identification, and we reinforce here the idea that place identity can also be understood as a particular case of social identity, consisting of aspects of self-identity based on identification with geographically defined groups [4].
Previous studies suggested that the social features of place may be more relevant to place bonds than physical ones [38,65]. Our data, however, did not confirm this. Social features were found to be more important in small urban areas than in big cities (Study 1). However, Study 3 revealed that people make use of any features that potentially contribute to a positive place perception. In some contexts, the key features were social and in others geographical.
The main limitations of this research related to the sampling procedure. Although the samples were from the general population rather than merely from students, they were not representative. Future studies should obtain representative samples. Moreover, the subscale order was not randomized and some order effects may have been felt.

6. Conclusions

What are the implications of these findings? Practical implications can be found across sectors and scales that can be used by city and local governments and by regional development or tourism agencies in spatial planning, heritage management or territorial branding.
Spatial planning and design strive to meet human needs by improving the quality of spaces that contribute to human well-being [76,77,78]. If more residents perceive such places more positively, these better places also favor the identification process. The studies presented in this article, by disentangling the various strands of identity, provide added value to better inform choices between alternative land use options and development projects. As the physical setting and the social structure are intertwined, the PIC scale provides a tool to steer action to identify and mend pitfalls without undermining existing values in order to contribute to the increased resilience of communities. Building on Lynch’s approach to understanding how people perceive and navigate through cities, these findings focus on the periurban realm, which is typically fragmented, and help to identify features of collective meaning that can provide an increased legibility.
In heritage management, the findings show the power of the past as a unifying force for the present, building on continuity across time, but also the prestige provided by an outgroup, as by tourists valuing the place for its qualities. Thus, historical areas in larger cities could benefit from well-targeted urban rehabilitation, combining more heritage- and cultural-related aspects with functional ones, which is actually in line with the UNESCO Recommendation on the Historic Urban Landscape [79].
Place branding aims at re-invigorating territorial identities through the marketing of geographical distinctiveness. As much as it “has been factored out of planning” as the basis for a place-based form of planning [80], it is still a cornerstone of regional and rural development aiming at attracting people and activities, and increasing territorial competitiveness [81], or in rural areas by orienting economies based on their natural and cultural heritage [82]. As much as place branding speaks to the outgroup (e.g., tourists, investors, migrants), the ingroup needs to be connected to achieve a positive outcome. The findings of this study provide insights into what are the contents of identity that these territories could use to build a place branding strategy.
In some cases, the place identity is associated with a large range of contents that make the place unique, and in other cases it is associated with a small set of contents. In both types of cases, we can have a strong place identity; however, an identity based on a wide and varied set of contents is in a better position to be resilient. In this sense, future studies should focus on the importance and vulnerability of the different contents to external pressure and the impact of the changes that may occur.
Identifying and understanding the factors that contribute to the identity of a place as perceived by its residents facilitates planning and development that is coherent with that identity, i.e., the introduction of transformations that, according to the local community, agree with the character of a place [83]. If such coherence is not maintained, we risk destroying in the medium or long term the attachment of residents to the place, and thus the character of the place [50]. The attachment to places that hold personal meaning and significance builds emotional connections which are a powerful driving force in promoting sustainable practices and behaviors [84]. In line with Selman [85], increased connectedness and strong place identity are more likely to foster a sense of ownership and responsibility towards a community and environment, thereby contributing to transformational change in the framework of a sustainable development agenda.
By scrutinizing in more detail the sustainable development goals that are considered relevant by people for shaping their identity in this periurban territory, the focus is clearly on SGD 11—Sustainable cities and communities, linking with SGD 3—Health and well-being and SGDs 6, 15—Life on land and water when environmental quality and biodiversity issues are considered, and also with SGD 9—Sustainable infrastructure when functional aspects are foremost linked by the population to mobility issues.
The PIC scale discriminates among the various contents of each place’s identity. These contents are crucial for understanding many key issues. They elucidate the coping mechanisms that may serve to protect against threats to group identity [10]. They increase understanding of intergroup behavior [19] and are crucial to predicting the extent to which significant changes in places can have an impact on the identity of its residents [65,83]. Ultimately, these studies also show that people “hang on to what they can”, that the assets they use depend on the qualities of the context, and that considering identity when changing context in territorial decision making matters in promoting long-term human well-being.
The studies presented here are not free of limitations. Firstly, they are studies with samples that are not representative of the population, which limits their generalizability. Secondly, the identity contents questionnaire was not exhaustive for all the dimensions of place identity. For example, the architectural heritage dimension seems under-represented. Future studies should apply this questionnaire to other contexts to validate its applicability.

Author Contributions

Conceptualization, F.B. and I.L.-R.; Methodology, F.B., I.L.-R. and R.C.; Formal analysis, R.C.; Investigation, F.B. and R.C.; Writing—original draft, F.B. and I.L.-R.; Writing—review & editing, F.B. and I.L.-R. All authors have read and agreed to the published version of the manuscript.

Funding

This research was funded by the Foundation for Science and Technology’s support through funding UIDB/05703/2020 from the research unit CiTUA—Centre for innovation in Territory, Urbanism and Architecture.

Informed Consent Statement

Informed consent was obtained from all subjects involved in the study.

Data Availability Statement

The data presented in this study are available on request from the corresponding author.

Acknowledgments

The authors are grateful for the Foundation for Science and Technology’s support through funding UIDB/05703/2020 from the research unit CiTUA—Centre for innovation in Territory, Urbanism and Architecture.

Conflicts of Interest

The authors declare no conflict of interest.

References

  1. Proshansky, H.M.; Fabian, A.K.; Kaminoff, R. Place Identity: Physical world socialization of the self. J. Environ. Psychol. 1983, 3, 57–83. [Google Scholar] [CrossRef]
  2. Belanche, D.; Casaló, L.V.; Flavián, C. Understanding the cognitive, affective and evaluative components of social urban identity: Determinants, measurement, and practical consequences. J. Environ. Psychol. 2017, 50, 138–153. [Google Scholar] [CrossRef]
  3. Bernardo, F.; Palma-Oliveira, J.-M. Identification with the neighborhood: Discrimination and neighborhood size. Self Identity 2016, 15, 579–598. [Google Scholar] [CrossRef]
  4. Bernardo, F.; Palma-Oliveira, J.-M. Urban neighbourhoods and intergroup relations: The importance of place identity. J. Environ. Psychol. 2016, 45, 239–251. [Google Scholar] [CrossRef]
  5. Dixon, J.; Durrheim, K. Displacing place-identity: A discursive approach to locating self and other. Br. J. Soc. Psychol. 2000, 39, 27–44. [Google Scholar] [CrossRef]
  6. Hernández, B.; Hidalgo, M.C.; Salazar-Laplace, M.E.; Hess, S. Place attachment and place identity in natives and non-natives. J. Environ. Psychol. 2007, 27, 310–319. [Google Scholar] [CrossRef]
  7. Clarke, D.; Murphy, C.; Lorenzoni, I. Place attachment, disruption and transformative adaptation. J. Environ. Psychol. 2018, 55, 81–89. [Google Scholar] [CrossRef]
  8. Devine-Wright, P. Think global, act local? The relevance of place attachments and place identities in a climate changed world. Glob. Environ. Chang. 2013, 23, 61–69. [Google Scholar] [CrossRef]
  9. Barney, J.B.; Bunderson, S.; Foreman, P.; Gustafson, L.T.; Huff, A.S.; Martins, L.L.; Stimpert, J.L. A strategy conversation on the topic of organization identity. In Identity in Organizations. Building Theory Through Conversations; Whetten, A.D., Godfrey, P.C., Eds.; Sage Publications: New York, NY, USA, 1998; pp. 99–168. [Google Scholar]
  10. Ellemers, N.; Spears, R.; Doosje, B. Self and social identity. Annu. Rev. Psychol. 2002, 53, 161–186. [Google Scholar] [CrossRef] [PubMed]
  11. Abdelal, R.; Herrera, Y.M.; Johnston, A.I.; McDermott, R. Identity as a Variable. In Measuring Identity: A Guide to Social Scientists; Abdelal, R., Herrera, Y.M., Johnston, A.I., McDermott, R., Eds.; Cambridge University Press: Cambridge, UK, 2006; pp. 695–711. [Google Scholar]
  12. Ellemers, N.; Kortekaas, P.; Ouwerkerk, J.W. Self-categorisation, commitment to the group and group self-esteem as related but distinct aspects of social identity. Eur. J. Soc. Psychol. 1999, 29, 371–389. [Google Scholar] [CrossRef]
  13. Breakwell, G. Coping with Threatened Identities; Methuen, Ed.; Psychology Press: London, UK, 1986. [Google Scholar]
  14. Twigger-Ross, C.; Bonaiuto, M.; Breakwell, G. Identity theories and environmental psychology. In Psychological Theories For Environmental Issues; Bonnes, M., Lee, T.R., Eds.; Ashgate: Farnham, UK, 2003; pp. 203–234. [Google Scholar]
  15. Reicher, S.; Hopkins, N. Self and Nation: Categorization, Contestation and Mobilisation; Sage: London, UK, 2001. [Google Scholar]
  16. Brown, R. Social identity theory: Past achievements, current problems and future challenges. Eur. J. Soc. Psychol. 2000, 30, 745–778. [Google Scholar] [CrossRef]
  17. Lalonde, R.N. Testing the social identity-intergroup differentiation hypothesis:‘We’re not American eh!’. Br. J. Soc. Psychol. 2002, 41, 611–630. [Google Scholar] [CrossRef] [PubMed]
  18. Turner, J.C. Some current issues in research on social identity and self-categorization theories. In Social Identity; Ellemers, N., Spears, R., Doosje, B., Eds.; Blackwell: Oxford, UK, 1999; pp. 6–34. [Google Scholar]
  19. Livingstone, A.; Haslam, A. The importance of social identity content in a setting of chronic social conflict: Understanding intergroup relations in Northern Ireland. Br. J. Soc. Psychol. 2008, 47, 1–21. [Google Scholar] [CrossRef] [PubMed]
  20. Droseltis, O.; Vignoles, V.L. Towards an integrative model of place identification: Dimensionality and predictors of intrapersonal-level place preferences. J. Environ. Psychol. 2010, 30, 23–34. [Google Scholar] [CrossRef]
  21. Gustafson, P. Meanings of place: Everyday experience and theoretical conceptualizations. J. Environ. Psychol. 2001, 21, 5–16. [Google Scholar] [CrossRef]
  22. Belanche, D.; Casaló, L.V.; Rubio, M.Á. Local place identity: A comparison between residents of rural and urban communities. J. Rural. Stud. 2021, 82, 242–252. [Google Scholar] [CrossRef]
  23. Breakwell, G. Integrating paradigms: Methodological implications. In Empirical Approaches to Social Representations; Breakwell, G.M., Canter, D.V., Eds.; Clarendon Press: Oxford, UK, 1993. [Google Scholar]
  24. Maslow, A.H. Motivation and Personality; Harpers: New York, NY, USA, 1954. [Google Scholar]
  25. Low, S.M.; Altman, I. Place Attachment. In Human Behavior and Environment; Altman, I., Low, S.M., Eds.; Springer: Boston, MA, USA, 1992; Volume 12. [Google Scholar] [CrossRef]
  26. Duarte, A.P.; Lima, M.L. Análise dos conteúdos da identidade associada ao lugar. Psicologia 2005, 19, 193–226. [Google Scholar] [CrossRef]
  27. Lalli, M. Urban-related identity: Theory, measurement, and empirical findings. J. Environ. Psychol. 1992, 12, 285–303. [Google Scholar] [CrossRef]
  28. Bonaiuto, M.; Fornara, F.; Bonnes, M. Perceived residential environment quality in middle-and low-extension Italian cities. Eur. Rev. Appl. Psychol. 2006, 56, 23–34. [Google Scholar] [CrossRef]
  29. Rioux, L.; Werner, C. Residential satisfaction among aging people living in place. J. Environ. Psychol. 2011, 31, 158–169. [Google Scholar] [CrossRef]
  30. Fleury-Bahi, G.; Félonneau, M.-L.; Marchand, D. Processes of place identification and residential satisfaction. Environ. Behav. 2008, 40, 669–682. [Google Scholar] [CrossRef]
  31. Lewicka, M. What makes neighborhood different from home and city? Effects of place scale on place attachment. J. Environ. Psychol. 2010, 30, 35–51. [Google Scholar] [CrossRef]
  32. Manzo, L.C. For better or worse: Exploring multiple dimensions of place meaning. J. Environ. Psychol. 2005, 25, 67–86. [Google Scholar] [CrossRef]
  33. Lalli, M. Urban Identity. In Environmental Social Psychology; Canter, D., Jesuino, J.C., Soczka, L., Stephenson, G.M., Eds.; Kluwer Academic Publishers: Dordrecht, The Netherlands, 1988. [Google Scholar]
  34. Lewicka, M. Search of roots: Memory as an enabler of place attachment. In Place attachment: Advances in theory, methods and applications; Devine-Wright, M., Ed.; Routledge: London, UK, 2013; pp. 49–60. [Google Scholar]
  35. Trąbka, A. From functional bonds to place identity: Place attachment of Polish migrants living in London and Oslo. J. Environ. Psychol. 2019, 62, 67–73. [Google Scholar] [CrossRef]
  36. Twigger-Ross, C.; Uzzell, D.L. Place and identity processes. J. Environ. Psychol. 1996, 16, 205–220. [Google Scholar] [CrossRef]
  37. Hay, R. Sense of place in developmental context. J. Environ. Psychol. 1998, 18, 5–29. [Google Scholar] [CrossRef]
  38. Hidalgo, M.C.; Hernandez, B. Place attachment: Conceptual and empirical questions. J. Environ. Psychol. 2001, 21, 273–281. [Google Scholar] [CrossRef]
  39. Lewicka, M. Place attachment: How far have we come in the last 40 years? J. Environ. Psychol. 2011, 31, 207–230. [Google Scholar] [CrossRef]
  40. Hui, E.C.; Zhong, J.; Yu, K. Mobility and work-residence matching for new immigrants in Hong Kong. Habitat Int. 2012, 36, 444–451. [Google Scholar] [CrossRef]
  41. Zenker, S.; Rütter, N. Is satisfaction the key? The role of citizen satisfaction, place attachment and place brand attitude on positive citizenship behavior. Cities 2014, 38, 11–17. [Google Scholar] [CrossRef]
  42. Azarian, R. Social construction of places as meaningful objects: A symbolic interactionist approach. Int. Rev. Sociology 2023, 2023, 2259060. [Google Scholar] [CrossRef]
  43. Valera, S.; Guardia, J. Urban social identity and sustainability: Barcelona’s Olympic Village. Environ. Behav. 2002, 34, 54–66. [Google Scholar] [CrossRef]
  44. Ashworth, G. From History to Heritage—From Heritage to Identity: In search of concepts and models. In Marketing in the Tourism Industry: The Promotion of Destination Regions; Goodall, B., Ashworth, G., Eds.; Routledge Library Editions: Tourism; Routledge: London, UK, 2013; ISBN 9780203066966. [Google Scholar]
  45. Graham, B.; Howard, P. Introduction: Heritage and Identity. In The Ashgate Research Companion to Heritage and Identity; Graham, B., Howard, P., Eds.; Ashgate Publishing Limited: Hampshire, UK, 2008; pp. 1–19. ISBN 978-0-7546-4922-9. [Google Scholar]
  46. Harvey, D. The History of Heritage. In The Ashgate Research Companion to Heritage and Identity; Graham, B., Howard, P., Eds.; Ashgate Publishing Limited: Hampshire, UK, 2008; pp. 19–36. ISBN 978-0-7546-4922-9. [Google Scholar]
  47. Kyle, G.; Graefe, A.; Manning, R. Testing the dimensionality of place attachment in recreational settings. Environ. Behav. 2005, 37, 153–177. [Google Scholar] [CrossRef]
  48. Udir-Mišič, K.; Podnar, K. Perception of city management, fellow residents, and Perceived External Prestige (PEP) as antecedents of city affective commitment—The city marketing perspective. Cities 2019, 84, 66–74. [Google Scholar] [CrossRef]
  49. Ziyaee, M. Assessment of urban identity through a matrix of cultural landscapes. Cities 2018, 74, 21–31. [Google Scholar] [CrossRef]
  50. Bernardo, F.; Almeida, J.; Martins, C. Urban identity and tourism: Different looks, one single place. Proc. Inst. Civ. Eng.-Urban Des. Plan. 2017, 170, 205–216. [Google Scholar] [CrossRef]
  51. Brown, B.; Perkins, D.; Brown, G. Place attachment in a revitalizing neighborhood: Individual and block levels of analysis. J. Environ. Psychol. 2003, 23, 259–271. [Google Scholar] [CrossRef]
  52. Chavis, D.M.; Pretty, G.M. Sense of community: Advances in measurement and application. J. Community Psychol. 1999, 27, 635–642. [Google Scholar] [CrossRef]
  53. Uzzell, D.; Pol, E.; Badenas, D. Place identification, social cohesion, and enviornmental sustainability. Environ. Behav. 2002, 34, 26–53. [Google Scholar] [CrossRef]
  54. Sharp, G. Changing in place? Neighbourhood change and place attachment among movers and stayers in Los Angeles. Popul. Space Place 2019, 25, e2189. [Google Scholar] [CrossRef]
  55. Scannell, L.; Gifford, R. The relations between natural and civic place attachment and pro-environmental behavior. J. Environ. Psychol. 2010, 30, 289–297. [Google Scholar] [CrossRef]
  56. Clayton, S. Environmental identity: A conceptual and an operational definition. In Identity and the Natural Environment: The Psychological Significance of Nature; The MIT Press: Cambridge, MA, USA, 2003; pp. 45–65. [Google Scholar]
  57. Scannell, L.; Gifford, R. Defining place attachment: A tripartite organizing framework. J. Environ. Psychol. 2010, 30, 1–10. [Google Scholar] [CrossRef]
  58. Rishbeth, C.; Powell, M. Place attachment and memory: Landscapes of belonging as experienced post-migration. Landsc. Res. 2013, 38, 160–178. [Google Scholar] [CrossRef]
  59. Stefaniak, A.; Bilewicz, M.; Lewicka, M. The merits of teaching local history: Increased place attachment enhances civic engagement and social trust. J. Environ. Psychol. 2017, 51, 217–225. [Google Scholar] [CrossRef]
  60. Stedman, R.C. Is it really just a social construction?: The contribution of the physical environment to sense of place. Soc. Resour. 2003, 16, 671–685. [Google Scholar] [CrossRef]
  61. Bernardo, F.; Palma-Oliveira, J.M. Tell me where you live… How the perceived entitativity of neighborhoods determines the formation of impressions about their residents. Front. Psychol. 2022, 13, 821786. [Google Scholar] [CrossRef] [PubMed]
  62. Fried, M. Grieving for a lost home. In The Urban Condition; Duhl, L., Ed.; Basic Books: New York, NY, USA, 1963. [Google Scholar]
  63. Brewer, M.B. The role of distinctiveness in social identity and group behaviour. In Group Motivation: Social Psychology Perspectives; Abrams, D., Hogg, M.A., Eds.; Harvester Wheatsheaf: London, UK, 1993; pp. 1–16. [Google Scholar]
  64. Stokols, D.; Shumaker, S. People in places: A transactional view of settings. In Cognition, Social Behavior and Environment; Harvey, J., Ed.; Erlbaum: Mahwah, NJ, USA, 1981. [Google Scholar]
  65. Reese, G.; Oettler, L.M.; Katz, L.C. Imagining the loss of social and physical place characteristics reduces place attachment. J. Environ. Psychol. 2019, 65, 101325. [Google Scholar] [CrossRef]
  66. Raymond, C.M.; Brown, G.; Weber, D. The measurement of place attachment: Personal, community, and environmental connections. J. Environ. Psychol. 2010, 30, 422–434. [Google Scholar] [CrossRef]
  67. Schultz, P.W.; Shriver, C.; Tabanico, J.J.; Khazian, A.M. Implicit connections with nature. J. Environ. Psychol. 2004, 24, 31–42. [Google Scholar] [CrossRef]
  68. Bonaiuto, M.; Aiello, A.; Perugini, M.; Bonnes, M.; Ercolani, A.P. Multidimensional perception of residential environment quality and neighbourhood attachment in the urban environment. J. Environ. Psychol. 1999, 19, 331–352. [Google Scholar] [CrossRef]
  69. Maroco, J. Análise de Equações Estruturais: Report Number; Wook: Porto, Portugal, 2014. [Google Scholar]
  70. Gonçalves, J.; Gomes, M.C.; Ezequiel, S.; Moreira, F.; Loupa-Ramos, I. Differentiating peri-urban areas: A transdisciplinary approach towards a typology. Land Use Policy 2017, 63, 331–341. [Google Scholar] [CrossRef]
  71. Bernardo, F.; Loupa-Ramos, I.; Carvalheiro, J. Are biodiversity perception and attitudes context dependent? A comparative study using a mixed-method approach. Land Use Policy 2021, 109, 105703. [Google Scholar] [CrossRef]
  72. Loupa Ramos, I.; Bianchi, P.; Bernardo, F.; Van Eetvelde, V. What matters to people? Exploring contents of landscape identity at the local scale. Landsc. Res. 2019, 44, 320–336. [Google Scholar] [CrossRef]
  73. Breakwell, G. Social Representational Constraints upon Identity Processes; Wiley-Blackwell: Oxford, UK, 2001. [Google Scholar]
  74. Tajfel, H.; Turner, J.C.; Austin, W.G.; Worchel, S. An integrative theory of intergroup conflict. Organ. Identity Read. 1979, 56, 9780203505916–9780203505984. [Google Scholar]
  75. Scannell, L.; Gifford, R. Place attachment enhances psychological need satisfaction. Environ. Behav. 2017, 49, 359–389. [Google Scholar] [CrossRef]
  76. ECTP-CEU. The Charter of European Planning Retrieved. 2013. Available online: http://www.ectp-ceu.eu/index.php/en/publications-8/the-charter-of-european-planning-213 (accessed on 16 September 2023).
  77. Healey, P. Collaborative Planning: Shaping Places in Fragmented Societies; UBC Press: Vancouver, BC, Canada, 1997. [Google Scholar]
  78. Steiner, F.R.; Butler, K. Planning and Urban Design Standards; John Wiley Sons: Hoboken, NJ, USA, 2007. [Google Scholar]
  79. UNESCO. The UNESCO Recommendation on the Historic Urban Landscape. Report of the Second Consultation on its Implementation by Member States. 2019. Available online: https://whc.unesco.org/en/hul/ (accessed on 16 September 2023).
  80. Hall, P.; Tewdwr-Jones, M. Urban and Regional Planning, 6th ed.; Routledge: New York, NY, USA, 2020; ISBN 978-1-351-26188-3. [Google Scholar]
  81. Oliveira, E.H.d.S. Place branding in strategic spatial planning: A content analysis of development plans, strategic initiatives and policy documents for Portugal 2014–2020. J. Place Manag. Dev. 2015, 8, 23–50. [Google Scholar] [CrossRef]
  82. Margarisová, K.; Vokáčová, L. Regional Branding: Building Brand Value. Acta Univ. Agric. Silvic. Mendel. Brun. 2016, 64, 2059–2066. [Google Scholar] [CrossRef]
  83. Roszczynska-Kurasinska, M.; Domaradzka, A.; Wnuk, A.; Oleksy, T. Intrinsic Value and Perceived Essentialism of Culture Heritage Sites as Tools for Planning Interventions. Sustainability 2021, 13, 5078. [Google Scholar] [CrossRef]
  84. Bartolo, M.G.; Servidio, R.; Palermiti, A.L.; Nappa, M.R.; Costabile, A. Pro-Environmental Behaviors and Well-Being in Adolescence: The Mediating Role of Place Attachment. Int. J. Environ. Res. Public Health 2023, 20, 5759. [Google Scholar] [CrossRef] [PubMed]
  85. Selman, P. Sustainable Landscape Planning. In The Reconnection Agenda; Routledge: London, UK, 2012; ISBN 9780203119860. [Google Scholar]
Figure 1. Categories of place identity contents.
Sustainability 15 15535 g001
Figure 2. Pictures from the case studies.
Sustainability 15 15535 g002
Figure 3. Means subscales of CPI.
Sustainability 15 15535 g003
Table 1. Means and frequency distribution of the demographic characteristics of the sample—Study 1.
AgePlace of Residence Dimension
N
(%)
Mean (SD)Big City
(%)
Medium City (%)Town or Village (%)
Male156 (37%)39.35 (17.23)18 (11.5)79 (50.6%)59 (37.8%)
Female266 (63%)36.88 (17.00)27 (10.2)145 (54.5%)94 (35.3%)
Total42237.79 (17.08)45 (10.7)224 (53.1%)153 (36.3%)
Table 2. Summary of exploratory factor analysis (n = 392).
Environmental QualityFunctionalityBiodiversityGenealogyHistorical/
Cultural
Social
Networks
HomogeneityPlace Attachment
There is a lot of noise 0.827
It is very polluted 0.798
Living here is very stressful 0.770
There is a lot of traffic0.711
It has good infrastructure 0.798
The transport network has good connections with other locations 0.747
There are gardens and parks 0.745
I feel close to everything here 0.660
There is a diversity of plants and animals here 0.877
We feel close to nature here 0.802
This is a place surrounded by beautiful landscapes 0.764
My origins are in this place 0.863
My family lives here 0.826
Many things here remind me of my past 0.808
It is a place where traditions are kept alive 0.872
There are very characteristic traditions here 0.853
This place has an interesting historical background 0.699
It is hard to make friends here 0.844
People only have formal relationships here 0.715
People are not very sociable here 0.708
People have very similar lifestyles here 0.902
I feel that people here are very similar to each other 0.894
I cannot imagine living in a different place 0.869
Living in this place is very important to me 0.813
Cronbach’s Alpha0.810.730.850.820.800.700.850.75
% Explained variance 11.119.719.699.549.358.067.366.81
% Cumulative variance11.1120.8230.5040.0449.3957.4464.8071.61
Table 3. Means and correlations between the climate response subscales and place identity (Study 1 and Study 2).
Mean (SD)
(Study2)
12345678910
1. CPI—Env. Quality4.94 (1.48)-0.181 *0.285 **0.0710.0060.368 **0.0500.0670.142 **
2. CPI—Functionality4.48 (1.45)0.054-0.105 *−0.0290.246 **0.0820.165 **0.220 **0.201 **
3. CPI—Biodiversity4.48 (1.98)0.377 **0.184 **-0.338 **0.374 **0.214 **0.314 **0.309 **0.375 **
4. CPI—Genealogy4.60 (2.13)0.144 **0.0550.271 **-0.258 **0.125 *0.126 *0.340 **0.452 **
5. SCI-Hist-Cultural4.17 (1.76)0.199 **0.251 **0.394 **0.364 **-0.220 **0.289 **0.265 **0.234 **
6. CPI-Social Networks4.94 (1.62)0.355 **0.001284 **0.241 **0.282 **-−0.0690.115 *0.168 **
7. CPI—Homogeneity4.46 (1.77)0.088 *0.0320.088 *0.155 **0.085 *0.020-0.157 *0.110 *
8. CPI—Attachment4.56 (2.10)0.2150.193 **0.3310.475 **0.408 **0.265 **0.126 **-0.699 **
9. Place Identity5.40
(1.87)
0.277 **0.281 **0.382 **0.454 **0.407 **0.312 **0.0050.716 **-
10. Place satisfaction 18.04 (2.22)0.283 **0.253 **0.263 **0.152 **0.177 **0.167 **−0.0800.385 **0.422 **-
11. Life quality in place 1−6.66 (1.76)0.232 **0.361 **0.323 **0.187 **0.221 **0.192 **0.0010.281 **0.355 **0.393 **
Mean (SD)
(Study1)
2.36 (0.99)4.05 (1.08)4.21 (1.33)4.04 (1.58)3.78 (1.27)2.73 (1.3)3.79 (1.15)3.84 (1.39)4.54 (1.30)
1 Scale of 10 points. Note: Correlations above the diagonal are from Study 1 and those below from Study 2. ** Correlation is significant at the 0.01 level; * correlation is significant at the 0.05 level.
Table 4. Means, standard deviation and results of ANOVA and post hoc test to test age groups.
Age
<2425–4950–64>65
M (SD)M (SD)M (SD)M (SD)Fp
Genealogy4.36 (1.53) a3.80 (1.67) b3.95 (1.36)4.14 (1.48)3.560.014
Social Networks2.45 (0.96) a2.86 (1.01) b3.10 (0.97) b2.57 (1.17) a7.970.000
Place Attachment3.65 (1.34) a3.64 (1.32) a4.34 (1.36) b4.63 (1.39) b9.630.000
Means in the same row with different lowercase letters are significantly different at the p < 0.01.
Table 5. Means, standard deviation and results of ANOVA and post hoc test to test dimensions of the place.
Dimensions of the Place
Big CityMedium CityTown or Village
Mean (SD)Mean (SD)Mean (SD)Fp
Environ. Quality4.30 (0.97)a4.53 (0.93) a4.92 (1.01) b10.680.00
Functionality4.82 (0.87) a4.11 (1.01) b3.74 (1.10) c19.810.00
Biodiversity3.76 (3.37) a3.91 (1.30) a4.80 (1,14) b26.130.00
Genealogy2.64 (1.50) a3.90 (1.56) b4.65 (1.30) c34.890.00
History–Culture3.48 (1.46)3.79 (1.29)3.84 (1.17)1.410.25
Social Networks3.85 (1.09) a4.29 (1.02) b4.63(1.00) b4.460.01
Homogeneity3.60 (1.23)3.70 (1.14)3.96 (1.10)3.300.04
Attachment3.31 (1.32) a3.84 (1.41)3.99 (1.34) b4.270.02
Place Identity 4.05 (1.49) a4.49 (1.26)4.70 (1.22) b4.690.01
Means in the same row with different lowercase letters are significantly different at the p < 0.01.
Table 6. Summary of confirmatory factor analysis, Study 2 (n = 594).
Factor Loadings
Environmental QualityFunctionalityBiodiversityGenealogyHistorical/
Cultural
Social
Networks
HomogeneityPlace Attachment
There is a lot of noise 0.78
It is very polluted 0.81
Living here is very stressful 0.69
There is a lot of traffic0.49
Infrastructure is good 0.80
Transport connections with other localities are good 0.53
There are gardens and parks 0.48
I feel close to everything 0.72
There is diversity of plants and animals 0.81
We feel close to nature 0.90
There are beautiful landscapes 0.77
My origins are here 0.92
My family lives here 0.59
Many things here remind me of my past 0.75
Traditions are kept alive here 0.91
The place has many characteristic traditions 0.88
The historical background is interesting 0.56
It is hard to make friends here 0.73
People only have formal relationships here 0.73
People are not very sociable here 0.69
People here have very similar lifestyles 0.65
People are very much alike here 0.98
I cannot imagine living in a different place 0.69
Living here is very important to me 0.87
Cronbach’s Alpha0.7790.6730.8660.7900.8090.7600.7740.744
Table 7. Means and frequency distribution of the demographic characteristics of the sample- Study 3.
NFemaleAge
Mean (SD)
Agualva11160 (54%)47. 0
Anunciada12063 (53%)51.9
Poceirão11462 (54%)49.1
Table 8. Means and ANOVA results.
Agualva
Mean
Poceirão
Mean
Anunciada
Mean
FSig.
Environmental Quality3.49 a5.45 b5.16 b66.0730.000
Functional4.83 b3.34 a4.82 b44.2190.000
Biodiversity2.50 a5.16 b5.38 b103.2480.000
Genealogy3.53 a5.17 b4.98 b22.3420.000
History–Culture2.79 a4.08 b5.11 c54.7440.000
Social Networks4.08 a5.59 b5.12 b27.3470.000
Perceived Homogeneity4.224.664.592.0030.136
Attachment3.70 a4.99 b4.93 b13.6930.000
Place Identity4.72 a5.54 b5.97 b14.0350.000
Place Satisfaction *7.24 a8.07 b8.61 b11.8570.000
Place Quality of Life *6.28 a6.507.05 b5.8320.000
Means in the same row with different lower case letters differ at p < 0.05 according to Bonferroni. * Scale of 10 points.
Disclaimer/Publisher’s Note: The statements, opinions and data contained in all publications are solely those of the individual author(s) and contributor(s) and not of MDPI and/or the editor(s). MDPI and/or the editor(s) disclaim responsibility for any injury to people or property resulting from any ideas, methods, instructions or products referred to in the content.

