Article

A Preliminary Evaluation of the Effectiveness of Ecological Product Value Realization in China Based on the DPSIR Model

1
Research Institute of Forestry Policy and Information, Chinese Academy of Forestry, Beijing 100091, China
2
Chinese Academy of Forestry, Beijing 100091, China
*
Author to whom correspondence should be addressed.
Sustainability 2023, 15(21), 15572; https://doi.org/10.3390/su152115572
Submission received: 14 September 2023 / Revised: 19 October 2023 / Accepted: 30 October 2023 / Published: 2 November 2023

Abstract

:
Ecological Product Value Realization (EPVR) is regarded as an effective tool for ecological civilization construction in China and has received widespread attention. Based on the Driver-Pressure-State-Impact-Response (DPSIR) model, this study constructs a multi-layered evaluation index system for the effectiveness of EPVR in China from a systemic perspective and determines the weights of the indicators through the entropy weight method. On this basis, an empirical analysis of the EPVR effectiveness in China from 2011 to 2021 is conducted using the TOPSIS method, the coupling coordination degree model, and the obstacle diagnosis model. The results show that the whole effectiveness of EPVR in China has been significantly improved during the study period, with the composite evaluation index increasing from 0.1481 to 0.7680, which can be categorized into a slow exploration period (2011 to 2016) and a rapid development period (2017 to 2021). The development effectiveness and the state of coupling coordination varies between subsystems, and the main obstacle factors are not fixed. The above results verify the scientific nature and applicability of the index system, which can provide a new assessment method to promote the efficient utilization of resources and sustainability. This study also makes recommendations in terms of ecological product supply, natural resource utilization, eco-industry, and coordinated development.

1. Introduction

As the global problems of resource scarcity, environmental pollution, and ecological damage become increasingly serious, mankind is compelled to seek a more effective and rational path to realize sustainable development [1]. In this context, the United Nations put forward 17 Sustainable Development Goals (SDGs) for the 2030 Agenda for Sustainable Development, reflecting the determination of the world’s countries to solve these problems [2]. As of October 2023, 191 countries have submitted voluntary national reviews to the annual meeting of the High-Level Political Forum on Sustainable Development, although they are not mandatory [3]. There are variations in the implementation of the SDGs in countries at different levels of development. OECD countries are concerned about global natural environment problems in general and are launching appropriate programs of action. BRICS countries are actively involved in international and regional cooperation, and government plans are dominant in advancing sustainable development. Due to limited financial and facility status, the least developed countries tend to prioritize the goal of meeting the basic needs of their people [4]. As one of the BRICS countries, China has taken the construction of ecological civilization as a concrete practice and a primary task of sustainable development and elevated its status to a strategic level of national development [5]. Under the guidance of the concept that “lucid waters and lush mountains are invaluable assets”, ecological restoration and ecological governance have been continuously promoted and achieved great results [6,7]. According to the Report on the State of the Ecology and Environment in China 2022 [8], the percentage of days of urban air quality meeting the standard was 86.5%, the percentage of centralized drinking water sources meeting the standard was 95.9%, the percentage of water quality of nearshore sea areas meeting the standard was 81.9%, forest coverage was 24.02%, and the area of the red lines for ecological conservation accounted for about 30% or more of the national territory.
As China’s ecological advantages become more and more obvious, the desire to transform ecological factors into production factors becomes increasingly strong. Hence, a new concept has been proposed in China: Ecological Products (EPs), which are understood as the result of the intertwining of ecosystems, economic systems, and social systems and have great value in their use [9]. Ecological Product Value Realization (EPVR) is not only regarded as an effective tool for the construction of ecological civilization but is also considered an important way to promote economic structural adjustment and social green transformation under the new normal [10]. Exploring EPVR is a process of continuous improvement and gradual progress. The Chinese government has issued a series of policy documents to clarify related matters and promoted the practice by establishing pilots, as detailed in Wang et al. [11].
The research on EPVR is a widely discussed topic and can yield new insights in interdisciplinary studies such as economics, management, and environmental sciences [11,12]. There is some progress in the basic research on the connotations, categorizations, and attributes of EPs, as well as on the pathways and models for EPVR, as follows: (1) In a narrow sense, EPs are often regarded as natural elements that maintain ecological security and enhance people’s well-being. In a broad sense, they are more focused on the impact of human activities on ecosystem production and can be understood as an extension of the concept of Ecosystem Services [11,13]. (2) Based on competitiveness and exclusivity, EPs can be divided into public ecological products, private ecological products, and quasi-public ecological products. However, they can still be categorized from different theoretical perspectives due to their multiple attributes of “ecology”, “economy”, and “society” [12,14]. (3) The value of EPs is often implicit, and the essence of EPVR is to make these implicit values explicit through appropriate ways [15]. Therefore, many scholars are concerned about the models and paths of EPVR. Zhang et al. [16] summarized eight major categories and twenty-two sub-categories of models from many practice cases, as well as three types of paths: the government path, the market path, and the hybrid path, which provide important references for promoting EPVR. Some scholars have argued that EPs, like general products, needed to realize their value through market exchanges. For example, in some regions, natural resources were being assetized and capitalized through platforms such as “forest banks” and “wetland banks” to continuously improve the benefits of EPs [17,18]. Further, some studies have found that eco-industrialization and industrial ecologization were endogenous and exogenous driving forces of EPVR, respectively, and were particularly applicable in eco-fragile areas, such as karst regions [12,19].
Wang et al. [20] argued that EPVR could be simply characterized by indicators such as the Green Gold Index. However, to better reflect the EPVR status, it was still necessary to build a suitable evaluation index system, which was the focus of the current research. The Chinese government has released evaluation index systems for ecological civilization construction, beautiful China construction, green development, and the “Two Mountains” index, which provide many references for research in this field [21,22,23]. Some scholars have tried to construct the EPVR effectiveness evaluation index system from different perspectives, including the logical perspectives of “ecological product supply—policy intervention—people’s well-being improvement” [24] and “ecological product protection—value transformation—guarantee mechanism” [25], the factor perspective of “input capacity—operational capacity—organizational capacity” [26], the modeling perspective of the Inclusive Wealth Index [27], and the transformational efficiency perspective based on the Gross Ecosystem Product [28]. In general, these studies could provide useful references for this study, but there were still some problems that needed improvement. First, the research scale focused on the river basin [24,27], province [26], and city [28], but lacked research at the national level. Second, most of the studies only analyzed the EPVR effectiveness at a certain point in time, such as for 2019 [25] and 2020 [26], and ignored the dynamic trend of interannual changes. Third, there was a lack of a systematic and mature research framework, and the intrinsic relationship between different indicators was neglected, which made it difficult to accurately understand the essence and process of EPVR. It was necessary to construct a more systematic, comprehensive, practical, and dynamic evaluation index system for the effectiveness of EPVR.
The Driver-Pressure-State-Impact-Response (DPSIR) model provides a framework to help understand complex social and economic phenomena and can elucidate the structure and connections of problems [29]. It will offer great prospects for a comprehensive evaluation of EPVR. However, there are no studies that directly apply the DPSIR model to the field of EPVR.
In summary, this study aims to make up for the shortcomings of the above studies and tries to construct an evaluation index system for the effectiveness of EPVR in China based on the DPSIR model and answers the following questions through empirical analysis: (1) Is the index system reasonable and can it be applied? (2) What is the law of temporal dynamic change of the effectiveness of EPVR in China? (3) What are the differences in effectiveness and the degree of coordination between the different subsystems? (4) What are the main obstacles to promoting the EPVR in China? Secondly, based on the results of the study, corresponding recommendations are made for the reference of governmental departments.

2. Process of Constructing the Evaluation Index System

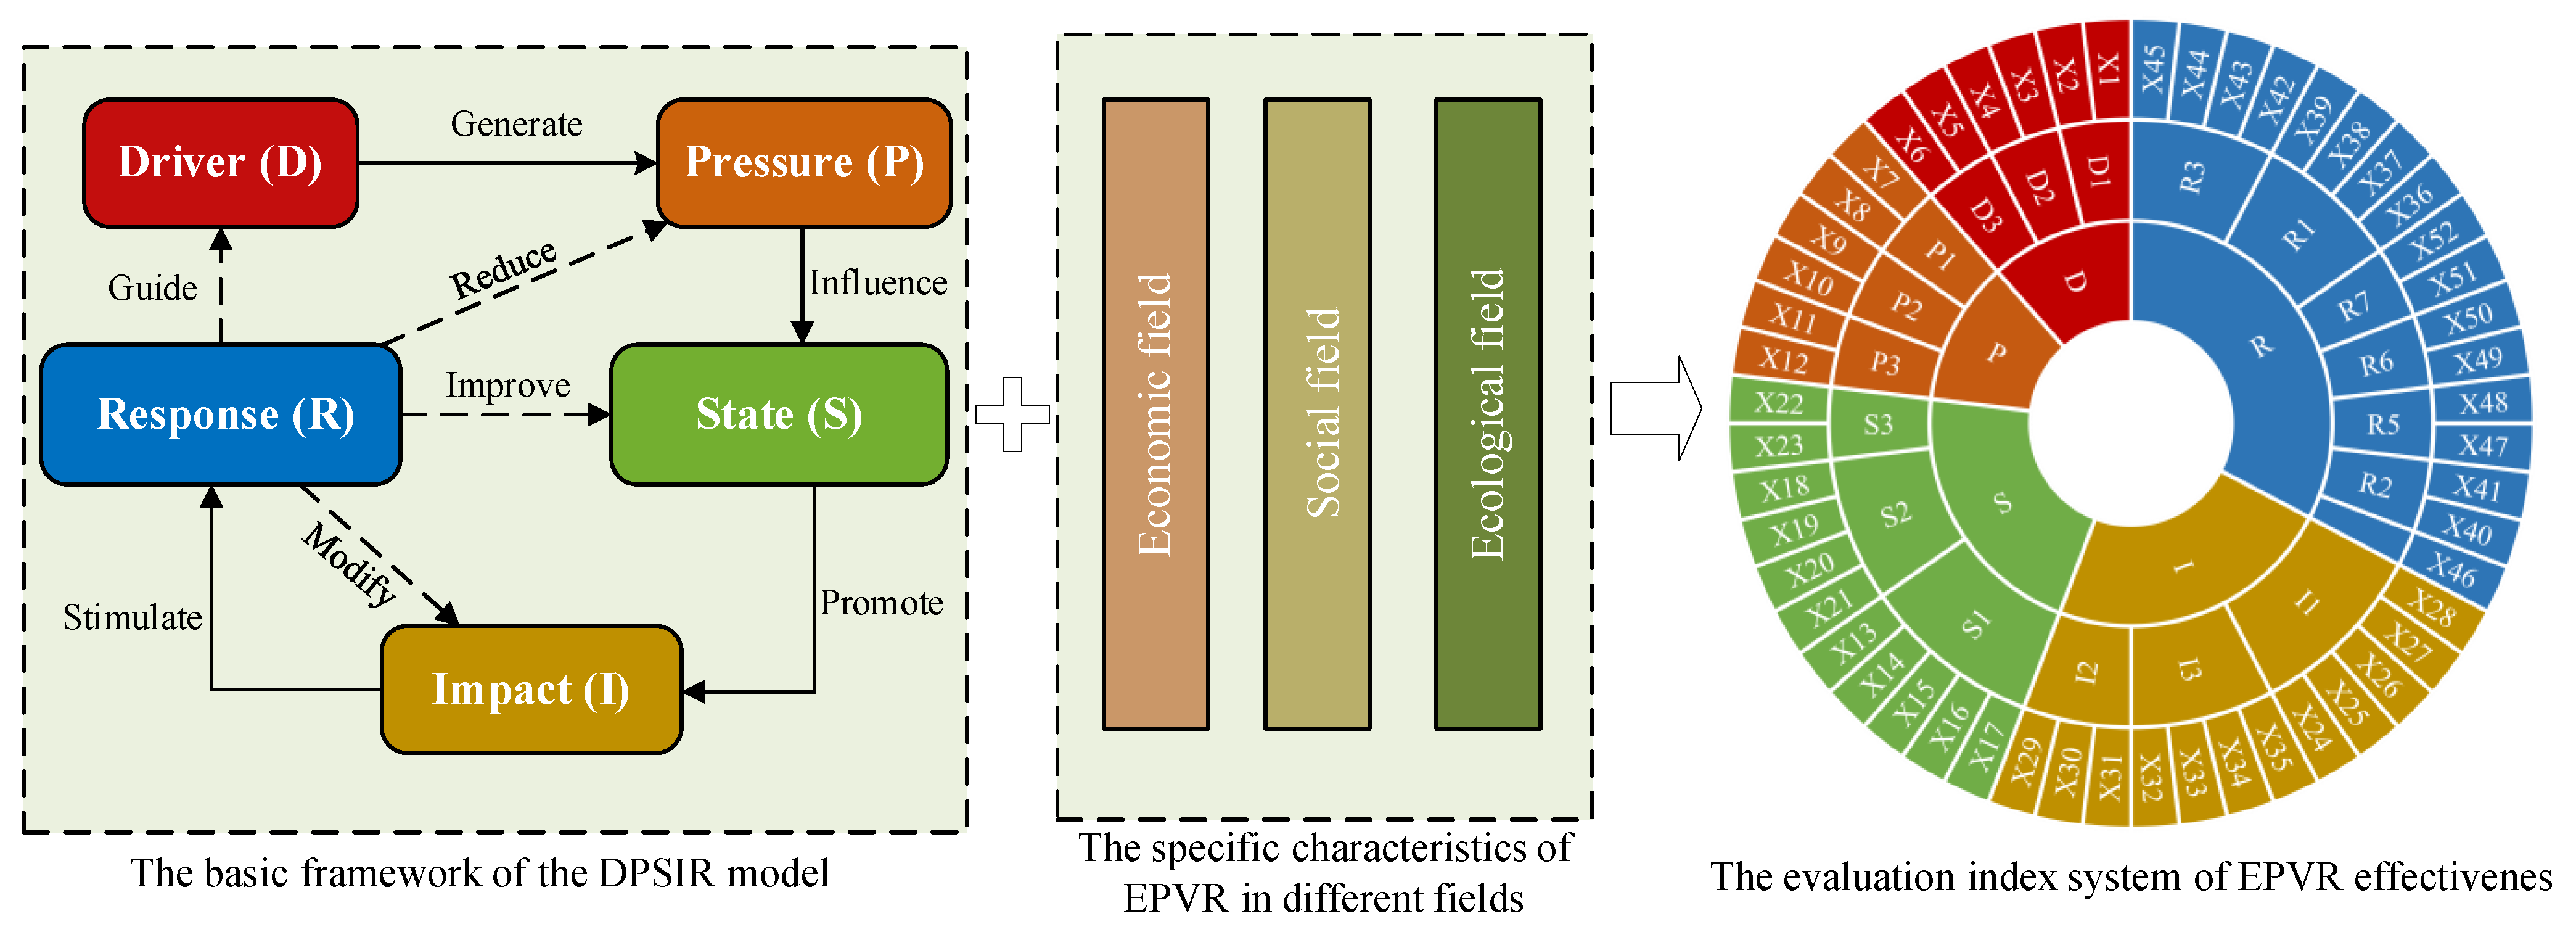
2.1. Adaptability of the DPSIR Model to EPVR

2.1.1. Important Connotations of EPVR

Xu et al. [30] argued that EPVR in China was a localized practice of Nature-based Solutions and that the two are highly compatible in terms of philosophies and models. This study argued that the essence of EPVR was the process of transforming natural resource elements containing ecological advantages into ecological products through appropriate means and measures, leading to the continuous manifestation of their economic, ecological, and social benefits. It was formed in a specific context and had a positive impact on the production—living—ecological spaces. The aim was to strengthen ecosystem functions and promote harmony between humans and nature.

2.1.2. Positive Effects of Introducing the DPSIR Model

As an effective tool for constructing the evaluation index system, the DPSIR model was widely used in many study areas [29,31]. We proposed to introduce it into the EPVR effectiveness evaluation to provide additional insights. On the one hand, it could explain the process of human interaction with the natural environment [32], which provided the possibility of revealing the potential causes and expressing the intrinsic mechanism of EPVR. On the other hand, with the introduction of it, the evaluation index system for EPVR effectiveness could be made more comprehensive, systematic, logical, and operable. First, it could cover multiple aspects of the evaluation unit, which facilitates a comprehensive analysis. Second, it could clarify the causal relationships between different factors and specifically refine the effectiveness of EPVR into five subsystems: Driver, Pressure, States, Impact, and Response. Third, it embodied a complete chain of thinking for the effectiveness of EPVR: why, what, and how. Fourth, as a mature framework, there were a certain number of cases for reference, and it was highly operational.

2.2. Design Logic and Principles of the Index System

To combine the DPSIR model with the evaluation of EPVR effectiveness, it was not only necessary to use the model as the logical framework of the index system but also to take into full consideration the important connotations, main features, and critical factors of EPVR. In the selection of indicators, the differences and connections between indicators of different dimensions should be fully considered to reduce redundancy.
Based on learning from the international experience of constructing the evaluation index system [33,34], this study determines the following principles: (1) Scientific nature. Ensure that each evaluation index can truly and effectively reflect the EPVR’s development status. (2) Systematicity. Ensure that the layers of the index system are diversified and the subsystems are correlated. (3) Data availability. The indicators can be obtained from public statistical yearbooks, statistical bulletins, or corresponding databases and have good continuous statistical characteristics. (4) Farsightedness. The indicators can be applicable over a long period and be able to indicate the direction of EPVR development.

2.3. Selection of Indicators

Based on summarizing the common indicators used in existing studies [24,25,26,27,28] and combining the relevant evaluation indicators issued by the Chinese government [21,22,23], the basic indicators for this study were obtained. Further, according to the design logic and principles, representative indicators affecting EPVR were selected from resource status, economic development, human activities, and social changes to improve the whole index system. The logic of the evaluation index system constructed in this study is shown in Figure 1, and the description of the indicators is shown in Table 1. Indicator attributes were categorized as positive, negative, and moderate. Positive indicators would promote the effectiveness of EPVR, negative indicators would inhibit the effectiveness of EPVR, and moderate indicators fall somewhere in between. Specifically, the selection of indicators for the subsystems was considered as follows.
The Driver subsystem represented the potential causes that affect the changes of EPVR, which could be considered in three dimensions: economic development (D1), population growth (D2), and social structure (D3). Accordingly, X1~X6 were selected as the driving factor indicators. These indicators were the deep-seated causes and macro-drivers of EPVR development.
The Pressure subsystem was the direct cause of changes in EPVR under the long-term influence of the Driver subsystem, which was mainly reflected in the impacts of human activities on resources, the environment, and ecology. Specifically, it was set as three aspects of resource depletion (P1), environmental pollution (P2), and ecological damage (P3) in this study, and X7~X12 were selected as indicators of pressure factors.
Under the direct action of the Pressure subsystem, resources, environment, and ecology would exhibit certain statuses and changes and would be gathered in the State subsystem. It was the basic condition and main carrier for the formation of EPs. The indicators were selected from resource reserves (S1), environmental conditions (S2), and ecological security (S3), and X13~X23 were taken as the indicators of the State subsystem. These indicators characterized the state of multiple ecological elements and could reflect the strength of regional ecological advantages.
Existing state conditions would have certain impacts on economic and human social systems, which could be seen as a result of the EPVR development process. In this study, the Impact subsystem was categorized into three aspects: industrial ecologicalization (I1), ecological industrialization (I2), and social life (I3), and X24~X35 were used as the measurement indicators. I1 and I2 reflected the significant impacts on the economic field brought about by EPVR, which could contribute to the development of the ecological economy. I3 reflected the positive impacts released by EPVR on the social field.
The Response subsystem focused on human efforts to adjust the EPVR system. It consisted of measures that contributed to the development of EPVR. Based on the analysis of the EPVR practice process, the indicators were selected from ecological governance (R1), fiscal support (R2), green finance (R3), ecological property rights trading (R4), research and education (R5), infrastructure development (R6), and environmental regulation (R7), and X36~X52 were used as the measurement indicators of this subsystem. The Response subsystem could act on the other subsystems to varying degrees by reducing “pressure”, improving “state”, promoting positive “impact”, and guiding the “driver”.
Finally, the evaluation index system of the effectiveness of EPVR in China was constructed with five subsystems as the standard layer (first-level indicators), nineteen aspects as the factor layer (second-level indicators), and fifty-two specific indicators as the indicator layer (third-level indicators). The indicators were all placed in this cyclically ordered system, which could illuminate the causal chains and dynamic evolutionary paths of EPVR.

3. Empirical Study

3.1. Study Area and Data Sources

To verify that the constructed index system was rational and applied, this study conducted an empirical analysis and limited the study scale to the national level. Due to data availability, the results of the EPVR effectiveness evaluation in this study reflected the overall level of the Chinese mainland (31 provinces).
On the one hand, the earliest official document in which the term “Ecological Products” appeared was the National Main Functional Areas Plan in December 2010. Since then, the corresponding practical work has been gradually rolled out, and the development direction of EPVR has become increasingly clear. On the other hand, the national annual data statistics have a certain lag. Currently, many data are only updated up to 2021. For example, the latest China Statistical Yearbook 2022 could only reflect the situation in 2021. To ensure the completeness and authenticity of the data, 2011–2021 was finally used as the study period.
The indicator data for the study came from the following three aspects: (1) Yearbook data, mainly including the China Statistical Yearbook, China Rural Statistical Yearbook, China Forestry Statistical Yearbook, China Environmental Statistical Yearbook, China Energy Statistical Yearbook, China Financial Statistical Yearbook, etc.; (2) Bulletin data, mainly including the National Economic and Social Development Statistical Bulletin, China Water Resources Bulletin, Bulletin on the Ecology and Environment Status in China, Bulletin on the State of Land Greening in China, China Soil Conservation Bulletin, China Marine Economy Bulletin, etc.; (3) Annual report data, including the China Environmental Statistics Annual Report, China Green Food Statistics Annual Report, China Organic Food Statistics Annual Report, etc. Based on the study period, the corresponding year data were selected. For the very few missing data (six in total), referring to Tan et al. [35], the linear interpolation method was applied to supplement the data, which ultimately constituted the complete panel data.

3.2. Research Methods

3.2.1. Entropy Weight Method

After constructing the evaluation index system, it was necessary to assign a certain weight to each index to characterize the importance of the index in the system. This part was crucial, because it would directly affect the objectivity and accuracy of the evaluation results [36]. At present, there are many methods to determine the weights of indicators, such as the subjective evaluation method represented by the Delphi method and the Analytic Hierarchy Process (AHP), and the objective evaluation method represented by the entropy weight method (EWM), the correlation coefficient method, and the fuzzy comprehensive evaluation (FCE). There are advantages and disadvantages to the different methods, and details can be found in the summary of Shi et al. [37].
On the one hand, this study introduced the DPSIR model into EPVR effectiveness evaluation, which was an innovative exploration. We only knew that there were differences between the indicators, but we could not obtain the weight reference values directly from the published literature. On the other hand, EPVR was a complex systematic project. There was a large uncertainty in determining the indicator weights through the subjective method, and it would affect the evaluation results. Ultimately, the EWM was chosen as the method to determine the indicator weights to improve credibility. In general, the greater the discrete degree of the indicator data, the smaller its information entropy, the greater the amount of information it contains, and the greater the weight that should be assigned [38]. The specific steps of EWM are as follows.
  • Step 1: Normalization of raw data
Raw data is usually represented as a distribution of n indicators over m time series. Since the units and attributes of different indicators may not be consistent, they are not directly comparable with each other and need to be normalized. For positive and negative indicators, Equations (1) and (2) are used for processing, respectively. For moderate indicators, data smaller than the mean of the indicator are processed by Equation (1), and data greater than or equal to the mean are processed by Equation (2). The specific equations are as follows.
x i j = x i j min ( x i ) max ( x i ) min ( x i )
x i j = max ( x i ) x i j max ( x i ) min ( x i )
where xij denotes the value of the j indicator in the i-th year, i = 1, 2, 3, …, m; j = 1, 2, 3, …, n. xij denotes the normalized value of xij.
To meet the requirement of subsequently performing logarithmic calculations (the antilogarithm is not zero), it is necessary to coordinate the xij translation
O i j = x i j + β
where Oij is the new normalized data and β is the translation distance, which here takes the value 0.000001.
  • Step 2: Calculate the information entropy ej of the j-th indicator
e j = 1 ln m i = 1 m P i j ln P i j
where P i j = O i j i = 1 m O i j , assume that l i m O i j 0 , ln P i j = 0 .
  • Step 3: Calculate the weight ωj of the j-th indicator
ω j = 1 e j j = 1 n 1 e j
Finally, the factor layer weight Gj and the standard layer weight Wj are obtained by accumulating the corresponding indicator weights.

3.2.2. TOPSIS Method

The TOPSIS method, the full name being the Technology for Order Preference by Similarity to an Ideal Solution method, cleverly analyzes the degree of strengths and weaknesses of the assessment object through the principle of distance and has been well applied in some comprehensive evaluation models [39,40]. In effect, it determines the developmental level of the subject by assessing the combined distance (expressed as relative closeness) between the subject with the positive and negative ideal solutions. If the relative closeness is closer to 1, the better the subject performs; conversely, the closer it is to 0, the worse the subject performs. The steps are as follows.
  • Step 1: Construct the weighting normalization matrix Zij
ω j = 1 e j j = 1 n 1 e j
  • Step 2: Determine the ideal solutions Zj* (including positive ideal solution Zj*+ and negative ideal solution Zj*−)
Z j * = Z j * + = Max Z 1 j ,   Z 2 j ,   Z 3 j ,   ,   Z i j Z j * = Min Z 1 j ,     Z 2 j ,   Z 3 j ,   ,   Z i j
  • Step 3: Calculate the Euclidean distance Di+ between the evaluated object and the positive ideal solution and the Euclidean distance Di between the evaluated object and the negative ideal solution, respectively
D i + = j = 1 n ( Z i j Z j * + ) 2
D i = j = 1 n ( Z i j Z j * ) 2
  • Step 4: Calculate the relative closeness of the evaluation object for each year Ci
M i = D i D i + + D i   ( 0 M i 1 )
where the larger the Mi is, the closer the EPVR effectiveness is to the ideal level. Therefore, Mi can be used as a composite evaluation index for the effectiveness of EPVR in China, reflecting its dynamic trend in the time series.

3.2.3. Weighted Sum Method

In order, the evaluation scores Tij of different subsystems are calculated by the weighted sum method with the following equation [41].
T i j = T i D = j = 1 D ( O i j × ω j W 1 ) T i P = j = D + 1 P ( O i j × ω j W 2 ) T i S = j = P + 1 S ( O i j × ω j W 3 ) T i I = j = S + 1 I ( O i j × ω j W 4 ) T i R = j = I + 1 R ( O i j × ω j W 5 )
where D, P, S, I, and R are the last indicators in the Driver, Pressure, State, Impact, and Response subsystems, respectively, and TiD, TiP, TiS, TiI, and TiR are the evaluation score values for the corresponding subsystems.
Correspondingly, the relative contribution of the subsystem Uij is the ratio of the subsystem’s evaluation score to the sum of all subsystems’ evaluation scores, with the following equation:
U i j = T i j T i D + T i P + T i S + T i I + T i R × 100 %

3.2.4. Coupling Coordination Degree Model

Overall, EPVR is a complex system formed by the coupling of multiple subsystems. To quantitatively evaluate the degree of interaction between these subsystems and reveal the characteristics of the subsystem coordination status, the coupled coordination degree model is introduced to enhance the understanding of the EPVR process and the horizontal comparison of the subsystems [42]. The specific steps are as follows.
  • Step 1: Calculate the coupling degree Ci between the different subsystems in the i-th year
C i = k = 1 k T i j / k = 1 k T i j k k 1 k ,     2 k 5 ,   k N +
where k is the number of subsystems involved in calculating the coupling degree; the larger the value of Ci, the stronger the interaction between the different subsystems.
  • Step 2: Calculate the comprehensive coordination index Hi between the subsystems in the i-th year
H i = k = 1 k T i j × W j
where k is the number of subsystems involved in calculating the comprehensive coordination index; the larger the value of Hi, the better the coordination between the different subsystems.
  • Step 3: Calculate the coupling coordination degree Pi between the subsystems in the i-th year
P i = C i × H i
The larger the value of Pi, the stronger the connection between the subsystems of that year and the higher the degree of coordinated and orderly development. Referring to Zameer et al. [43], the coupling coordination degree is categorized into 10 levels, as shown in Table 2.

3.2.5. Obstacle Diagnosis Model

To further explore the main obstacle factors affecting the development of EPVR in China, this study introduced the obstacle diagnosis model for analysis [44,45]. The model can calculate the obstacle degree Qij of each indicator. At the same time, by summing up the Qij corresponding to the subsystems, the obstacle degree Vij of different subsystems to the whole EPVR system can be obtained, and the specific equations are as follows.
Q i j = 1 x i j × ω j j = 1 n 1 x i j × ω j × 100 %
V i j = Q i j
All of the above calculations were completed using Microsoft Excel software (version 2021), and the related graphs were produced using Microsoft Excel software and Microsoft Visio software (version 2021).

4. Results

4.1. Indicator Weights

The weights of different layers of evaluation indicators for the effectiveness of EPVR in China could be obtained by Equations (1)–(5), as shown in Table 3. In the whole evaluation index system, the State subsystem (WS = 0.2788) and the Response subsystem (WR = 0.2712) had a large weight, and the two together totaled 0.5500. It indicated that these two subsystems were the key points in the evaluation of the effectiveness of ERVR, which were concentrated in the aspects of resource reserves (S1), environmental conditions (S2), ecological governance (R1), green finance (R3), and environmental regulation (R7). Second, the Impact subsystem (WI = 0.1985) and the Pressure subsystem (WP = 0.1535) also played a role in the operation of the whole system, which were concentrated in the aspects of industrial ecologicalization (I1), ecological industrialization (I2), and ecological damage (P3). Finally, the Driver subsystem had the smallest weight (WD = 0.0980), mainly because these potential factors affecting EPVR were long-term, gradual, and induced and did not change much in the short term.

4.2. Comprehensive Effectiveness of EPVR in China

The effectiveness scores of EPVR in China from 2011 to 2021 could be obtained through Equations (6)–(10), and the results are shown in Table 4. It was found that China had made some achievements in strengthening the overall EPVR capacity.
From 2011 to 2020, the overall effectiveness level of EPVR in China showed an increasing trend year by year, with Di+ decreasing from 0.1583 to 0.0405, Di increasing from 0.0275 to 0.1450, and the composite evaluation index Mi increasing from 0.1481 to 0.7815 (top-ranked).
The development of EPVR in China during the study period could be categorized into two stages, namely the period of slow exploration (2011~2016) and the period of rapid development (2017~2021). Within the slow exploration period, the average annual increase of Mi was small, about 0.0284. It was mainly because the understanding of EPs was still not extensive enough in that period [11,12], the paths and patterns of advancing EPVR were being explored, and the direction of the development of the related industries was not clear yet. Since 2017, the EPVR process in China has significantly accelerated. Within the rapid development period, the average annual increase of Mi was large, about 0.0946. It was mainly because the strategic position of EPVR has been continuously clarified and strengthened in government documents, and corresponding practice pilots have been carried out, which accumulated invaluable experience for exploring paths and patterns of EPVR [17,46]. Meanwhile, under strong environmental regulation, the ecological situation continued to improve, which also created greatly favorable conditions for EPVR. In particular, the Mi increased by 0.2036 from 2017 to 2018. The direct cause of this phenomenon was closely related to the policies of the period. For example, in 2017, China carried out several environmental protection actions, and the central environmental protection inspectors achieved full coverage of 31 provinces [47]; from January 2018, China began to trial the Compensation System for Ecological and Environmental Damages [48]. It took time for the elements to accumulate in the process of formation and combination, and the later development effectiveness might partly come from the “contribution” of the earlier practice.
Although the comprehensive effectiveness fell back in 2021 (Mi = 0.7680), the decline was smaller (the rank remains second). This was mainly due to China’s effective COVID-19 control strategy, the stability of economic and social development was ensured [49], and the development of EPVR did not suffer a severe blow. However, it could be seen that it did not fully offset the huge impact of COVID-19, especially the negative impact on related industries [50]. As a result, EPVR development in China has slowed down.

4.3. Development Effectiveness of Different Subsystems

The evaluation scores of different subsystems and their relative contribution to the whole system were calculated by Equations (11) and (12). The change trend of each subsystem is shown in Figure 2. Except for the Driver subsystem, the change trend of the other subsystems was basically the same as that of the overall EPVR development level, which was shown to be increasing year by year. Through further analysis, it was found that the relative contribution of different subsystems to the overall EPVR system would have large differences over time, with certain volatility characteristics (Figure 3). For the operating condition characteristics of different subsystems, they were specifically described as follows.

4.3.1. Driver Subsystem

The Driver subsystem reflected the influence of macro factors, such as economic, population, and social, on EPVR. As can be seen from Figure 2, 2018 was a turning point in the development trend of the subsystem. Its evaluation score increased from 0.0364 in 2011 to 0.5257 in 2018 and then began to decline, decreasing to 0.3318 in 2021. This directly reflected the changes in the New Normal of China’s economy, which has shifted from high-speed growth to high-quality development [51]. The relative contribution of the Driver subsystem increased from 9.57% in 2011 to 27.20% in 2015 and then began to decrease and fell back to 8.94% in 2021, with the overall trend showing an inverted “U” shape (Figure 3). It mostly showed that with the obvious improvement of the ecological environment, the dependence of China’s EPVR on macro-conditions such as socio-economic conditions has weakened, and endogenous ecological advantages have gradually come into play [52].

4.3.2. Pressure Subsystem

The Pressure subsystem evaluation score consistently increased from 0.0038 in 2011 to 0.9974 in 2021 (Figure 2). In particular, the rise increased further after 2017, which was consistent with the overall effectiveness trend described above, suggesting that the subsystem acted in a more direct way on the whole system. Its relative contribution generally showed an increasing trend year by year, from 0.99% in 2011 to 26.87% in 2021 (Figure 3). It indicated that whether the pressure factor can be continuously improved was related to the size of the subsequent ability to release the ecological dividend, and influences the overall EPVR effectiveness to improve. The effect would be increasingly more obvious with the passage of time [53].

4.3.3. State Subsystem

The State subsystem evaluation score increased from 0.0702 in 2011 to 0.8902 in 2021, but there was a partial fallback during this period (Figure 2). Like the Pressure subsystem change, it also saw a further increase in its evaluation score value after 2017, reflecting the results of EPVR under various pressures. Its relative contribution fluctuated somewhat between years, but was generally stable, averaging 20% (Figure 3). It showed that the current state of the combination of elements in terms of resources, environment, and ecology constitutes the ecological background, which was the basic condition of EPVR [54]. Its role was continuously inputted and would not drastically change.

4.3.4. Impact Subsystem

The Impact subsystem evaluation score increased from 0.1493 in 2011 to 0.7477 in 2021 (Figure 2). Among them, the faster-rising interval was in 2019~2020, where the score leaped from 0.5685 to 0.7281. In the remaining years, the growth rate of its development was relatively stable. This reflected that the ecological benefits released by the EPVR were continuously and extensively affecting the development of ecological industries and social life changes and the Impact subsystem concentrated on the economic and social benefits of the EPVR. Its relative contribution was larger from 2011 to 2017, especially in 2011, when it reached 39.26%. From 2018 to 2021, its relative contribution declined, but the average level was still maintained at around 18% (Figure 3). This indicated that the Impact subsystem was an important component and endogenous driver of the whole system.

4.3.5. Response Subsystem

The Response subsystem evaluation score increased from 0.1207 in 2011 to 0.7720 in 2020 and fell back to 0.7453 in 2021 (Figure 2), which was consistent with the trend in the overall development effectiveness of EPVR. This indicated that the effectiveness of the overall system was largely driven by the Response subsystem and that there was a clear positive correlation between the two. Except for 2011, its relative contribution fluctuated in the range of 20% to 25% in the remaining years (Figure 3), which indicated that EPVR was not spontaneously completed and its development depended on a variety of purposeful and targeted human measures [11,30,52]. These measures could be abstracted into a variety of management elements which directly reflected the importance of “human labor” for EPVR and efforts to improve the conditions for the development of other subsystems.

4.4. Status of the Coupling Coordination between Subsystems

The degree of coupling coordination between different subsystems and the corresponding coordination level from 2011 to 2021 were obtained by Equations (13)–(15), and the results are shown in Table 5. It can be seen that the level of coordination between the different subsystems increased over time, which indicated that the different subsystems were becoming more closely linked to each other. The coordination between them was steadily developing, gradually shifting from dysfunction to coordination and from disorder to order.
To further analyze and visualize the trend of coupling coordination between different subsystems, Table 5 was transformed into Figure 4. It can be seen that the coupling coordination of the whole system (D-P-S-I-R) was usually higher than that between two subsystems. It confirmed that EPVR was a complex system project, and its coordinated development needed to rely on different subsystems within it. As the coordination between the subsystems improved, it would create a greater synergy effect on the whole system.
The coupling coordination of the D-P subsystem was like that of the R-P subsystem, with both coordination statuses increasing from Level 1 (extreme disorders) to Level 5 (endangered disorders) from 2011 to 2021. Although the status was improved, it was still at a lower level, indicating that there was more room for improvement. The coupling coordination degree of the P-S subsystem increased from 0.0940 (extreme disorders) in 2011 to 0.6329 (primary coordination) in 2021, reflecting the fact that more ecological space and ecological elements could be released after the “pressure” was reduced, and that a more coherent ecological consensus between the two subsystems was gradually being formed. The coupling coordination of the S-I and I-R subsystems both reached rank 3 (moderate disorders) in 2011, which was consistent with that of the whole system (D-P-S-I-R) and higher than that of the other subsystems, indicating that the three subsystems of State, Impact, and Response had a greater contribution to promoting the coordination of the whole system at this time. The coupling coordination degree of the R-D subsystem increased from 0.1125 (serious disorders) in 2011 to 0.2507 (moderate disorders) in 2021, with a relatively small change. Although it reached Level 4 (mild disorders) in 2017–2019, it was still at a low level, indicating that the measures related to the Response subsystem were not yet directly effective in guiding the development of the Driver subsystem. The coupling coordination degree of the R-S subsystem increased from 0.1682 (serious disorders) in 2011 to 0.5548 (reluctant coordination) in 2021, reflecting the fact that the relevant measures in the Response subsystem were playing an increasingly important role in improving the resource, environmental, and ecological conditions.

4.5. Diagnosis of Major Obstacles to EPVR in China

4.5.1. The Main Obstacle Factors at the Indicator Layer

The obstacle degree of different indicators from 2011 to 2021 could be calculated by Equation (16). Ranked according to their size, the top 10 indicators were selected as the main obstacle factors of EPVR in China (Table 6).
As shown in Table 6, the main obstacle factors were not fixed in different years, and the total obstacle degree increased from 44.9% in 2011 to 70.67% in 2021. It indicated that the development of China’s EPVR was gradually entering a “deep-water zone”, and was constantly facing new challenges, with some factors not yet fully optimized. It is worth noting that the ratio of soil erosion area to total land area (X11), the ratio of desertified and sandified areas to total land area (X12), the ratio of wetland area to total land area (X16), the ratio of high-grade cropland area to total cropland area (X21), the ratio of the protected natural area to total land area (X22), the ratio of eco-tourism’s business revenue to the gross output value of tertiary industry (X31), the total number of local environmental regulations enacted during the year (X51), and the number of key emission units implemented with automatic monitoring (X52) were the common obstacle factors from 2010 to 2016. It reflected that, in that period, as the practical activities of environmental protection and ecological restoration were vigorously promoted, the ecological background gradually improved, but it was still relatively fragile, and the environmental advantages were not very prominent, which was not enough to release a substantial ecological dividend to drive the development of eco-industry [12,33,54]. At the same time, the external environmental regulation also needed to be further strengthened [55].
After 2019, the ecological and environmental factors mentioned above, such as X11, X12, X16, X21, and X22, were improved and no longer the main obstacle factors. Accordingly, population density (X3), natural population growth rate (X4), urbanization rate (X5), the ratio of cultivated land area to total land area (X15), the ratio of the output value of ecological agricultural products to the gross output value of agriculture, forestry, animal husbandry, and fishery (X29), and the ratio of the ecological processing industry’s business revenue to total business revenue of the industry (X30) became new common obstacle factors. It could be found that the social contexts such as population aging, negative population growth, and a large urban-rural gap were not conducive to the development of EPVR [56]. The increase in encroachment on cropland also limited its improvement [57]. At the same time, the inherent potential of eco-industries could not be fully stimulated, and it was necessary to innovate the development pattern and increase the added value of EPs.

4.5.2. Analysis of the Obstacle Degree at the Standard Layer

According to Equation (17), the obstacle degree of each subsystem and its trend from 2011 to 2021 could be calculated (Figure 5). Overall, the obstacle degree of the Driver subsystem showed a trend of decreasing and then increasing. It decreased from 10.33% in 2011 to 8.19% in 2016, and then increased to 30.35% in 2021, indicating that some underlying economic, population, and social problems gradually emerged over time and concentrated at a later stage, constraining the development of EPVR in China [58]; The trend of decreasing obstacle degree of the Pressure subsystem was significant, from 16.73% in 2011 to 0.18% in 2021, a reduction of about 16.55%, indicating that this subsystem was continuously optimized, and the constraints on EPVR were decreasing and tending to zero; The State subsystem and Response subsystem were the main obstacle factors affecting EPVR in China from 2011 to 2017, with an average obstacle degree of 29.54% and 25.51%, respectively. After that, the constraint of the State subsystem on EPVR gradually decreased, and the constraint of the Response subsystem on EPVR gradually increased; The Impact subsystem maintained a relatively stable obstacle degree from 2011 to 2017, with an average of 18.15%. After that, its obstacle degree on EPVR gradually increased, especially peaking in 2019 (33.44%), indicating that it was gradually becoming a major obstacle factor affecting EPVR in China.

5. Discussion

5.1. Linkages and Differences between Ecological Product Value Accounting (EPVA) and EPVR Effectiveness Evaluation

In fact, EPVA was a fundamental work to promote EPVR, which was conducive to figuring out the ecological background. It could present the potential well-being of ecosystems for mankind in a more intuitive form (amount of value) and provide scientific decision-making services for the government to carry out natural resource management and ecological protection [15,59]. In other words, EPVA could provide a usable “stock” reference for evaluating the effectiveness of EPVR. However, like EPVR, EPVA also faced a few challenges. On the one hand, mainstream ecosystem services accounting methods, such as the Millennium Ecosystem Assessment (MEA, 2005), The Economics of Ecosystems and Biodiversity (TEEB, 2010), and the System of Environmental-Economic Accounting (SEEA) (United Nations, 2012) provided useful references for EPVA, but ecological products and ecosystem services cannot be viewed as completely equivalent [60]. On the other hand, although Gross Ecosystem Product accounting was an effective method for EPVA [61], the gross ecosystem value could not be used as a direct substitute for gross ecological product, because the inclusion of traditional products, such as agriculture, forestry, animal husbandry, and fishery in ecological products might overestimate its value [62]. Therefore, there was a need to further clarify the concept of ecological products and the boundary between them and traditional products to better serve the evaluation of EPVR effectiveness through EPVA.
EPVR was a process in which the comprehensive benefits of ecological products were gradually realized in different links, involving the preservation, growth, and transformation of ecological assets, and its effectiveness was the result of the interaction of different factors, such as economic, social, and ecological, under specific conditions [17,30]. As a result, the EPVR effectiveness evaluation tended to be an outcome-oriented type of evaluation based on an understanding of the process. There still have been relatively few studies in this area (see the Introduction section for details). Undeniably, these studies, including this paper, concluded that the effectiveness of EPVR was closely related to the amount of available ecological products and their value [11,15].

5.2. Comparison with Other Studies

EPVR is an effective tool and an important element of China’s ecological civilization construction [6,19,31,58]. By constructing an evaluation index system and conducting empirical analyses, this study found that the overall effectiveness of China’s EPVR showed an upward trend, with the composite evaluation index increasing from 0.1481 in 2011 to 0.7680 in 2021, which was similar to the results of some previous studies. For example, Yan and Sun [63] designed an indicator system for ecological civilization construction (ECC) in terms of environment, society, and economy, and empirically found that China’s ECC level increased from 0.355 in 2012 to 0.553 in 2021. Zhang et al. [64] found that China’s ECC made great progress from 2015 to 2019 through empirical analysis, with the scores improving by about 8%. In addition, it was estimated that China’s GEP grew from CNY 70.6 trillion in 2015 to CNY 82.2 trillion in 2020, which confirmed the development potential of China’s EPVR [65].
EPs can be seen as an “upgraded version” of ecosystem services [12]. In this study, it was found that its obstacle effect on EPVR could be eliminated by improving the ecological background conditions. Similarly, some studies argued that the implementation of ecological restoration projects could significantly increase the value of ecosystem services [66,67]. In addition, this study concluded that demographic, social, and economic factors needed to be fully considered to further promote the development of EPVR. For ecosystem services, many scholars also believe that, in addition to natural factors, some key anthropogenic factors need to be considered, such as the intensity of human activities, population density, GDP, land-use change, etc. [68,69]. Nevertheless, EPVR still holds its own characteristics, such as being closely related to the eco-industry [12,20].

5.3. Innovation, Significance, and Applicability

The innovation of this study was to review the existing EPVR effectiveness evaluation index system, analyze its shortcomings, and make appropriate improvements. First, it filled the research gap in this field at the national level. Second, the continuous dynamic analysis of EPVR effectiveness in time series was realized. Third, the DPSIR model was introduced for the first time and organically integrated with EPVR to establish a more systematic and mature research framework. In addition, in the selection of indicators, we not only fully absorbed and extracted some common indicators from the existing study, but also added some indicators that were more relevant to EPVR and could highlight its characteristics, such as the indicators of ecological industrialization (X29, X30, and X31), green finance (X42, X43, X44, and X45), and ecological property rights trading (X46), and so on. At the same time, this study fully considered the availability of data, and all indicators could be quantified to minimize the influence of human subjective factors.
This study contributed both in terms of theoretical and practical significance. On the one hand, this study tried to use the DPSIR model to organize complex empirical scientific research with a new perspective to deepen the understanding of EPVR effectiveness by incorporating the causes, status, and improvement pathways of EPVR into a holistic framework. It not only complemented and improved the research in the field, but also consolidated and developed theories related to ecological capital, ecological economy, and strong sustainability. On the other hand, this study was a comprehensive review of China’s EPVR development in a quantitative form. By constructing a chain feedback mechanism of EPVR effectiveness, elucidating the coupling coordination relationship of each element, and analyzing the main obstacles affecting EPVR, this study could provide a guiding direction for the governmental departments to formulate a more scientific and reasonable improvement strategy.
The empirical results of this study were in line with the actual situation of EPVR development in China, and the variation in EPVR effectiveness over certain periods was rationally explained (see Section 4 for more details). This not only validated the applicability of the DPSIR model in evaluating the effectiveness of EPVR in China but also verified the practicality of the constructed indicator system. Hence, this study could provide a new methodology for multidisciplinary researchers in human geography, resource economics, and ecology. Furthermore, the DPSIR model was also a theoretical framework with openness, and the indicator system could be modified and improved according to the characteristics of different research scales, research regions, and research objects, to realize wider application. Meanwhile, the methodology and indicator system of this study were not only applicable to China but could also provide a reference for other countries to assess the degree of green development and sustainable resource utilization.

5.4. Limitations and Future Research Perspectives

Despite the promising results of this study, there were still some shortcomings due to the objective conditions, mainly as follows. First, China has had a relatively short period to carry out EPVR practice work in the true sense of the word. This study already selected the corresponding period to the greatest extent possible, but the development of EPVR might go through a more complex process as time goes by. It was needed to make the evaluation of EPVR effectiveness a long-term task with continuous observations to test the methodology of this study, as well as the scientific nature of the index system over a longer time span. Second, this study was based on certain principles to select representative indicators to construct the evaluation system. The number of indicators has already reached 52, but it still needs to be improved in the future according to the development characteristics of EPVR and the actual situation of ECC. Some indicators that present greater difficulties in data collection and quantification, such as policy, behavioral change, community action, stakeholder involvement, and climate change response, still need to be explored in depth. Third, this study determined the indicator weights using EWM, which was relatively objective but might not be comprehensive enough. Future studies can consider combining subjective evaluation methods, such as the Delphi method, to improve the indicator weighting process. Finally, this study was a preliminary evaluation of EPVR effectiveness at the national scale, taking China as a whole. Caution is needed when directly applying this evaluation index system to other countries or other research scales (e.g., province, city, county). Because the factors involved in EPVR are very complex and diverse. When developing specific assessment guidelines, the government can try to introduce third-party organizations, such as research institutes, to strengthen the scientific nature and integrity of the evaluation system. Different regions have differentiated characteristics and should make appropriate adjustments to the evaluation system according to their own realities. In addition, the issue of spatial spillover effects was not considered in this study. Next, we would combine spatial analysis methods to further explore the characteristics of EPVR effectiveness among different provinces.

6. Conclusions and Recommendations

6.1. Conclusions

In this study, EPVR was regarded as a complex system project, and based on the DPSIR model, a multi-layered comprehensive evaluation index system of China’s EPVR effectiveness was constructed in terms of five sub-systems, namely, Driver, Pressure, State, Influence, and Response, and the entropy weight method was used to determine the weights of the indicators. On this basis, an empirical analysis of China’s EPVR effectiveness from 2011 to 2021 was conducted through the TOPSIS method, the weighted summation method, the coupling coordination degree model, and the obstacle diagnosis model, and the main conclusions were as follows.
(1)
The evaluation index system had certain science and applicability. In the whole system, the weights were ordered as follows: State subsystem > Response subsystem > Impact subsystem > Pressure subsystem > Driver subsystem.
(2)
The EPVR effectiveness in China was significantly improved from 2011 to 2021, with the composite evaluation index increasing from 0.1481 to 0.7680, showing an overall upward trend. According to the development characteristics, it could be divided into the period of slow exploration (2011~2016) and the period of rapid development (2017~2021).
(3)
There were differences in the developmental effectiveness of the different subsystems, and except for the Driver subsystem, the other subsystems were generally consistent with the trend in the overall effectiveness of the system. The contribution of the Pressure subsystem to the overall system increased over time. The different subsystems became increasingly interconnected and their coordination continued to improve, with greater synergy effects on the whole system.
(4)
The main obstacle factors were not fixed in different years. From 2011 to 2016, some indicators characterizing the ecological and environmental conditions became the main obstacle factors for the development of China’s EPVR. From 2019 to 2021, the indicators concerning the population, society, and industrial development conditions became the new main obstacle factors. In terms of subsystems, the obstacle degree of the Pressure subsystem to the whole system decreased, while the Influence subsystem gradually increased and the rest of the subsystems showed fluctuations.

6.2. Recommendations

With the deepening of practice, the challenges faced by EPVR are becoming increasingly diverse and complex. To consolidate the effectiveness of development, based on the above findings, this study proposed the following policy recommendations.
(1)
Enhance ecological restoration and improve the supply capacity of ecological products. The results of this study showed that some ecological indicators were once the main obstacle factors for EPVR in the previous period. To avoid the huge losses caused by the re-deterioration of the ecosystem, it is still necessary to improve and strengthen the structure and function of the ecosystem. The government should adhere to the principle of “mountain—water—forest—farmland—lake—grassland—desert ecosystems” systematic management, vigorously promote land greening projects, scientifically demarcate ecological red lines, strengthen agricultural land remediation, and gradually improve the construction of national parks, to create favorable conditions for the transformation of ecological elements into ecological products.
(2)
Control environmental pollution and improve the efficiency of natural resource utilization. From the results of the study, the contribution of the Pressure subsystem to the comprehensive effectiveness of EPVR has increased over time. It cannot be separated from the stress-relieving effect of the Response subsystem, as evidenced by the continued positive state of coordination between these two subsystems. The government should continue to increase investment in the treatment of environmental pollution, give strong support to the R&D of energy-saving and emission-reducing technologies and the optimization of industrial structures, and continue to promote cleaner production methods. In addition, environmental laws and standards should be strictly enforced, and inspections on ecological and environmental protection should be strengthened.
(3)
Optimize market operation and improve the development of eco-industry. In this study, it was found that eco-industrialization was gradually becoming one of the main obstacle factors of EPVR. The government should explore the development pattern of the whole ecological industry chain according to the different characteristics of the ecological industry, and endeavor to build a price mechanism that truly reflects the supply and demand relationship in the ecological product market. For eco-agriculture, it should be accelerated the construction of regional public brands and the establishment of a standardized product certification system; for the eco-processing industry, the added value of products should be increased in the form of deep and intensive processing; for eco-tourism, it should be a new pattern of whole-area tourism and accelerated to a high degree of integration with multi-industries such as eco-recreation and eco-education.
(4)
Make good use of policy instruments to strengthen the overall coordination of EPVR. The results of this study revealed that although the coordination between different subsystems continued to improve, it was still at a low level and there was much room for improvement. We can consider implementing actions with some macro policy instruments. First, the government should determine the direction of EPVR development based on a reasonable assessment of regional resource endowments and demand differences, and guide the eco-industry layout through some binding indicators when formulating territorial spatial planning. Second, the important tasks of EPVR should be included in the government’s work program and annual development plan, and be compatible with the national economic and social development plan. Finally, a sound ecological assessment mechanism can be considered to strengthen the responsibility of ecological protection. For example, around the different aspects of EPVR, implementation objectives and requirements for the corresponding management departments should be formulated and used as an important references for assessing the performance of managers.

Author Contributions

Conceptualization, X.X. and S.C.; methodology, X.X.; software, X.X.; validation, X.X., S.C. and R.Z.; formal analysis, X.X.; data curation, X.X.; writing—original draft preparation, X.X.; writing—review and editing, S.C. and R.Z.; visualization, X.X.; supervision, S.C.; project administration, S.C.; funding acquisition, S.C. All authors have read and agreed to the published version of the manuscript.

Funding

This research was funded by Fundamental Research Funds of Chinese Academy of Forestry (No. CAFYBB2022MC001) and National Social Science Foundation of China (No. 22BGL313).

Institutional Review Board Statement

Not applicable.

Informed Consent Statement

Not applicable.

Data Availability Statement

Not applicable.

Conflicts of Interest

The authors declare no conflict of interest.

References

  1. Kang, X.; Wang, M.; Lin, J.; Li, X. Trends and status in resources security, ecological stability, and sustainable development research: A systematic analysis. Environ. Sci. Pollut. Res. 2022, 29, 50192–50207. [Google Scholar] [CrossRef] [PubMed]
  2. Transforming Our World: The 2030 Agenda for Sustainable Development. Available online: https://sdgs.un.org/publications/transforming-our-world-2030-agenda-sustainable-development-17981 (accessed on 5 July 2023).
  3. Countries Who Have Presented Their Voluntary National Reviews. Available online: https://hlpf.un.org/countries (accessed on 11 October 2023).
  4. Cheng, Y.; Liu, H.; Wang, S.; Cui, X.; Li, Q. Global Action on SDGs: Policy Review and Outlook in a Post-Pandemic Era. Sustainability 2021, 13, 6461. [Google Scholar] [CrossRef]
  5. Wang, N.; Guo, J.; Zhang, J.; Fan, Y. Comparing eco-civilization theory and practice: Big-data evidence from China. J. Clean. Prod. 2022, 380, 134754. [Google Scholar] [CrossRef]
  6. Wei, F.; Cui, S.; Liu, N.; Chang, J.; Ping, X.; Ma, T.; Xu, J.; Swaisgood, R.; Locke, H. Ecological civilization: China’s effort to build a shared future for all life on earth. Natl. Sci. Rev. 2021, 8, 279. [Google Scholar] [CrossRef]
  7. Cai, Y.; Zhang, F.; Duan, P.; Jim, C.Y.; Chan, N.W.; Shi, J.; Liu, C.; Wang, J.; Bahtebay, J.; Ma, X. Vegetation cover changes in China induced by ecological restoration-protection projects and land-use changes from 2000 to 2020. Catena 2022, 217, 106530. [Google Scholar] [CrossRef]
  8. Report on the State of the Ecology and Environment in China 2022. Available online: https://www.mee.gov.cn/hjzl/sthjzk/zghjzkgb/202305/P020230529570623593284.pdf (accessed on 8 July 2023). (In Chinese)
  9. Zeng, X.; Yu, H.; Xie, F. Concept, Classification and Market Supply Mechanism of Ecological Products. China Popul. Resour. Environ. 2014, 24, 12–17. (In Chinese) [Google Scholar]
  10. Jin, C.; Lu, Y. Review and Prospect of Research on Value Realization of Ecological Products in China. Econ. Geogr. 2021, 41, 207–213. (In Chinese) [Google Scholar]
  11. Wang, K.; Liu, P.; Sun, F.; Wang, S.; Zhang, G.; Zhang, T.; Chen, G.; Liu, J.; Wang, G.; Cao, S. Progress in realizing the value of ecological products in China and its practice in Shandong Province. Sustainability 2023, 15, 9480. [Google Scholar] [CrossRef]
  12. Yang, Y.; Xiong, K.; Huang, H.; Xiao, J.; Yang, B.; Zhang, Y. A commented review of eco-product value realization and ecological industry and its enlightenment for agroforestry ecosystem services in the karst ecological restoration. Forests 2023, 14, 448. [Google Scholar] [CrossRef]
  13. Zhang, L.; Yu, H.; Hao, C.; Wang, H.; Luo, R. Redefinition and Connotation Analysis of Ecosystem Product. Res. Environ. Sci. 2021, 34, 655–660. (In Chinese) [Google Scholar]
  14. Sun, B.; Peng, X. Realization Mode, Key Issues and Institutional Guarantee System of Ecological Product Value. Ecol. Econ. 2021, 37, 13–19. (In Chinese) [Google Scholar]
  15. Yu, H.; Shao, C.; Wang, X.; Hao, C. Transformation Path of Ecological Product Value and Efficiency Evaluation: The Case of the Qilihai Wetland in Tianjin. Int. J. Environ. Res. Public Health 2022, 19, 14575. [Google Scholar] [CrossRef]
  16. Zhang, L.; Yu, H.; Hao, C.; Wang, H. Practice Model and Path of Ecosystem Product Value Realization. Res. Environ. Sci. 2021, 34, 1407–1416. (In Chinese) [Google Scholar]
  17. Fang, Q.S.; Li, H.X. The concept delimitation, the value realization process, and the realization path of the capitalization of forest ecological resources. Nat. Resour. Forum 2021, 45, 424–440. [Google Scholar] [CrossRef]
  18. Yan, N.; Liu, G.; Xu, L.; Deng, X.; Casazza, M. Emergy-based eco-credit accounting method for wetland mitigation banking. Water Res. 2022, 210, 118028. [Google Scholar] [CrossRef]
  19. Xue, B.; Han, B.; Li, H.; Gou, X.; Yang, H.; Thomas, H.; Stückrad, S. Understanding ecological civilization in China: From political context to science. Ambio 2023, 1–15. [Google Scholar] [CrossRef]
  20. Wang, J.; Ma, G.; Wang, Z.; Wang, X.; Yu, F.; Liu, G.; Zhao, Y.; Yang, W.; Shi, M.; Deng, J.; et al. Development and application of indicator system about the quaternary industry of ecological products in China. China Popul. Resour. Environ. 2021, 31, 1–8. (In Chinese) [Google Scholar]
  21. National Development and Reform Commission Issues Green Development Indicator System and Ecological Civilization Construction Assessment Target System. Available online: https://www.gov.cn/xinwen/2016-12/22/content_5151575.htm (accessed on 16 July 2023).
  22. National Development and Reform Commission Issues Assessment Indicator System and Implementation Program for Beautiful China Construction. Available online: https://www.gov.cn/zhengce/zhengceku/2020-03/07/content_5488275.htm (accessed on 20 July 2023).
  23. Ministry of Ecology and Environment Issues “Two Mountains Index” Evaluation Index System. Available online: https://www.mee.gov.cn/xxgk2018/xxgk/xxgk03/201909/W020190919344656829212.pdf (accessed on 22 July 2023).
  24. Wang, X.; Zhang, Q.; Qian, G.; Wang, H. Evaluation on the effectiveness of eco-product value realization. J. Arid Land Resour. Environ. 2023, 37, 9–15. (In Chinese) [Google Scholar]
  25. Lei, S.; Meng, X.; Hou, C.; Ye, L.; Deng, H.; Chai, Y.; Han, Y. Ecological products value realization mechanism and effectiveness evaluation in the Yangtze River Basin. J. Environ. Eng. Technol. 2022, 12, 399–407. (In Chinese) [Google Scholar]
  26. Yu, D.; Xiong, M. The Evaluation of Regional Abilities on the Realization of Ecological Products’ Value. Ecol. Environ. Sci. 2023, 32, 397–406. (In Chinese) [Google Scholar]
  27. Li, J.; Chen, G.; Lei, J.; Miao, X.; Lei, Y. Capability Evaluation and Promotion Path of Value Realization of Ecological Products in the Upper Reaches of the Yangtze River. J. Southwest For. Univ. Soc. Sci. 2023, 7, 1–8. (In Chinese) [Google Scholar]
  28. Lin, Y.; Xu, W.; Li, P.; Wang, X.; Ouyang, Z. Assessing the realization of the values of ecosystem products: A case study of Lishi, China. Acta Ecol. Sin. 2023, 43, 189–197. (In Chinese) [Google Scholar]
  29. Gari, S.R.; Newton, A.; Icely, J.D. A review of the application and evolution of the DPSIR framework with an emphasis on coastal social-ecological systems. Ocean Coast. Manag. 2015, 103, 63–77. [Google Scholar]
  30. Xu, Y.; Zhao, W.; Zhang, Z. The Practice of Nature-based Solutions in China: Ecosystem Product Value Realization. Curr. Opin. Environ. Sci. Health 2023, 36, 100514. [Google Scholar] [CrossRef]
  31. Chen, H.; Xu, J.; Zhang, K.; Guo, S.; Lv, X.; Mu, X.; Yang, L.; Hu, X.; Ma, Y.; Manirakiza, B.; et al. New insights into the DPSIR model: Revealing the dynamic feedback mechanism and efficiency of ecological civilization construction in China. J. Clean. Prod. 2022, 348, 131377. [Google Scholar]
  32. Mosaffaie, J.; Jam, A.S.; Tabatabaei, M.R.; Kousari, M.R. Trend assessment of the watershed health based on DPSIR framework. Land Use Policy 2021, 100, 104911. [Google Scholar]
  33. Zheng, M.; Li, Y.; Su, Z.; Van, F.Y.; Jiang, P.; Varbanov, P.S.; Klemeš, J.J. Supplier evaluation and management considering greener production in manufacturing industry. J. Clean. Prod. 2022, 342, 130964. [Google Scholar]
  34. Peng, T.; Deng, H. Evaluating urban resource and environment carrying capacity by using an innovative indicator system based on eco-civilization—A case study of Guiyang. Environ. Sci. Pollut. Res. 2021, 28, 6941–6955. [Google Scholar]
  35. Tan, Z.; Mu, S.; Wang, H.; Chen, S.; Han, J. The carbon emission reduction effect of auditing outgoing officials’ natural resource asset management—Evidence from China. Sci. Total Environ. 2023, 901, 166528. [Google Scholar]
  36. Pei, J.; Zhong, K.; Li, J.; Xu, J.; Wang, X. ECNN: Evaluating a cluster-neural network model for city innovation capability. Neural Comput. Appl. 2021, 34, 12331–12343. [Google Scholar] [CrossRef]
  37. Shi, L.; Xiang, X.; Zhu, W.; Gao, L. Standardization of the evaluation index system for low-carbon cities in China: A case study of Xiamen. Sustainability 2018, 10, 3751. [Google Scholar]
  38. Huang, W.; Zhang, Y.; Yu, Y.; Xu, Y.; Xu, M.; Zhang, R.; Dieu, G.J.D.; Yin, D.; Liu, Z. Historical data-driven risk assessment of railway dangerous goods transportation system: Comparisons between Entropy Weight Method and Scatter Degree Method. Reliab. Eng. Syst. Saf. 2021, 205, 107236. [Google Scholar]
  39. Pandey, V.; Komal; Dincer, H. A review on TOPSIS method and its extensions for different applications with recent development. Soft Comput. 2023, 27, 18011–18039. [Google Scholar]
  40. Amorocho, J.A.P.; Hartmann, T. A multi-criteria decision-making framework for residential building renovation using pairwise comparison and TOPSIS methods. J. Build. Eng. 2022, 53, 104596. [Google Scholar]
  41. Madathil, D.; Nair, M.G.; Jamasb, T.; Thakur, T. Consumer-focused solar-grid net zero energy buildings: A multi-objective weighted sum optimization and application for India. Sustain. Prod. Consum. 2021, 27, 2101–2111. [Google Scholar]
  42. Tomal, M. Evaluation of coupling coordination degree and convergence behaviour of local development: A spatiotemporal analysis of all Polish municipalities over the period 2003–2019. Sustain. Cities Soc. 2021, 71, 102992. [Google Scholar]
  43. Zameer, H.; Yasmeen, H.; Wang, R.; Tao, J.; Malik, M.N. An empirical investigation of the coordinated development of natural resources, financial development and ecological efficiency in China. Resour. Policy 2020, 65, 101580. [Google Scholar]
  44. Wang, D.; Shen, Y.; Zhao, Y.Y.; He, W.; Liu, X.; Qian, X.Y.; Lv, T. Integrated assessment and obstacle factor diagnosis of China’s scientific coal production capacity based on the PSR sustainability framework. Resour. Policy 2020, 68, 101794. [Google Scholar]
  45. Xie, X.; Fang, B.; Li, X.; He, S.S. Urban ecosystem health assessment and obstacle factor diagnosis using a comprehensive assessment model for Nanjing, China. Growth Chang. 2021, 52, 1938–1954. [Google Scholar]
  46. Du, M.; Huang, C.; Chen, Z. Evaluating the water-saving and wastewater-reducing effects of water rights trading pilots: Evidence from a quasi-natural experiment. J. Environ. Manag. 2022, 319, 115706. [Google Scholar]
  47. Liu, X.; Zhong, S.; Li, S.; Yang, M. Evaluating the impact of central environmental protection inspection on air pollution: An empirical research in China. Process Saf. Environ. Prot. 2022, 160, 563–572. [Google Scholar] [CrossRef]
  48. Program for Reform of the System of Compensation for Ecological and Environmental Damages. Available online: https://www.gov.cn/zhengce/2017-12/17/content_5247952.htm (accessed on 20 July 2023). (In Chinese)
  49. Ding, D.; Zhang, R. China’s COVID-19 control strategy and its impact on the global pandemic. Front. Public Health 2022, 10, 857003. [Google Scholar] [CrossRef] [PubMed]
  50. Zhao, X.X.; Wen, J.; Zou, X.Y.; Wang, Q.J.; Chang, C.P. Strategies for the sustainable development of China in the post-epidemic era. Sustain. Dev. 2023, 31, 426–438. [Google Scholar] [CrossRef]
  51. Chen, A.; Groenewold, N. China’s ‘New Normal’: Is the growth slowdown demand-or supply-driven? China Econ. Rev. 2019, 58, 101203. [Google Scholar] [CrossRef]
  52. Peng, B.; Yan, W.; Wei, G.; Wan, A. Evolution and interaction of ecological civilization construction pattern from the perspective of path dependence–based on the panel data of Jiangsu Province, China. Environ. Dev. Sustain. 2021, 24, 12226–12247. [Google Scholar] [CrossRef]
  53. Shi, T.; Yang, S.; Zhang, W.; Zhou, Q. Coupling coordination degree measurement and spatiotemporal heterogeneity between economic development and ecological environment—Empirical evidence from tropical and subtropical regions of China. J. Clean. Prod. 2020, 244, 118739. [Google Scholar] [CrossRef]
  54. Li, L.; Fan, Z.; Xiong, K.; Shen, H.; Guo, Q.; Dan, W.; Li, R. Current situation and prospects of the studies of ecological industries and ecological products in eco-fragile areas. Environ. Res. 2021, 201, 111613. [Google Scholar]
  55. Du, K.; Cheng, Y.; Yao, X. Environmental regulation, green technology innovation, and industrial structure upgrading: The road to the green transformation of Chinese cities. Energy Econ. 2021, 98, 105247. [Google Scholar] [CrossRef]
  56. Wang, X.; Hong, J.; Fan, P.; Xu, S.; Chai, Z.; Zhou, Y. Is China’s urban–rural difference in population aging rational? An international comparison with key indicators. Growth Chang. 2021, 52, 1866–1891. [Google Scholar] [CrossRef]
  57. Liu, C.; Song, C.; Ye, S.; Cheng, F.; Zhang, L.; Li, C. Estimate provincial-level effectiveness of the arable land requisition-compensation balance policy in mainland China in the last 20 years. Land Use Policy 2023, 131, 106733. [Google Scholar]
  58. Hansen, M.H.; Li, H.; Svarverud, R. Ecological civilization: Interpreting the Chinese past, projecting the global future. Glob. Environ. Chang. 2018, 53, 195–203. [Google Scholar] [CrossRef]
  59. Ma, G.; Wang, J.; Yu, F.; Yang, W.; Ning, J.; Peng, F.; Zhou, X.; Cao, D. Framework construction and application of China’s Gross Economic-Ecological Product accounting. J. Environ. Manag. 2020, 264, 109852. [Google Scholar] [CrossRef]
  60. Hao, C.; Wu, S.; Zhang, W.; Chen, Y.; Ren, Y.; Chen, X.; Wang, H.; Zhang, L. A critical review of Gross ecosystem product accounting in China: Status quo, problems and future directions. J. Environ. Manag. 2022, 322, 115995. [Google Scholar] [CrossRef]
  61. Ouyang, Z.; Song, C.; Zheng, H.; Polasky, S.; Xiao, Y.; Bateman, I.J.; Liu, J.; Ruckelshaus, M.; Shi, F.; Xiao, Y.; et al. Using gross ecosystem product (GEP) to value nature in decision making. Proc. Natl. Acad. Sci. USA 2020, 117, 14593–14601. [Google Scholar] [CrossRef]
  62. Zhang, L.; Hao, C.; Song, Y.; Wang, Y.; Zhang, W.; Huang, Y.; Liang, T. Basic Principles of Gross Ecosystem Product (GEP) Accounting. J. Resour. Ecol. 2022, 13, 501–510. [Google Scholar]
  63. Yan, X.; Sun, Q. How to Evaluate Ecological Civilization Construction and Its Regional Differences: Evidence from China. Sustainability 2023, 15, 12543. [Google Scholar] [CrossRef]
  64. Zhang, L.; Wang, H.; Zhang, W.; Wang, C.; Bao, M.; Liang, T. Study on the development patterns of ecological civilization construction in China: An empirical analysis of 324 prefectural cities. J. Clean. Prod. 2022, 367, 132975. [Google Scholar] [CrossRef]
  65. Liu, G.H. The Fifth Ecological and Environmental Protection Industry Innovation and Development Conference. Available online: http://epaper.cenews.com.cn/html/2023-04/18/content_85704.htm (accessed on 13 September 2023).
  66. Liu, M.; Jia, Y.; Zhao, J.; Shen, Y.; Pei, H.; Zhang, H.; Li, Y. Revegetation projects significantly improved ecosystem service values in the agro-pastoral ecotone of northern China in recent 20 years. Sci. Total Environ. 2021, 788, 147756. [Google Scholar] [CrossRef]
  67. Chen, H.; Fleskens, L.; Schild, J.; Moolenaar, S.; Wang, F.; Ritsema, C. Impacts of large-scale landscape restoration on spatio-temporal dynamics of ecosystem services in the Chinese Loess Plateau. Landsc. Ecol. 2022, 37, 329–346. [Google Scholar] [CrossRef]
  68. Fang, L.; Wang, L.; Chen, W.; Sun, J.; Cao, Q.; Wang, S.; Wang, L. Identifying the impacts of natural and human factors on ecosystem service in the Yangtze and Yellow River Basins. J. Clean. Prod. 2021, 314, 127995. [Google Scholar] [CrossRef]
  69. Liu, Z.; Wang, S.; Fang, C. Spatiotemporal evolution and influencing mechanism of ecosystem service value in the Guangdong-Hong Kong-Macao Greater Bay Area. J. Geogr. Sci. 2023, 33, 1226–1244. [Google Scholar] [CrossRef]
Figure 1. The logic of constructing the evaluation index system of EPVR effectiveness.
Sustainability 15 15572 g001
Figure 2. Evaluation scores for different subsystems from 2011 to 2021.
Sustainability 15 15572 g002
Figure 3. Relative contributions of different subsystems from 2011 to 2021.
Sustainability 15 15572 g003
Figure 4. Degree of coupling coordination between different subsystems (radar chart).
Sustainability 15 15572 g004
Figure 5. The obstacle degree of different subsystems of EPVR in China from 2011 to 2021.
Sustainability 15 15572 g005
Table 1. The evaluation index system of EPVR effectiveness based on the DPSIR model.
Standard LayerFactor LayerIndicator LayerUnitAttribute
Driver (D)Economic development (D1)Per capita GDP (X1)104 yuanPositive
Engel coefficient (X2)%Negative
Population growth (D2)Population density (X3)Persons/km2Moderate
Natural population growth rate (X4)Moderate
Social structure (D3)Urbanization rate (X5)%Moderate
Gini coefficient (X6)Negative
Pressure (P)Resource depletion (P1)Energy consumption per unit GDP (X7)Tce/104 yuanNegative
Water depletion per unit GDP (X8)m3/104 yuanNegative
Environmental pollution (P2)Emissions of major pollutants per unit GDP (X9)Tons/104 yuanNegative
Emissions of chemical fertilizers and pesticides per unit GDP (X10)Tons/104 yuanNegative
Ecological damage (P3)Ratio of soil erosion area to total land area (X11)%Negative
Ratio of desertified and sandified areas to total land area (X12)%Negative
State (S)Resource reserves (S1)Per capita water resources (X13)m3/personPositive
Forest coverage (X14)%Positive
Ratio of cultivated land area to total land area (X15)%Positive
Ratio of wetland area to total land area (X16)%Positive
Integrated vegetation cover of grassland (X17)%Positive
Environmental conditions (S2)Percentage of centralized drinking water sources meeting the standard (X18)%Positive
Percentage of water quality of nearshore sea areas meeting the standard (X19)%Positive
Percentage of days of urban air quality meeting the standard (X20)%Positive
Ratio of high-grade cropland area to total cropland area (X21)%Positive
Ecological security (S3)Ratio of the protected natural area to total land area (X22)%Positive
Number of major environmental events (X23)Negative
Impact (I)Industrial ecologicalization (I1)Ratio of clean energy consumption to total energy consumption (X24)%Positive
Ratio of water-saving irrigated area to total cultivated area (X25)%Positive
Comprehensive utilization rate of agricultural production waste (X26)%Positive
Water consumption per 10, 000 yuan of industrial added value (X27)m3 Negative
Comprehensive utilization rate of industrial solid waste (X28)%Positive
Ecological industrialization (I2)Ratio of the output value of ecological agricultural products to gross output value of agriculture, forestry, animal husbandry, and fishery (X29)%Positive
Ratio of the ecological processing industry’s business revenue to total business revenue of the industry (X30)%Positive
Ratio of eco-tourism’s business revenue to gross output value of tertiary industry (X31)%Positive
Social life (I3)The green coverage rate of built-up area (X32)%Positive
Public recreational green space per capita (X33)%Positive
Per capita disposable income of households (X34)YuanPositive
Registered unemployment rate in urban areas (X35)%Negative
Response (R)Ecological governance (R1)Total area of afforestation (X36)HectarePositive
Prevention rate of forest harmful organisms (X37)%Positive
Area of integrated soil erosion control (X38)104 km2Positive
Area of sandified land rehabilitated (X39)HectarePositive
Fiscal support (R2)Total investment in the treatment of environmental pollution as percent of GDP (X40)%Positive
Proportion of environmental protection expenditure to general public budget expenditure (X41)%Positive
Green finance (R3)Proportion of credit lines for environmental protection projects to total credit lines (X42)%Positive
Proportion of environmental pollution liability insurance revenue to total insurance revenue (X43)%Positive
Proportion of total green bond issuance to total issuance of all bonds (X44)%Positive
Proportion of total market capitalization of green funds to total market capitalization of all funds (X45)%Positive
Ecological property rights trading (R4)Proportion of market turnover of ecological property rights to total market turnover of property rights (X46)%Positive
Research and education (R5)Proportion of granted green patents to total granted patents (X47)%Positive
Number of new higher education institutions (X48)Positive
Infrastructure development (R6)Popularization rate of telephones (X49)set/100 personsPositive
Railway and highway density (X50)km/104 km2Positive
Environmental regulation (R7)Total number of local environmental regulations enacted during the year (X51)Positive
Number of key emission units implemented with automatic monitoring (X52)Positive
Notes: (1) Ecological agricultural products consist of green food and organic agricultural products; (2) The eco-processing industry is mainly involved in agro-food processing, food manufacturing, beverage manufacturing, wood processing, furniture manufacturing, and water production and supply; (3) Eco-tourism consists of coastal tourism, forestry tourism, and leisure agriculture; (4) Ecological property rights include pollutant emission rights, carbon emission rights, and energy use rights; (5) Green patents consist of green invention patents and green utility model patents.
Table 2. Classification levels of coupling coordination degree.
Pi0.0000~0.09990.1000~0.19990.2000~0.29990.3000~0.39990.4000~0.4999
PerformanceExtreme disordersSerious disordersModerate disordersMild disordersEndangered disorders
Level12345
Pi0.5000~0.59990.6000~0.69990.7000~0.79990.8000~0.89990.9000~1.0000
PerformanceReluctant coordinationPrimary coordinationIntermediate coordinationGood coordinationExcellent coordination
Level678910
Table 3. Weights of evaluation indicators at different layers.
Standard LayerFactor LayerIndicator LayerWeight
D (0.0980)D1 (0.0281)X10.0169
X20.0112
D2 (0.0388)X30.0193
X40.0195
D3 (0.0311)X50.0206
X60.0105
P (0.1535)P1 (0.0308)X70.0184
X80.0124
P2 (0.0274)X90.0134
X100.0140
P3 (0.0953)X110.0614
X120.0339
S (0.2788)S1 (0.1163)X130.0084
X140.0159
X150.0233
X160.0611
X170.0076
S2 (0.1012)X180.0208
X190.0172
X200.0156
X210.0476
S3 (0.0613)X220.0550
X230.0063
I (0.1985)I1 (0.0735)X240.0145
X250.0139
X260.0164
X270.0129
X280.0158
I2 (0.0671)X290.0158
X300.0128
X310.0385
I3 (0.0579)X320.0163
X330.0122
X340.0157
X350.0137
R (0.2712)R1 (0.0546)X360.0082
X370.0198
X380.0122
X390.0144
R2 (0.0255)X400.0128
X410.0127
R3 (0.0601)X420.0161
X430.0151
X440.0144
X450.0145
R4 (0.0156)X460.0156
R5 (0.0185)X470.0072
X480.0113
R6 (0.0257)X490.0112
X500.0145
R7 (0.0712)X510.0317
X520.0395
Note: The values in parentheses are the weights of the standard and factor layers.
Table 4. The development effectiveness index and rank of EPVR in China from 2011 to 2021.
YearDi+DiMiRank
20110.1583 0.0275 0.1481 11
20120.1518 0.0337 0.1815 10
20130.1499 0.0403 0.2116 9
20140.1433 0.0493 0.2561 8
20150.1402 0.0535 0.2763 7
20160.1368 0.0559 0.2901 6
20170.1231 0.0786 0.3897 5
20180.0794 0.1159 0.5933 4
20190.0531 0.1391 0.7236 3
20200.0405 0.1450 0.7815 1
20210.0453 0.1501 0.7680 2
Table 5. Degree of coupling coordination between different subsystems and level of coordination.
YearD-PLevelP-SLevelS-ILevelI-RLevel
20110.049110.094010.214330.24903
20120.126520.223930.308340.29753
20130.163820.235330.319840.35024
20140.226130.299630.370840.38704
20150.276930.332940.386440.40025
20160.299030.333440.380340.44265
20170.309840.397940.445650.49295
20180.391640.528460.526860.53426
20190.426150.610470.584060.56306
20200.399740.623370.623970.59486
20210.400850.632970.628670.59216
YearR-DLevelR-PLevelR-SLevelD-P-S-I-RLevel
20110.112520.064210.168220.22423
20120.140920.129320.254930.37484
20130.211530.167920.279730.43225
20140.208330.202630.285430.51076
20150.240030.232730.306740.55476
20160.270530.282630.318440.58536
20170.302040.317740.412650.66447
20180.306440.395340.509760.78408
20190.300640.431950.571360.85249
20200.265730.423750.5621 60.86049
20210.250730.425750.5548 60.85799
Table 6. Main obstacle factors and corresponding obstacle degrees for the EPVR in China from 2011 to 2021.
Main Obstacle Factors20112012201320142015201620172018201920202021
X3 1.88 2.815.026.768.94
X4 2.31 2.40 2.622.61 4.407.399.02
X52.25 2.444.066.798.689.55
X116.727.307.748.428.989.4911.133.68
X123.704.034.273.553.784.004.696.79
X152.552.772.94 3.274.875.625.78
X166.697.277.718.388.949.4511.08
X18 2.963.425.465.74
X20 1.96
X215.215.676.016.536.977.36
X225.776.196.937.377.978.219.6811.93
X28 3.896.155.02
X29 4.285.065.48
X30 3.834.605.96
X314.214.414.685.054.985.155.648.1012.00 4.37
X35 6.19
X37 2.462.32
X39 5.73
X48 5.23
X513.483.693.733.994.583.392.66 7.0510.61
X524.324.554.745.095.625.795.727.169.127.13
Total44.948.1951.2153.155.6658.4259.0757.1562.263.570.67
Disclaimer/Publisher’s Note: The statements, opinions and data contained in all publications are solely those of the individual author(s) and contributor(s) and not of MDPI and/or the editor(s). MDPI and/or the editor(s) disclaim responsibility for any injury to people or property resulting from any ideas, methods, instructions or products referred to in the content.

