Article

Enhancing Self-Explanation Learning through a Real-Time Feedback System: An Empirical Evaluation Study

1
Graduate School of Informatics, Kyoto University, Kyoto 606-8501, Japan
2
Center for Innovative Research and Education in Data Science, Institute for Liberal Arts and Sciences, Kyoto University, Kyoto 606-8316, Japan
3
Academic Center for Computing and Media Studies, Kyoto University, Kyoto 606-8317, Japan
4
National Institute for Educational Policy Research (NIER), Tokyo 100-8951, Japan
*
Authors to whom correspondence should be addressed.
Sustainability 2023, 15(21), 15577; https://doi.org/10.3390/su152115577
Submission received: 3 September 2023 / Revised: 9 October 2023 / Accepted: 18 October 2023 / Published: 2 November 2023
(This article belongs to the Section Sustainable Engineering and Science)

Abstract

:
This research introduces the self-explanation-based automated feedback (SEAF) system, aimed at alleviating the teaching burden through real-time, automated feedback while aligning with SDG 4’s sustainability goals for quality education. The system specifically targets the enhancement of self-explanation, a proven but challenging cognitive strategy that bolsters both conceptual and procedural knowledge. Utilizing a triad of core feedback mechanisms—customized messages, quality assessments, and peer-generated exemplars—SEAF aims to fill the gap left by traditional and computer-aided self-explanation methods, which often require extensive preparation and may not provide effective scaffolding for all students. In a pilot study involving 50 junior high students, those with initially limited self-explanation skills showed significant improvement after using SEAF, achieving a moderate learning effect. A resounding 91.7% of participants acknowledged the system’s positive impact on their learning. SEAF’s automated capabilities serve dual purposes: they offer a more personalized and scalable approach to student learning while simultaneously reducing the educators’ workload related to feedback provision.

1. Introduction

Learning interventions are implemented to augment normal teaching to enhance the cognitive, metacognitive, and affective aspects of learning and improve motivation [1]. One area of particular interest that has been found to be an effective learning intervention is self-explanation, a cognitive process that involves generating explanations to deepen one’s understanding of a concept or solution [2,3]. Research has found that self-explanation can promote both conceptual and procedural knowledge, directing attention to the structural features of intellectual content [4,5]. While the self-explanation strategy has been found to be effective, it requires scaffolding to encourage students to use it in effective ways. Reflection mechanisms demand higher cognitive skills that students might not have yet acquired; furthermore, some students could be reluctant or not be motivated to use their skills in the course of study, and, as a result, only a small percentage of students engage in generating explanations in the spontaneous self-explanation condition [6,7]. In previous research, instructors and researchers have often employed scripts to facilitate the self-explanation task by manually creating prompts, paper-based exercises and templates, and feedback [3], including scaffold templates based on sample sentences [8,9,10]. However, it has also been suggested that research into computer-generated prompts and feedback could improve the scalability of self-explanation while ensuring consistency in the quality of the support that is required [11].
Feedback is pivotal in academic improvement [12] and aligns with SDG 4’s focus on sustainable, quality education [13]. Emerging educational systems, especially in STEM fields, offer scalable, real-time feedback that enhances learning [14,15,16]. Prior studies on computer-aided feedback systems like start [17,18,19] and Stair Stepper [11] have focused on enhancing self-explanation skills in reading comprehension as well as in writing tasks like summarizing and paraphrasing. These systems provide automated feedback to support learners. However, as pointed out by O’Neil et al. [20], the design of self-explanation prompts should strike a balance. They should encourage cognitive processes that would not otherwise take place, without being so intricate that they distract or hinder the learner.
To achieve maximum effectiveness, personalized and specific feedback for self-explanation is crucial. Lack of such targeted support may cause students to disengage from self-explanation activities before they can fully develop their skills in this area [11]. However, generating feedback for unstructured tasks in new or less common areas demands significant time and resources. This level of preparation, setup, and customization is a burden for educators, making it difficult to widely implement these strategies in classrooms. This presents a challenge for teachers who are keen on incorporating self-explanation prompts into their instruction. Additionally, crafting feedback that is both accurate and actionable necessitates a comprehensive understanding of the subject matter.
To address these challenges, we introduce the self-explanation-based automated feedback (SEAF) system—a unique synthesis of established feedback principles and implementations. SEAF offers instantaneous feedback by harnessing real-time data analytics and machine learning techniques. This allows for a feedback system that is not just tailored but is adaptively attuned to learners’ evolving self-explanation patterns. Our study was designed to address two primary research questions, as follows:
RQ1: Can a classmate’s self-explanations be presented and useful to the learner as feedback?
RQ2: Which students benefit most from using the SEAF system?

2. Related Work

2.1. Effects of Self-Explanation in Mathematics

Self-explanation requires reasoning by the learner beyond the information provided in the task, and this reasoning can focus on expert reasoning presented in worked-out examples and texts, as well as problem-solving efforts [3,10,21]. Research has shown that contrasting instructional examples and self-explanation promote student mathematics learning. Self-explanation facilitates learning through two processes. First, self-explanation aids comprehension by reducing knowledge integration [22]. Second, self-explanation aids recognition and transfer by directing attention to structural rather than superficial features of the learning object. It aids comprehension and transfer by directing attention to structural features rather than simple features of the learned content [5,23].
Self-explanation promotes conceptual and procedural knowledge by directing attention to structural rather than superficial features of intellectual content. Rattle-Johnson [2] studied the developmental relationship between conceptual and procedural knowledge in mathematics. Conceptual knowledge is knowledge about concepts that are abstract and general principles such as mathematical equivalence [24,25]. Procedural knowledge is often developed through problem-solving practices and is therefore tied to the problem [26,27]. Given this prior research, we hypothesize that a well-written self-explanation contains all knowledge concepts and procedural elements for a problem and that several good self-explanations could be processed and presented to the learner and used as feedback.

2.2. Utilization of Self-Explanation

Research has also been conducted on web-based self-explanation to streamline learning. Crippen and Earl [28] developed a web-based learning tool that engages students in an environment that supports structured problem-solving. Although self-explanation has been shown to have a unique learning effect, it faces multiple barriers, including the resource-intensive nature of providing feedback on unstructured tasks, the lack of opportunities for students to practice self-explanation writing support, and the tendency for students to disengage from self-explanation activities before mastering self-explanation description skills [11]. To address these challenges, various methods have been proposed for processing self-explanation. McNamara et al. [17] created an interactive tutoring system named start to support the development of self-explanation skills in reading. The system guides learners’ reading comprehension and thinking by automatically evaluating and scoring self-explanation and providing appropriate scaffolding, applying NLP techniques such as latent Dirichlet allocation analysis topic modeling to extract features of learners’ self-explanation artifacts and their similarity to the reading material. The results showed that the system could support self-explanation in texts from various disciplines [29]. Arne et al. [11] developed Stair Stepper, a unique self-explanation prompt and support system with self-explanation-based scaffolding and adaptive feedback. Alevin et al. [30] implemented an intelligent tutoring system that provided feedback on students’ solutions and explanations. Additionally, effective self-explanation prompts are crucial to promoting appropriate cognitive processing in learners [20], and the timing of feedback is also important for its effectiveness [31].

2.3. Consideration on Existing Intelligent Tutoring Systems

In the realm of intelligent tutoring systems (ITSs), several platforms have established a significant presence by catering to various facets of educational needs. Table 1 offers a comprehensive overview of the features and functionalities related to self-explanation across four distinguished ITS platforms: SEAF, Mathia [32,33], Assessment’s [34,35], and I-START. The table elucidates the varying degrees to which each system emphasizes self-explanation, shedding light on the nuances of their approaches. At a glance, SEAF emerges as a leader in integrating peer-based explanations, a feature relatively unexplored in other platforms. While Mathia and Assessment’s subtly incorporate self-explanation as part of their broader framework, I-START and SEAF prioritize it as a core instructional strategy.
While all platforms, including SEAF, exhibit personalization to varying extents, the depth and nature of this personalization differ. For instance, while Mathia focuses on real-time adjustments to student needs, I-START tailors its challenges based on text complexity. Notably, SEAF and Assessment’s stand out for their adaptive nature, ensuring the content and feedback are in sync with the learner’s evolving proficiency. The central focus of our analysis, self-explanation, showcases varying levels of integration across platforms. Both SEAF and I-START treat self-explanation as a core feature, with SEAF uniquely offering peer-based explanations. In contrast, Mathia and Assessment’s incorporate self-explanation more subtly, using it as a tool within a broader problem-solving context. Another distinguishing facet is the integration of peer-based learning. SEAF’s emphasis on sharing “pen strokes” and peer explanations sets it apart from its contemporaries, offering learners a unique, collaborative perspective.

2.4. Contribution of This Study

While each system has made commendable strides in enhancing educational experiences, a gap remains in holistically integrating peer-based learning with self-explanation. Traditional ITS systems, while effective in personalization, often function in isolation, sidelining the collaborative nature of learning. The absence of a robust platform that seamlessly combines personalized feedback with peer insights underscores the need for a system like SEAF.
This study, through the development and analysis of SEAF, aims to bridge the existing gaps in the ITS domain. SEAF’s unique integration of peer-based learning within the self-explanation framework introduces a fresh perspective in adaptive learning. By offering students insights into their peers’ thought processes, SEAF fosters a collaborative learning environment, challenging the traditionally siloed approach of ITS systems. Furthermore, by juxtaposing SEAF against established platforms, this study offers a comprehensive overview of the ITS landscape, highlighting the evolving needs of modern learners and the consequent adaptations required in educational technologies. In essence, the contribution of this study extends beyond the introduction of a novel system—it sets the stage for future innovations in ITS, emphasizing collaboration, adaptability, and the seamless integration of diverse educational facets.

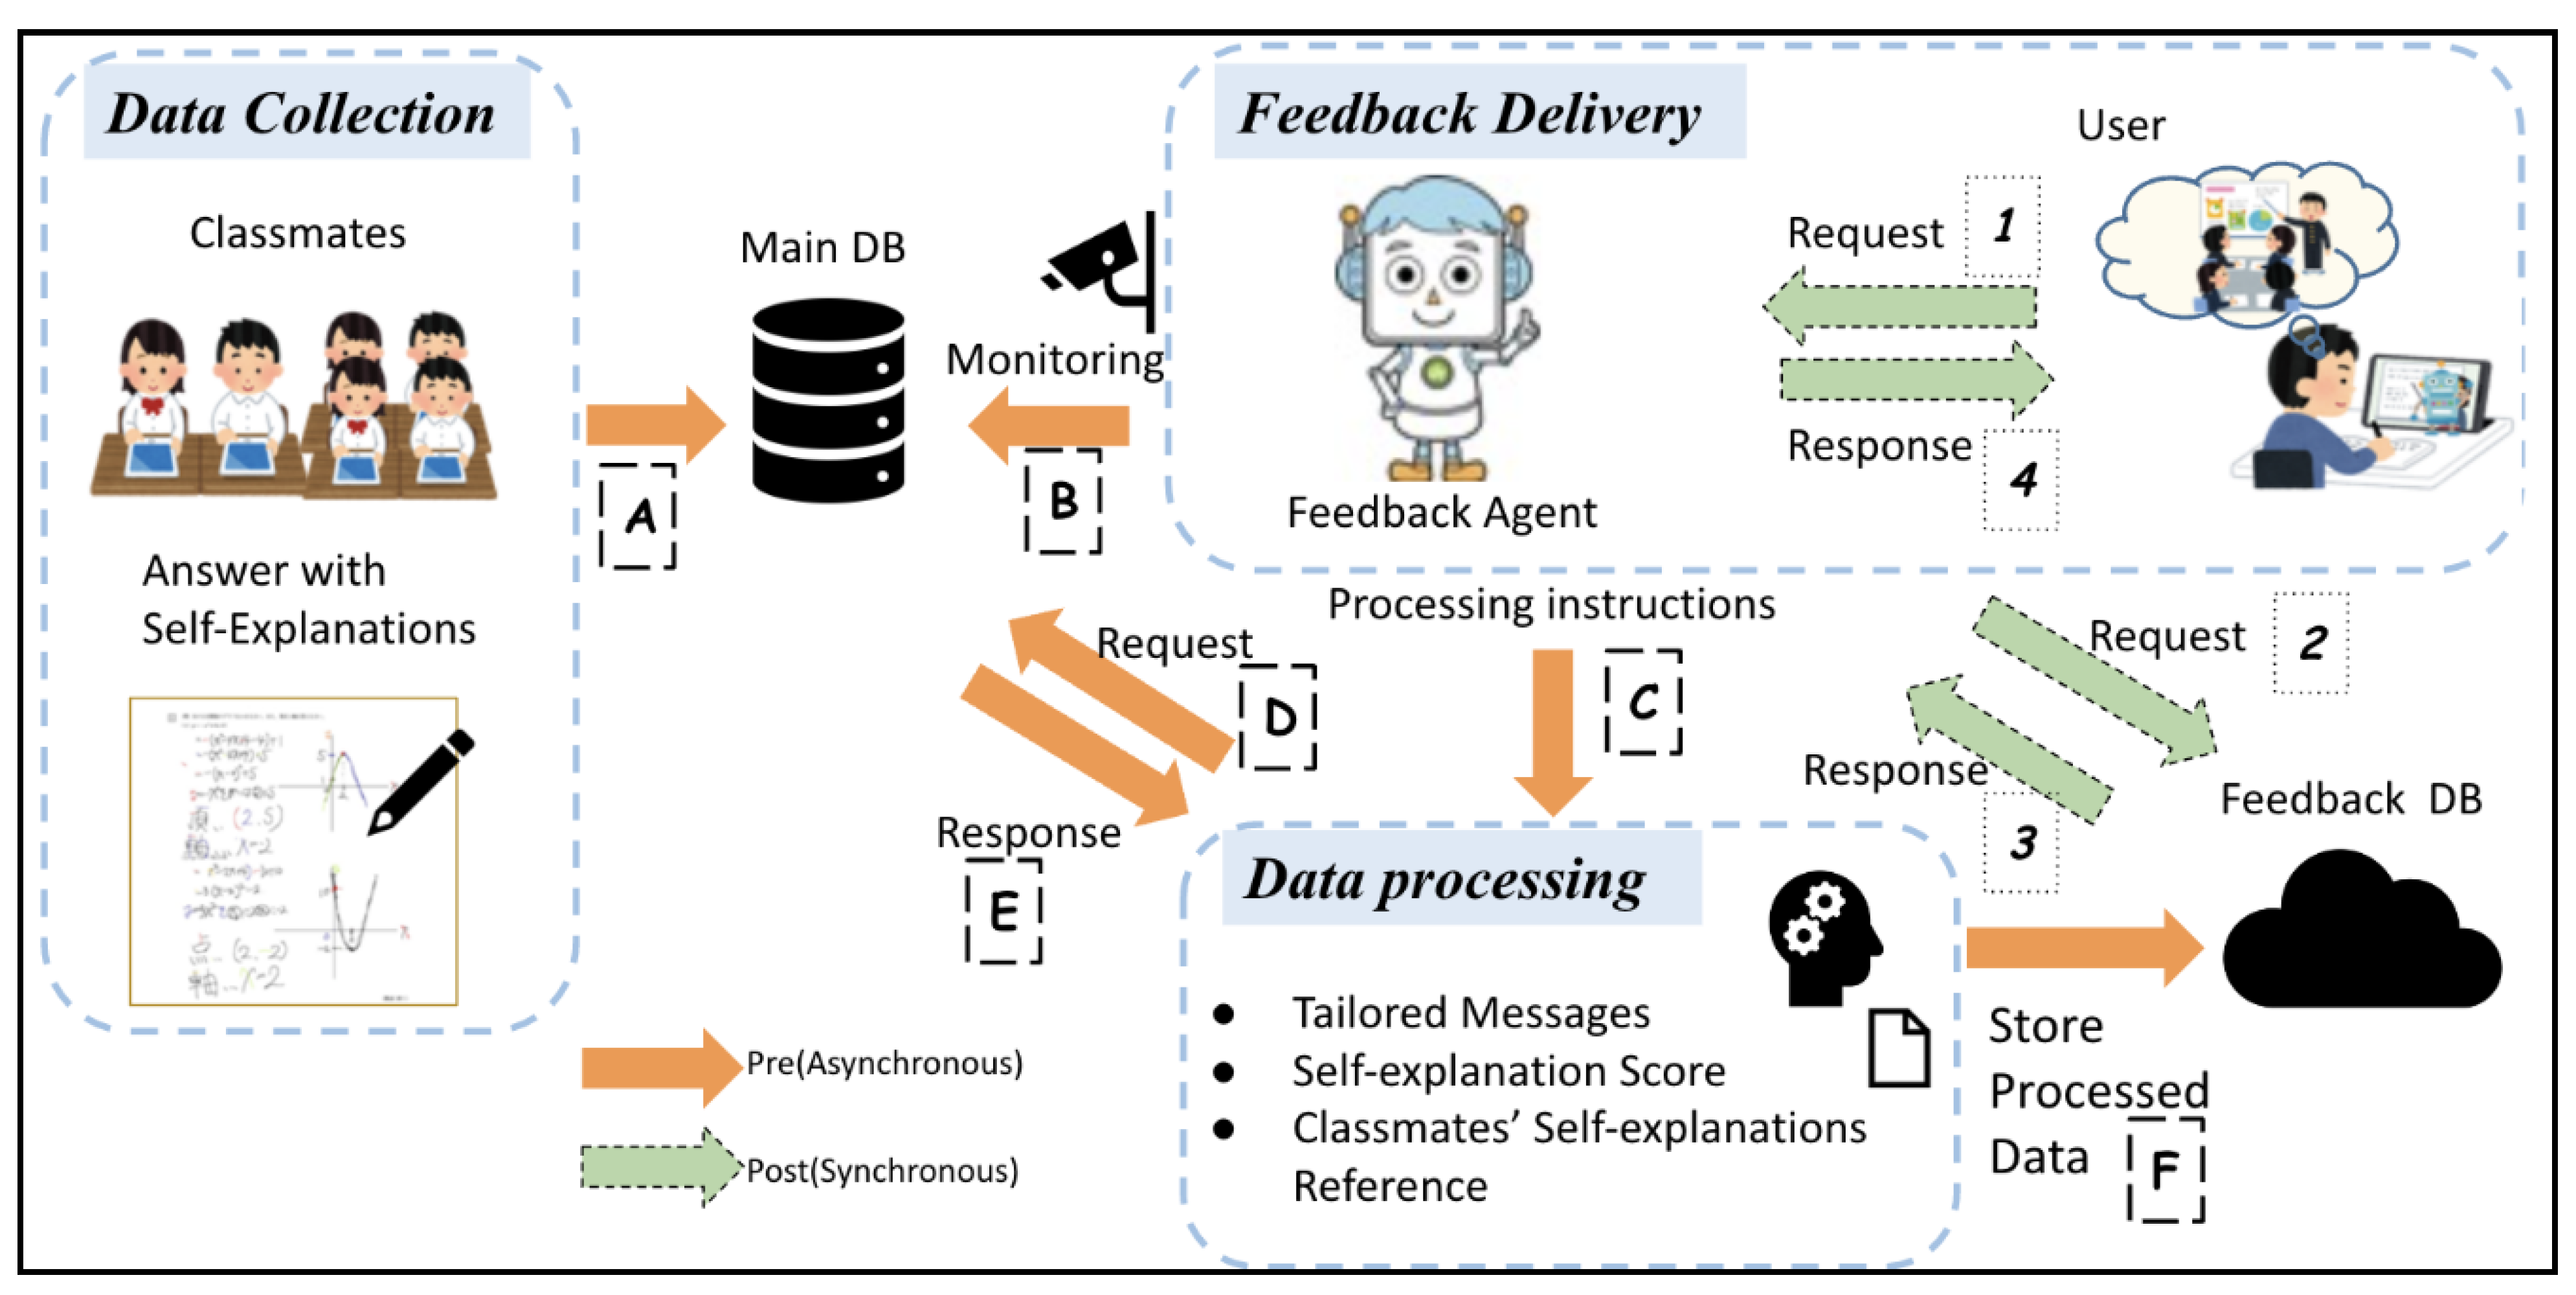
3. The Architecture of the SEAF System

The proposed system architecture consists of three main components: data collection, data processing, and feedback delivery, as shown in Figure 1. In the data collection component, self-explanations are collected into the main database using online platforms. Secondly, the feedback delivery component monitors the database and instructs the data processing component to analyze the data. The data processing component is responsible for processing the raw data collected and generating insights to inform the feedback generation process. The feedback was delivered to the learner, if requested, through an online platform, and learners can then review and reflect on the feedback in real-time as a result.

3.1. Data Collection

Self-explanations are collected from learners using online platforms, as illustrated by Node A in Figure 1. This can include various forms of math problems or questions that require a written explanation. As a system platform, we used the LEAF platform [36], which consists of a digital reading system named BookRoll and a learning analytics tool, LAViEW, where students and teachers can monitor and reflect on their learning. The platform was deployed in a Japanese secondary school and has been used for several years. BookRoll captures handwriting data as a series of vectors representing the coordinates and velocity of pen strokes, allowing realistic playback of handwritten answers and fine-grained analysis of the students’ answering process. Students were asked to view the quiz and write their answers using a stylus and tablet computer with handwriting. Figure 2 describes ① handwritten answer playback and self-explanation input. The students input a sentence of explanation every time they think they have completed some step in their answers during the playback. Therefore, the self-explanation is temporally associated with the pen stroke data. ② Self-explanation of the answer contains the following, from top to bottom: if the area of triangle ABO is one, the area of triangle AOC is four. Since the whole is 5, and straight-line OP bisects the area of triangle ABC, the area of quadrilateral ABPO and triangle POC is 2/5. The area of triangle APO:triangle POC = 3:5, so the length of straight-line AP:straight-line PC = 3:5.

3.2. Feedback Delivery

The feedback delivery component is a critical component, as it provides personalized and real-time feedback to each individual learner. The proposed architecture (Figure 1) comprises two modules: a synchronous module for sequential processing and an asynchronous module for database monitoring. The asynchronous module (Node B) monitors the database for updates and changes (Node A), triggering the preprocessing component to process the updated data (Node C). It then retrieves the updated data from the main database (Node D and E), processes it, and saves the trained weight to the feedback database (Node F). The synchronous module (Node 1) processes each user request in the order received and requests the newest trained weight from the feedback database (Nodes 2 and 3). This allows for the efficient handling of multiple requests while maintaining their order. Finally, the architecture adapts quickly to database changes and provides up-to-date feedback to learners (Node 4).

3.3. Data Processing

The SEAF system’s data processing component involves analyzing the self-explanations of learners, identifying key concepts, evaluating writing quality, and understanding learners’ thought processes (Node F in Figure 1). Its personalized feedback features use classmates’ learning processes as a reference for comparison, helping learners understand their progress and identify improvement areas [3]. Additionally, communicating strategic messages of learning in an individualized and optimized way may prevent mistakes and provide a deeper understanding [37,38]. Social cognitive theory [39,40] served as a common background for the development of the three effective learning support tools. The system’s comparative analysis of self-explanation writing promotes healthy competition and collaboration among learners [41], potentially leading to better learning outcomes.

3.3.1. Personalized Message Feature

The personalized messages feature is a tool that offers personalized feedback to each learner based on their self-explanation quality and learning progress. The system generates feedback messages automatically, using predefined templates that are partly customized to each learner’s learning logs. The feature encourages students to continue learning and improving their self-explanation writing skills by providing individualized feedback. Previous research [37,42] suggests that writing a good self-explanation will deepen students’ understanding, and taking time to learn will reduce errors and deepen learning. Figure 3 shows the process of receiving personalized feedback on their self-explanation writing. After the student submits their response, they initiate the analysis by pressing button ①. Within a span of 4 to 5 s, the AI teacher processes the input and displays the result on the screen, accompanied by message ② for confirmation. Upon reviewing the content, the student is subsequently guided to the question recommendation page indicated as ③.
The message conveyed in the SEAF at step ② is as follows: “Currently, 22 individuals have participated and provided responses. Your attempts to answer the question, culminating in a successful and accurate response, are commendable. Considering both your written response and your Student Engagement metrics, alongside the collective input from your peers in the entire class, it is apparent that you possess a robust grasp of the fundamental concepts. To further enhance your understanding, we encourage you to explore the Student Engagement of your peers and refer to the pertinent sections of the textbook to tackle related problems. In the realm of mathematics, the significance of solving numerous problems and engaging in reflective practices cannot be overstated. Cultivating the habit of analyzing your mistakes, deciphering your problem-solving strategies, and recognizing your cognitive growth pathways is crucial. It is important to acknowledge that substantial outcomes may not manifest immediately in your academic journey. Nevertheless, by diligently persisting in mastering the foundational principles, you are well on your way to achieving commendable progress. Keep up the exceptional effort”.
To craft these personalized messages, our system utilizes a rule-based algorithm that assesses a learner’s performance, their past interactions, and the specific context of their current task to determine the most pertinent feedback (Algorithm 1). For detailed insights into the functioning of this system, refer to the algorithm provided below and further elaborations in Appendix A.
Algorithm 1: Personalized Message Selection
Input: user performance data (UPD), past interactions data (PID), current task context (CTC)
 
Begin with an empty list for potential feedback: FeedbackList = []
 
Evaluate UPD for frequent errors in specific areas:
a. Retrieve relevant feedback messages associated with that area from the database.
b. Add these messages to FeedbackList.
 
Analyze PID for recurrent challenges the learner has faced:
a. Procure encouraging messages tailored to that specific challenge.
b. Incorporate these into FeedbackList.
 
In light of CTC:
a. Obtain contextual guidance messages.
b. Integrate these into FeedbackList.
 
Organize messages in FeedbackList based on a relevance score, which is calculated using a blend of UPD, PID, and CTC.
 
Present the learner with the top-ranked message from FeedbackList.
 
End algorithm
The feature also includes a missing knowledge detection module that compares the user’s self-explanation with the model answer to identify missing information, as illustrated in Figure 4. The system uses a summary model to derive the solution steps of the problem [43] and extracts missing knowledge elements from the cosine similarity [44]. It presents the missing knowledge elements to the student and advises the student to solve related problems to enhance their learning and understanding of self-explanation. The messages for each step in Figure 4 are as follows:
“The problem was tackled by many students in five distinct steps. The table below elucidates the formulas and methodologies employed in solving each step, extrapolated from the introductory statements of the entire student body. This resource can serve as a valuable reference for your forthcoming studies. It is noteworthy that the AI’s assessment did not detect any points where you encountered collective difficulties”.
“Solution and SE for Each Step: The process involves subtracting the upper triangle from the larger triangle, intersected by the plane passing through points A, H, and D. This yields the volume containing point H. 2 Step: Utilizing the three-square theorems, the area ratio between the large triangle and the trapezoid is employed to determine the area” (sample).

3.3.2. Self-Explanation Scoring Feature

Central to the SEAF system is its self-explanation scoring mechanism, offering students a rigorous, objective metric to evaluate the caliber of their self-explanation written outputs. Anchored in the self-explanation summary model proposed by Nakamoto et al. (2024) [43], SEAF conducts a thorough assessment of each self-explanation, juxtaposing it against a well-defined set of criteria. A distinguishing attribute of SEAF is its ability to deliver comparative feedback. As illustrated in Figure 5, the system enables learners to measure their scores against the collective performance of their peers, fostering a constructive competitive ethos while offering a grounded assessment of their relative position.
Feedback is structured for clarity and relevance. The initial segment of the feedback offers an overview of average writing statistics derived from the learner cohort, prompting users to enhance their submissions if they trail in terms of word count or lexical diversity. Moreover, the feedback delineates the individual’s self-explanation analysis score, placing it in context with the class’s median performance. To illustrate, accolades await those who exceed the class’s normative score, underscoring the proficiency of their self-explanation composition.
Progressing further, the SEAF feedback offers customized recommendations aligned with individual performance metrics. For instance, should a learner’s self-explanation be terser than the average cohort submission, SEAF highlights the potential merits of expanded exposition—both for elevating their score and deepening their conceptual clarity. An exemplar feedback might state:
“Your SE surpassed the class mean by 14.3 points, reflecting a commendable clarity and structure in your SE composition. Notably, while the class average for SE sentences stood at 75.0 words, your submission comprised 61 characters—19.0% more concise than the norm. It is imperative to recognize that comprehensive textual submissions often correlate with higher SE scores, indicating a richer conceptual grasp. Your steadfast dedication is palpable, and we anticipate further excellence in your forthcoming endeavors”.
This nuanced and specific feedback, augmented by a detailed exposition on our interpretation of “accuracy” within this research purview, greatly enriches the student’s interaction with the system. In this context, “accuracy” pertains to the SEAF system’s adeptness at delivering pinpointed feedback and its capacity to shape students’ academic growth, especially in refining their writing acumen. For an in-depth exploration of this system’s operation, one is directed to the ensuing algorithm description (Algorithm 2) and the comprehensive details in Appendix B.
Algorithm 2: Scatter Plot of Self-explanation Score vs. Length
Input: list of students (U = {u_1, u_2, …, u_n}), self-explanation scores (SESs), length of self-explanation (L)
Initialize an empty scatter plot: ScatterPlot = {}
 
For each student u in U:
    a. Extract the self-explanation score for student u: Score_u = SES[u]
    b. Extract the length of self-explanation for student u: Length_s = L [u]
    c. Plot point (Length_u, Score_u) on ScatterPlot with:
        I. X-axis representing Length_u
        II. Y-axis representing Score_u
 
Customize ScatterPlot:
    a. Label X-axis as “Length of Self-Explanation”
    b. Label Y-axis as “Self-Explanation Score”
    c. Add title “Scatter Plot of Length of Self-Explanation vs. Self-Explanation Score”
    d. Highlight regions of high concentration, if any, to elucidate trends
 
Display ScatterPlot for visual analysis and interpretation.
 
End

3.3.3. Classmates’ Self-Explanations Reference Feature

The SEAF system’s tertiary feature encompasses offering exemplar self-explanations pertinent to the learning trajectory. Such benchmarks guide learners in crafting their self-explanations, elucidating the components of a commendable self-explanation. Bisra et al. [3] established that while self-explanation trailed methods like reciprocal teaching, feedback, and interval learning in efficacy, its fusion with mutual teaching and feedback could bolster learning outcomes. By scrutinizing stellar self-explanation submissions from peers, learners can dissect the anatomy of an effective self-explanation, thereby enhancing their own expository skills.
Additionally, the SEAF system selects these examples based on their quality and relevance to the self-explanation writing task, which promotes collaboration and social learning. Fyfe and Rattle-Johnson [45] reported that feedback was effective in promoting learning, particularly when it was immediate. Therefore, this feature not only serves as a reference for learners to follow but also provides immediate feedback that can enhance their learning experience.
This feature provides a visual representation of similar classmates’ self-explanations and their corresponding pen strokes, as illustrated in Figure 6. Users can access two key pieces of information: ① similar self-explanation sentences related to the student’s responses and ② details about their pen strokes. By utilizing this feature, users can review and compare their own self-explanations and pen strokes with those of their classmates, allowing for a better understanding of their performance and potentially identifying areas for improvement. For detailed insights into the functioning of this system, refer to the algorithm provided below and further elaborations in Appendix C.

4. Analytical Methods and Framework for Analysis

The framework for analyzing the effectiveness of SEAF in evaluating the quality of writing self-explanations was based on a quasi-experimental design with purposeful sampling. As junior high school is a part of compulsory education in Japan, it is not ethically feasible to conduct a randomized experiment, and, instead, participants were selected purposefully. In the experiment, both groups received the treatment at the same conditions, and in the analysis, they were divided based on their usage of the SEAF system. Additionally, we divided participants into a low and a high-self-explanation-level group to identify those who could benefit the most from the feedback. Lastly, we administered a questionnaire to the high-engagement group at the conclusion of the investigation to gather additional insights.

4.1. Experiment Methodology

To comprehensively investigate the influence of SEAF on students’ self-explanation writing, the study was structured in three distinct phases: Before Experiment, Preliminary Experiment, and Actual Experiment. This structure allowed for capturing a holistic view of participants’ evolution over time, factoring in both their natural state without the aid of SEAF and their progression with consistent SEAF usage. All 50 participants, drawn from the third grade of junior high school, consistently partook in these three phases. Their participation in each phase is emphasized to ensure a continuous data trajectory for each student and facilitate a clear understanding of SEAF’s impact over time.
  • Before Experiment: This served as the baseline data acquisition period, where students wrote self-explanations without the intervention of SEAF, thereby capturing their innate self-explanation abilities.
  • Preliminary Experiment: Here, students were introduced to the SEAF tool for the first time. This phase was conducted from November 2021 to March 2022. They were directed to pen their self-explanations, checking their pen strokes, and upon completion, press a button to garner feedback on their self-explanations. This phase allowed for initial observations on SEAF’s immediate effects on self-explanation quality.
  • Actual Experiment: Extending from April 2022 to June 2022, this phase saw students’ continued use of SEAF, reinforcing the habits developed during the Preliminary Experiment and providing insights into the tool’s longer-term impact on students’ self-explanation skills. During this phase, the 49 questions were administered on a weekly basis over the course of three months to gauge the students’ understanding and evolution in self-explanation abilities.
The frequency of feedback content usage during the Actual Experiment, along with the mean frequency of writing self-explanations, are metrics in gauging student engagement and their dedication to the self-explanation tasks assigned weekly. By organizing our study in these consecutive phases, we aim to capture not only the immediate effects of SEAF on self-explanation but also its sustained impact over an extended period. This structure, coupled with the consistent participation of all 50 students across phases, offers robust insights into SEAF’s potential as a transformative educational tool.

4.2. Analysis Preparations

4.2.1. Evaluation of Self-Explanations Based on Three Principal Criteria

In our study, we assessed self-explanations with rigor, focusing on three central tenets: coherence, clarity, and relevance. “Coherence” evaluates the logical sequence of the explanation. “Clarity” measures its comprehensibility, and “relevance” ensures the capture of all vital knowledge constructs and procedural details. For a consistent evaluation, we adapted the rubric and scoring methodologies suggested by Nakamoto et al. [43], as detailed in Table 2 and Table 3. Thompson and Senk [46] have endorsed these rubrics, making them suitable for tasks with multiple solution strategies. We crafted task-specific rubrics to ensure their precision and applicability. The methodology for self-explanation evaluation follows, and the result is shown in Table 4:
  • Scoring system: two independent raters employed rubrics developed for this study to assess the self-explanations. A scale ranging from one to five was utilized for scoring.
  • Rater consistency: quadratic weighted Cohen’s kappa coefficient [47] was employed to determine the level of agreement between the raters. A coefficient value of 0.749 indicates substantial agreement.
  • Data processing: to maintain consistency in the evaluation, the mean score from both raters were used for further analysis.
  • Categorization of scores: for a clear distribution, the self-explanation scores were categorized, aiming for uniformity. Participants were divided into two groups based on average self-explanation quality scores:
  • High-self-explanation group: scores of three or above.
  • Low-self-explanation group: scores below three. This cutoff score was determined as the minimum level of knowledge or skills that can be acquired through self-explanation.
  • Criteria for quality assessment: a high-quality self-explanation should:
    (1)
    Encompass all pertinent concepts.
    (2)
    Exhibit logical structuring.
    (3)
    Use appropriate conjunctions for connecting ideas.

4.2.2. Participant Categorization Based on Engagement

To examine the influence of SEAF usage on self-explanation quality, we divided participants into low- and high-engagement groups based on feedback utilization frequency and the depth of self-explanation. Given educational constraints, a randomized experiment was not viable. Instead, we chose purposeful sampling to establish experimental groups. Engagement is pivotal to cultivating conceptual understanding, as it bridges motivation and learning [48,49]. This strategy, therefore, can be an alternative to randomized experiments when exploring the ramifications of computer-aided engagement on learning outcomes.
Out of 50 participants in the study, the provided SEAF usage metrics (mean, standard deviation, minimum, and maximum) aggregate the data from both “Preliminary” and “Actual” experiment phases. Notably, participants recorded an average SEAF usage of 14.23, a standard deviation of 13.03, and a usage range between 1 and 52 times across the two phases. Participants were bifurcated based on SEAF usage into two categories: the high-engagement group, who accessed the feedback button at least four times during the study, and the low-engagement group, who did so less often. This division was driven by the imperative for a substantial statistical analysis.

5. Results of SEAF Learning Effects Experiments

5.1. Results of Statistical Analysis Based on Self-Explanation Level

The goal of this statistical analysis was to discern significant differences in self-explanation quality between different engagement groups during the actual experiment period. We wanted to ascertain if there was a relationship between engagement level and self-explanation quality and if SEAF’s presence made a tangible difference within these groups. Table 5 presents the descriptive statistics concerning self-explanation characteristics, segmented by group and level. The “N” in the table denotes the total count of self-explanation descriptions for each respective group.
For the “High” self-explanation level, the results showed that the high-engagement group achieved a mean self-explanation quality score of M = 3.76 with a standard deviation (SD) of 1.097. This was considerably higher compared to the low-engagement group, which posted a mean of M = 3.034 and SD = 0.973. The t-test, validated with a t-value of 3.631, reinforced this difference as significant (p < 0.01). Similarly, when analyzing the “Low” self-explanation level, the high-engagement group still displayed a superior mean score of M = 2.62 and SD = 1.11. This, too, overshadowed the performance of the low-engagement group, which registered a mean of M = 2.05 and SD = 1.05. The t-value of 3.520 (p < 0.01) once again affirmed the significance of this difference.

5.2. Repeated Measures ANOVA

Since the experiment was repeated in this study, a repeated measures analysis was conducted to determine whether the SEAF was effective for each experimental treatment group. The subjects for the study were selected from those who had responded to the three-time period group, and Table 6 shows the number of subjects and their corresponding scores. N represents the number of unique users within the group. To test the null hypothesis that the means of the groups were equal during the experimental period, a nonparametric (rank-based) one-way repeated measures ANOVA, specifically the Friedman test [50,51], was performed since the observations correspond to groups that cannot be assumed to be normally distributed. The alternative hypothesis was that there was a difference in the group means during the experimental period. The results of the Friedman test with the chi-square test showed that the high-self-explanation-level group did not differ significantly from the students’ self-explanation quality based on the experimental period, χ2 (2, N = 25) = 0.375, p = 0.829. However, it was found that the low-self-explanation-level group was significantly different, χ2 (2, N = 21) = 8.77, p = 0.012, and, therefore, we reject the null hypothesis and support the alternative hypothesis. Next, Kendall’s W was calculated by comparing the ranks of each student’s self-explanation scores across the different experimental periods. A value of one indicates perfect agreement, while a value of zero indicates complete disagreement. In our study, Kendall’s W was found to be 0.337, indicating a moderate effect size or difference in self-explanation levels across the different experimental periods. From this, we conclude that the mean values of self-explanation in the self-explanation low-level group differ significantly across the experiments’ periods. To determine which experimental treatment periods were significantly different, a pairwise comparison using Conover’s post hoc test [52] was conducted. The results of multiple pairwise comparisons, as shown in Table 7 and Figure 7, indicated a statistically significant difference between the Before Experiment period and the Preliminary Experiment period, p = 0.021, with repeated treatments at different experimental periods. Therefore, it can be concluded that although the low-self-explanation group had lower initial self-explanation quality, they found the SEAF rewarding or impactful on their self-explanation writings in Preliminary Experiments.

5.3. Perception Analysis

To test user satisfaction and the learning effect of the SEAF, we conducted a survey after the actual experiments. In this case, the decision to use a four-point scale was deliberate, taking into account the Japanese cultural tendency towards central tendency and previous research on scale accuracy and reliability [53]. Research indicates that Japanese individuals tend to select the middle value on a scale when presented with ambiguous situations [54]. While our intent was to gather feedback from all participants, the responses came from the high-engagement group. This trend suggests a connection between active SEAF interaction and the willingness to provide post-experiment insights. The limited feedback from the low-engagement group hints at their possibly diminished intrinsic motivation, affecting their SEAF interaction and feedback provision. Consequently, our presented insights are largely grounded in the more active and responsive high-engagement group.
In terms of the perception analysis, Table 8 shows how learners rated the SEAF in terms of its interface, usefulness for learning, and future use. The low-self-explanation-level students were more likely to respond that the course was helpful in their studies and assisted them in their learning, with 91.7% of the low-self-explanation-level group indicating that SEAF helped their learning by answering question 4 with “Agree” or “Strongly Agree”.

6. Discussion and Limitations

6.1. RQ1. Can a Classmate’s Self-Explanations Be Presented and Useful to the Learner as Feedback?

In line with Research Question 1 (RQ1), the study explored the utility of classmates’ self-explanations as feedback within the self-explanation-based automated feedback (SEAF) system. Grounded in social cognitive theory, SEAF aims to create a sustainable learning environment through the use of reciprocal teaching and feedback [2,41]. Our analysis particularly focused on how this feedback model impacted learners with varying levels of self-explanation skills.
The results demonstrated a significant impact for the low-self-explanation group, validating that peer-generated self-explanations can be a potent form of feedback for this demographic. Notably, Conover’s post hoc test showed significant improvements for these learners between the Before Experiment and Preliminary Experiment periods. This suggests that the SEAF system is both impactful and valuable for enhancing the quality of self-explanations among students who initially struggled.
However, the high-self-explanation group did not show similar significant improvements, indicating that the system may have limitations in its applicability across all skill levels. This highlights the need for the careful curation of peer-generated self-explanations to avoid misleading or confusing learners, emphasizing that quality over quantity is crucial when selecting reference self-explanations. To sum up, the study supports SEAF’s hypothesis that classmates’ well-crafted self-explanations can serve as effective feedback, particularly for learners who are less adept at self-explanation. Future iterations of the SEAF system should focus on fine-tuning the reference selection process to make this form of peer feedback universally effective.

6.2. RQ2. Which Students Benefit Most from Using the SEAF System?

The results showed that the SEAF was more effective for students with low levels of self-explanation, suggesting that learners with low self-explanation skills may need more support than learners with high self-explanation skills. One possible explanation for this result is that the SEAF helped these students because they may have had difficulty writing self-explanations without prior strategies or training. This finding is consistent with previous research suggesting that learners with low prior knowledge may need more guidance and support than learners with high prior knowledge [11].
Furthermore, many respondents indicated that the low-self-explanation-level group was more useful the perceptual analysis in Table 8, suggesting that the SEAF may have been a useful learning tool for learners who could not self-explain. Conversely, question No. 2 suggests that self-explanation is also an effective strategy for students who already possess high self-explanation skills. Students who are accustomed to problem-solving through self-explanation may compare their self-explanations with others and effectively articulate the benefits they derive from the SEAF system.
Additionally, the results of the repeated measures analysis demonstrated a significant difference in self-explanation quality between the Before Experiment period and the Preliminary Experiment period for the low-self-explanation group. The study suggests that the initial experience with the SEAF system may have a significant impact on its effectiveness. Participants exhibited positive responses and improvements in their self-explanation quality during the preliminary experiment, likely due to the novelty of the system. However, over time, as users became more familiar with the system, the impact diminished in the actual experiment. The Preliminary and Actual Experiments were conducted over a period of 4 months and 3 months, respectively. To enhance the system’s effectiveness, it may be necessary to determine an appropriate duration for the experiment and introduce new stimuli when participants become accustomed to the intervention.
Finally, since this was purposeful sampling, more detailed experiments are needed even if the results are significant. In particular, given previous research [49] that has linked engagement to learning, it is possible that students who are more motivated to learn and have a more positive attitude actually embraced the SEAF technology and used it more frequently, resulting in higher quality self-explanations. Further research is needed on the mechanism of frequent use by all and on the display and messaging methods of feedback according to learning motivation and personality.

6.3. Limitations

Our research highlights SEAF's contributions in promoting self-explanatory learning; however, several limitations should be noted:
  • Sample Size: The study involved a sample size of 50 participants, which, while providing valuable insights, may not be sufficiently large to establish the full effectiveness of SEAF. Future research endeavors should include larger samples and additional experiments to enhance the robustness of our findings.
  • SEAF's Adaptability: It's important to acknowledge that SEAF may not be universally suitable for every student. Future efforts should focus on enhancing the flexibility and personalization of SEAF to cater to a broader range of learning styles and preferences.
  • Quality of Explanations: The success of SEAF hinges on the consistency and quality of self-explanations provided by students. Improving the quality of these self-explanations is of paramount importance. Consideration could be given to implementing incentive mechanisms, such as rewards, to encourage students to generate top-notch self-explanations.
  • Feedback Representation: While we actively sought feedback from all participants, it's noteworthy that the majority of feedback came from the high-engagement group. This emphasizes the intricate relationship between motivation and effective self-explanation. The limited response from the less-engaged group underscores the challenges of simultaneously evaluating motivation and learning. Further research should explore strategies to engage all participants effectively in the feedback process.
By addressing these challenges and limitations, we can refine the role of SEAF in mathematics education, ultimately improving its effectiveness and applicability.

6.4. Conclusions

The SEAF system, emphasizing self-explanation, seamlessly aligns with the core objectives of sustainable education. By promoting introspective learning, it equips students with skills that transcend specific subjects, enabling them to continuously adapt and absorb new knowledge throughout their lives. Moreover, SEAF’s utilization of diverse peer-generated explanations supports a personalized learning approach, reflecting the real-world multiplicity of perspectives. This not only fosters respect for varied approaches but also underscores the essence of sustainable education: that diverse pathways can lead to profound understanding.

Author Contributions

R.N., B.F., T.Y., Y.D., K.T. and H.O. contributed to the research conceptualization and methodology; Data collection was performed by R.N.; R.N. analyzed the data and wrote the manuscript; B.F., Y.D., K.T. and H.O. provided comments to improve the manuscript. All authors have read and agreed to the published version of the manuscript.

Funding

This work was partly supported by New Energy and Industrial Technology Development Organization: JPNP20006; Japan Society for the Promotion of Science: (B) JP20H01722 and JP23H01001, (Exploratory) JP21K19824, (Early Career) JP23K17012, (A) JP23H00505.

Institutional Review Board Statement

As this study involves the use of student data, we acknowledge the importance of obtaining approval from the Institutional Review Board (IRB). We have taken the necessary steps to ensure compliance with ethical guidelines, and the study has been submitted to and approved by the IRB. Consent for using the students’ data in our research is obtained from their guardians at the beginning of each academic year. We provide detailed information about the purpose of data collection, how it will be used, and the measures taken to ensure confidentiality and privacy. The guardians have the right to decline consent or withdraw their consent at any time without any negative consequences for the students.

Informed Consent Statement

As this study involves the use of student data, we acknowledge the importance of obtaining approval from the Institutional Review Board (IRB). We have taken the necessary steps to ensure compliance with ethical guidelines, and the study has been submitted to and approved by the IRB. Consent for using the students' data in our research is obtained from their guardians at the beginning of each academic year. We provide detailed information about the purpose of data collection, how it will be used, and the measures taken to ensure confidentiality and privacy. The guardians have the right to decline consent or withdraw their consent at any time without any negative consequences for the students.

Data Availability Statement

The data of this study are not open to the public due to participant privacy.

Acknowledgments

We used ChatGPT for the English proofreading of this paper and this fact has been explicitly mentioned for transparency.

Conflicts of Interest

The authors declare no conflict of interest.

Abbreviations

BERTBidirectional encoder representations from transformers
NLPNatural language processing
SEAFSelf-explanation automated feedback

Appendix A. Generating Personalized Messages

To generate the personalized messages feature, we use a combination of NLP techniques and predefined templates which are customized based on each learner’s learning logs. We begin by creating a model answer text from the collected data, which is then vectorized using the BERT Japanese pretrained model which has been shown to be effective in many NLP tasks [55]. These summarization sentences form the overall summary of the answer texts. BERT(a) represents the distributed representation obtained by applying the BERT algorithm to the text input a. We created a set of vectors V from a set of student answer texts A = { a 1 ,   a 2 ,   ,   a n } , where n represents the total number of students’ answer texts.
V = { v 1 , v 2 ,   , v n } , v i = B E R T ( a i )
We then perform k-means clustering on the vector set V to obtain k clusters. Each cluster c i = { v i 1 , v i 2 ,   , v i m i } consists of m i vector representations of answer texts, where mi represents the total number of answer texts in the i -th cluster, and 1 i k .
C = { c 1 , c 2 ,   , c k } , c i = { v i 1 , v i 2 ,   , v i m i }
For each cluster c i , we used the LexRank algorithm [56] to extract the most representative sentences from each cluster. LexRank is a graph-based method that represents sentences in a graph structure and creates a summary by analyzing the relationships between the nodes that represent each sentence or word. The set of summarization sentences S constitutes the overall summary of the answer texts. LexRank(c) represents the extracted sentences obtained by applying the LexRank algorithm to the cluster c.
S = { s 1 , s 2 ,   , s k } , s i = L e x R a n k ( c i )
For step 2, we compare the answer summary with the user’s response, taking into account the stroke data associated with each sentence vector. We use this stroke data to determine which self-explanation moments take longer and where the pen stops, and then add this information to the comparison. We denote the set of model answer texts as A = { a 1 ,   a 2 ,   ,   a n } , and the user’s response text as u . We first obtain their vector representations using BERT:
V A = { v a 1 , v a 2 ,   , v a n }
where v a 1 describes the vector representation of each answer text in the set A, and v u   = BERT(u). In addition, V A represents the set of vector representations of the model answer texts. We then create a feature vector for each sentence in A and u by incorporating stroke data s t r o k e A , i ,   s t r o k e u and timing information t i m i n g A , i , t i m i n g u , where s t r o k e A , i and s t r o k e u represent the stroke data associated with the sentence in A and u, respectively, and t i m i n g A , i   and t i m i n g u represent the timing information associated with the i-th sentence in A and u, respectively.
For step 3, after extracting the self-explanations, stroke, and timing feature vectors, we utilize them to train a random forest classification model. This model is used to predict the overall feature, which indicates whether the user’s response is correct or incorrect.

Appendix B. Analyzing Self-Explanation Score

The SEAF system compares the student’s self-explanation with the model answer, which has been demonstrated in Appendix A, and assigns a score based on a set of predefined criteria. Let u represent the textual input provided by the user and s represent a summarization sentence. The score is computed using the ensuing formula, wherein erf denotes the error function, and μ and σ are the mean and standard deviation, respectively, of a normal distribution having a mean of 50:
erf x = 2 π 0 π e t 2 d t
s c o r e ( u , s ) = 50 + 50 e r f ( ( s i m ( u , s ) μ ) / 2 σ )
where sim ( x ,   y ) = ( x · y )   /   ( | | x | |   | | y | | ) represents the cosine similarity between vectors x and y. To provide a more accurate assessment of the quality of the writing, the SEAF system adjusts the score based on the length of the student’s self-explanation. The adjusted score (AS) is calculated using the following formula:
A S = S   ( L < 50 ) 1.05 S   ( 50 L < 60 ) 1.1 S   ( 60 L < 80 ) 1.2 S   ( 80 L < 100 ) 1.3 S   ( 100 L )
where S is the similarity score between the student’s self-explanation and the model answer, and L is the length of the self-explanation. This adjustment is made to encourage students to provide more specific explanations by requiring longer self-explanations and because individuals who provide longer self-explanations tend to receive higher scores according to the distributions of collected dataset.

Appendix C. Extracting Example Sentences

The system uses a cosine similarity algorithm to calculate the similarity score between the student’s self-explanation and the model answer. Firstly, as a preprocessing step, we built a text regression model that predicts one to five points, inferred with the text regression model with collected data, and used only data above a threshold value. Secondly, for a given user input in the form of a Japanese sentence, the sentence is vectorized using BERT to obtain a d-dimensional vector representation. The cosine similarity between this vector and all vectors in each cluster is then calculated. The response closest to the user’s sentence is chosen as the sentence corresponding to the cluster with the highest cosine similarity value. S = { s 1 ,   s 2 ,   ,   s i ,   ,   s n } is the set of all Japanese sentences, where si represents the i-th sentence and n is the total number of sentences. Using BERT, each sentence si is vectorized into a d-dimensional vector xi. The set of all vectors is represented as X = { x 1 ,   x 2 ,   ,   x i ,   ,   x n } , where xi represents the vector representation of si.
The system then uses a clustering algorithm to suggest high-quality self-explanation examples to each student based on their previous writing and learning progress. Using k-means clustering, the vectors in X are partitioned into k clusters, where k is a predetermined number of clusters. We let the resulting clusters be represented as   C 1 ,   C 2 ,   ,   C k . For a given user’s Japanese sentence u, which is also vectorized using BERT to form vector x u , we calculated the cosine similarity between x u and each vector v i j     c i as follows:
s i m ( u , C i ) = m a x 1 j m i s i m ( x u , v i j )
Finally, the response closest to the user’s sentence is chosen as the sentence corresponding to the cluster with the highest cosine similarity value:
r e s p o n s e ( u ) = a r g m a x C i ( i = 1 , 2 ,   , k ) s i m ( u , C i )
where argmax represents C i with the index I of the maximum value in the set. To ensure the privacy and anonymity of the student users, the system employs data masking techniques.

References

  1. Hattie, J.; Biggs, J.; Purdie, N. Effects of learning skills interventions on student learning: A meta-analysis. Rev. Educ. Res. 1996, 66, 99–136. [Google Scholar] [CrossRef]
  2. Rattle-Johnson, B. Developing Mathematics Knowledge. Child Dev. Perspect. 2017, 11, 184–190. [Google Scholar] [CrossRef]
  3. Bisra, K.; Liu, Q.; Nesbit, J.C.; Salimi, F.; Winne, P.H. Inducing Self-Explanation: A Meta-Analysis. Educ. Psychol. Rev. 2018, 30, 703–725. [Google Scholar] [CrossRef]
  4. Chi, M.T.H.; Bassok, M.; Lewis, M.W.; Reimann, P.; Glaser, R. Self-explanations: How students study and use examples in learning to solve problems. Cogn. Sci. 1989, 13, 145–182. [Google Scholar]
  5. Rattle-Johnson, B. Promoting transfer: Effects of self-explanation and direct instruction. Child Dev. 2006, 77, 1–15. [Google Scholar] [CrossRef] [PubMed]
  6. Chi, M.; Leeuw, N.; Chiu, M.; Lavancher, C. Eliciting self-explanations improves understanding. Cogn. Sci. 1994, 18, 439–477. [Google Scholar]
  7. Renkl, A. Learning from worked-out examples: A study on individual differences. Cogn. Sci. 1997, 21, 1–29. [Google Scholar]
  8. Berthold, K.; Eysink, T.H.; Renkl, A. Assisting self-explanation prompts are more effective than open prompts when learning with multiple representations. Instr. Sci. 2009, 37, 345–363. [Google Scholar] [CrossRef]
  9. Berthold, K.; Renkl, A. Instructional aids to support a conceptual understanding of multiple representations. J. Educ. Psychol. 2009, 101, 70. [Google Scholar] [CrossRef]
  10. Rattle-Johnson, B.; Loehr, A.M.; Durkin, K. Promoting self-explanation to improve mathematics learning: A meta-analysis and instructional design principles. ZDM 2017, 49, 599–611. [Google Scholar] [CrossRef]
  11. Arne, T.; McCarthy, K.; McNamara, D. Start Stair Stepper—Using Comprehension Strategy Training to Game the Test. Computers 2021, 10, 48. [Google Scholar] [CrossRef]
  12. Hattie, J. Visible Learning: A Synthesis of 800+ Meta-Analyses on Achievement; Routledge: Abingdon, UK, 2009. [Google Scholar]
  13. Colglazier, W. Sustainable development agenda: 2030. Science 2015, 349, 1048–1050. [Google Scholar] [CrossRef] [PubMed]
  14. Lu, V.N.; Wirtz, J.; Kunz, W.H.; Paluch, S.; Gruber, T.; Martins, A.; Patterson, P.G. Service robots, customers, and service em-ployees: What can we learn from the academic literature and where are the gaps? J. Serv. Theory Pract. 2020, 30, 361–391. [Google Scholar] [CrossRef]
  15. Hwang, G.J.; Xie, H.; Wah, B.W.; Gašević, D. Vision, challenges, roles and research issues of Artificial Intelligence in Education. Comput. Educ. Artif. Intell. 2020, 1, 100001. [Google Scholar] [CrossRef]
  16. Su, P.Y.; Zhao, Z.Y.; Shao, Q.G.; Lin, P.Y.; Li, Z. The Construction of an Evaluation Index System for Assistive Teaching Robots Aimed at Sustainable Learning. Sustainability 2023, 15, 13196. [Google Scholar] [CrossRef]
  17. McNamara, D.S.; Levinstein, I.B.; Boonthum, C. start: Interactive strategy training for active reading and thinking. Behav. Res. Methods Instrum. Comput. 2004, 36, 222–233. [Google Scholar] [CrossRef] [PubMed]
  18. Boonthum, C.; Levinstein, I.B.; McNamara, D.S. Evaluating Self-Explanations in start: Word Matching, Latent Semantic Analysis, and Topic Models. In Natural Language Processing and Text Mining; Kao, A., Poteet, S.R., Eds.; Springer: London, UK, 2007. [Google Scholar] [CrossRef]
  19. Levinstein, I.B.; Boonthum, C.; Pillarisetti, S.P.; Bell, C.; McNamara, D.S. start 2: Improvements for efficiency and effectiveness. Behav. Res. Methods 2007, 39, 224–232. [Google Scholar] [CrossRef]
  20. O’Neil, H.F.; Chung, G.K.W.K.; Kerr, D.; Vendlinski, T.P.; Buschang, R.E.; Mayer, R.E. Adding self-explanation prompts to an educational computer game. Comput. Hum. Behav. 2014, 30, 23–28. [Google Scholar] [CrossRef]
  21. Renkl, A. Learning from worked-examples in mathematics: Students relate procedures to principles. ZDM 2017, 49, 571–584. [Google Scholar] [CrossRef]
  22. Chi, M.T.H. Self-Explaining: The Dual Processes of Generating Inference and Repairing Mental Models Advances in Instructional Psychology: Educational Design and Cognitive Science; Erlbaum: Mahwah, NJ, USA, 2000; Volume 5, pp. 161–238. [Google Scholar]
  23. McEldoon, K.L.; Durkin, K.L.; Rattle-Johnson, B. Is self-explanation worth the time? A comparison to additional practice. Br. J. Educ. Psychol. 2013, 83, 615–632. [Google Scholar] [CrossRef]
  24. Rattle-Johnson, B.; Schneider, M. Developing Conceptual and Procedural Knowledge of Mathematics; Cohen Kadosh, R., Dowker, A., Eds.; Oxford University Press: Oxford, UK, 2015. [Google Scholar]
  25. Rattle-Johnson, B.; Schneider, M.; Star, J.R. Not a one-way street: Bidirectional relations between procedural and conceptual knowledge of mathematics. Educ. Psychol. Rev. 2015, 27, 587–597. [Google Scholar] [CrossRef]
  26. Rattle-Johnson, B.; Siegler, R.S.; Alibali, M.W. Developing conceptual understanding and procedural skill in mathematics: An iterative process. J. Educ. Psychol. 2001, 93, 346–362. [Google Scholar] [CrossRef]
  27. Star, J.R. Reconceptualizing procedural knowledge. J. Res. Math. Educ. 2005, 36, 404–411. [Google Scholar]
  28. Crippen, K.J.; Earl, B.L. The impact of web-based worked examples and self-explanation on performance, problem solving, and self-efficacy. Comput. Educ. 2007, 49, 809–821. [Google Scholar] [CrossRef]
  29. Jackson, G.T.; Guess, R.H.; McNamara, D.S. Assessing cognitively complex strategy use in an untrained domain. Top. Cogn. Sci. 2010, 2, 127–137. [Google Scholar] [CrossRef] [PubMed]
  30. Alevin, V.; Ogan, A.; Popescu, O.; Torrey, C.; Koedinger, K. Evaluating the effectiveness of a tutorial dialogue system for self-explanation. In Intelligent Tutoring Systems, Proceedings of the 7th International Conference, ITS, Alagoas, Brazil, 30 August–3 September 2004; Proceedings 7; Springer: Berlin/Heidelberg, Germany, 2004; pp. 443–454. [Google Scholar] [CrossRef]
  31. Fyfe, E.R.; Rattle-Johnson, B. Feedback both helps and hinders learning: The causal role of prior knowledge. J. Educ. Psychol. 2016, 108, 82–97. [Google Scholar] [CrossRef]
  32. Ritter, S.; Anderson, J.R.; Koedinger, K.R.; Corbett, A. Cognitive Tutor: Applied research in mathematics education. Psychon. Bull. Rev. 2007, 14, 249–255. [Google Scholar] [CrossRef] [PubMed]
  33. Carnegie Learning. Why CL: Research. 2023. Available online: https://www.carnegielearning.com/why-cl/research/ (accessed on 2 September 2023).
  34. Heffernan, N.T.; Heffernan, C. The Assessment’s Ecosystem: Building a Platform that Brings Scientists and Teachers Together for Minimally Invasive Research on Human Learning and Teaching. Int. J. Artif. Intell. Educ. 2014, 24, 470–497. [Google Scholar] [CrossRef]
  35. Assessment’s. 2023. Available online: https://new.assistments.org/ (accessed on 2 September 2023).
  36. Flanagan, B.; Ogata, H. Learning Analytics Platform in Higher Education in Japan. Knowl. Manag. E-Learn. (KMEL) 2018, 10, 469–484. [Google Scholar]
  37. Dodeen, H. Teaching test-taking strategies: Importance and techniques. Psychol. Res. 2015, 5, 108–113. [Google Scholar]
  38. Hong, E.; Sas, M.; Sas, J.C. Test-taking strategies of high and low mathematics achievers. J. Educ. Res. 2006, 99, 144–155. [Google Scholar] [CrossRef]
  39. Bandura, A. ; National Inst of Mental Health. Social Foundations of Thought and Action: A Social Cognitive Theory; Prentice-Hall, Inc.: Upper Saddle River, NJ, USA, 1986. [Google Scholar]
  40. Schunk, D.H.; Pajares, F. Competence Perceptions and Academic Functioning. In Handbook of Competence and Motivation; Elliot, A.J., Dweck, C.S., Eds.; Guilford Publications: New York, NY, USA, 2005; pp. 85–104. [Google Scholar]
  41. Hall, S.; Vance, E.A. Improving Self-Efficacy in Statistics: Role of Self-Explanation & Feedback. J. Stat. Educ. 2010, 18, 3. [Google Scholar] [CrossRef]
  42. Takallou, F.; Vahdany, F.; Araghi, S.M.; Tabrizi, A.R.N. The effect of test taking strategy instruction on Iranian high school students’ performance on English section of the University entrance examination and their attitude towards using these strategies. Int. J. Appl. Linguist. Engl. Lit. 2015, 4, 119–129. [Google Scholar]
  43. Nakamoto, R.; Flanagan, B.; Takam, K.; Dai, Y.; Ogata, H. Identifying Students’ Missing Knowledge s Using Self-Explanations and Pen Stroke Data in a Mathematics Quiz. ICCE 2021, 2021, 22–26. [Google Scholar]
  44. Nakamoto, R.; Flanagan, B.; Dai, Y.; Takami, K.; Ogata, H. Unsupervised techniques for generating a standard sample self-explanation answer with knowledge components in a math quiz. Res. Pract. Technol. Enhanc. Learn. 2024, 19, 016. [Google Scholar] [CrossRef]
  45. Fyfe, E.R.; Rattle-Johnson, B. The benefits of computer-generated feedback for mathematics problem solving. J. Exp. Child Psychol. 2016, 147, 140–151. [Google Scholar] [CrossRef] [PubMed]
  46. Thompson, D.R.; Senk, S.L. Using rubrics in high school mathematics courses. Math. Teach. Learn. Teach. PK-12 1998, 91, 786–793. [Google Scholar] [CrossRef]
  47. Cohen, J. A Coefficient of Agreement for Nominal Scales. Educ. Psychol. Meas. 1960, 20, 37–46. [Google Scholar] [CrossRef]
  48. Blumenfeld, P.; Kempler, T.M.; Krajcik, J.S. The Cambridge Handbook of the Learning Sciences: Motivation and Cognitive Engagement in Learning Environments; Cambridge University Press: Cambridge, UK, 2005. [Google Scholar]
  49. Sinha, S.; Rogat, T.K.; Adams-Wiggins, K.R.; Hmelo-Silver, C.E. Collaborative group engagement in a computer-supported inquiry learning environment. Int. J. Comput.-Support. Collab. Learn. 2015, 10, 273–307. [Google Scholar] [CrossRef]
  50. Friedman, M. The Use of Ranks to Avoid the Assumption of Normality Implicit in the Analysis of Variance. J. Am. Stat. Assoc. 1937, 32, 675–701. [Google Scholar] [CrossRef]
  51. Marozzi, M. Testing for concordance between several criteria. J. Stat. Comput. Simul. 2014, 84, 1843–1850. [Google Scholar] [CrossRef]
  52. Conover, W.J.; Iman, R.L. Multiple-Comparisons Procedures. Informal Report; Los Alamos National Lab.: Los Alamos, NM, USA, 1979. [Google Scholar] [CrossRef]
  53. Tasaki, K.; Shin, J. Japanese response bias: Cross-level and cross-national comparisons on response styles. Shinrigaku Kenkyu Jpn. J. Psychol. 2017, 88, 32–42. [Google Scholar] [CrossRef]
  54. Chen, C.; Lee, S.; Stevenson, H.W. Response Style and Cross-Cultural Comparisons of Rating Scales Among East Asian and North American Students. Psychol. Sci. 1995, 6, 170–175. [Google Scholar] [CrossRef]
  55. Suzuki, M. Pretrained Japanese BERT Models, GitHub Repository. 2019. Available online: https://github.com/cl-tohoku/bert-japanese (accessed on 2 April 2021).
  56. Erkan, G.; Radev, D. LexRank: Graph-based Lexical Centrality as Salience in Text Summarization. J. Artif. Intell. Res.-JAIR 2011, 22, 457–479. [Google Scholar] [CrossRef]
Figure 1. The architecture of the SEAF system.
Sustainability 15 15577 g001
Figure 2. The user interface of LEAF System.
Sustainability 15 15577 g002
Figure 3. Personalized messages.
Sustainability 15 15577 g003
Figure 4. Missing knowledge detection.
Sustainability 15 15577 g004
Figure 5. The scatter plot for the self-explanation analysis score.
Sustainability 15 15577 g005
Figure 6. Reference examples of classmates’ self-explanation.
Sustainability 15 15577 g006
Figure 7. Distribution of self-explanation quality means in each experimental period group.
Sustainability 15 15577 g007
Table 1. Comparative analysis of self-explanation features in prominent intelligent tutoring systems.
Feature/AspectSEAF (Ours)MathiaAssessment’sI-START
Main focus areaMathematicsMathematicsMathematicsReading comprehension
PersonalizationYes, personalized messageReal-time adjustmentsAdaptive learningAdaptive to text complexity
Feedback mechanismPeer-based explanationsImmediate, step-by-stepHints and immediate feedbackImmediate on self-explanations
Self-explanation emphasisHigh (core feature)Moderate (within problem-solving context)Moderate (user responses to hints/questions)High (core training)
Peer-based learningYes (pen strokes, explanations)NoCollaborative problem-solving (in some cases)No
Real-world applicationNot specifiedContextual word problemsReal-world problem setsComplex real-world texts
CustomizabilityHigh (based on users’ data)Not specifiedYes (teacher-customizable content)Not specified
Table 2. Rubrics and a sample answer of self-explanation in a quiz.
NumberRubricSample Answer of Self-Explanations
Step 1Be able to find the equation of a linear function from two points.Substituting the y-coordinate of p into the equation of the line AC.
Step 2Be able to find the equation of the line that bisects the area of a triangle.Find the area of triangle ABC, then find the area of triangle OPC.
Step 3Be able to represent a point on a straight-line using letters (P-coordinates).With the line OC as the base, find the y-coordinate of p, which is the height. P’s coordinate is (t, −1/2t + 4).
Step 4Be able to represent a point on a straight-line using letters (Q-coordinate).Since the coordinates of P are (3.5/2), the line OP is y = ⅚x, and the coordinates of Q are (t, 5/6).
Step 5Be able to formulate an equation for area based on relationships among figures.Finally, the area of ΔQAC was found from ΔAQO and ΔOQC, and the coordinates of Q were found.
Table 3. Score grading definitions.
Graded ScoreDescription
1 (unacceptable)The number of steps for which self-explanation is filled in for the steps required for the solution is minimal, and there were problematic expressions in the students’ self-explanation (e.g., mistaken patterns, boredom).
2 (poor)Self-explanations are mainly provided for the steps required for the solution. Still, they are more like bullet points than explanations.
3 (fair)Self-explanations are mainly provided for the steps required for the answer—the average self-explanation level among all respondents.
4 (very good)Self-explanations are provided for most of the steps required for the answer, but there is room for improvement as an explanation (logic, expressions).
5 (excellent)Self-explanations are mainly provided for the steps required for the answer, and the explanation is logical and well-written.
Table 4. Descriptive statistics of collected self-explanations.
PeriodDurationMonthsNum of QuizzesTotal
Self-Explanation
Answers
Unique
Users
Sentence Length
M (SD)
Quality
Score
M (SD)
Before
experiment
January 2021
to
October 2021
7207904870.6 (59.2)3.08 (1.36)
Preliminary
experiment
November 2021
to
February 2022
4132574872.4 (54.4)3.15 (1.17)
Actual
experiment
April 2022
to
June 2022
3164275083.7 (62.0)3.08 (1.28)
Table 5. Descriptive statistics of self-explanation features by group and level.
Self-Explanation Level Low-Engagement Group
(N = 18)
High-Engagement Group
N = 28
Welch’s t-Test
NSelf-Explanation
Answers
MSDNSelf-Explanation
Answers
MSDDFt
High9293.0340.973161983.761.09738.93.631 ***
Low9692.051.05121312.621.11144.63.520 ***
Note: *** p < 0.01.
Table 6. The Friedman test results with repeated treatments at different experimental periods.
Self-Explanation
Level
EngagementM(SD)Statistics
NT1T2T3DFWχ2
HighHigh160.852 (0.43)0.827 (0.56)0.779 (0.70)20.01520.375
Low90.653 (0.42)0.351 (0.68)0.451 (0.54)---
LowHigh120.069 (0.45)0.329 (0.50)0.153 (0.28)20.3378.77 **
Low9−0.193 (0.51)0.167 (0.55)−0.110 (0.48)---
Note. T1: Before Experiment, T2: Preliminary Experiments, T3: Actual Experiment. ** p < 0.05.
Table 7. The result of Conover’s post hoc test (p-values).
Experimental PeriodT1T2T3
T1-0.0210.251
T2--0.135
Note. T1: Before Experiment, T2: Preliminary Experiments, T3: Actual Experiment.
Table 8. Results of the SEAF usage survey.
No.QuestionSelf-Explanation LevelNM(SD)
1Did you try your best to write a good self-explanation after receiving AI advice?Low122.92 (0.76)
High152.93 (0.85)
2Were you able to clarify your weak points and missing knowledge by reading classmates’ self-explanations?Low122.83 (0.90)
High153.07 (0.85)
3Was the feedback you received helpful for your study (e.g., did it help you to solve problems, learn new solutions, etc.)?Low123.00 (0.41)
High152.87 (0.81)
4Do you think the feedback feature is useful for learning?Low123.08 (0.49)
High152.93 (0.85)
Disclaimer/Publisher’s Note: The statements, opinions and data contained in all publications are solely those of the individual author(s) and contributor(s) and not of MDPI and/or the editor(s). MDPI and/or the editor(s) disclaim responsibility for any injury to people or property resulting from any ideas, methods, instructions or products referred to in the content.

