Article

Study on the Stability and Seepage Characteristics of Underwater Shield Tunnels under High Water Pressure Seepage

1
Key Laboratory of In-Situ Property-Improving Mining of Ministry of Education, Taiyuan University of Technology, Taiyuan 030024, China
2
Department of Mining Engineering, Taiyuan University of Technology, Taiyuan 030024, China
3
College of Water Science and Engineering, Taiyuan University of Technology, Taiyuan 030024, China
*
Author to whom correspondence should be addressed.
Sustainability 2023, 15(21), 15581; https://doi.org/10.3390/su152115581
Submission received: 13 September 2023 / Revised: 12 October 2023 / Accepted: 30 October 2023 / Published: 2 November 2023

Abstract

:
The construction of underwater shield tunnels under high water pressure conditions and seepage action will seriously impact the stability of the surrounding rock. In this study, an analytical model for the strength of the two-lane shield tunneling construction under anisotropic seepage conditions was established, and a series of simulations were carried out in the engineering background of the underwater section of Line 2 of the Taiyuan Metro in China, which passes through Yingze Lake. The results show that: (1) the surface settlement has a superposition effect, and the late consolidation and settlement of the soil body under seepage will affect the segment deformation and the monitoring should be strengthened; (2) under the influence of the weak permeability of the lining and grouting layers, the pore pressure on both sides of the tunnel arch girdle is reduced by about 72% compared with the initial value, with a larger hydraulic gradient and a 30% reduction at the top of the arch; (3) within a specific range, the tunneling pressure can be increased, and the grouting pressure and the thickness of grouting layer can be reduced to control the segment deformation; (4) the more significant the overlying water level is, the larger the maximum consolidation settlement and the influence range of surface settlement. This study can provide a reliable reference for underwater double-lane shield tunnel design and safety control.

1. Introduction

In recent years, with the rapid development of coastal cities, underground tunnels, undersea tunnels, and river-crossing tunnels in the main form of shield tunnels have been constructed in large quantities [1,2,3], and have become an essential means of traversing the barrier of water [4,5]. The underwater shield tunnel excavation process changes the equilibrium state of the initial stress field and the seepage field within the geotechnical body. It is subjected to the coupling effect of the geotechnical body medium deformation and water seepage, and its mechanical coupling response is pronounced [6,7]. In particular, for underwater shield tunnels across rivers and seas, groundwater seepage has a significant influence on tunnel stability [8,9,10,11,12,13,14,15]. The whole underwater shield tunnel construction is performed in the region of overlying geotechnical bodies and water pressure quantum change, which leads to serious safety hazards in the main tunnel structure [16], and the consideration of the stress field–seepage coupling effect is necessary for design and construction.
Theoretical, numerical, or experimental methods have investigated seepage stability in shield tunnel excavations. In academic studies, Anagnostou et al. [17] assumed that seepage flow was isotropic. They proposed a classical “prism-wedge” limit equilibrium model for calculating the limit of effective support force under steady-state seepage flow. Zhang et al. [18] analyzed the effect of seepage flow on the pore pressure around the tunnel and the long-term settlement of the ground surface and the tunnel by analytical methods. Tang et al. [19] derived an analytical solution for the seepage field of an underwater circular tunnel considering seepage anisotropy based on the complex function theory of conformal mapping. Still, the surface of the formation will be deformed during the mapping process, so the result of this calculation is only an approximate solution.
In terms of experimental research, only a few scholars have conducted tests on the stability problem of tunnel excavation under seepage conditions. Chen et al. [20] investigated the instability problem of tunnel excavation face under steady-state seepage conditions with different head heights by centrifugal modeling tests. They derived the relationship between the adequate support pressure and the water pressure difference between groundwater and soil compartments. Feng and Chen [21] combined the self-developed catastrophe visualization test model with transparent soil technology to conduct experimental research on the problem of water surge and sand disasters in the construction of shield tunnels in saturated sandy soil stratum. In addition, Zhang et al. [22] explored the distribution of the seepage field and its streamlined changes through seepage tracer tests. However, although experimental studies can fairly accurately restore the actual situation of seepage field distribution and can be used to analyze the influence of seepage on tunnel stability, they have the disadvantages of high cost and poor operability and are time-consuming.
Numerical simulation is convenient and efficient and can reveal the characteristics of multi-physical field coupling. Lu et al. [23] used the finite element software PLAXIS, V22.00.02.1078, to study the pore water pressure distribution of the tunnel working face under seepage conditions. They achieved the ultimate support pressure for stabilizing the tunnel’s working face. Lü et al. [24] used the finite element software abaqus to simulate the soil body deformation induced by tunnel construction. They concluded that groundwater seepage would significantly increase the size and scope of ground subsidence deformation and change the ground deformation pattern into a funnel shape. It should be indicated that only the effect of a single seepage of groundwater on the stability of the tunnel perimeter rock was considered in the previous study, and the flow–solidity coupling effect between pore water and soil particles in the surrounding geotechnical soil was not taken into account. In order to increase the accuracy of the calculation, Li et al. [25], Wongsaroj et al. [26], Avgerinos et al. [27], and Li et al. [28] considered the flow–solid coupling effect in the numerical simulation of shield tunnels, but most of them assumed the permeability of the soil as isotropic. The layered structure of the soil body formed during deposition determines the anisotropy of its permeability coefficient. After tunnel excavation, the permeability coefficient of the soil around the tunnel increases in the horizontal direction, the change of the permeability coefficient in the vertical direction is small, and the degree of anisotropy of soil infiltration increases, which has a significant influence on the groundwater inflow rate and pore pressure distribution around the tunnel [29]. Qiao et al. [30] concluded from academic studies and numerical simulations that not considering the soil permeability anisotropy around the tunnel will underestimate the seepage flow and the head outside the lining of the tunnel, which will pose a safety risk to the design of the tunnel support structure.
In this study, based on the stress–seepage coupling theory, the relationship equation is established between the anisotropic permeability coefficient and the strain field, taking the Yingze Lake underpass project of Taiyuan Metro Line 2 in China as the engineering background. The finite difference software FLAC3D5.01 is adopted to establish an anisotropic three-dimensional flow–solidity coupling model, which takes into account the change of permeability coefficient of the soil with the shift in the state of stress. Research is conducted on the stability of the surrounding rock and structure during the construction period of the submerged shield tunnel, as well as the seepage characteristic of the shield tunnel under the condition of high water pressure. The results can provide reference and guidance for engineering applications.

2. Theoretical Method and Numerical Models

Since the displacement and seepage fields in saturated soils are two physicomechanical environments with different laws of motion, the mathematical model of fluid–structure coupling should contain the control differential equations of the displacement and seepage fields. The following present the basic equations for the stress field and the basic equations for the seepage field used in this paper.

2.1. Basic Principles of Fluid–Solid Coupling

2.1.1. Stress Balance Equation

In the coupled analysis of the soil stress field and seepage field, the soil body is considered a porous continuous medium, and its stress field conforms to the fundamental equations of continuous medium mechanics. The saturated soil body consists of soil particle skeleton and pore water, and the stress equilibrium differential equation is assumed to be incompressible for soil particles and water without considering acceleration:
σ i j + δ ij α p x i j + f j = 0 i , j = 1 , 2 , 3
Under the action of pore water pressure, according to the principle of effective stress, the geotechnical body constitutive equation [31] can be expressed as follows:
σ i j = σ i j α p δ i j
α = a 1 + a 2 Θ + a 3 p + a 4 Θ p
where  σ i j  is the effective stress tensor,  σ i j  is the total stress tensor,  α  is the equivalent pore pressure coefficient, 0 <  α  < 1,  δ i j  is the Kroneker symbol,  f i  is the volumetric force,  p  is the pore water pressure,  a 1 a 2 , and  a 3  are experimental constants, and  Θ  is the volumetric stress.

2.1.2. Seepage Continuity Equation

It is assumed that the soil deformation is not so substantial or linear elastic for saturated soils. Groundwater is considered incompressible. The seepage satisfies Darcy’s law. The seepage continuity equation can be obtained [32].
x k x p x + y k y p y + z k z p z = γ w n β w p t + ε V t
where  k x , k y , and  k z  are the permeability coefficients in the x, y, and z directions, respectively;  p  is the pore pressure;  t  is the time;  γ w  is the volumetric weight of the water;  β w  is the volumetric compression coefficient of the water. Moreover,  ε V  is the volumetric strain.

2.1.3. Theoretical Derivation of an Anisotropic Permeability Coefficient Expression

Therefore, it is necessary to consider the anisotropy of the permeability coefficient and establish the relationship between the permeability coefficient and each principal strain when performing the seepage–flow coupling analysis to reflect the influence of the stress field on the seepage field under different stress paths.
The initial porosity of the soil can be expressed as follows:
n 0 = 1 V S V 0
where  n 0  is the initial porosity;  V 0  and  V S  are the initial total volume and the total volume of the soil body after deformation, respectively.
Assuming that the soil particles are incompressible and the deformation of the soil is mainly due to the compression of the voids in the soil, the porosity of the soil deformation can be expressed as follows:
n = 1 V S V
where  n  is the porosity of the porous medium and  V  is the total volume of the soil after deformation.
For minor strain problems, the volume strain can be expressed as follows:
ε V = V V 0 V 0
Equations (6)–(8) can be obtained by associating them:
n = n 0 + ε V 1 + ε V
The Kozeny–Carman equation is expressed as follows:
k = n 3 c 1 n 2 S 2
where  c  and  S  are the Kozeny–Carman constant and the specific surface area of the solid phase, respectively.
The coupled Equations (6) and (7) can be used to obtain the intrinsic equation of fluid–solid coupling, which can be expressed as follows:
k x = k 0 x 1 + ε V 3 1 + ε V n 0 3 k y = k 0 y 1 + ε V 3 1 + ε V n 0 3 k z = k 0 z 1 + ε V 3 1 + ε V n 0 3
where  K 0 x K 0 y , and  K 0 z  are the initial permeability coefficients in the x, y, and z directions, respectively.
Simultaneous Equations (1), (4), and (10), supplemented by initial and boundary conditions, are sufficient for fluid–solid coupling analysis.

2.2. Numerical Modeling

This paper uses the finite element software FLAC3D5.01 to establish a three-dimensional numerical model. The secondary development of FLAC3D5.01 software is carried out through the FISH language to compile the functional relationship between anisotropic permeability coefficients and strains, which is given to the model calculation unit to realize the dynamic change of permeability coefficients to reflect the effect of the stress field on the seepage flow field.
One of the methodology’s limitations is simplifying the stratigraphic yield of the lake bottom, depending on the geology of each layer in a horizontal state. Moreover, the excavation process of the shield is simplified.

2.2.1. Modeling Assumptions

Assumptions of the proposed model:
(1)
The solid units of the model follow the Mohr–Coulomb yield criterion;
(2)
The properties of the soil and structural units do not change during excavation, and the soil particles and fluids are incompressible;
(3)
The geotechnical body is regarded as a porous medium, and the flow of fluid in the pores conforms to Darcy’s law;
(4)
The shield shell and lining units are considered to be perfectly elastic, and both are impermeable.

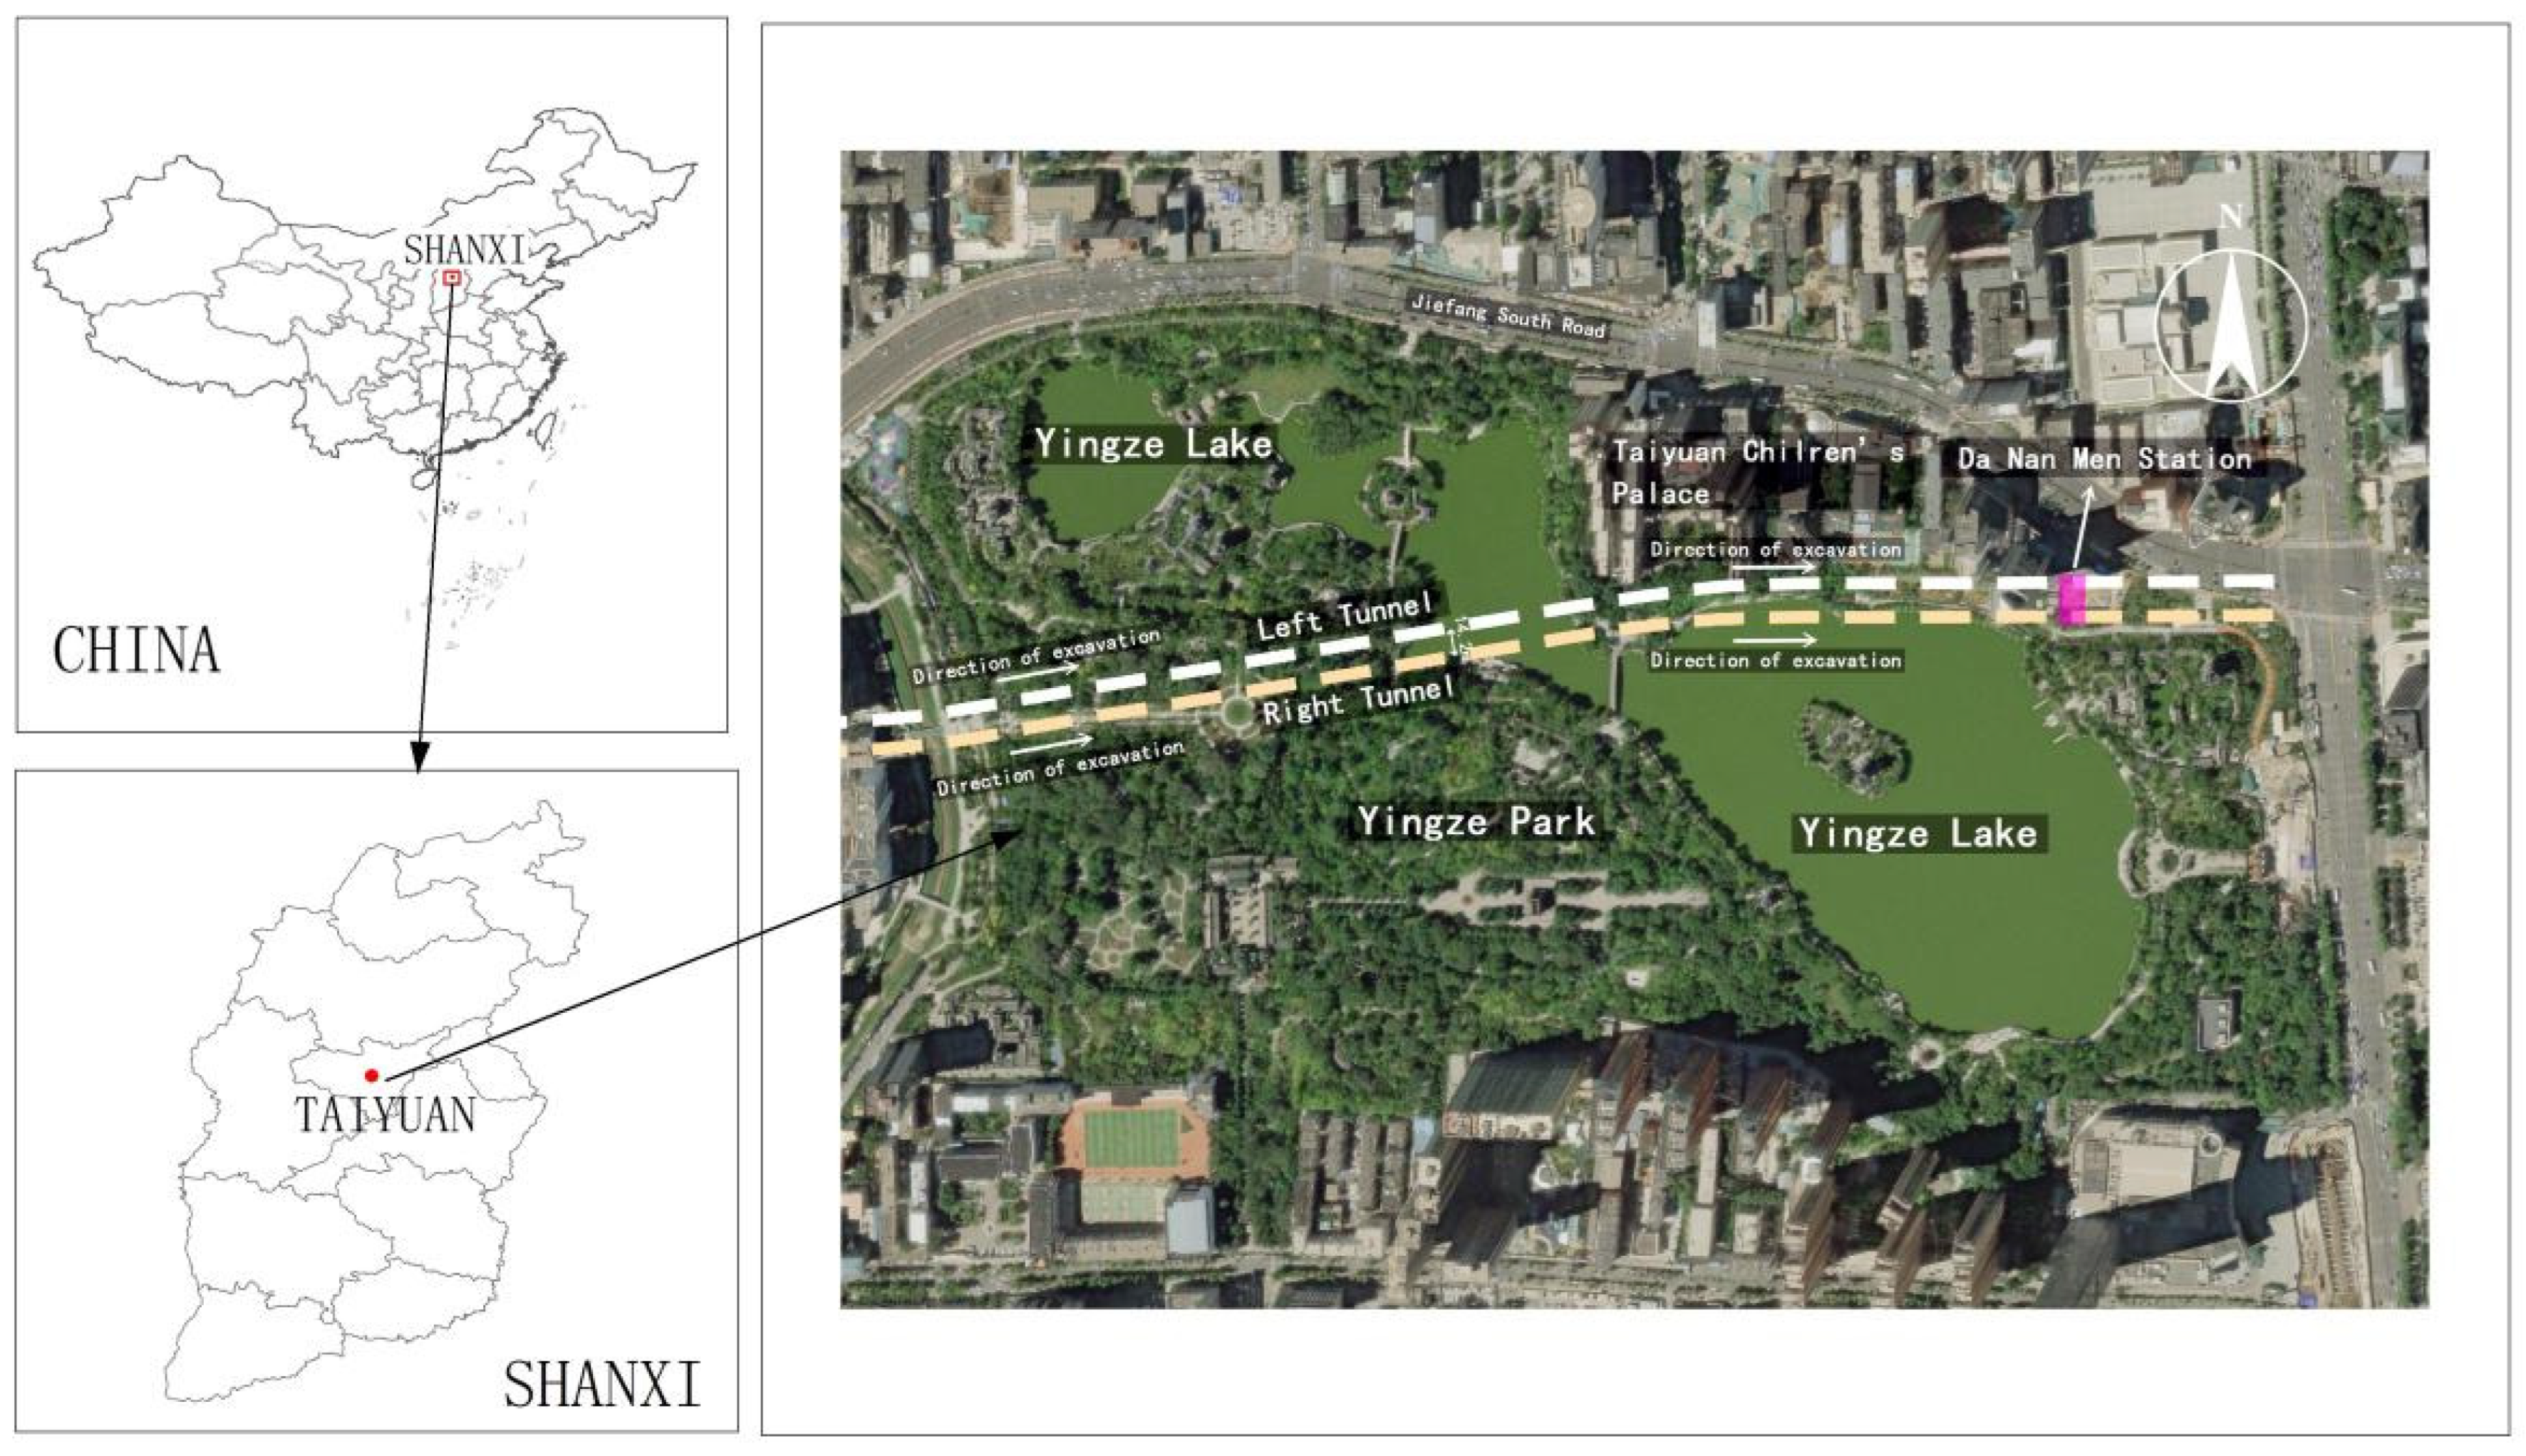
2.2.2. Engineering Background

The Taiyuan Metro Line 2 project is the 1st urban rail transit line in Taiyuan, China. The tunnel between Shuangta Xijie Station and Dananmen Station is a two-lane shield tunnel constructed using the EPB shield. After the left tunnel is excavated, the right tunnel will be excavated again. The distance between the left and right tunnels is 14.2 m. The arch crown of the left tunnel line is about 16.9~18.2 m away from the bottom of the lake, and the arch crown of the right tunnel line is about 13.5~17.67 m away from the bottom of the lake, and the length of the shield tunnel under the lake is about 156 m. The depth of Yingze Lake is about 1.5~5.0 m, and the lake’s width is about 40~300 m. The groundwater level depth between the area is 2~7.5 m, which is a pore dive in the Quaternary loose soils. It locally passes through the micro-bearing pressure water-bearing rock formation, and the water level varies about 2~7.5 m depending on the seasonal influence. The annual variation of water level is about 1.0 m. The groundwater depth is shallow, the aquifer is thick, and the permeability coefficient is large, and it is affected by the seepage and recharge of Yingze Lake water, dramatically influencing the project’s construction in this zone. The tunnel mainly passes through a layer of 2–4 fine sandy clay and 2–5 medium sandy clay. The schematic diagram of the project area is shown in Figure 1.
The tunnel adopts a standard single-circle shield lining structure, with an outer diameter of D = 6200 mm and an inner diameter of D = 5500 mm. The tunnel is lined in a single layer, with a segment thickness of 350 mm and a ring width of 1200 mm, and the lined segment ring is assembled from 6 prefabricated completed reinforced concrete segments. The total length of the shield machine is 9.2 m, and the outer diameter of the shield machine is 6.4 m. The liner ring is made of 6 pieces of prefabricated reinforced concrete segments.

2.2.3. Modeling

To reduce the influence of boundary effects, and considering that the soil body is infinite, the range of soil stress redistribution after tunnel excavation is 3–5D (D is the diameter of the tunnel) in the horizontal direction, so the calculation range of the tunnel model is established as follows: the upper part is the actual thickness of the overlying rock and soil layer, i.e., the distance between the upper part of the tunnel and the bottom of the lake; 4D is taken vertically downward from the center of the tunnel, and 5D is taken horizontally outward from each direction [33]; the length of the model is the length of the tunnel going down to the lake bottom. As shown in Figure 2, the dimensions of the constructed numerical model are 156 m (length) × 77 m (width) × 46 m (height). The model is divided into 237,640 units and 244,332 nodes. The mesh is denser near the tunnel and sparser away from the tunnel in a radial pattern, which can better meet the computational accuracy requirements. The Moore–Cullen elastic–plastic model models each soil layer and the grouting layer unit, and the lined segment is modeled by the shell unit.

2.2.4. Calculation Parameters

The parameters for the grouting materials and lining are taken from the literature [34,35,36]. The density of the segment is 2500 kg/m3, Poisson’s ratio is 0.3, modulus of elasticity is 34.5 GPa, stiffness reduction coefficient is 0.8, and shell unit is adopted; the shield shell of shield machine has a density of 7850 kg/m3, Poisson’s ratio is 0.2, modulus of elasticity is 210 GPa, and liner unit is adopted; a homogeneous and equal-thickness “equivalent layer” is adopted to simulate the grouting process, and the slurry hardening process is simplified. To simulate the grouting process and simplify the hardening process of the slurry, within 2.4 m of the shield tail is the flowing equivalent layer, with a thickness of 0.06 m, density of 2000 kg/m3, elastic modulus of 0.75 MPa, Poisson’s ratio of 0.35, and outside the 2.4 m of the shield tail is the initial condensation equivalent layer, with a thickness of 0.06 m, density of 2300 kg/m3, elastic modulus of 10 MPa, elastic modulus of 0.2, and equivalent layer of 10 MPa. The density is 2300 kg/m3, the modulus of elasticity is 10 MPa, and Poisson’s ratio is 0.25. According to the geological investigation report, the physicomechanical parameters of each layer of the soil body are shown in Table 1.

2.2.5. Simulation Process

The excavation process of the shield tunnel adopts the stiffness migration method, with one cycle for each tube width (1.2 m) excavated in the shield tunnel.
(1) Material parameters are assigned to the geotechnical body, model boundary conditions are imposed, initial ground stress equilibrium is carried out, and the displacement is zeroed; (2) 1.2 m length of soil unit in front of the excavation is removed through the “null” model, infiltration boundary conditions at the excavation face are imposed, and soil bin pressure at the palm face is applied; (3) within the excavation range of the previous step, a shell structural unit is applied to simulate the shield shell of the shield machine (when the shield machine moves forward 1.2 m, the shield tail activates the 1.2 m lining unit and the gap unit and assigns the parameters); (4) circumferential homogeneous grouting pressure is applied to the inner wall of the soil body within the range of 2.4 m at the tail of the shield, and the gap unit outside the range of 2.4 m at the tail of the shield is replaced with hardened grouting material; (5) gradually, the shield structure is pushed forward to the completion of the excavation.
The location of each excavation step in the asynchronous excavation of the two-lane shield tunnel is shown in Figure 3. Considering that the width of the lining segment is 1.2 m and the efficiency of numerical calculation, 2.4 m is selected as a numerical simulation excavation step, and the left and right lines are excavated asynchronously, with 1~130 steps for the excavation of the left tunnel line, and 131~260 steps for the hole of the right tunnel line, with a total of 260 steps. The middle part of the model (Y = 78 m) (the middle part of the lake bottom under the shield machine) is selected as the monitoring section to carry out the research and analysis of the calculation results.

2.3. Boundary Conditions and Initial Conditions

Displacement boundary conditions: the lake water of 5 m depth is equivalent to a uniform compressive stress of 5 × 10⁴ Pa applied to the upper surface of the model; the front, back, left, and proper four characters of the model are set as horizontal displacement constraints; the displacement of the bottom surface is a fixed constraint.
Initial conditions of the stress field: the initial stress is calculated according to the self-gravity stress of the soil body.
Seepage boundary conditions: A pore pressure boundary of 5 × 10⁴ Pa is applied on the upper surface of the model. For soft clay, its permeability coefficient is small. In the transient deformation stage of shield tunnel construction, the external boundary of the model is not as good as the drainage, so it is assumed that other limitations, including the front and rear borders of the model, the left and right boundaries, the bottom boundary, and the boundary of the tunnel, in addition to the upper surface, are impervious. In the long-term development and change process of tunnel consolidation and settlement, the pore water pressure should be kept as the initial hydrostatic pressure value due to the model front and rear boundaries, left and right borders, and bottom boundaries being far away from the tunnel. Hence, the model front and rear edges, left and proper limits, and bottom boundaries are infiltrated. The pore water pressure inside the border of the segment is fixed at 0 during the tunnel shield excavation process.
Seepage initial conditions: the initial pore water pressure within the soil before tunnel excavation is the hydrostatic pressure within the rock and soil layer.

3. Results and Discussions

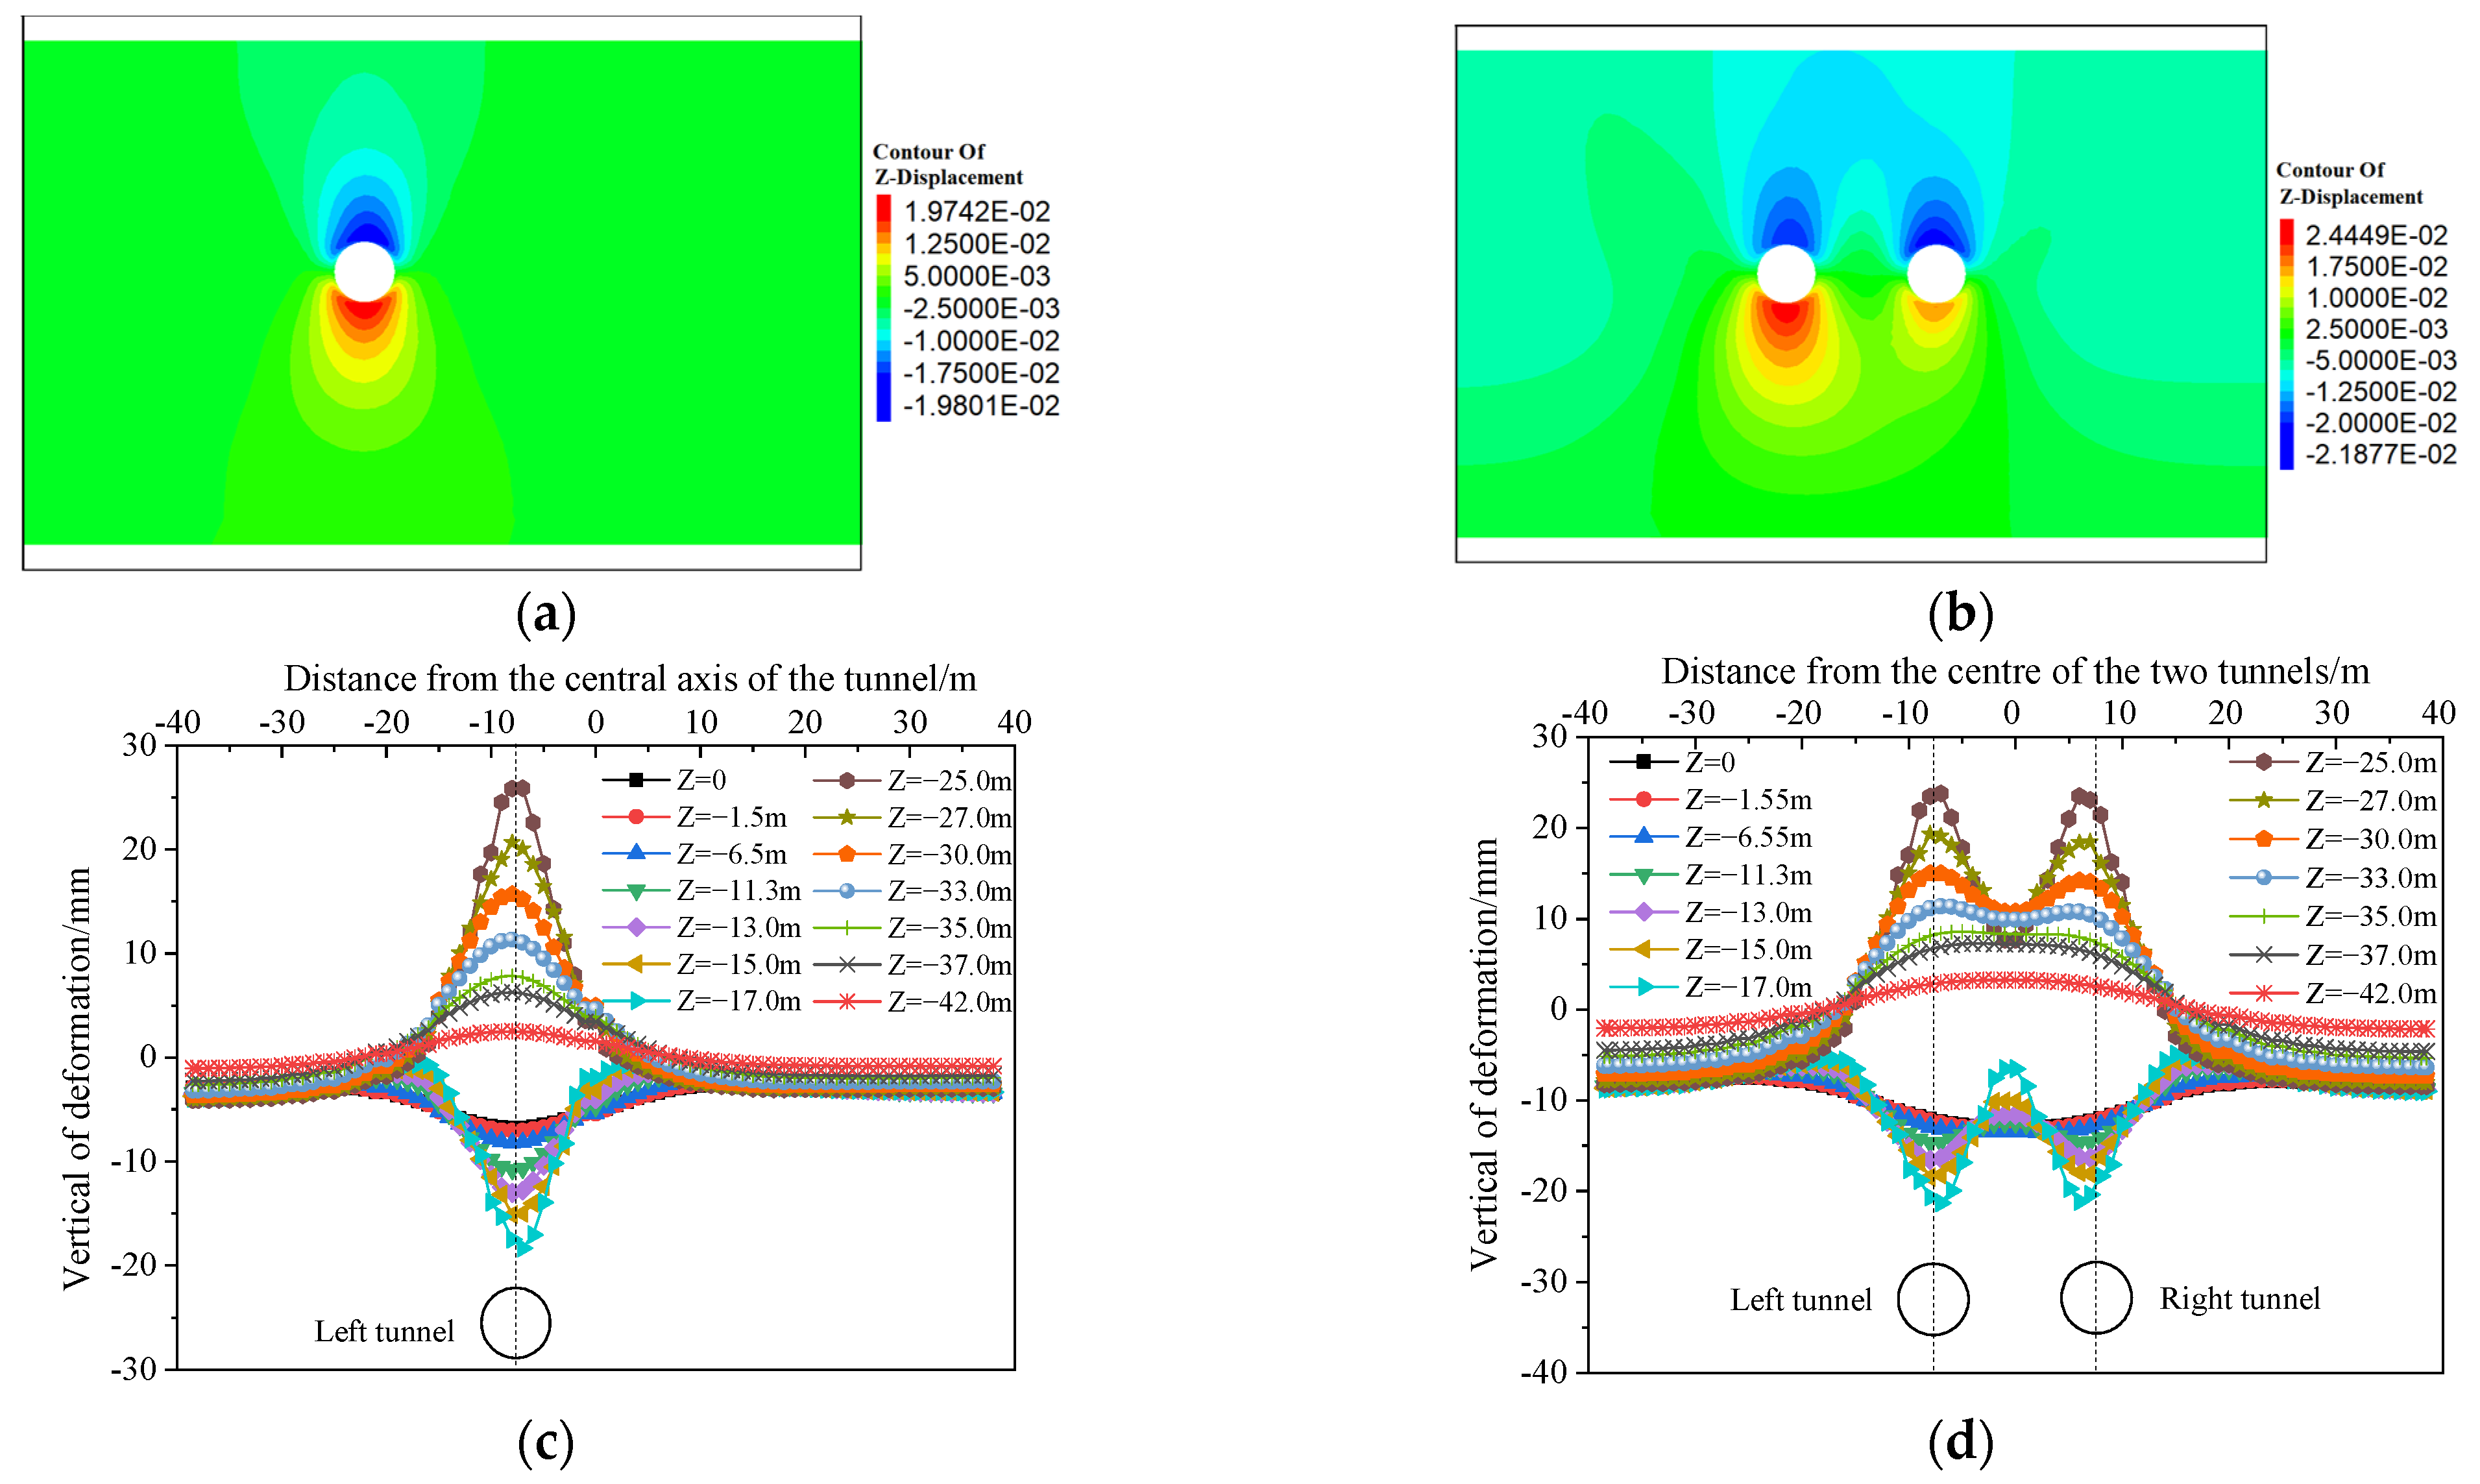
3.1. Analysis of Displacement Field

After the asynchronous excavation and penetration of the two-lane shield tunnel, the deformation of the stratum in the monitoring section Y = 78 m is shown in Figure 4. It can be seen that:
(1) Stratum settlement is mainly distributed above the tunnel axis, with the magnitude of stratum settlement gradually decreasing from the surface to the tunnel axis. Stratum uplift mainly occurs below the tunnel base due to the tunnel excavation’s stress-relief effect. The strata deformation pattern caused by the double-lane shield tunnel excavation revealed in Figure 4 is similar to the results of the strata deformation pattern obtained from calculations based on the random field theory reported by Li et al. [37] and the results of the strata deformation pattern obtained from the field monitoring and numerical calculations used by Qiu et al. [38].
(2) After the left tunnel excavation is completed, the maximum surface settlement is −6.7 mm, which occurs above the centerline of the tunnel. Furthermore, the right tunnel excavation results in overlapping the settlement areas at the top of the two tunnels, which leads to a larger size of surface settlement with a lateral length of about ±15 m (about 2.5D). The maximum surface settlement is −13.0 mm, located to the left of the center of the two tunnels.
(3) During the process from left-line penetration to double-line penetration, the surface drop value above the centerline of the left line tunnel increases by 5.56 mm, an increase of 82%, which shows that the excavation of the backward tunnel in the shield double line tunnel will have a continuous impact on the first tunnel, resulting in a certain amount of increase in the surface settlement of the first tunnel.
Figure 4. Vertical displacement distribution of monitoring section A. (a) Distribution of the left tunnel after excavation and penetration; (b) distribution of the right tunnel after excavation and penetration; (c) vertical deformation curve of the strata after excavation and penetration of the left tunnel; (d) vertical deformation curve of the strata after excavation and penetration of the right tunnel.
Sustainability 15 15581 g004
The shield tunnel excavation process will disturb the soil around the tunnel, resulting in different degrees of soil deformation. The settlement of the soil on the upper part of the tunnel vault will directly affect the stability of the segment in the process of shield tunnel excavation needed to monitor the settlement of the soil on the upper part of the tunnel vault, and according to the results of the monitoring to take appropriate preventive and control measures. In the Y = 78 monitoring section of the left line of the tunnel (corresponding to the 65th step of excavation) of the vault and its two sides of the deployment of seven monitoring points, one monitoring point is located in the tunnel’s vault position. Furthermore, the other six monitoring points are located in the vault of the two sides of the situation; the elevation of each measuring point is the same, and the horizontal spacing is 2 m.
The displacement change curve of each monitoring point during the shield tunnel boring process is shown in Figure 5. It can be seen that, when the tunneling machine excavates to the 57th step, the vertical displacement of each monitoring point is 0. When excavating to the 61st step, the shield excavation slightly disturbs the soil at each monitoring point. The soil at each monitoring point undergoes a tiny settlement.
With the continuous advancement of the tunnel working face, the influence range of settlement around the tunnel vault gradually expands, and the vertical displacement decreases in the horizontal direction from the center of the tunnel to both sides, similar to the Pecck curve. During the excavation of the left tunnel, when the excavation face is 4.8 m away from the monitoring section, the soil at each monitoring point starts to settle, and the maximum settlement value is 0.8 mm; when the excavation face just crosses the monitoring section, the maximum settlement value is 3 mm; after the excavation face crosses the monitoring section, the maximum settlement values are 7.0 mm and 7.6 mm when the excavation face is 4.8 m and 9.6 m away from the monitoring section, respectively, which can be seen. In the process of the working face crossing the monitoring section, the increment of soil settlement value increases first and then decreases, and the maximum increment appears at the position of 4.8 m from the monitoring section after the excavation face crosses the monitoring section.
After the excavation of the right tunnel is completed, the maximum settlement value of the monitoring point is 9.5 mm, and the increment of settlement is 3 mm, accounting for 25% of the total settlement, which indicates that the soil body under seepage action has a large late consolidation settlement, which will have an impact on the stability of the tube sheet, so the monitoring of the soil body’s late consolidation settlement should be strengthened.

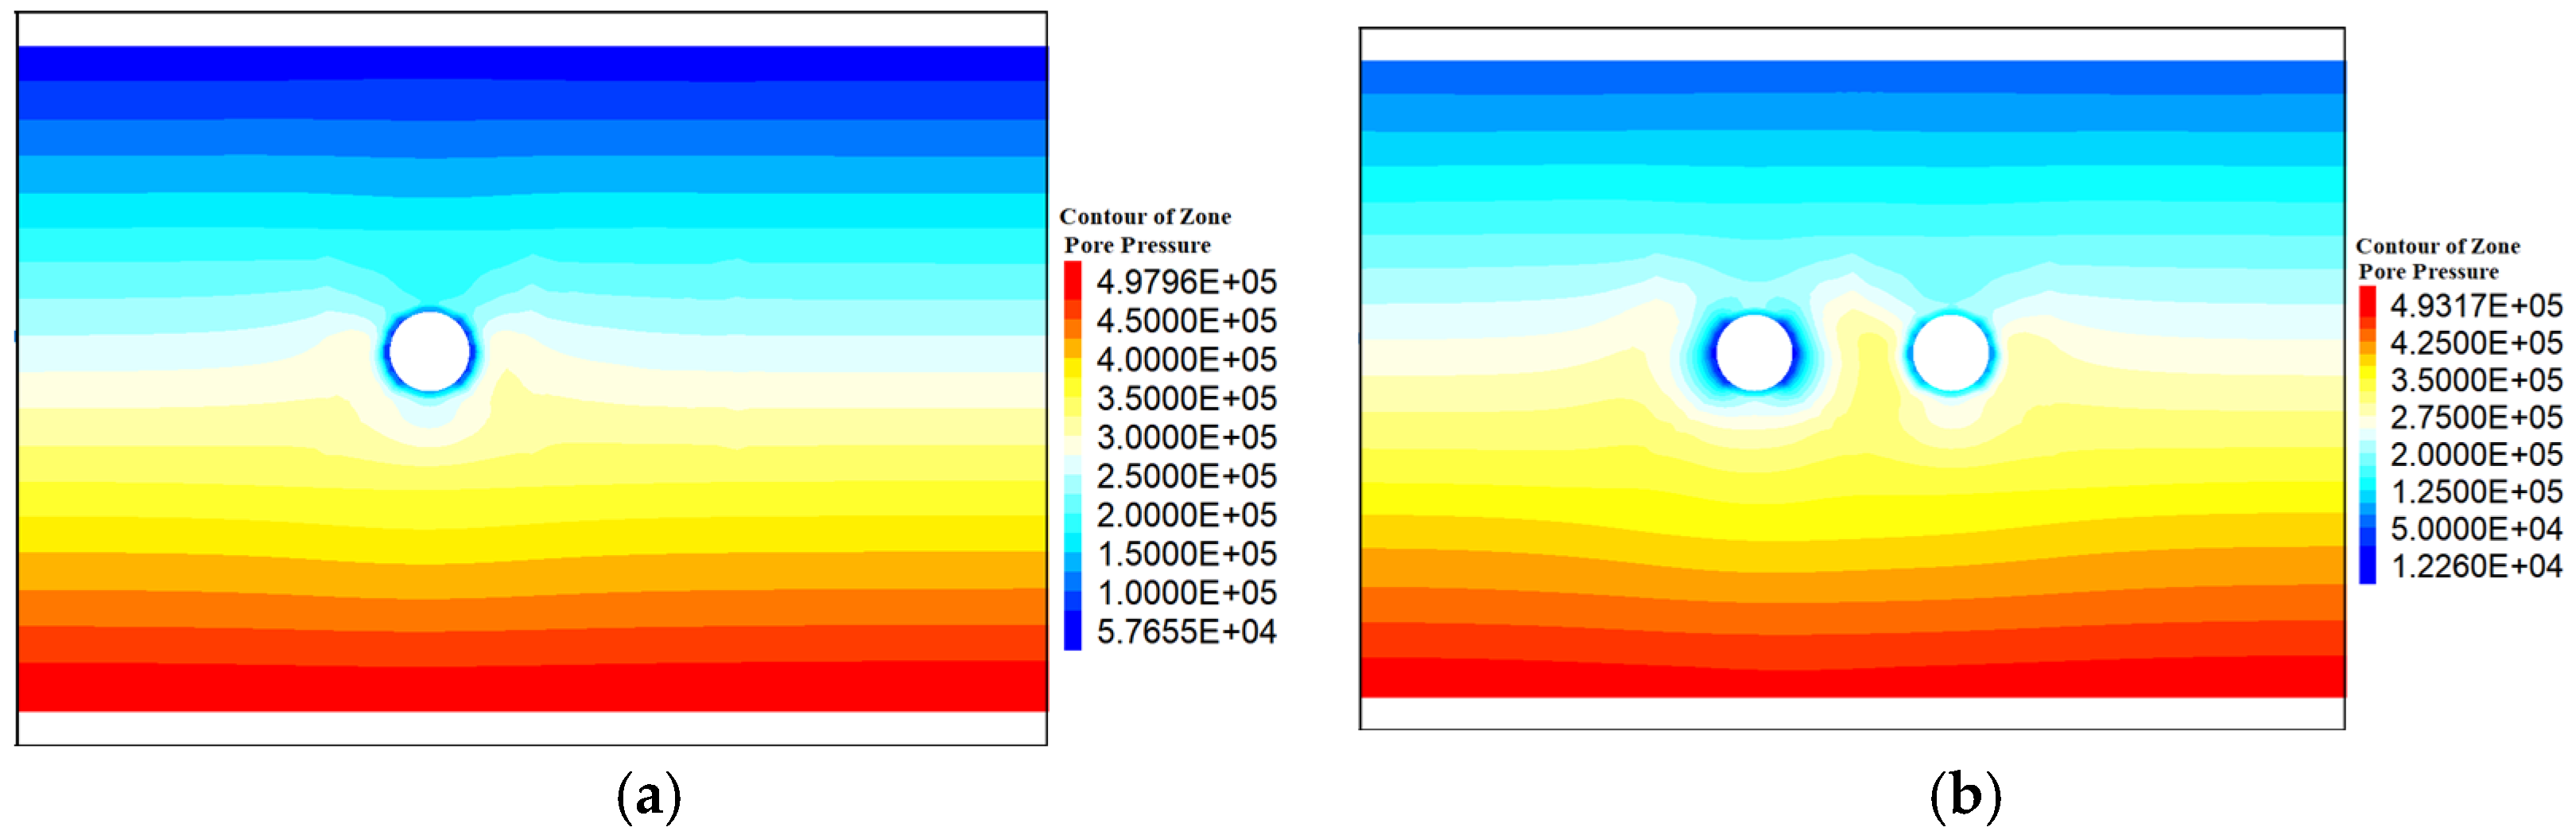
3.2. Analysis of Seepage Field

The disturbance of the surrounding soil caused by the shield tunnel excavation process will inevitably change the permeability properties of the soil, thus causing changes in the fluid pore water pressure. Monitoring points A and B are arranged at the left and right tunnel arch crown in the Y = 78 monitoring section to record the pore water pressure changes at the monitoring points. The calculation results are shown in Figure 6.
It can be seen from Figure 6 that, as the left tunnel excavation advances, the pore water pressure value at monitoring point A decreases, especially after the shield machine crosses the monitoring section, and the pore water pressure starts to drop dramatically; after the left tunnel is passed through, the pore water pressure value at monitoring point A tends to stabilize at value of 0.0198 MPa, and no longer changes; during the excavation process of the left tunnel, the pore water pressure at monitoring point B does not change significantly. During the excavation of the right tunnel, the pore water pressure at monitoring point B starts to decrease gradually; after the shield machine crosses the monitoring section, the pore water pressure at monitoring point B decreases dramatically; finally, the pore water pressure value tends to stabilize at 0.198 MPa, and no further change occurs, reduced by about 30% compared with the initial value. It can be seen that the shield excavation greatly influences the pore water pressure around the tunnel, and there is a remarkable decrease in the pore water pressure after excavation compared with the initial value.
The cloud diagram of the distribution of the seepage field of the surrounding rock in the monitoring section after the completion of asynchronous excavation of the left and right holes of the shield tunnel is presented in Figure 7. It can be seen that: (1) After the completion of the left tunnel excavation, the pore water pressure around the segment decreases significantly compared with the initial pore water pressure value, the groundwater flows to the excavation surface under the action of head pressure, the seepage field forms a distribution similar to the funnel-shape centered on the excavation area of the tunnel, and the seepage field is symmetrically distributed with the center axis of the two tunnels as the symmetry center after the right tunnel excavation is completed. After excavating the right tunnel, the seepage field is symmetrically distributed, with the center axis of the two tunnels as the symmetry center. (2) After the excavation of the right tunnel is completed, the pore water pressure around the left tunnel further decreases, mainly because the drainage boundary of the right tunnel is larger during the excavation. More pore water is discharged within the same period. (3) The pore water pressure value on both sides of the arch waist decreases from the initial 255 kPa to 70 kPa, a reduction of about 73%, which is a considerable reduction. The main reason is that the groundwater surges to the tunnel under the action of the pressure head. At the same time, the weak permeability of the lining and grouting layer prevents the water from entering, and the water moves along the grouting layer to the arch bottom, reducing pore water pressure at the arch waist.
The seepage field distribution pattern of the high hydraulic pressure shield tunnel revealed in Figure 7 is similar to the results of the centrifugal test reported by Niu et al. [39] and the seepage field distribution of the tunnel excavation surface using numerical calculations by Wang et al. [40] and Zhang et al. [41].

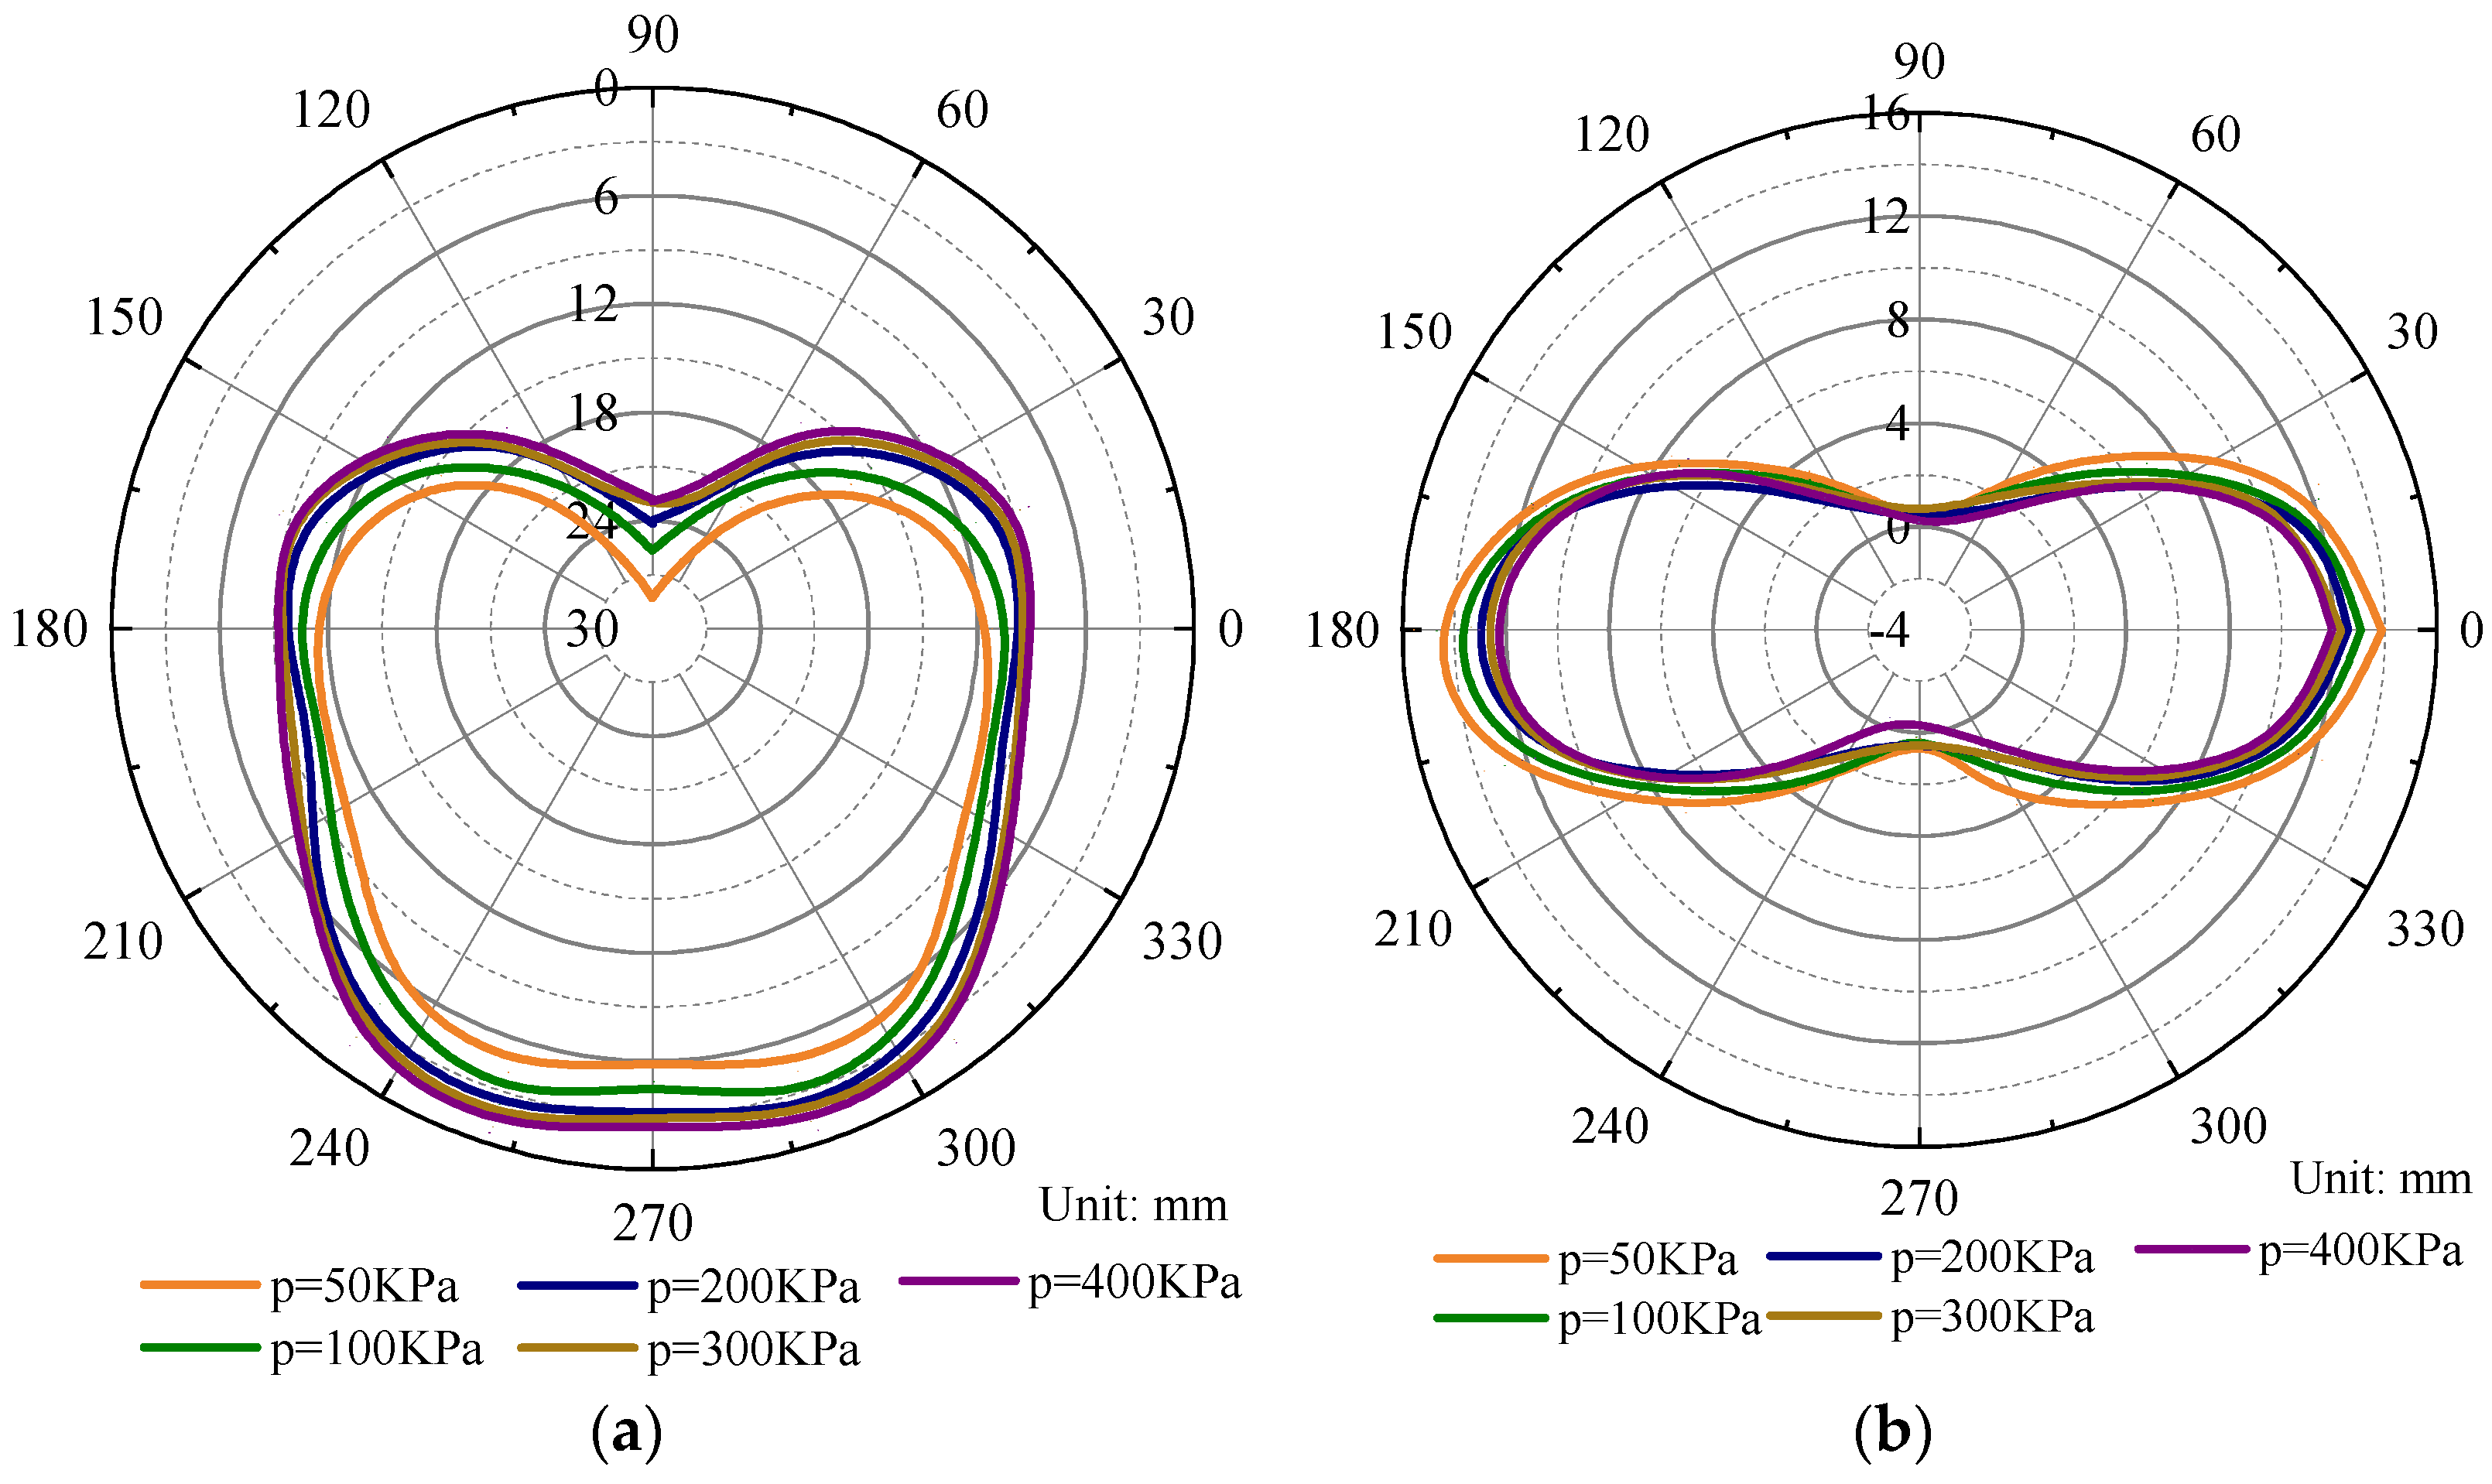
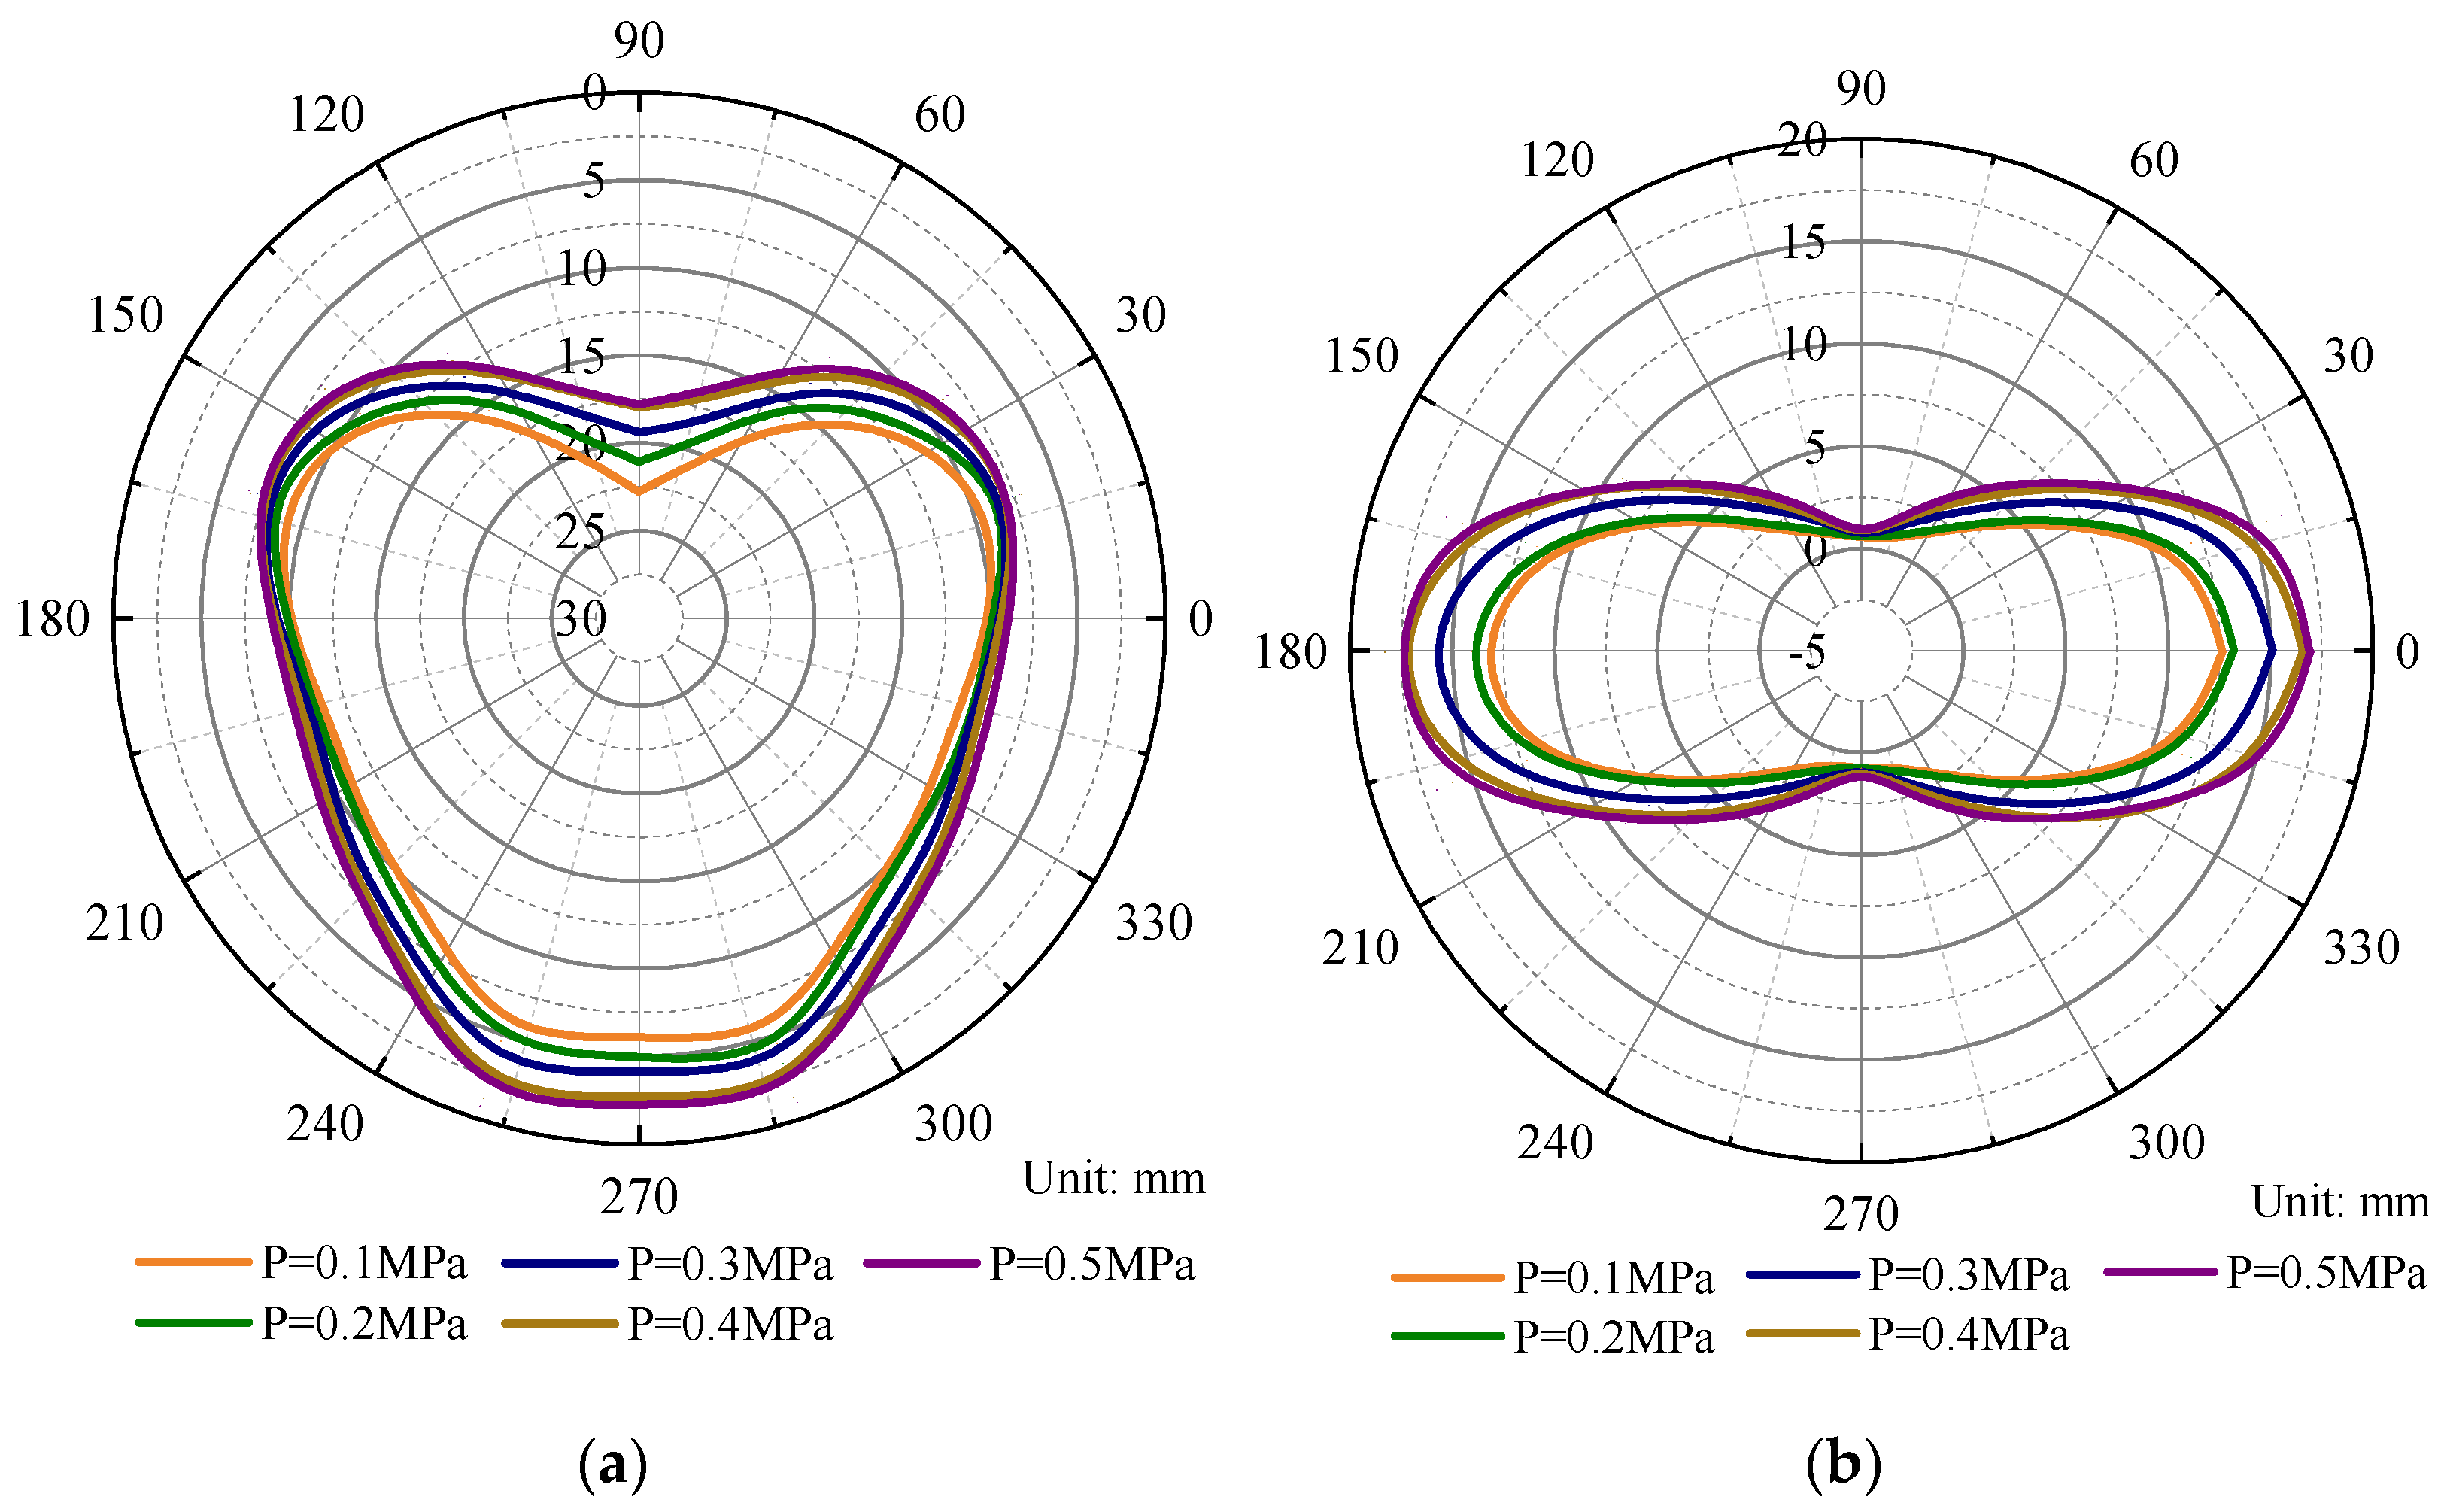
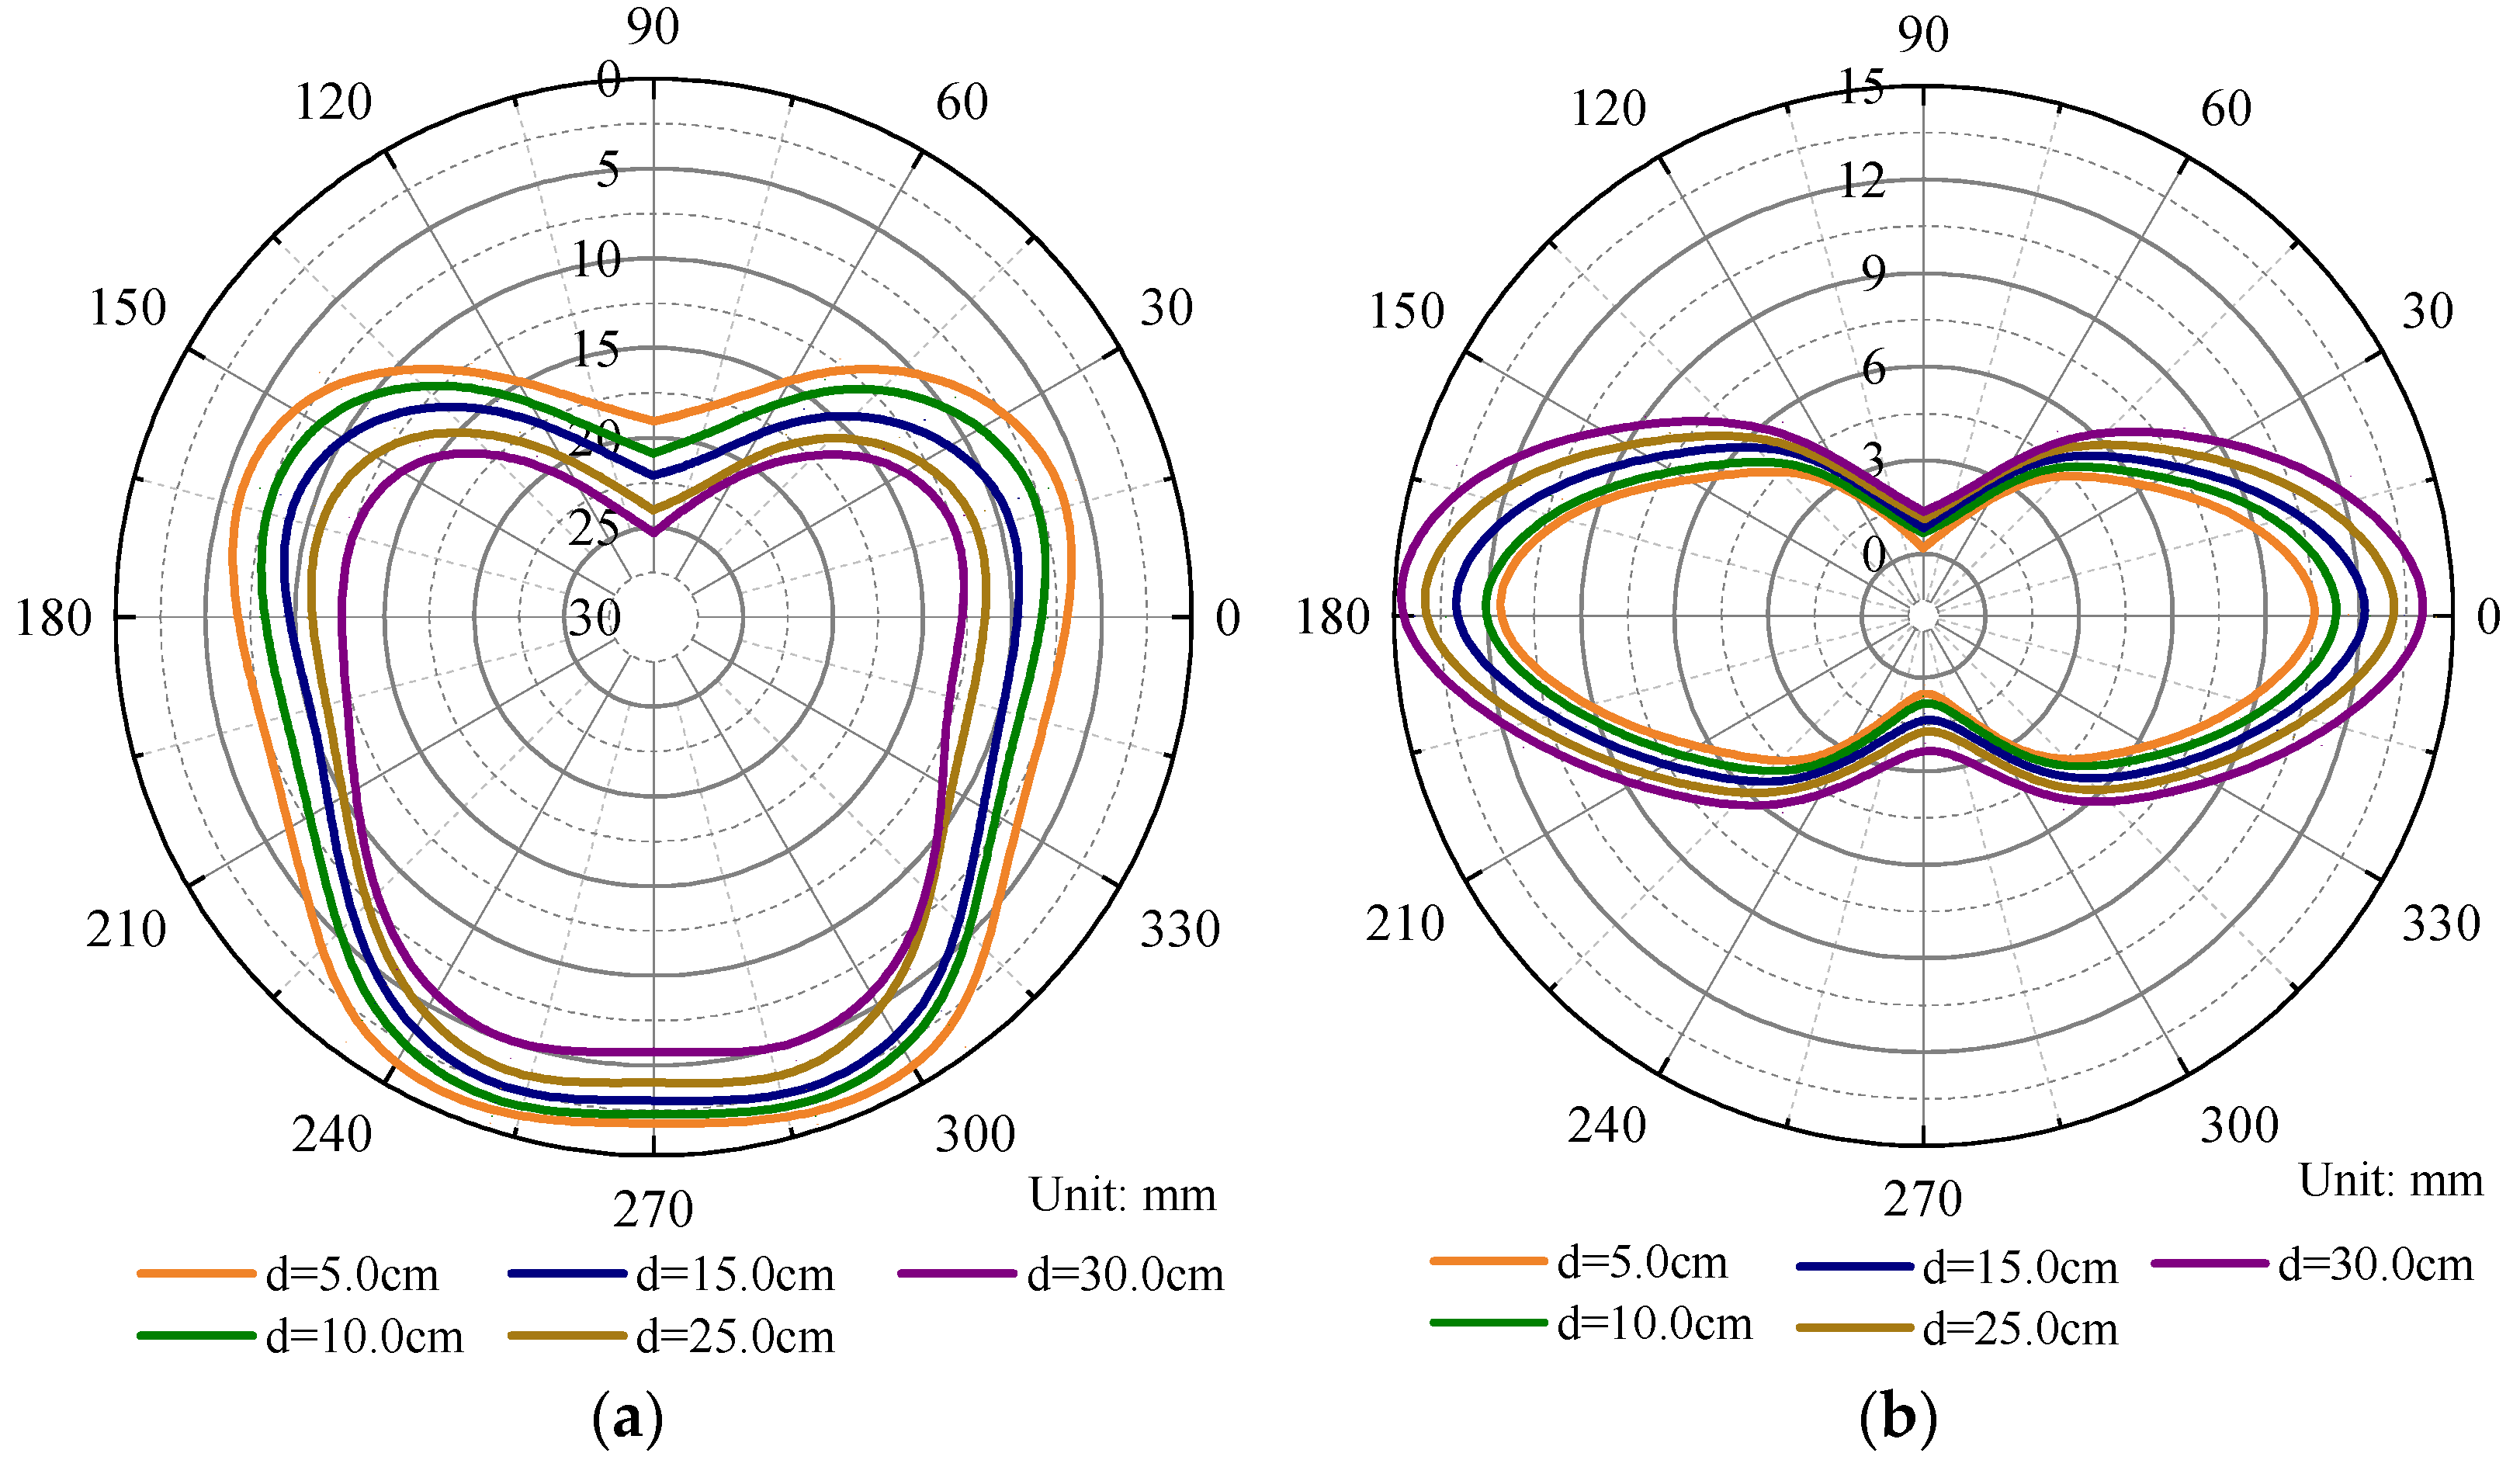
3.3. Analysis of Key Construction Parameters

Shield tunnel excavation is a dynamic construction process. For the construction of underwater shield tunnels under the complex environment of high water pressure and shallow burial, selecting reasonable construction parameters can effectively reduce the impact of tunnel excavation disturbance and improve tunnel stability [42,43]. According to the results of previous studies, the tunneling pressure, grouting pressure, and thickness of the grouting layer, which have a more significant effect on tunnel stability, are selected for analysis.
After the completion of the left shield tunnel, the deformation of the tube sheet at Y = 78 of the monitoring section under different boring pressure, grouting pressure, and thickness of the grouting layer are presented in Figure 8, Figure 9 and Figure 10. It can be found that the figures show that: (1) The vertical deformation and horizontal deformation of segment under different tunneling pressures, grouting pressures, and thickness of grouting layer have the same trend. The vertical deformation of the segment is approximately distributed in the shape of a “butterfly”, and the deformation manifests itself in the settlement of the arch crown, the bulging of the arch bottom, and the offset of the arch waist to the inner side of the axis; the deformation of the arch crown of the segment is more significant than the deformation of the arch bottom. The difference in vertical deformation of the arch waist at the two sides is relatively tiny. The horizontal deformation of the segment is approximately “∞”-shaped, and the deformation shows that the deformation gradually increases from the arch crown, the arch bottom of the arch, to the waist on both sides. (2) With the increase in tunneling and grouting pressure, the overall deformation of the segment gradually decreases. However, when the tunneling pressure exceeds 200 kPa and the grouting pressure exceeds 0.4 MPa, the influence on the overall deformation of the segment is slight. Furthermore, with the increase in the thickness of the grouting layer, the overall deformation of the segment gradually increases, and when the thickness of the grouting layer exceeds 10 cm, the deformation value of the segment vault is more than 20 mm, which exceeds the normative permissible deformation value, and the thickness of the grouting layer has a significant influence on the deformation of the segment vault, which should be considered a critical point in the construction process. Consideration should be given during the construction process.

3.4. Seepage Characteristics of Shield Tunnel under High Water Pressure

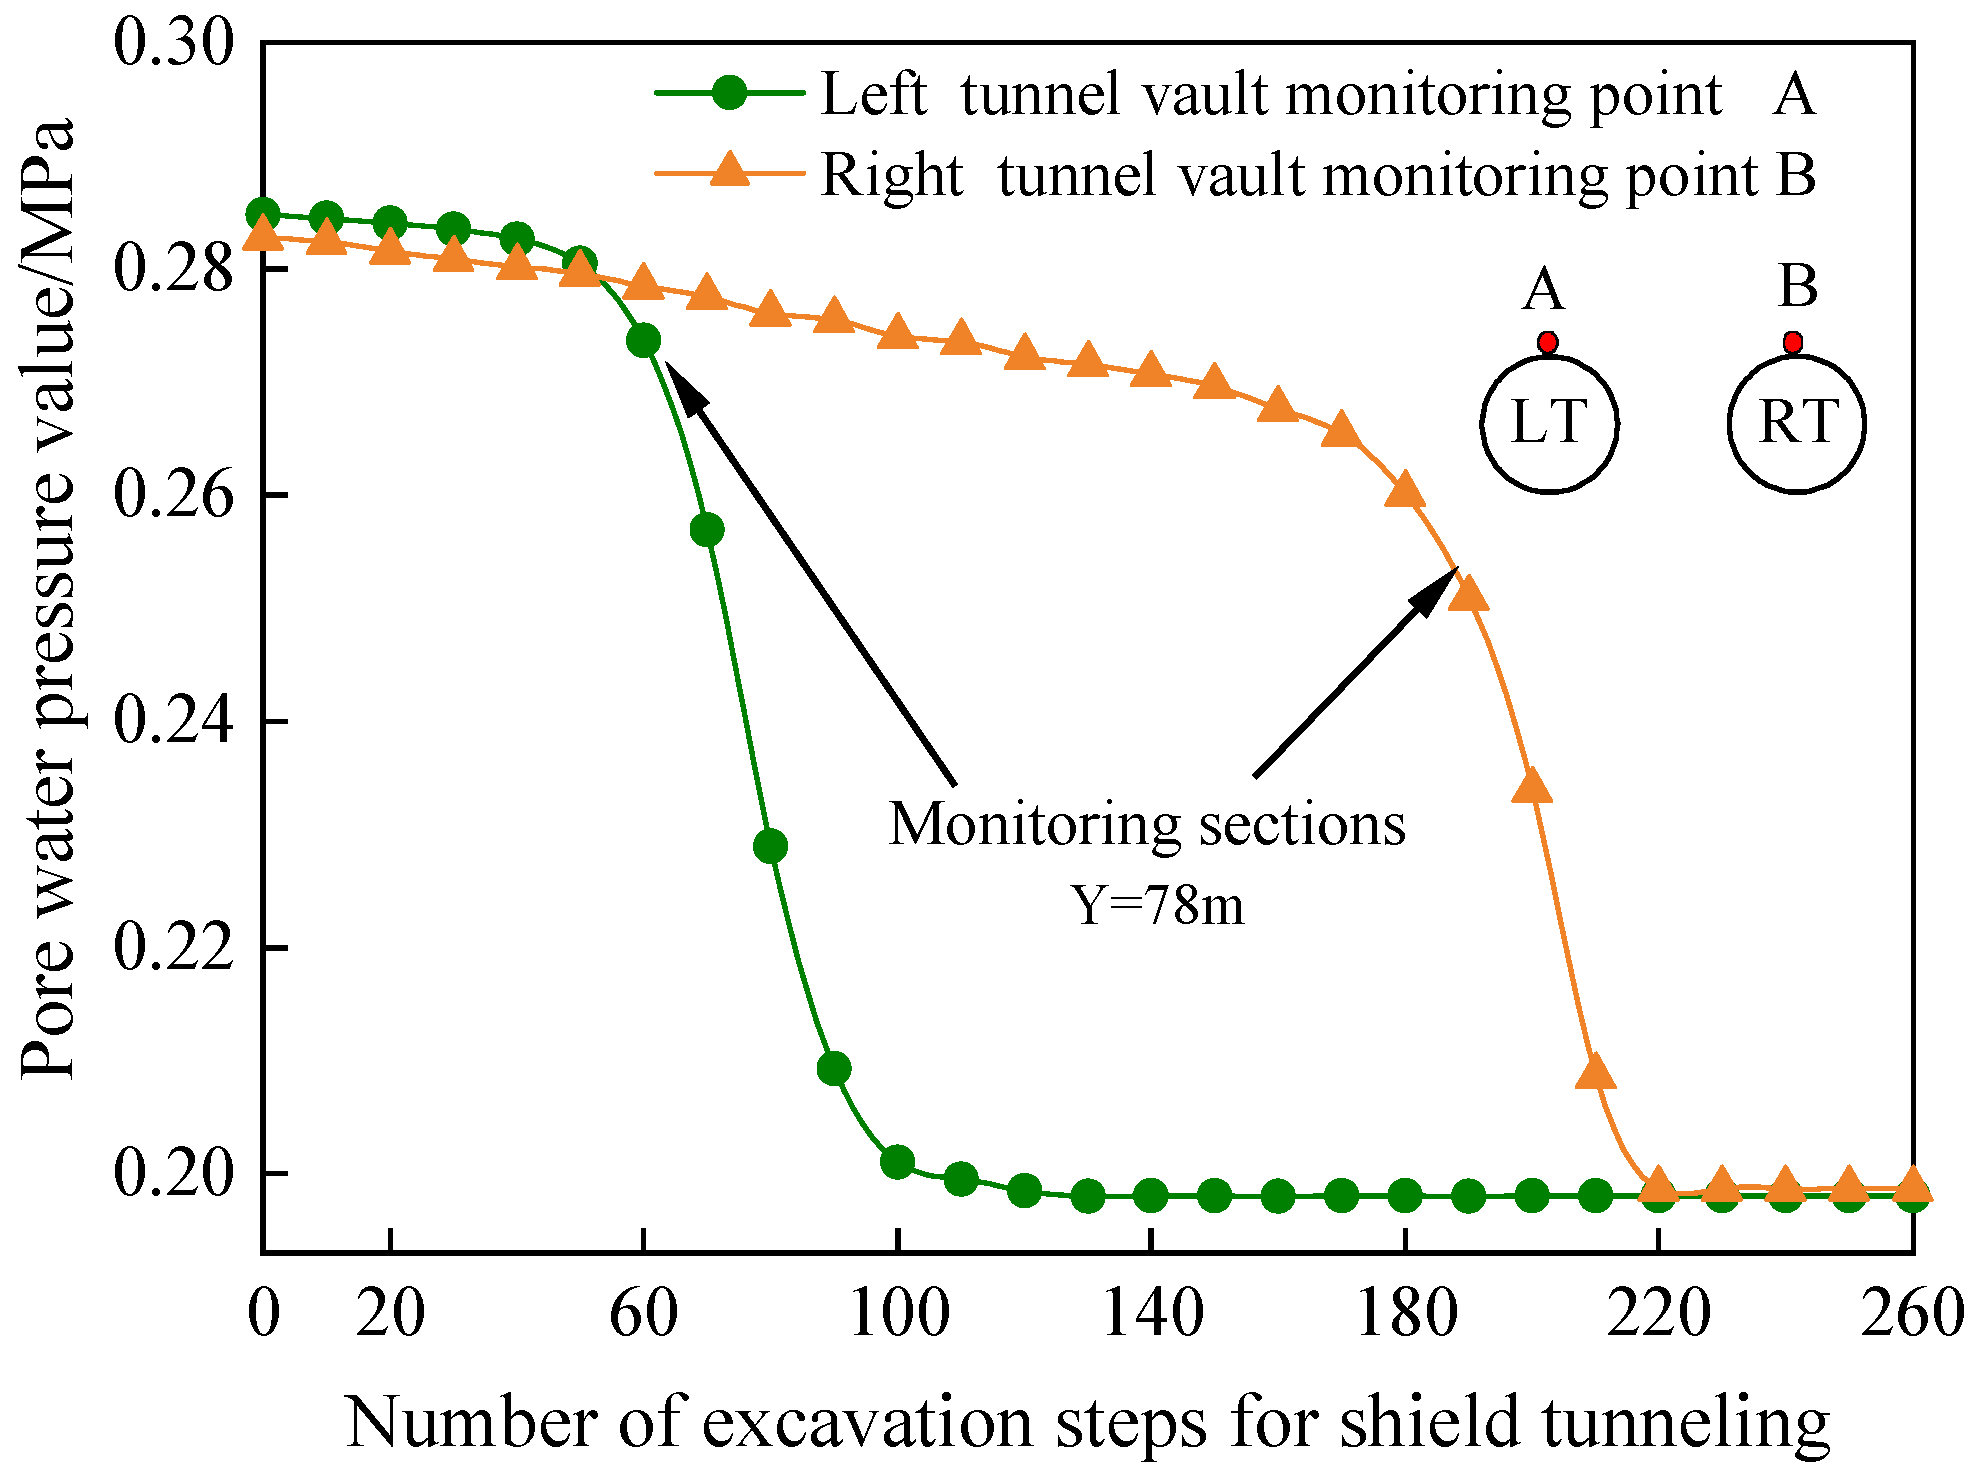
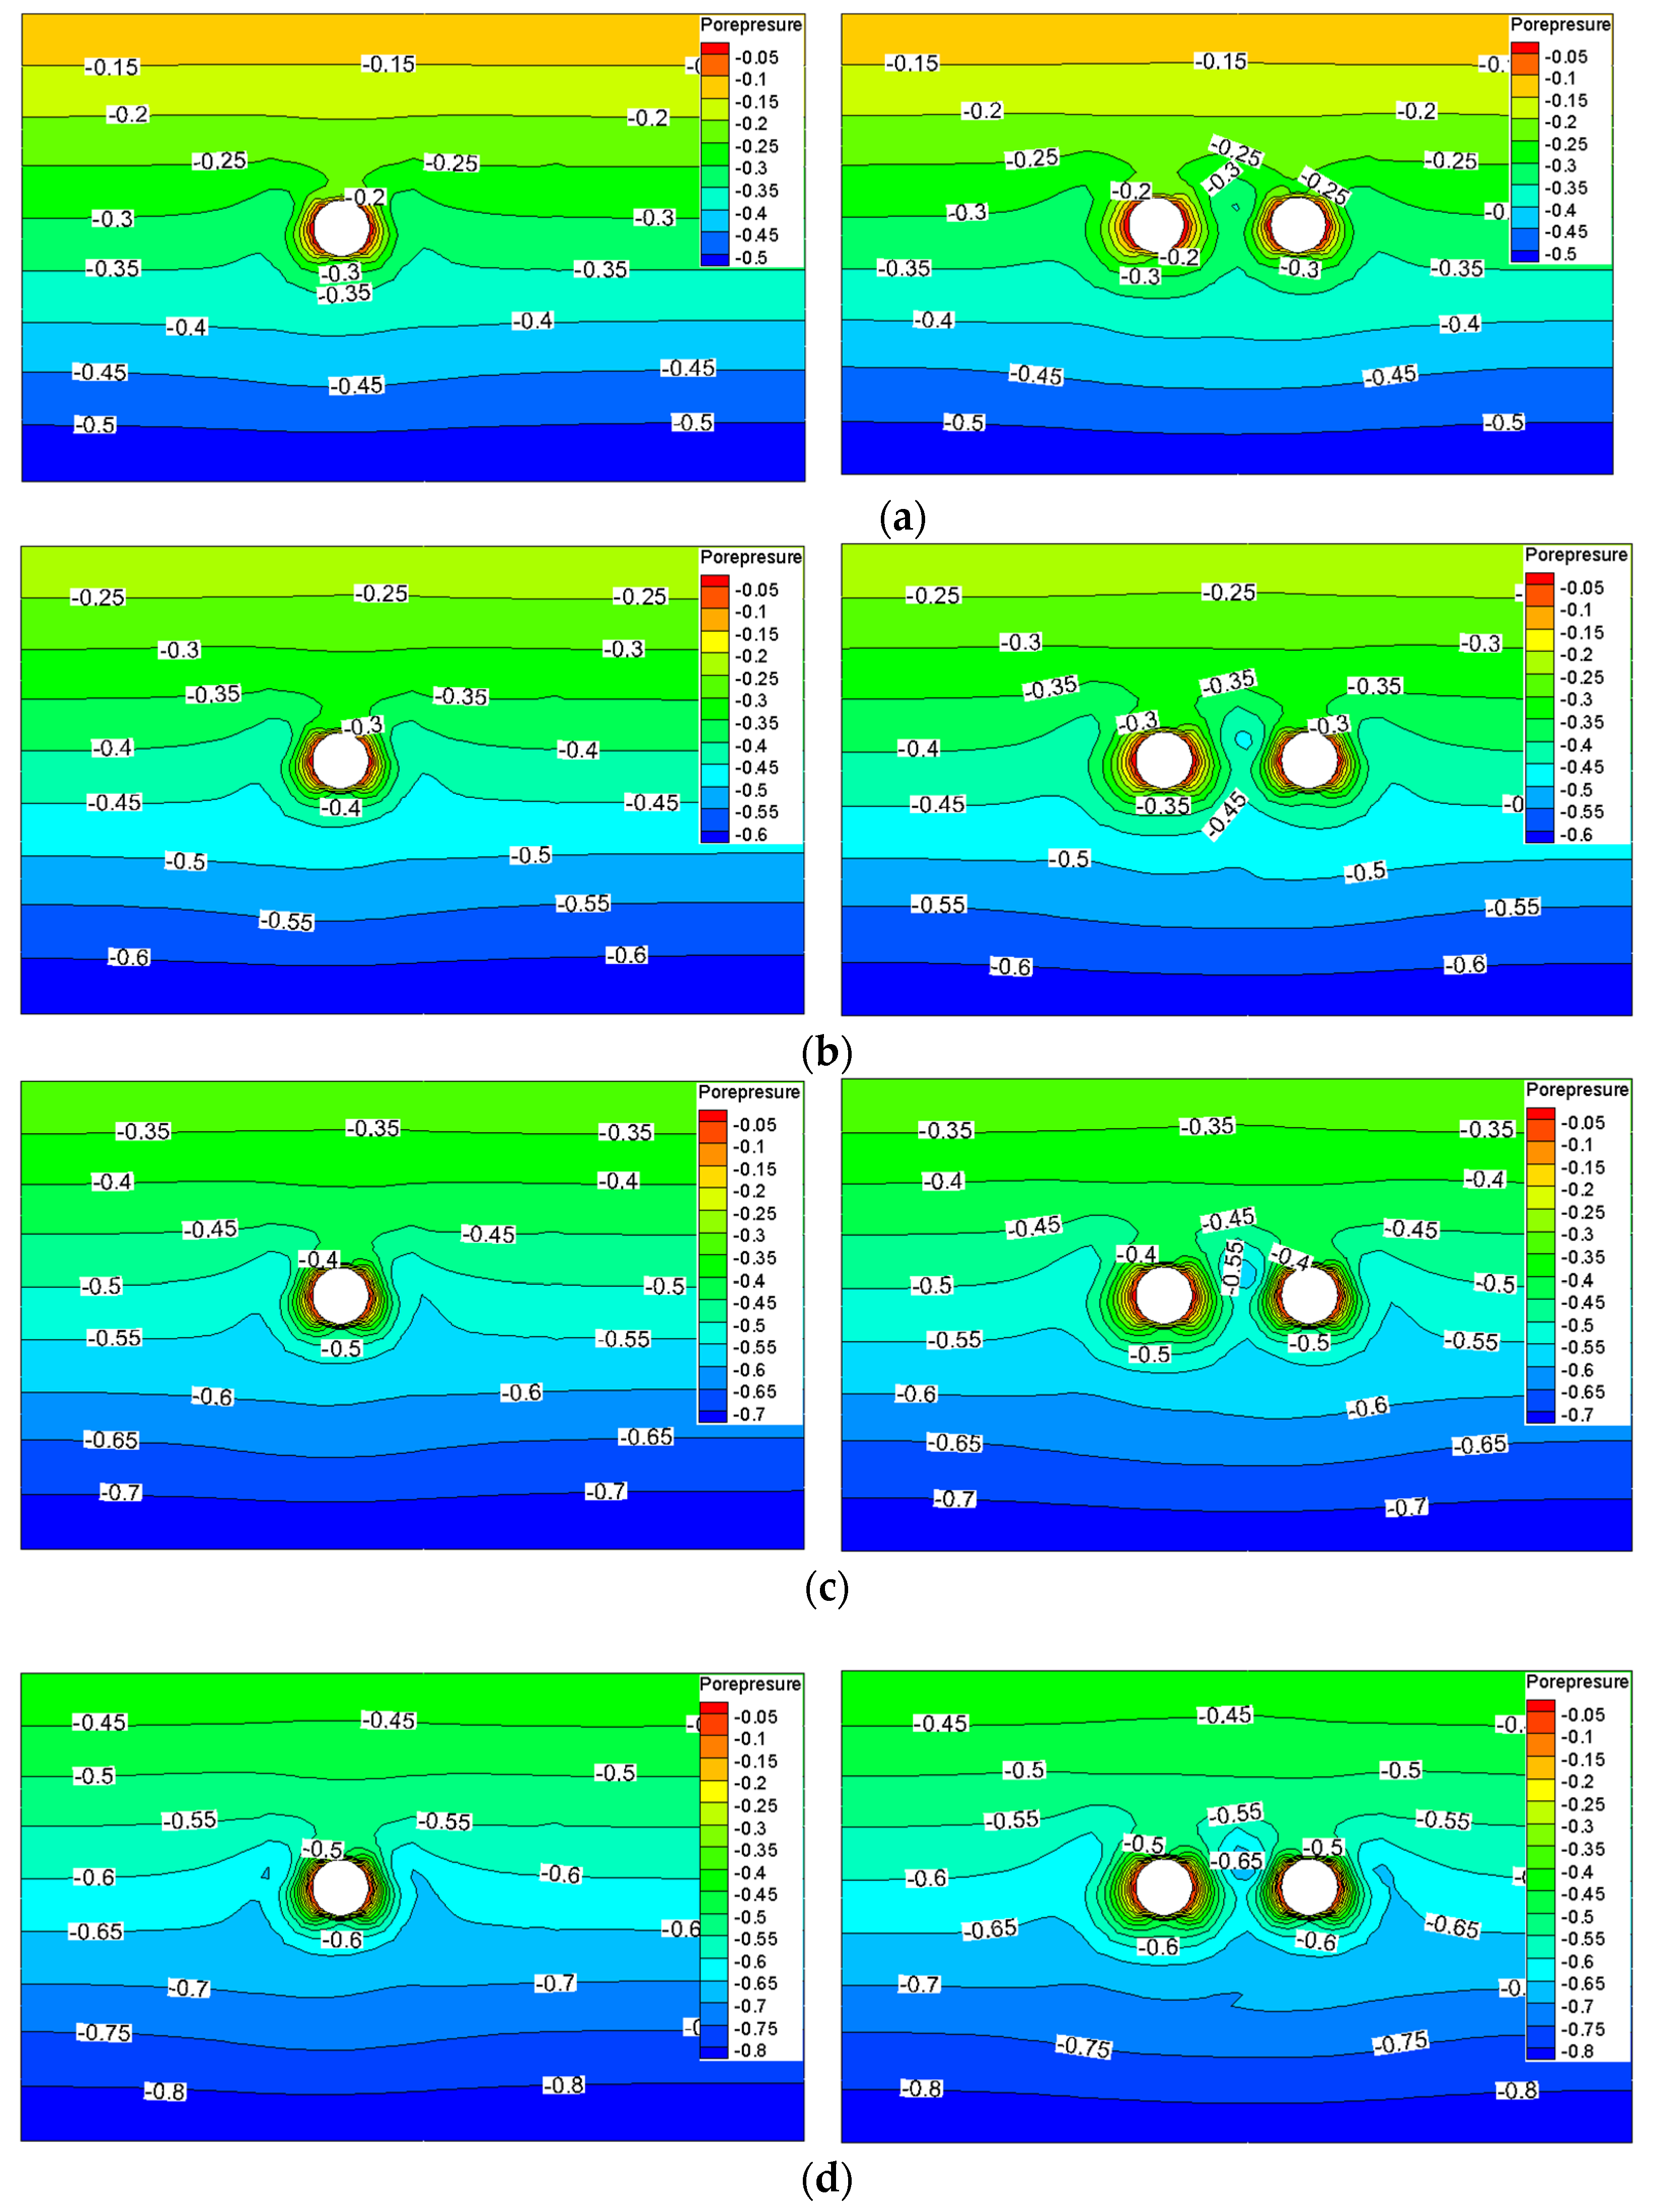
3.4.1. Distribution Law of Seepage Field of Surrounding Rock

Based on the numerical model established in Section 3.2, the shield tunnel construction process is simulated under four different overlying water levels of 10 m, 20 m, 30 m, and 40 m to investigate the distribution of the seepage field in the surrounding rock and the deformation of the lining segment structure. The calculation results are shown in Figure 11.
It can be seen from Figure 11 that, after asynchronous excavation of the tunnel under different overlying water level conditions, the distribution of the seepage field of the surrounding rock is more or less the same, and a pore pressure distribution similar to that of a funnel shape is formed in the tunnel periphery. Furthermore, under the four overlying water level conditions of 10 m, 20 m, 30 m, and 40 m, the pore water pressure of the tunnel grouting ring changes within the range of 0.05–0.2 MPa, 0.05–0.3 MPa, 0.05–0.4 MPa, and 0.05–0.5 MPa. The larger the head pressure is, the more the pore water pressure of the surrounding rock increases. At the same time, the hydraulic gradient of both sides of the tunnel arch waist changes exceptionally significantly. This is similar to the findings reported by Fu et al. [44] and Ying et al. [45] that, when the underwater shield tunnel undergoes excavation, the groundwater flow converges toward the tunnel excavation surface. The hydraulic gradient near the tunnel excavation surface increases with the increased water level. Therefore, the increase in water level leads to more vital seepage force, which is why the water pressure and surface settlement outside the segment increase with the increase in water depth.

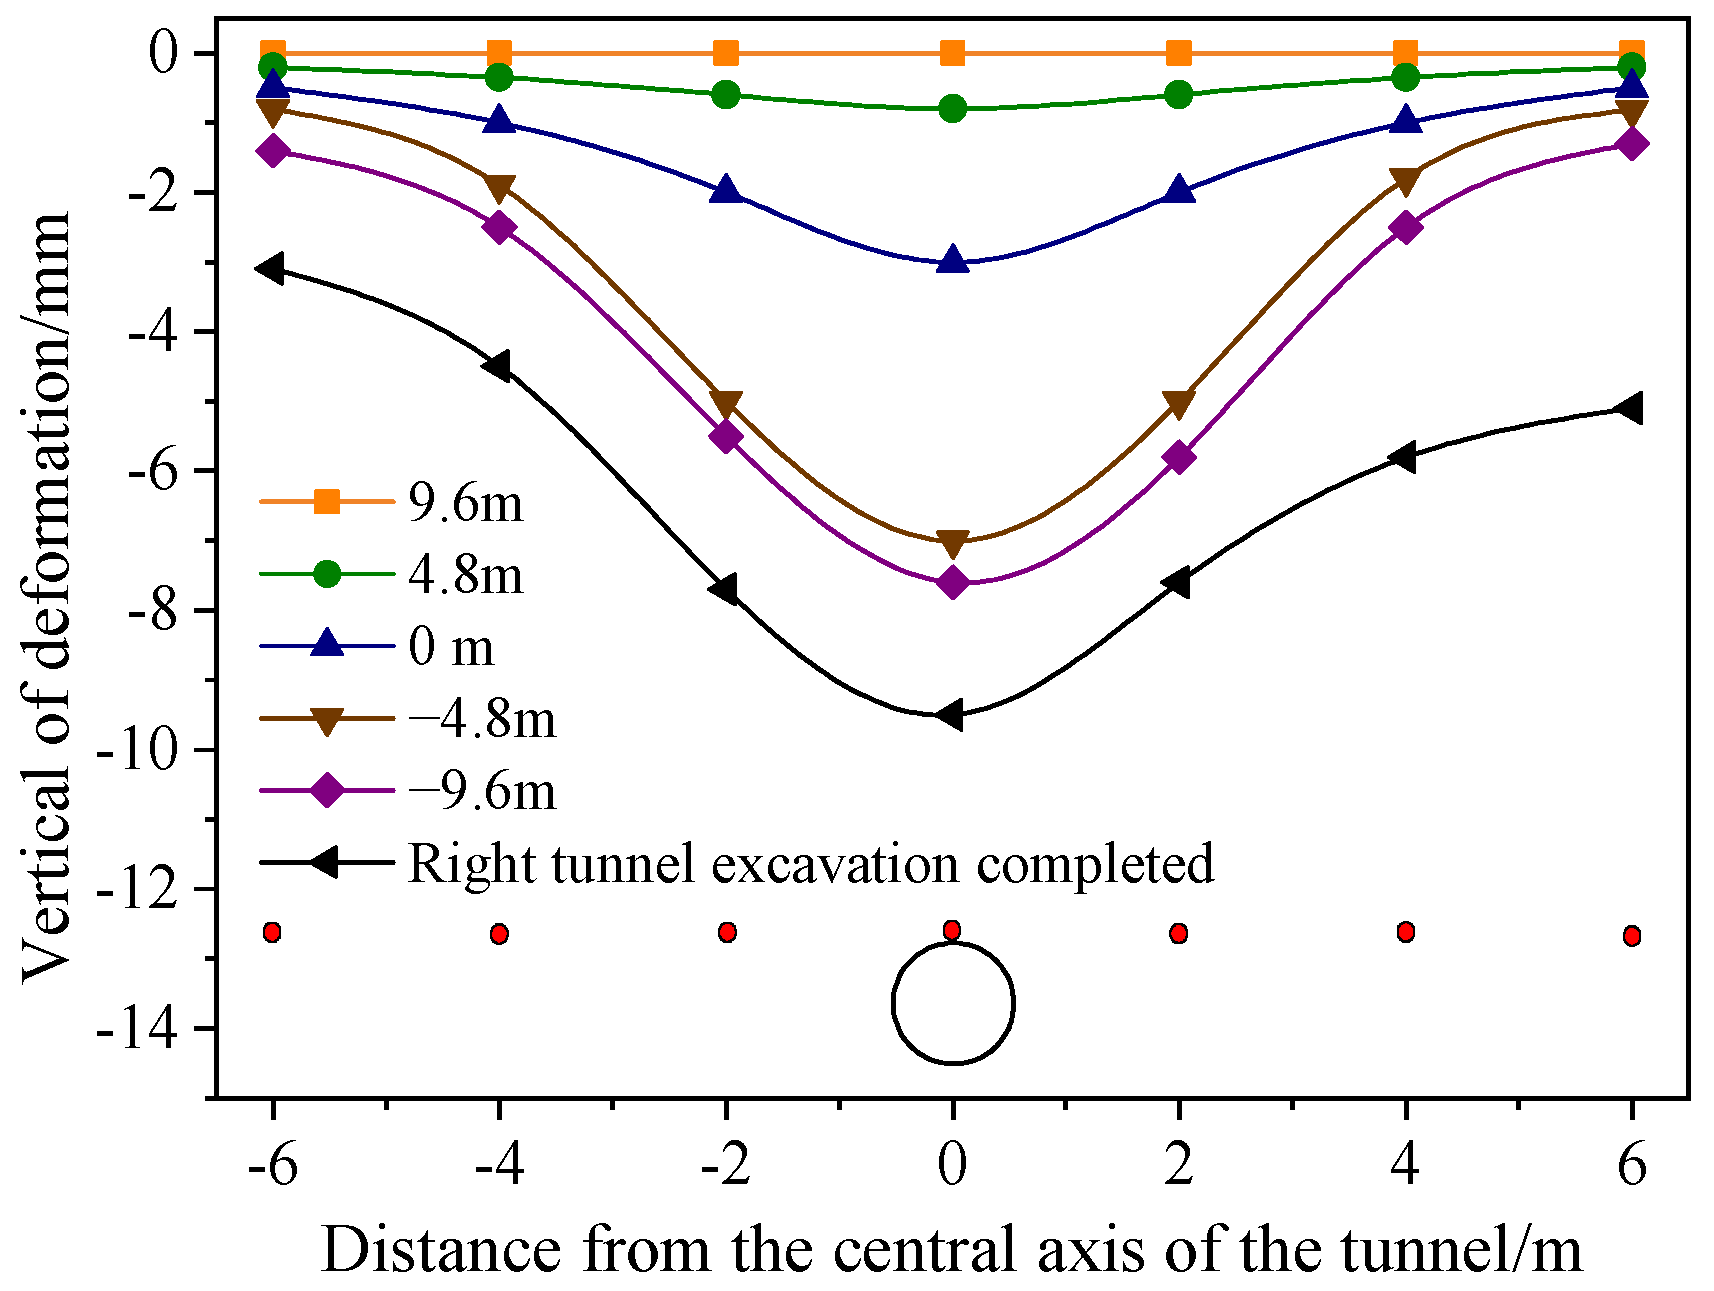
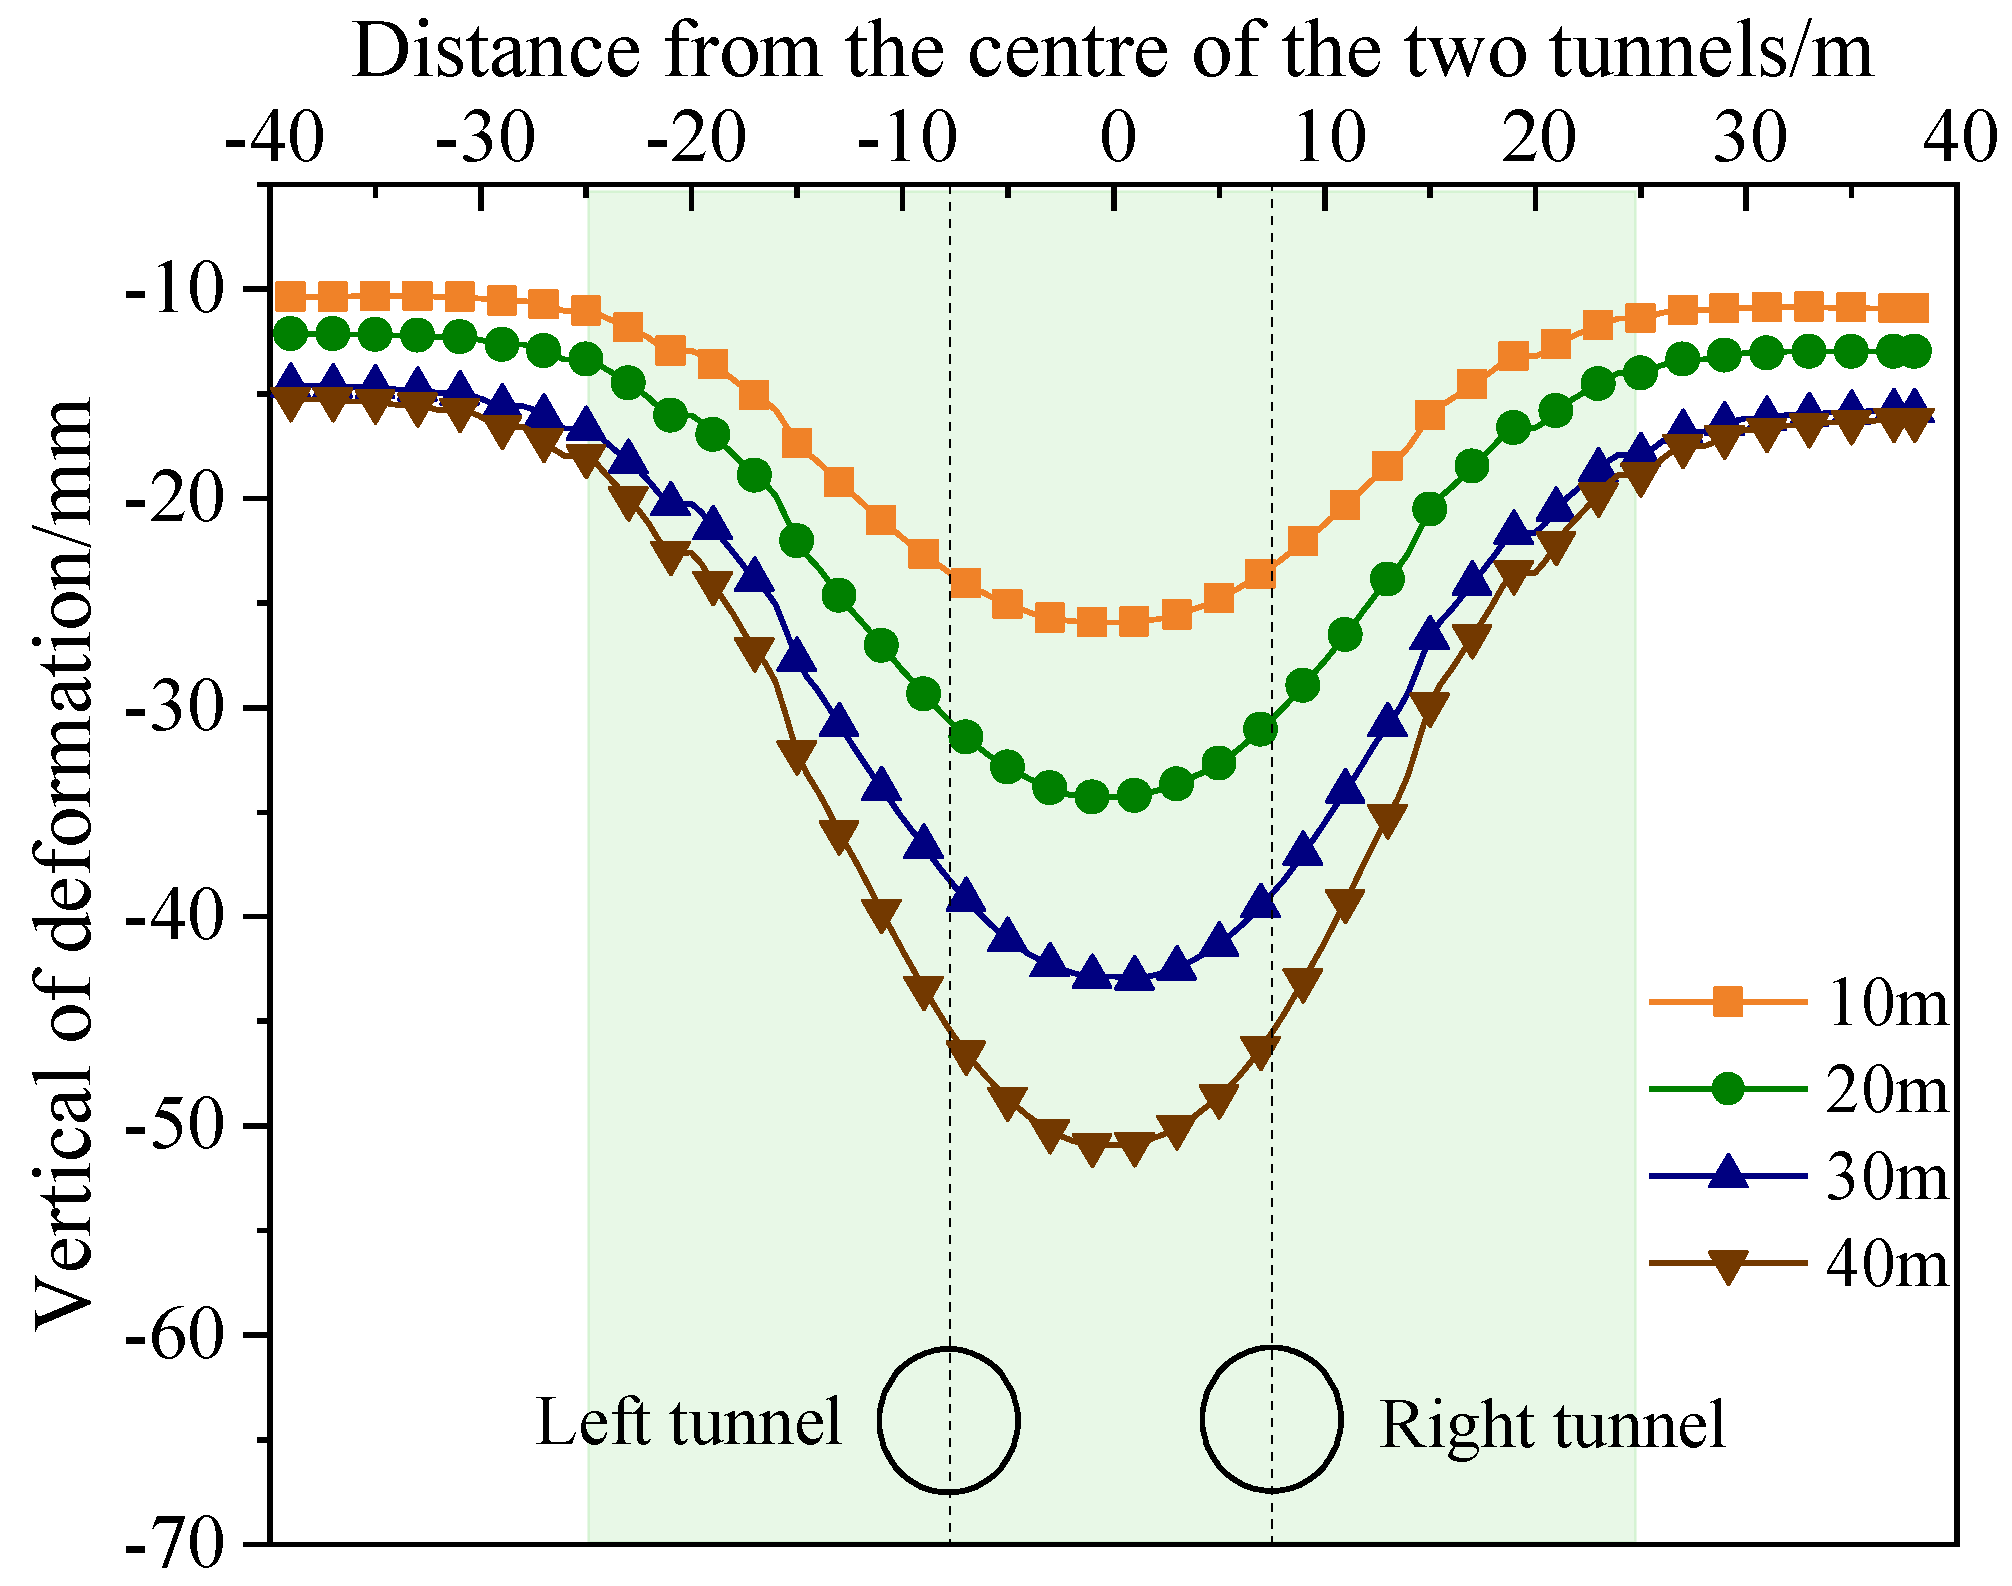
3.4.2. Surface Settlement

The surface settlement groove curves for shield tunnel excavation at different overlying water levels are presented in Figure 12. It can be found that, when the overlying water depth is 10 m, 20 m, 30 m, and 40 m, the distribution shape of surface settlement trough is more or less the same, and the widths of the settlement grooves are close. Furthermore, the influence range of surface settlement is about 8.0 D, and the maximum values of the surface settlement are 25.92 mm, 34.27 mm, 42.86 mm, and 50.90 mm, respectively. The deeper the overlying water, the greater the maximum value of the surface settlement and the influence range of settlement, and there is still 10–15 mm of settlement on the surface beyond the surface settlement groove. Moreover, the deeper the overlying water, the greater the dynamic water pressure, and, the more extent the decrease in pore water pressure around the segments after tunneling excavation, the more excellent the dissipation of the high pore water pressure, which will lead to a larger consolidation settlement of the surface.

4. Conclusions

Based on the study of underwater shield tunnel excavation under high hydraulic pressure seepage, the following conclusions can be drawn:
(1)
After shield excavation, the late consolidation settlement of the soil under seepage is enormous, accounting for about 25% of the total settlement, and the later tunnel will further enhance the seepage around the first tunnel.
(2)
During the construction of the underwater shield, the pore water pressure on both sides of the tunnel arch and arch waist is reduced by about 72% and 30%, respectively, compared with the initial value and requiring focused monitoring of the tunnel arch girdle area.
(3)
Within a specific range, increasing the digging pressure and grouting pressure and reducing the thickness of the grouting layer can effectively control the vertical deformation of the segment, and reducing the grouting stress and thickness of the grouting layer can effectively prevent the horizontal deformation of the segment.
(4)
The more prominent the overlying water level is, the more pronounced the seepage effect is, and the larger the maximum consolidation settlement and the influence range of the surface settlement. The influence of the water level on the force of the segment should be considered in the structural design of the segment.
In this paper, the results can provide a theoretical basis for the stability control of underwater shield tunnels. However, the numerical simulation results should be further validated against the experimental results. Therefore, further work should be conducted to study the reliability of the numerical calculation results.

Author Contributions

This work was conducted with collaboration of all authors. L.C.: conceptualization, writing—original draft, investigation, software, writing—review and editing. B.X.: conceptualization, software, formal analysis, funding acquisition, Writing—review and editing. Y.D., S.H. and Y.S.: conceptualization, methodology, supervision. Q.G., K.L. and N.Z.: conceptualization, methodology, supervision. All authors have read and agreed to the published version of the manuscript.

Funding

The authors acknowledge the financial support provided by the General Program of the National Natural Science Foundation of China (Grant no. 51874207).

Institutional Review Board Statement

Not applicable.

Informed Consent Statement

Not applicable.

Data Availability Statement

The datasets generated and/or analyzed during the current study are available from the corresponding author on reasonable request.

Conflicts of Interest

The authors declare no conflict of interest.

References

  1. Zhang, J.; Li, S.C.; Li, L.P.; Zhang, Q.Q.; Xu, Z.H.; Wu, J.; He, P. Grouting effects evaluation of water-rich faults and its engineering application in Qingdao Jiaozhou Bay Subsea Tunnel China. Geomech. Eng. 2017, 12, 35–52. [Google Scholar] [CrossRef]
  2. Qiu, D.H.; Cui, J.H.; Xue, Y.G.; Liu, Y.; Fu, K. Dynamic risk assessment of the subsea tunnel construction process: Analytical model. J. Mar. Environ. Eng. 2019, 10, 195–210. [Google Scholar]
  3. Wu, Z.; Zou, S.L. A static risk assessment model for underwater shield tunnel construction. Sādhanā 2022, 45, 215. [Google Scholar] [CrossRef]
  4. Huang, M.; Zhan, J.W. Face stability assessment for underwater tunneling across a fault zone. J. Perform. Constr. Facil. 2019, 33, 04019034. [Google Scholar] [CrossRef]
  5. Shi, J.; Wang, F.; Zhang, D.; Huang, H. Refined 3D modelling of spatial-temporal distribution of excess pore water pressure induced by large diameter slurry shield tunneling. Comput. Geotech. 2021, 137, 104312. [Google Scholar] [CrossRef]
  6. Xu, J.H.; He, C.; Xia, W.Y. Research on coupling seepage field and stress field analyses of underwater shield tunnel. Rock Soil Mech. 2009, 30, 3519–3522. (In Chinese) [Google Scholar]
  7. Zhang, S.L.; Cheng, X.S.; Qi, L. Face stability analysis of large diameter shield tunnel in soft clay considering high water pressure seepage. Ocean Eng. 2022, 253, 111283. [Google Scholar] [CrossRef]
  8. Shin, Y.J.; Song, K.I.; Lee, I.M.; Cho, G.C. Interaction between tunnel supports and ground convergence—Consideration of seepage forces. Int. J. Rock Mech. Min. Sci. 2011, 48, 394–405. [Google Scholar] [CrossRef]
  9. Lu, X.L.; Li, F.D.; Huang, M.S. Numerical Simulation of the Face Stability of Shield Tunnel under Tidal Condition. Geo-Shanghai 2014, 742–750. [Google Scholar] [CrossRef]
  10. Broere, W. On the face support of microtunnelling tbms. Tunn. Undergr. Space Technol. 2015, 46, 12–17. [Google Scholar] [CrossRef]
  11. Wang, L.; Han, K.; Xie, T.; Luo, J. Calculation of limit support pressure for EPB shield tunnel face in water-rich sand. Symmetry 2019, 11, 1102. [Google Scholar] [CrossRef]
  12. Hu, Q.X.; Wang, S.Y.; Qu, T.M.; Xu, T.; Huang, S.; Wang, H. Effect of hydraulic gradient on the permeability characteristics of foam-conditioned sand for mechanized tunnelling. Tunn. Undergr. Space Technol. 2020, 99, 103377. [Google Scholar] [CrossRef]
  13. Wang, Y.C.; Li, Z.Y.; Jing, H.W.; Li, Y.B.; Wang, M.T. Study on the seepage characteristics of deep buried tunnels under variable high-pressure water heads. Bull. Eng. Geol. Environ. 2021, 80, 1477–1487. [Google Scholar] [CrossRef]
  14. Wei, Z.D.; Zhu, Y.P. A theoretical calculation method of ground settlement based on a groundwater seepage and drainage model in tunnel engineering. Sustainability 2021, 13, 2733. [Google Scholar] [CrossRef]
  15. Di, Q.G.; Li, P.F.; Zhang, M.J.; Zhang, W.J.; Wang, X.Y. Analysis of face stability for tunnels under seepage flow in the saturated ground. Ocean Eng. 2022, 266, 112674. [Google Scholar]
  16. Cheng, X.; Zhang, S.; Qi, L.; Zhou, X. Fluid-solid coupling response of shield tunnel lining structure under high water pressure. Mar. Georesources Geotechnol. 2022, 40, 1151–1161. [Google Scholar] [CrossRef]
  17. Anagnostou, G.; Kovari, K. Face stability condition with earth pressure balanced shields. Tunn. Undergr. Space Technol. 1996, 11, 165–173. [Google Scholar] [CrossRef]
  18. Zhang, D.M.; Liu, Y.; Huang, H.W. Leakage-induced Settlement of Ground and Shield Tunnel in Soft Clay. J. Tong Ji Univ. (Nat. Sci.) 2013, 41, 1185–1190+1212. (In Chinese) [Google Scholar]
  19. Tang, Y.; Chan, D.H.; Zhu, D.Z. Analytical solution for steady-state groundwater inflow into a circular tunnel in anisotropic soils. J. Eng. Mech. 2018, 144, 06018003. [Google Scholar] [CrossRef]
  20. Chen, R.P.; Yin, X.S.; Tang, L.J.; Chen, Y.M. Centrifugal model tests of tunneling face failure under seepage flow. Rock Soil Mech. 2015, 36, 225–229. (In Chinese) [Google Scholar]
  21. Feng, Y.; Chen, Y.M. Experimental study on water gushing-sand bursting in shield tunnels based on transparent soil. Tunn. Constr. 2023, 43, 75. (In Chinese) [Google Scholar]
  22. Zhang, Z.G.; Mao, M.D.; Pan, Y.T.; Zhang, M.X.; Ma, S.K.; Cheng, Z.; Wu, Z. Experimental study for joint leakage process of tunnel lining and particle flow numerical simulation. Eng. Fail. Anal. 2022, 138, 106348. [Google Scholar]
  23. Lu, X.L.; Wang, H.R.; Huang, M.S. Upper bound solution for the face stability of shield tunnel below the water table. Math. Probl. Eng. 2014, 2014, 727964. [Google Scholar]
  24. Lü, X.L.; Zhao, Y.C.; Cai, J.T. Numerical Simulation of Ground Subsidence Induced by Shield Tunnel Construction Disturbance in Water-rich Sandy Stratum. Mod. Tunneling Technol. 2020, 57, 104–109. (In Chinese) [Google Scholar]
  25. Li, K.; Guo, Z.; Wang, L.Z.; Jiang, H.Y. Effect of seepage flow on shields number around a fixed and sagging pipeline. Ocean Eng. 2019, 172, 487–500. [Google Scholar]
  26. Wongsaroj, J.; Soga, K.; Mair, R.J. Tunnelling-induced consolidation settlements in london clay. Geotechnique 2013, 63, 1103–1115. [Google Scholar]
  27. Avgerinos, V.; Potts, D.M.; Standing, J. The use of kinematic hardening models for predicting tunnelling-induced ground movements in London clay. Géotechnique 2016, 66, 106–120. [Google Scholar]
  28. Li, W.; Afshani, A.; Akagi, H.; Oka, S. Influence of lining permeability and temperature on long-term behavior of segmented tunnel. Soils Found. 2020, 60, 425–438. [Google Scholar]
  29. Mitchell, J.K.; Soga, K. Fundamentals of Soil Behavior; Wiley: New York, NY, USA, 2005. [Google Scholar]
  30. Qiao, T.; Zhou, J.; Zhang, T.J.; Jiang, Y.C. Analytical Solution on Seepage Field of Underwater Non-circular Tunnel Considering Seepage Anisotropy. Adv. Eng. Sci. 2022, 26, 5328–5341. (In Chinese) [Google Scholar]
  31. Wu, Q.; Zhu, B.; Liu, S.Q. Flow-solid coupling simulation method analysis and time identification of lagging water-inrush near mine fault belt. Chin. J. Rock Mech. Eng. 2011, 30, 93–104. (In Chinese) [Google Scholar]
  32. Li, Z.; Luo, Z.J.; Xu, C.H.; Tan, J.Z. 3D fluid-solid full coupling numerical simulation of soil settlement induced by shield tunneling. Tunn. Undergr. Space Technol. 2019, 90, 174–182. [Google Scholar] [CrossRef]
  33. Wu, Z.S.; Liu, X.R.; Liang, B.; Zhong, Z.L. Study of seepage property and calculated watershed around underwater tunnels. Chin. J. Rock Mech. Eng. 2014, 33, 2402–2408. (In Chinese) [Google Scholar]
  34. Yang, F. Surface subsidence characteristic and control technology of subway tunnel construction in saturated loess. Master’s Thesis, Xi’an University of Science Technology, Xi’an, China, 2017. [Google Scholar]
  35. Zhu, C.H.; Li, N. Prediction and analysis of surface settlement due to shield tunneling for Xi’an Metro. Can. Geotech. J. 2017, 54, 529–546. [Google Scholar] [CrossRef]
  36. Zhu, C.; Wang, S.; Peng, S.; Song, Y. Surface Settlement in Saturated Loess Stratum during Shield Construction: Numerical Modeling and Sensitivity Analysis. Tunn. Undergr. Space Technol. 2022, 119, 104205. [Google Scholar] [CrossRef]
  37. Li, J.B.; Chen, J.; Luo, H.X.; Cheng, H.Z.; Hu, Z.F.; Huang, J.H.; Zhang, S.K. Study on surrounding soil deformation induced by twin shield tunneling based on random field theory. Chin. J. Rock Mechan. Eng. 2018, 37, 1748–1765. [Google Scholar]
  38. Qiu, M.M.; Yang, G.L.; Duan, J.Y.; Zhang, P.R. Evolution rules and numerical simulation of stratum deformation induced by close-spaced twin tunnels shield construction. J. Nat. Disasters 2021, 30, 60–69. [Google Scholar]
  39. Niu, H.S.; Weng, X.L.; Yu, H.F.; Hu, J.B. Centrifugal test study on instability mode of shield tunnel excavation facein silty sand stratum under seepage. China Civ. Eng. J. 2020, 53, 99–104+118. (In Chinese) [Google Scholar]
  40. Wang, C.; Feng, K.; Dai, Z.C.; Wu, W.B.; Lin, H.; Chen, H.W. Study on the excavation face stability of small interval double-line earth pressure balance shield tunnel in water-rich stratum. Railw. Stand. Des. 2018, 62, 112–117+124. (In Chinese) [Google Scholar]
  41. Zhang, P.; Chen, R.; Wu, H.; Liu, Y. Ground settlement induced by tunneling crossing interface of water-bearing mixed ground: A lesson from Changsha, China. Tunn. Undergr. Space Technol. 2020, 96, 103224. [Google Scholar]
  42. Song, Z.; Ye, G.L.; Lei, H.; Wang, J.H. Key construction technologies for large river-crossing slurry shield tunnel: Case study. J. Aerosp. Eng. 2021, 34, 04020118. [Google Scholar]
  43. Liang, Y.; Jiang, K.; Gao, S.J.; Yin, Y.H. Prediction of Tunnelling Parameters for Underwater Shield Tunnels, Based on the GA-BPNN Method. Sustainability 2022, 14, 13420. [Google Scholar] [CrossRef]
  44. Fu, Y.; Zeng, D.; Xiong, H.; Li, X.; Chen, Y. Seepage effect on failure mechanisms of the underwater tunnel face via cfd–dem coupling. Comput. Geotech. 2022, 146, 104591. [Google Scholar] [CrossRef]
  45. Ying, H.; Zhu, C.; Gong, X. Tide-induced hydraulic response in a semi-infinite seabed with a subaqueous drained tunnel. Acta Geotech. 2018, 13, 149–157. [Google Scholar] [CrossRef]
Figure 1. Schematic diagram of the project area.
Sustainability 15 15581 g001
Figure 2. Three-dimensional numerical model.
Sustainability 15 15581 g002
Figure 3. Schematic diagram of the shield tunnel excavation process.
Sustainability 15 15581 g003
Figure 5. Displacement curves of tunnel vault and monitoring points on both sides.
Sustainability 15 15581 g005
Figure 6. Pore water pressure curve at monitoring points of the tunnel vault.
Sustainability 15 15581 g006
Figure 7. Cloud diagram of seepage field distribution in monitoring section A. (a) After the left tunnel is excavated through; (b) after the right tunnel is excavated through.
Sustainability 15 15581 g007
Figure 8. Deformation curves of the segment of the shield tunnel in the left line of monitoring section A under different tunneling pressures. (a) Vertical deformation; (b) horizontal deformation.
Sustainability 15 15581 g008
Figure 9. Deformation curves of the segment of the shield tunnel in the left line of monitoring section A under different grouting pressures. (a) Vertical deformation; (b) horizontal deformation.
Sustainability 15 15581 g009
Figure 10. Deformation curve of the segment of the left line shield tunnel in monitoring section A under different thicknesses of grouting layer. (a) Vertical deformation; (b) horizontal deformation.
Sustainability 15 15581 g010
Figure 11. Pore water pressure distribution in the tunnel surroundings after asynchronous tunnel excavation and penetration of the two-lane tunnel under different overlying water level conditions. (a) Overlying water depth 10 m; (b) overlying water depth 20 m; (c) overlying water depth 30 m; (d) overlying water depth 40 m.
Sustainability 15 15581 g011
Figure 12. Comparison of surface settlement trough curves.
Sustainability 15 15581 g012
Table 1. Physicomechanical parameters of soil body.
Floor NumberThickness
(m)
PorosityPermeability Coefficient (cm·s−1)Specific Weight
(kN/m3)
Elastic Modules (MPa)Cohesion (kPa)Poisson’s RatioFriction Angle
(°)
VerticalLevel
2-43.10.3862.69 × 10−46.37 × 10−420126.780.2535.8
2-3-17.10.4181.72 × 10−62.91 × 10−619.79.310.90.3117.9
2-2-12.20.4561.65 × 10−72.72 × 10−719.311.522.20.3410.7
2-48.70.3862.69 × 10−46.37 × 10−420126.780.2535.8
2-510.50.3638.01 × 10−41.89 × 10−320.4108.530.2935.9
2-3-36.70.4181.55 × 10−62.34 × 10−619.87.611.60.314.7
3-67.70.3199.61 × 10−42.26 × 10−320.410.0313.60.2832.58
Disclaimer/Publisher’s Note: The statements, opinions and data contained in all publications are solely those of the individual author(s) and contributor(s) and not of MDPI and/or the editor(s). MDPI and/or the editor(s) disclaim responsibility for any injury to people or property resulting from any ideas, methods, instructions or products referred to in the content.

