Article

Analysis of Key Injury-Causing Factors of Object Strike Incident in Construction Industry Based on Data Mining Method

Department of Safety Engineering, School of Geology Engineering and Geomatics, Chang’an University, Xi’an 710000, China
*
Author to whom correspondence should be addressed.
Sustainability 2023, 15(21), 15609; https://doi.org/10.3390/su152115609
Submission received: 4 August 2023 / Revised: 24 September 2023 / Accepted: 27 October 2023 / Published: 3 November 2023

Abstract

:
Incidents are caused by a variety of factors, and there are correlations between incident causative factors. How to effectively clarify the importance of incidental injury-causing factors and their correlations is the current technical challenge in the field of incident causation analysis. This paper takes the study of injury-causing factors and their relationships between object-striking incidents in the process of construction as an example, and it statistically analyzes the incident investigation reports of 126 cases of object-striking incidents in construction projects in China from 2016 to 2022; it screens out 52 categories of incident-causing factors. The Apriori algorithm and FP-growth algorithm are used to data mine the influencing factors obtained from the 126 object-striking incidents: 28 main incident causative items of object-striking incidents and the respective correlation degree between each factor are obtained. By analyzing the support degree of the main incident causation items, as well as comparing and analyzing the results of the incident causation support degree and association rules with Bayesian inference, 9 key injury-causing factors of object-striking incidents are identified. The research results put forward a new research idea for the analysis of the injury factors of object-striking incidents in construction, which can provide theoretical reference for improving the pertinence and effectiveness of incident prevention measures.

1. Introduction

Incidents are the result of the joint actions of a variety of disaster-causing factors. Incident causation fundamentally reveals the causal relationships between the occurrence of work-related incidents, with some causes having a direct relationship with the outcome of the incident and some having an indirect relationship with the outcome of the incident; in general, it is not the individual factors that cause safety incidents, but rather the interaction of multiple unfavorable factors at the same time, as well as the space that contributes to the occurrence of safety incidents. The study of incident causation includes a series of incident causation theories. The incident causal chain theory suggests that there is a chain relationship between incident causation, which includes five factors: genetic and social–environmental factors, human shortcomings, unsafe human behavior or the unsafe state of objects, incidents, and injuries [1]. Trajectory crossover theory suggests that multiple safety risk factors interact to produce “unsafe human behaviors” and “unsafe physical conditions”, thus resulting in incidents. Incident causation theory generally holds that a safety incident is a complex random event, which is affected by the interaction of multiple factors, and the main features include unsafe behavior, an unsafe state, technological backwardness, insufficient organizational and management capabilities, the lack of adaptation to the construction environment, etc. [2].
The construction industry supports the development of the national economy, and with the country’s investment in infrastructure construction, the acceleration of the urbanization construction process has promoted the rapid growth of construction projects [3]. Figure 1 shows the number of construction safety incidents and the number of fatalities in China from 2009 to 2018 [4]. Every incident involves the death of a production worker. As can be seen from Figure 1, before 2015, the number of construction safety incidents and the number of fatalities in China showed an overall decreasing trend. Between 2012 and 2014, the number of incidents and the number of fatalities increased slightly, thereby showing a small range of fluctuations. In 2015, the number of incidents and the number of fatalities decreased significantly. However, from 2015 to 2018, the number of incidents and fatalities rose sharply. In 2018, the number of incidents reached a total of 734, and the number of fatalities reached a total of 840; furthermore, the number of incidents and fatalities is still increasing. The number of incidents and fatalities is also increasing, which seriously restricts the sustainable development of the construction industry. Every member of the construction site for every object may become the main body of the incident. All aspects of the incident need to do a good job of ensuring prevention, which involves each part of the construction of interlocking, as well as the formation of a virtuous cycle of construction, so that the probability of construction incidents can be reduced to achieve safe production. There is a need to fundamentally improve the safety production environment of construction enterprises, enhance the safety awareness of employees at all levels, standardize the safety behavior of employees, and play a positive role in promoting the healthy and sustainable development of enterprises. The traditional “five major injuries” in the construction industry still constitute the main categories of construction incidents. Among them, as one of the high-incidence incidents in China’s construction production safety, object strikes have a high fatality and disability rate, wherein they account for 12% of all types of construction incidents [5], the high frequency of incidents, and rarely cause multiple casualties and other characteristics; therefore, object strikes are the main monitoring object of construction safety management. Figure 2 shows the proportion of object-strike incidents in China in recent years [4], which is second only to fall-from-height incidents. Therefore, to analyze and find out the causes of object-strike incidents, as well as to determine the relationships between the factors in order to take targeted preventive and curative measures, constitute an important part of preventing the occurrence of object-strike incidents. At present, the research on the incidental injuries occurring in the process of building construction has received more and more attention from many scholars, but the research on the classification of various injuries is not extensive; especially for the object-striking incidents, there are less relevant research data and literature.
On the foreign side, Haslam et al. [6] analyzed the causes of 100 incident reports, and it happened that factors such as the comprehensive quality of workers, the operating environment, the state of machinery, and the performance of the materials were more likely to lead to the occurrence of incidents; Mousa Jabbari [7] constructed an incident tree to mine incident information and found that inadequate construction site safety management was the key causal factor; Soliman [8] provides a brief analysis of the causes of building collapse in terms of site conditions before and after the building collapse, including the excavation support system, geology, soil, and rainfall; as well, see Peng et al. [9]. By analyzing the failure mechanism of reinforced structures in construction, it has been concluded that the failure mechanism is due to system instability; Dehong Zhou et al. [10] analyzed the types of incidents and the causes of incidents in the construction process from four aspects: personnel, objects, environment, and management; they conducted corresponding statistical analysis of the time distribution pattern of incidents and put forward preventive measures to prevent incidents from occurring, thereby providing reference for the construction industry to realize safe production; Seyed Shamseddin Alizadehf et al. [11] analyzed 37 influencing factors leading to falls from heights through Bayesian network modeling, and they concluded that the most important factors were noncompliance with safety instructions for working at heights and a lack of safety equipment for working at heights; Mistikoglu G et al. [12] used C5.0 and CHAID algorithms to construct a fault tree based on US Occupational Safety and Health Administration (OSHA) data, thus showing the rules for associations between the input and output variables for fall incidents; Hainan Chen [13] extracted 1161 reports of fall-from-height incidents from 2005 to 2015 from the OSHA database. A fault-tree-based risk prediction model was obtained to determine the severity of the fall-from-height incidents depending on the body part injured, the distance from the ground, and the type of work.
On the domestic front, Sun [14] adopted the “24” model to make a classified statistical analysis of the causes of object-strike incidents with respect to construction objects, and the author found that safety education, supervision, and management accounted for a relatively high proportion of incidents. Through the analysis of object-strike incidents, Cao [15] believes that clarifying crossoperation requirements, including ensuring safety responsibilities and strengthening supervision, are important measures to prevent object-strike incidents. Jia [16] believes that corresponding measures should be considered for the causes of object-strike incidents, and the current safety technical standards, norms, and regulations should be carefully implemented to reduce the incidence of object-strike incidents. Duan [17] proposed an FTA control analysis method based on comprehensive membership weight from the five aspects of “man, machine, environment, material and law”, as well as analyzed the influences of various factors on the incident, with the finding that the weight of unsafe behavior was the largest influencing factor. By reviewing the research results of object-strike incidents, it can be found that there is little research on the causes of incidents. Currently, there are mainly two kinds of research on object-strike incidents. One is to analyze individual incident cases and explore the causes of incidents in depth. The other is the statistical analysis of a large number of object-strike incident information to explore the characteristics of the incident. Typical incident case analysis can obtain detailed incident causes, but the subjectivity of the analysis process is strong, and the information of the incident case is not fully used. The statistical analysis of a large number of object-strike incident information can explore the characteristics of the time, type, and stage of the incident, but the analysis of the cause of the incident is not deep enough, and the suggestions put forward are not strong. These two methods are mostly done in isolation and fail to dig deep into the underlying data behind object strikes.
Data mining can use artificial intelligence, machine learning, statistics, artificial neural networks, and other technical methods to analyze data with inconsistent rules and high noise in order to dig out the potential relationship between the data to predict the behavioral trend of the analyzed object, which help to make decisions or to adjust the strategy. Using association rule algorithms, the laws of object-strike incident causation are mined in a quantitative way, which can reflect the interdependence and correlation between incident causation, and the classical data mining algorithms include the C4.5 algorithm, K-Means algorithm, Support Vector Machine, Plain Bayes, Apriori algorithm, FP-growth, and so on. Among them, the Apriori [18,19] algorithm and FP-growth [20] algorithm have advantages in that they are able to mine the potential association relationship of data. In this paper, based on the association rule mining algorithm of the data and through the data mining of a large number of incidents and their influencing factors, the key causal factors and their intercausal relationships have been found in order to provide some reference for the causal analysis of the object-striking incidents and their control measures.

2. Data Mining Algorithm

Data mining is a very important part of big data theory and application. Data mining is the process of extracting potentially useful information and knowledge from a large amount of incomplete, noisy, fuzzy, and random data. Data mining algorithms are broadly categorized into classification algorithms: the C4.5 algorithm is based on information theory and uses information entropy and information gain degree as the measure to achieve inductive classification of the data [21]; the Plain Bayesian algorithm is based on Bayes’ theorem with the assumption of conditional independence of features as the classification method [22]; Support Vector Machines (SVMs) [23] map the points of the low-dimensional space into the high-dimensional space so that they become linearly divided and then use the principle of linear division to determine classification boundaries; such an approach also includes the K Nearest Neighbor classification algorithm (KNN) and Adaboost. The K-Means algorithm, when given a set of samples, divides the sample set into K clusters according to the size of the distance between the samples; each object is assigned to the closest clustering center [24]; The EM maximum expectation algorithm is an algorithm used for finding the maximum likelihood estimates of parameters in a probabilistic model, where the probabilistic model relies on unobservable hidden variables. The Apriori algorithm, representing an association analysis algorithm, is used to mine embedded and unknown data relationships; it is centered on a recursive algorithm based on the idea of two-stage frequency sets [25]. The FP-Growth algorithm [26] falls into the same group and is used to efficiently discover frequent itemsets, but it cannot be used for discovering association rules, which compress the database that provides the frequent itemsets into a single tree of frequent patterns while still retaining the itemset association information in a partitioning strategy.

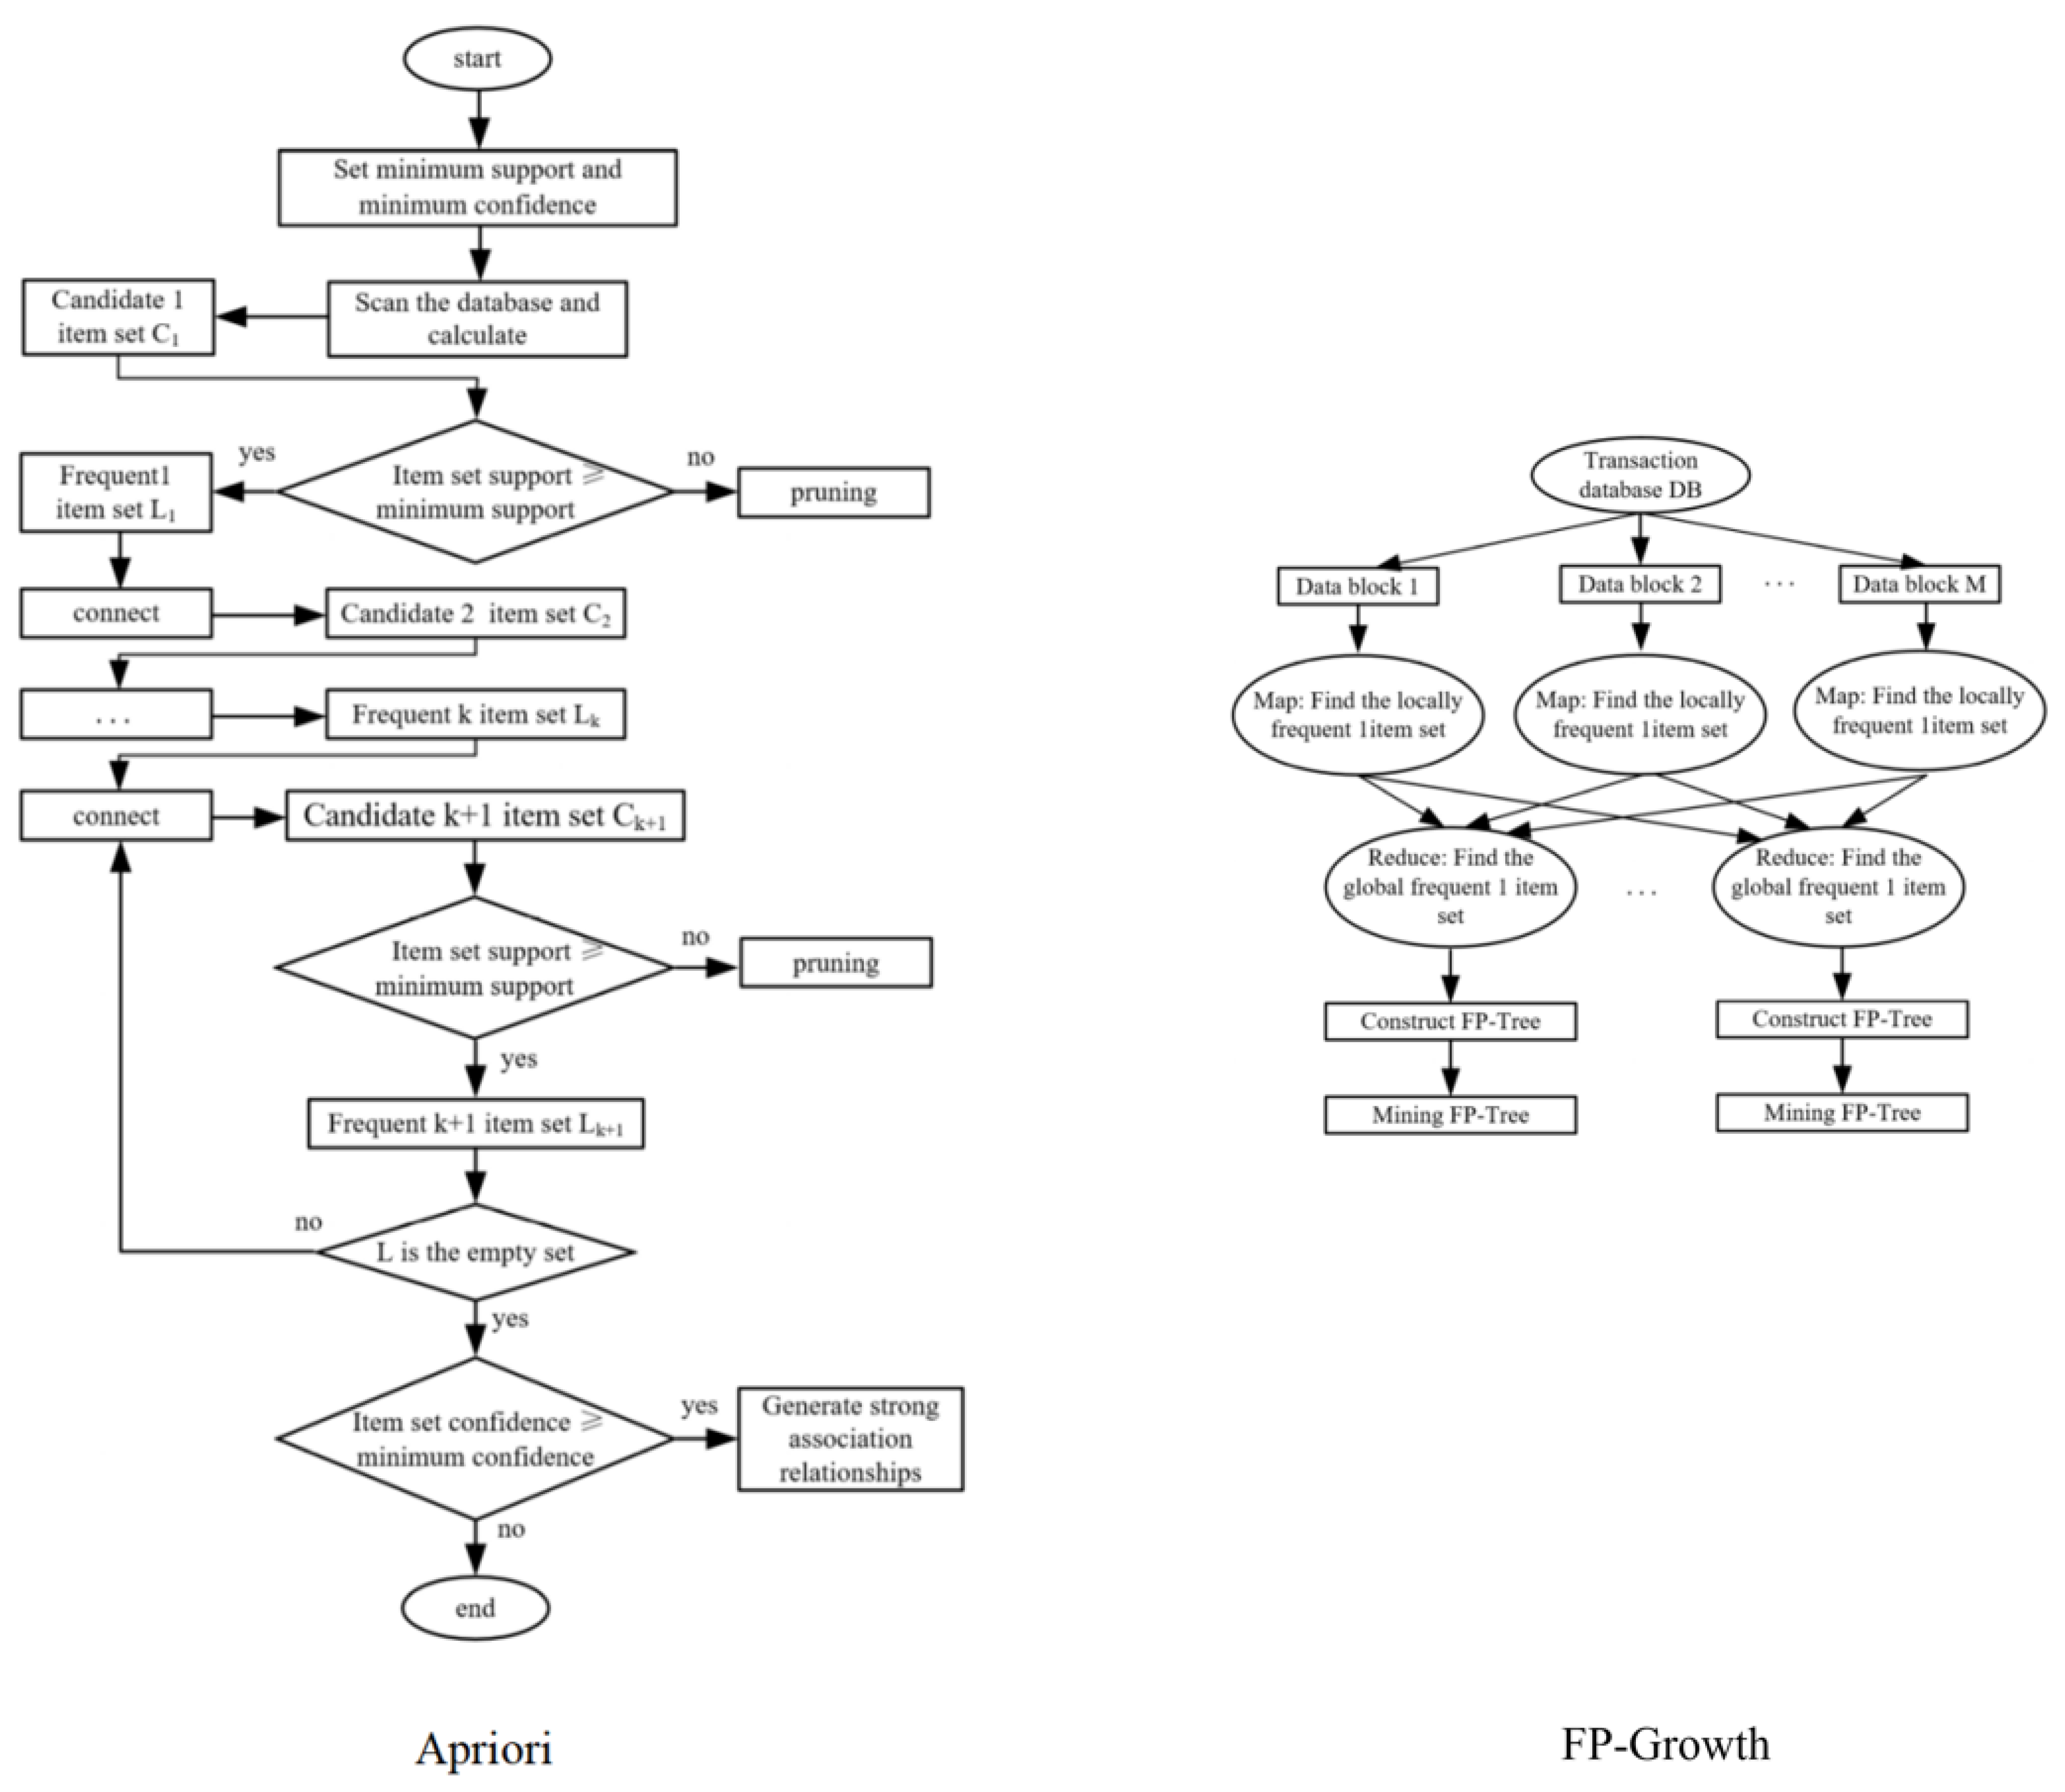
2.1. Apriori Algorithm

The Apriori algorithm is the classical data mining algorithm for mining frequent itemsets and association rules. It utilizes an iterative layer-by-layer search to find the relationships of itemsets in a database to form rules, and the process consists of concatenation (matrix-like operations) and pruning (removing those intermediate results that are not necessary) [27].
Supportability is a measure of the importance of an association rule and indicates the probability that an itemset occurs in all transactions at the same time; the support of itemsets A and B is the ratio of the number of items containing A and B to the number of all items:
S u p p o r t ( A , B ) = P ( A , B ) = n u m b e r ( A , B ) n u m b e r A L L  
Confidence is a measure of the accuracy of an association rule, which indicates the degree of confidence in the rule, that is, the conditional probability of the data; if the itemset A occurs with the same probability that B also occurs, then for the number of items that contain A and B related to the number of items that contain all of A, we have the following:
C o n f i d e n c e ( A , B ) = P ( B | A ) = n u m b e r ( A , B ) n u m b e r ( A )
Strong association rules are association rules that satisfy the minimum support and minimum confidence values.
Frequent itemsets involve the concept of an itemset, i.e., a collection of items. A set containing K items is a k-itemset. The frequency of occurrence of an itemset is the number of transactions that contain the itemset and is called the frequency of the itemset. If an item set satisfies the minimum support, it is said to be frequent [28].
Identifying or discovering all of the frequent itemsets constitutes the core of association rule discovery algorithms.

2.2. FP-Growth Algorithm

The FP-Growth algorithm is used to discover frequent itemsets efficiently; with respect to the Apriori algorithm, FP-Growth only updates the algorithm used for discovering frequent itemsets, and the mining of the association rules between data remains the same as for the Apriori algorithm [29].
The FP-Growth algorithm requires only two scans of the data, whereas the Apriori algorithm scans the dataset for each potentially frequent itemset to determine whether a given pattern is frequent or not, thereby making the FP-Growth algorithm faster than the Apriori algorithm.
The basic process of discovering frequent itemsets is as follows [30].

2.2.1. Constructing FP Tree

The first scan of the transaction database is used to collect frequent itemsets and count the frequency of occurrence of each itemset, thus removing the elemental items that do not satisfy the minimum support.
The second scan of the database is used to construct the FP tree. Each element item is read and added to a path that already exists, or a new path is created if the path does not exist. Before adding each transaction to the tree, each set sum needs to be sorted. The sorting is based on the absolute frequency of the occurrence of the elemental items from highest to lowest, wherein the sorting filters out infrequent items.

2.2.2. Mining Frequent Itemsets from the FP Tree

The FP-Growth algorithm stores data in a compact data structure called an FP tree. An FP trees connect similar elements by chains. An element item can appear multiple times in an FP tree. The FP tree stores the frequency of occurrence of an itemset, and each itemset is stored in the tree as a path. Sets where similar elements exist share a part of the tree. The tree bifurcates only when the sets are completely different from each other. The individual elements in the set and their occurrences in the sequence are given on the tree nodes, and the paths will give the number of occurrences in the sequence [31].

3. Extraction of Cause of Construction Object Strike Incident

3.1. Data Preprocessing

The incident investigation report describes the occurrence of the object-strike incident, the passage, the direct cause, and the indirect cause in detail, and it is released by the website of the State Administration of Work Safety, the State Ministry of Housing and Urban-Rural Development, and the relevant administrative departments of each province and city, which ensures its authenticity and reliability. From the above-mentioned ways, 126 cases of object-strike incident reports in construction were collected from 2016 to 2022, and they represent the coverage of major object-strike incidents across the country.
Through the 126 object-striking incident investigation reports, the direct and indirect causes of the incidents were extracted and merged, especially for the different incident investigation reports of the same cause with different expressions, which needed to be summarized and replaced; for example, “weak safety awareness”, “weak awareness”, “lack of safety awareness”, “weak awareness”, and other expressions were merged and processed as “weak safety awareness” in order to be analyzed [32]. We combined the classification of incident causes obtained from the field research on construction object-striking incidents by Duan in his “Research on Analysis and Control of Causes of Object Striking incidents in Construction”. Eventually, all 52 factors affecting incidents were collected and are shown in Table 1.
Subsequently, the incident causation items of the individual samples of 126 incidents collected were compared one by one with the secondary indicators in Table 1, and the sample data were formed as in Table 2 according to the order of the factors in the original incident cases. The complete data is shown in Appendix A.

3.2. Algorithm Model

The detailed steps for Apriori are as follows.
The first step is to scan the database (Table 2), calculate the degree of support from a single element, and screen out the frequent 1-item itemsets that satisfy the minimum support degree; the second step is to connect each element from these frequent 1-item sets to generate two-element candidate 2-item itemsets, calculate the support degree, and screen out the frequent 2-item itemsets; the third step is to go on and on until a new frequent 1-item itemset cannot be generated; the fourth step is to calculate the confidence, thus screening out the association relationship that meets the minimum confidence threshold [33]; step five involves traversing all the frequent itemsets from the fourth step of the operation; by step six, all the association relationships that meet the minimum support and the minimum confidence threshold, that is, the strong association rule, are acquired [34,35].
The algorithm flow chart is shown in Figure 3.
The workflow of the FP-Growth algorithm involves the following steps: first, build the FP tree and then use it to mine the frequent itemsets. To construct the FP tree, the original dataset needs to be scanned twice. The first pass parallelizes the support count on each node in each map node. According to the Apriori principle, i.e., if an element is infrequent, then the superset containing that element is also infrequent, so there is no need to consider these supersets. The first scan of the dataset is used to count the frequency of occurrences, wherein only the frequent elements are considered in the second scan [36,37].
The frequent itemset results obtained from mining the sample data using the Apriori algorithm and FP-Growth algorithm are shown in Figure 4.
The Apriori algorithm scans the database several times, and each time, it uses candidate frequent sets to generate frequent sets; FP-Growth, on the other hand, utilizes the tree structure to obtain frequent sets directly without generating candidate frequent sets, which greatly reduces the number of scans of the transaction database, thus improving the efficiency of the algorithm. Although the FP-Growth algorithm avoids generating the emergence of candidate itemsets, during the mining process, if the number of items of a particular itemset element is particularly large and the branches of the obtained FP tree are also large, the algorithm needs to construct a huge number of conditional trees, which will lead to inefficiency of the mining. By utilizing the Apriori algorithm and FP-Growth algorithm to mine the sample data, it was found that the resulting frequent itemsets obtained by the two algorithms were exactly the same, and the key to the discovery of association rules lay in the mining results of the frequent itemsets, which verified the authenticity of the obtained results. The sample data in this example do not have a large number of itemsets, so the FP-Growth algorithm could be used to generate frequent sets to improve the efficiency, and the Apriori algorithm could be used to generate the correlation results; the high-frequency set is shown in Figure 4 for easy comparison with the correlation results.

4. Correlation Result Analysis

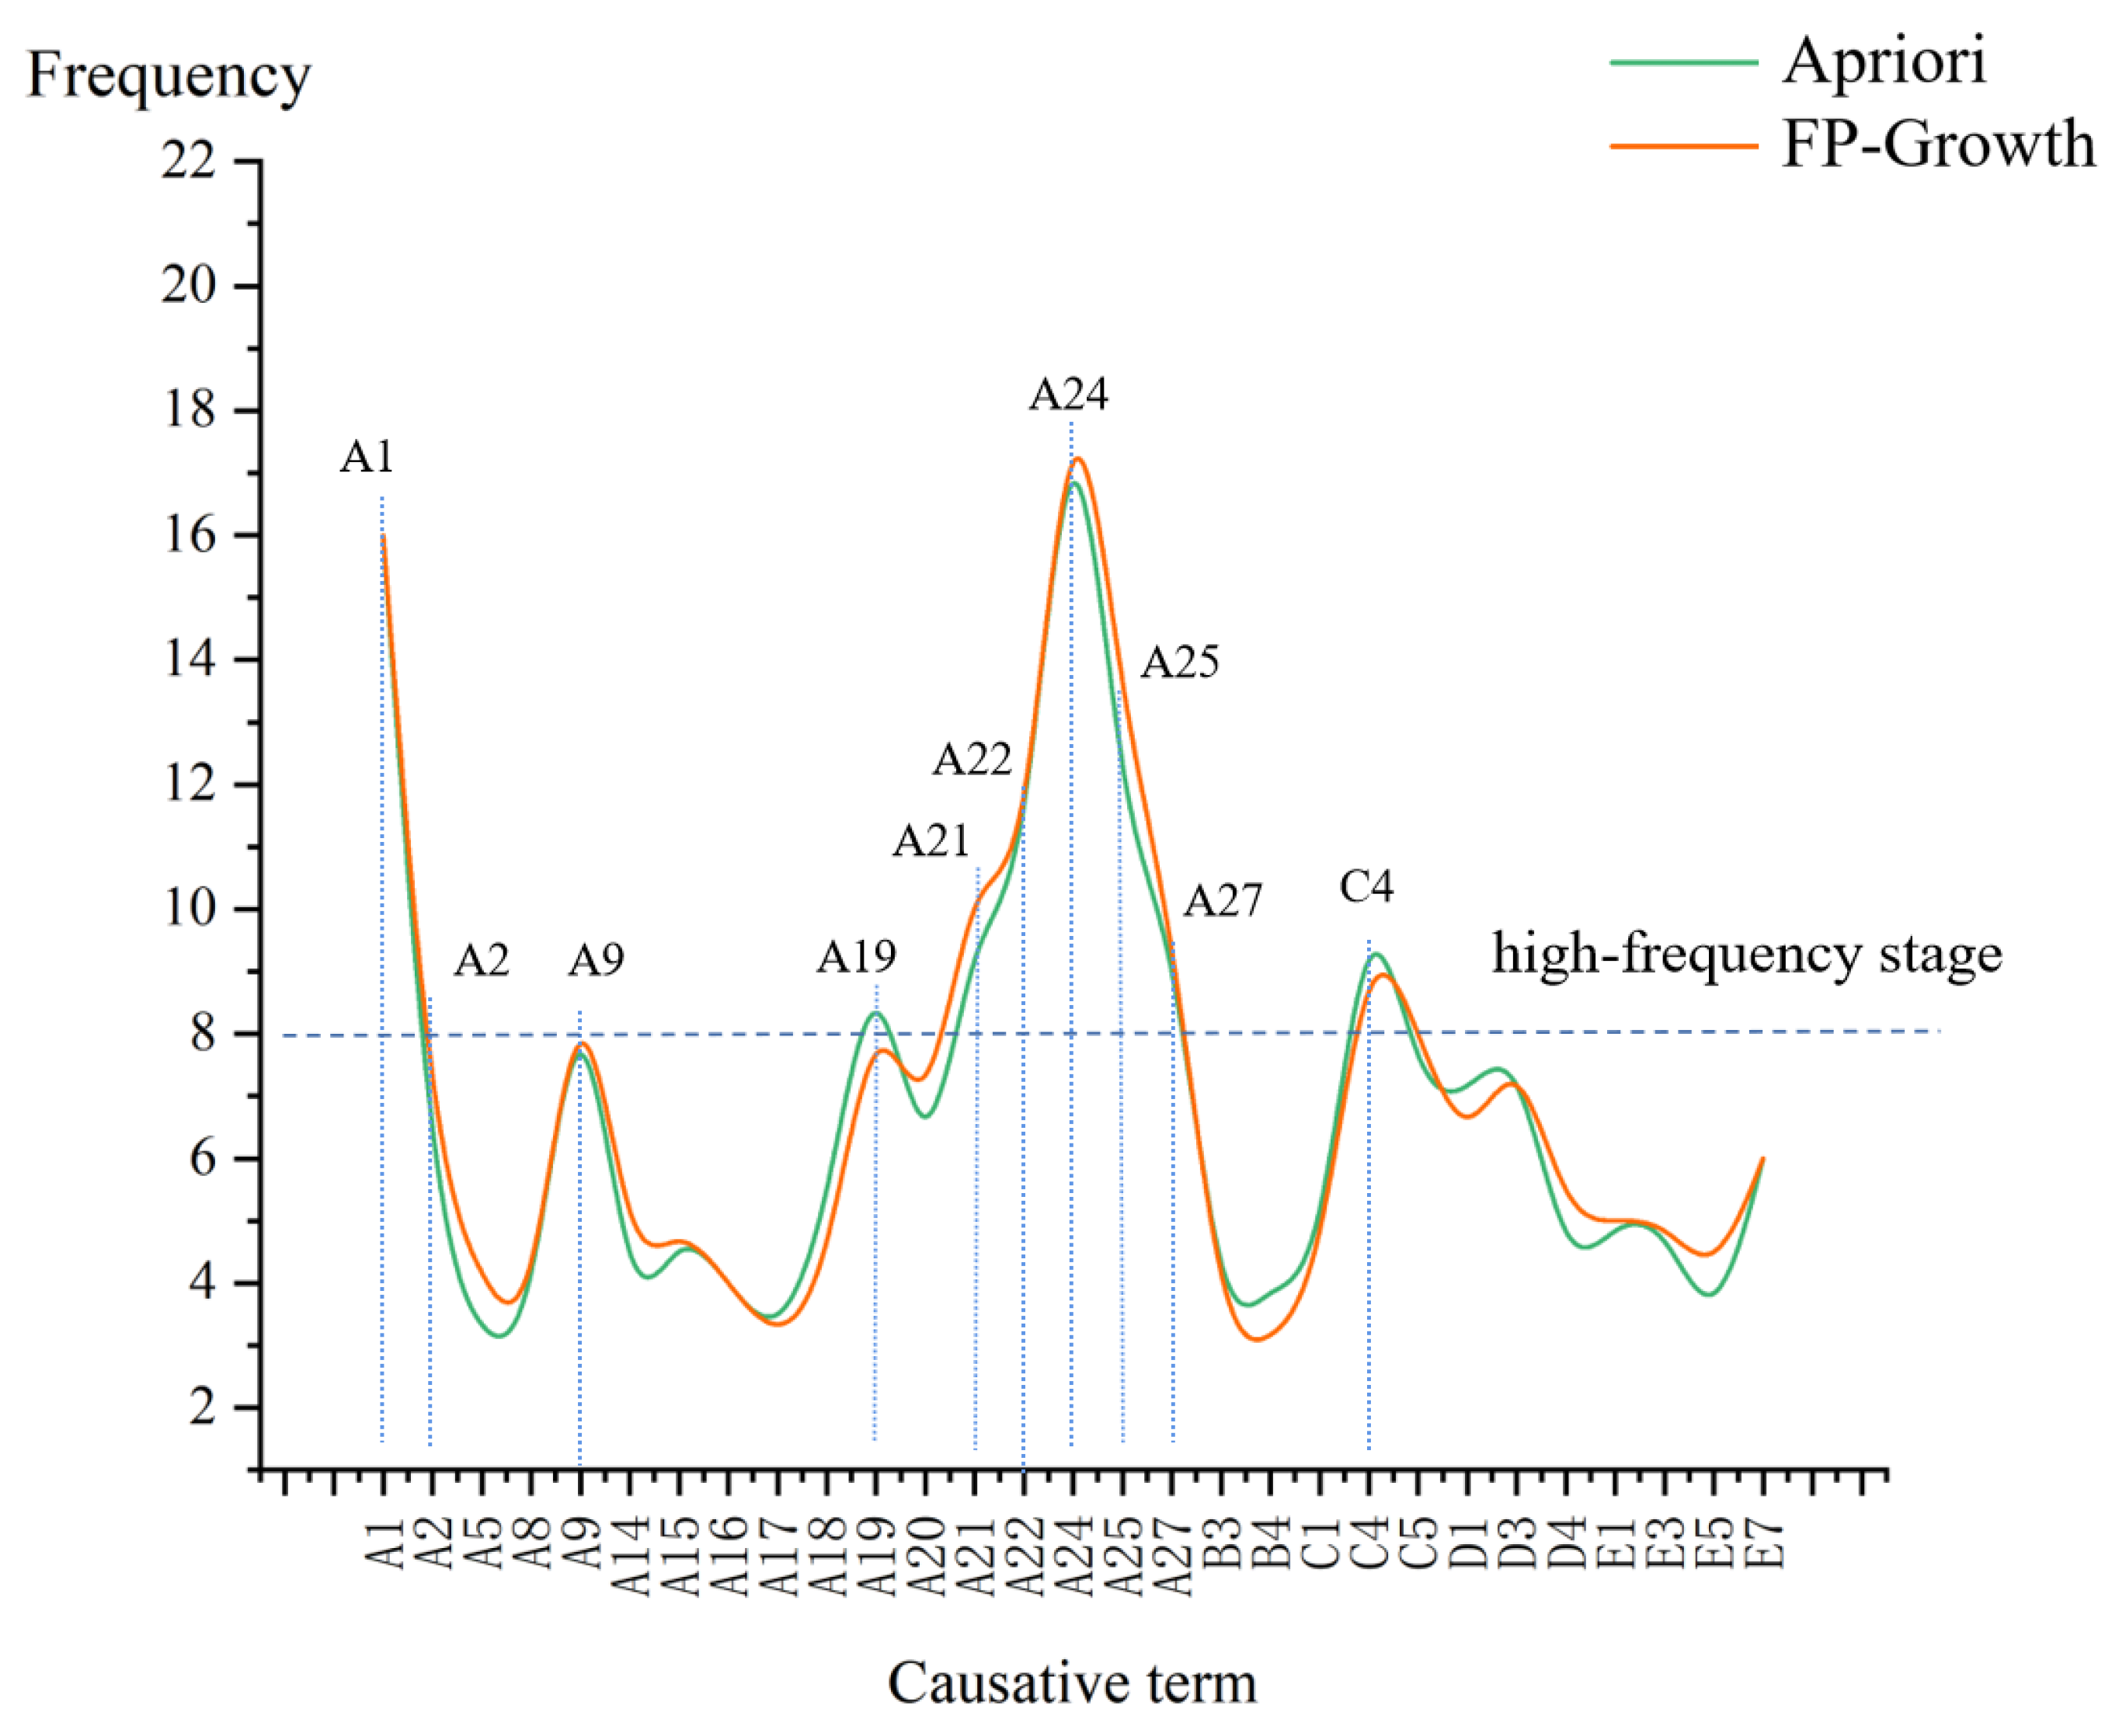
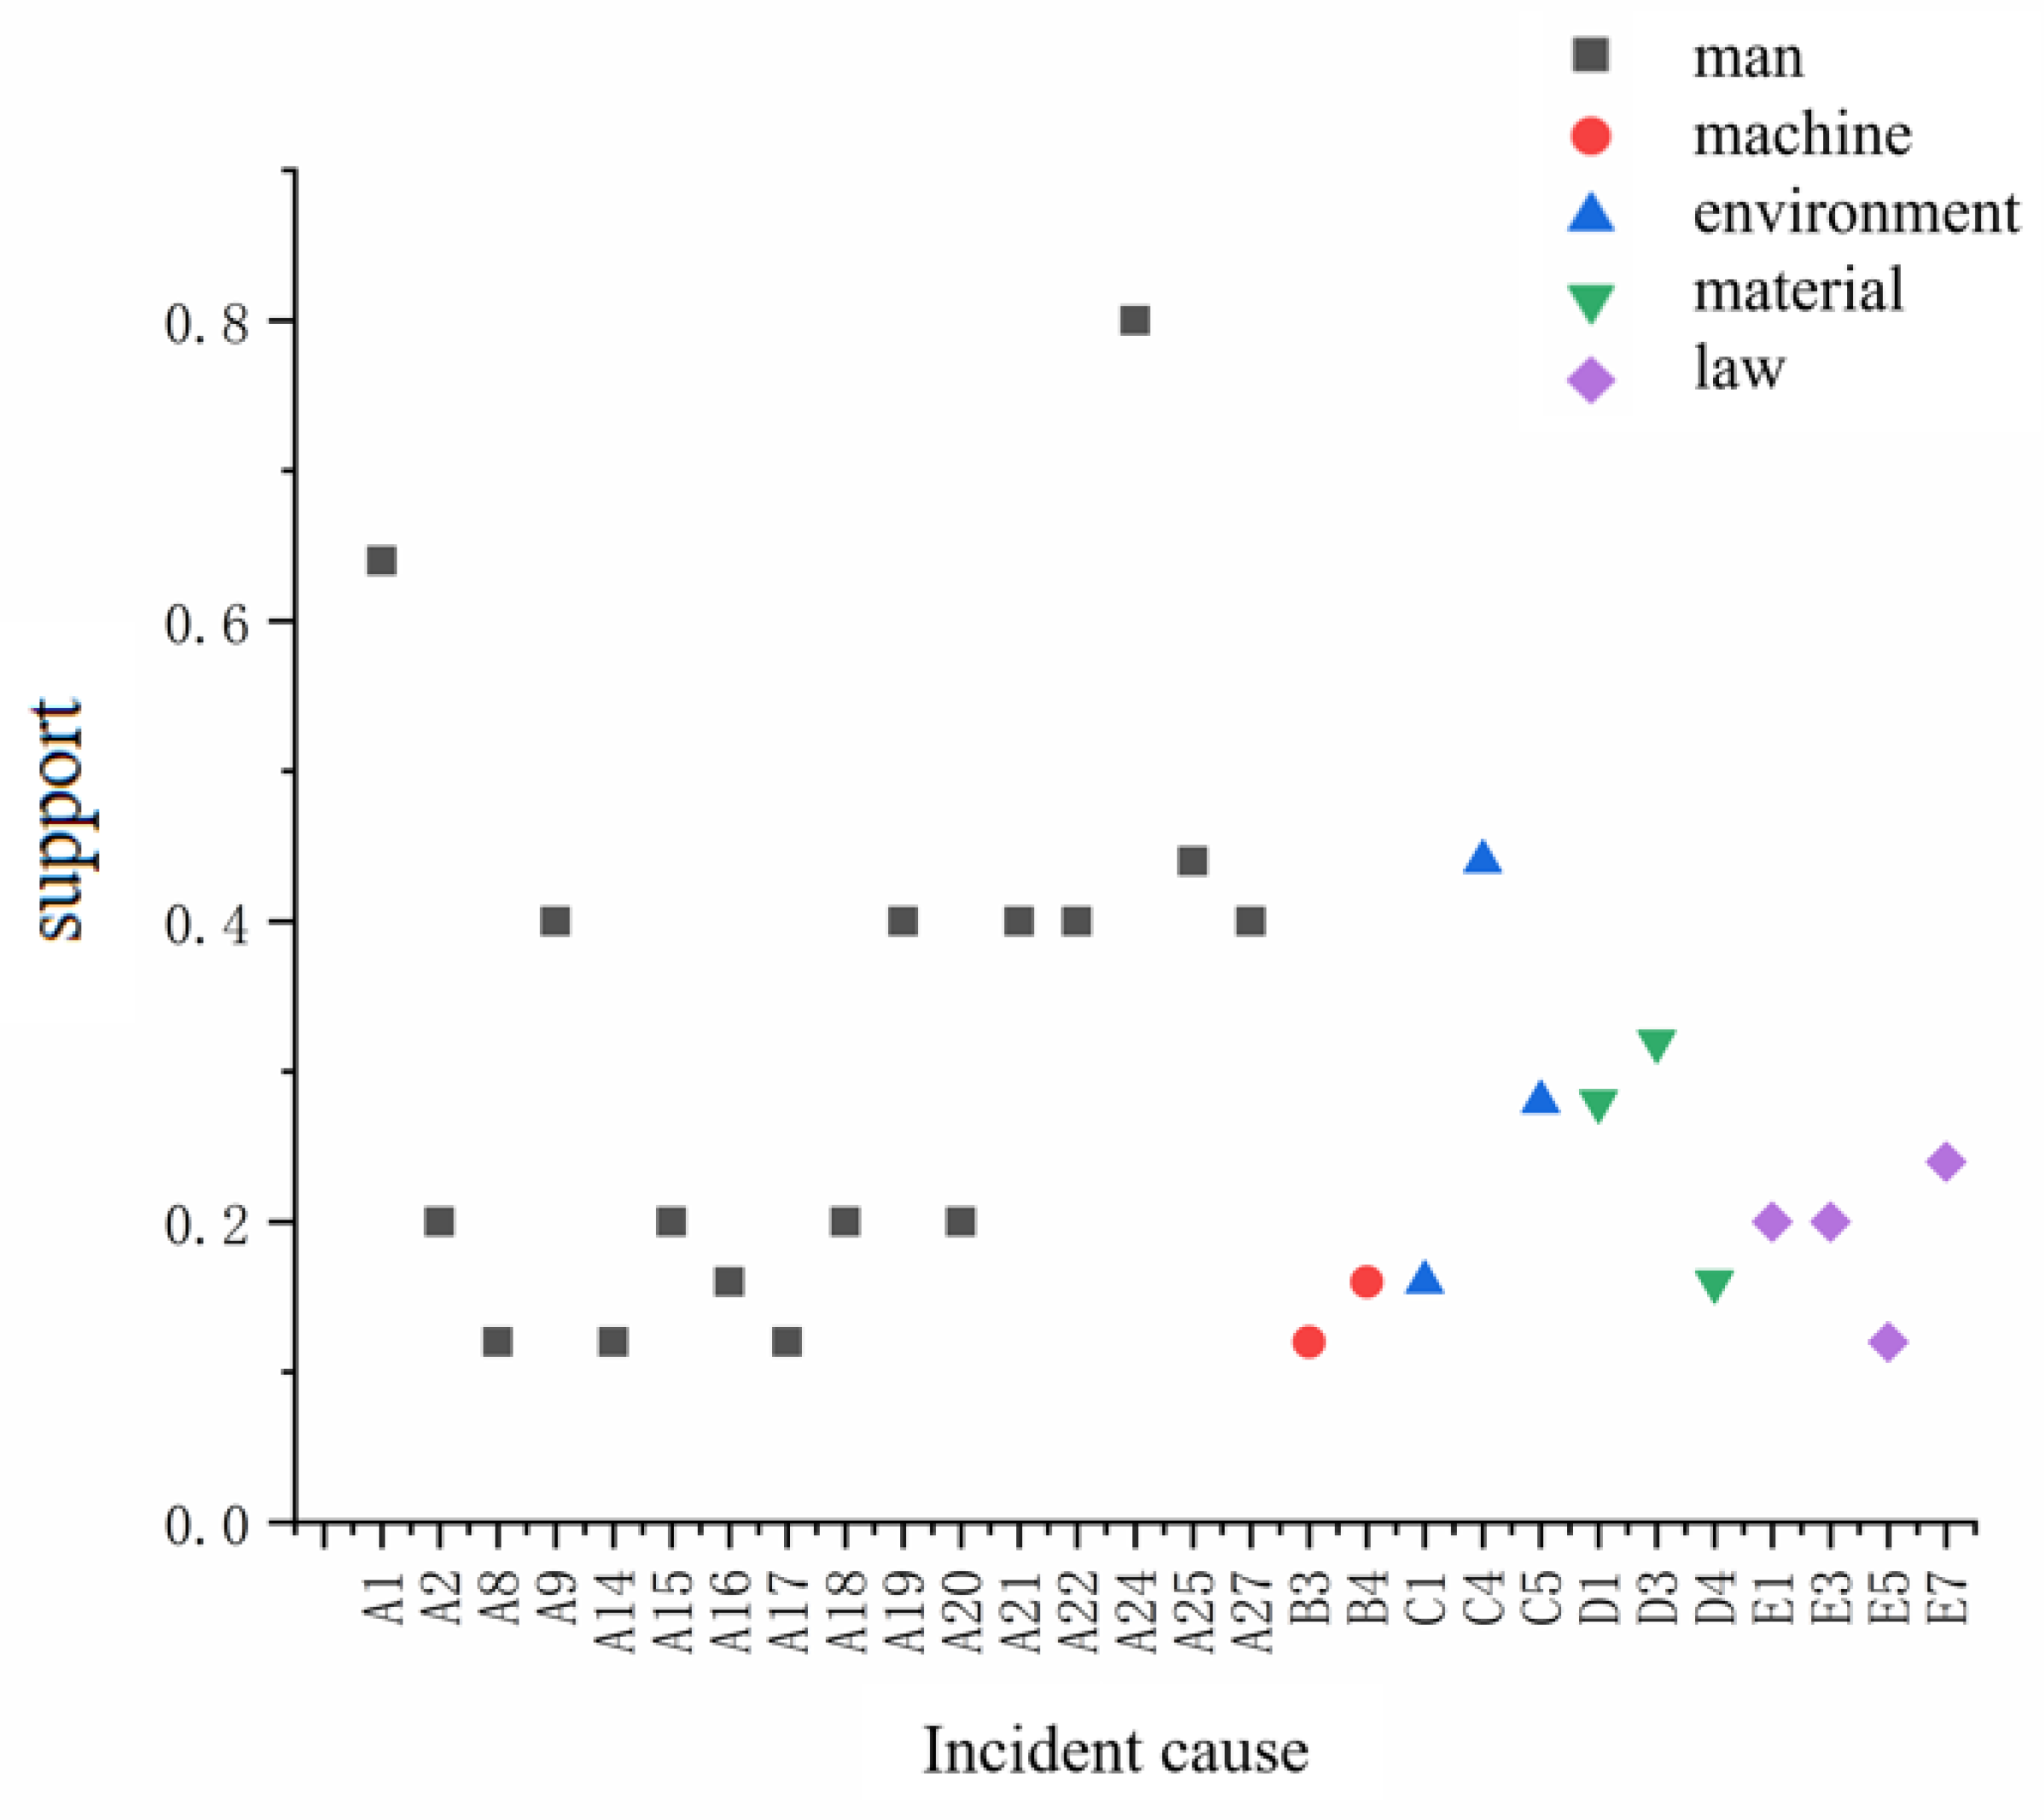
4.1. Analysis of Major Incident Causes

The data were denoised by constantly adjusting and executing the minimum support and minimum confidence levels, which were first set to 5% and 50%, respectively, and then by adjusting and setting different minimum support and confidence levels. The final results are shown in Figure 5, which yielded a total of 28 major incident causative factors. The higher the support level of an incident causative factor was, the higher the probability was of that factor appearing in the dataset. From the results in Figure 5, it can be seen that the support degree for most of the incident causative factors was lower than 0.25. This result is related to the selection of a larger sample size of incidents and a more dispersed distribution of the incidental causative factors. The probability of samples appearing in the total sample was lower, and the evaluation angle of the person who determined the incident investigation report was different. As well, the determination of the incidental causative factors may have been different, which resulted in the lower probability of appearing in the cause of the incident caused by the object strike, wherein probability of occurrence was lower in the big data.
Therefore, by analyzing the correlation rules between the causes of incidents and linking the factors together, it is possible to reduce the interference of the human factor, and even if everyone has a different view of the incidents, there is certainly a “similarity”, which is linked by the correlation rules, that leads to finding a more objective law.
As can be seen from the distribution in Figure 5, the causal support of “man” is distributed in the middle and the bottom except for individual cases, thus indicating that most of the causal factors brought on by people were found to have a moderate probability of occurrence, and the selected samples show that there is a very obvious causal relationship between this level of indicator and the object-striking incidents; A1 and A24 have a very high support relative to the other causal factors. The factors of Weak safety awareness and Safety supervision on site is not in place were found to have particularly high probabilities of occurrence and need to be monitored. The causal factors of “machine” are particularly small, and their support values are distributed at the bottom, which indicates that the probability of the occurrence of this part of the causal factors is low, and that this indicator has a low degree of influence on the incidents. The reason may be that, in today’s development, most of the construction sites can be equipped with more complete equipment, as well as sophisticated machinery and equipment, and the probability of failure of these machinery and equipment is extremely low. For the “environment” and “material” factors, the majority of the support values are distributed at the bottom, thereby indicating that the part of the causes regarding the probability of occurrence is low and has less impact on the incident; the “law” factor support degree does not exceed 0.3 and is also in a low state. This suggests that the rule of law is now better and more robustly established in this area of construction, and it is sufficient to continue to maintain this situation.

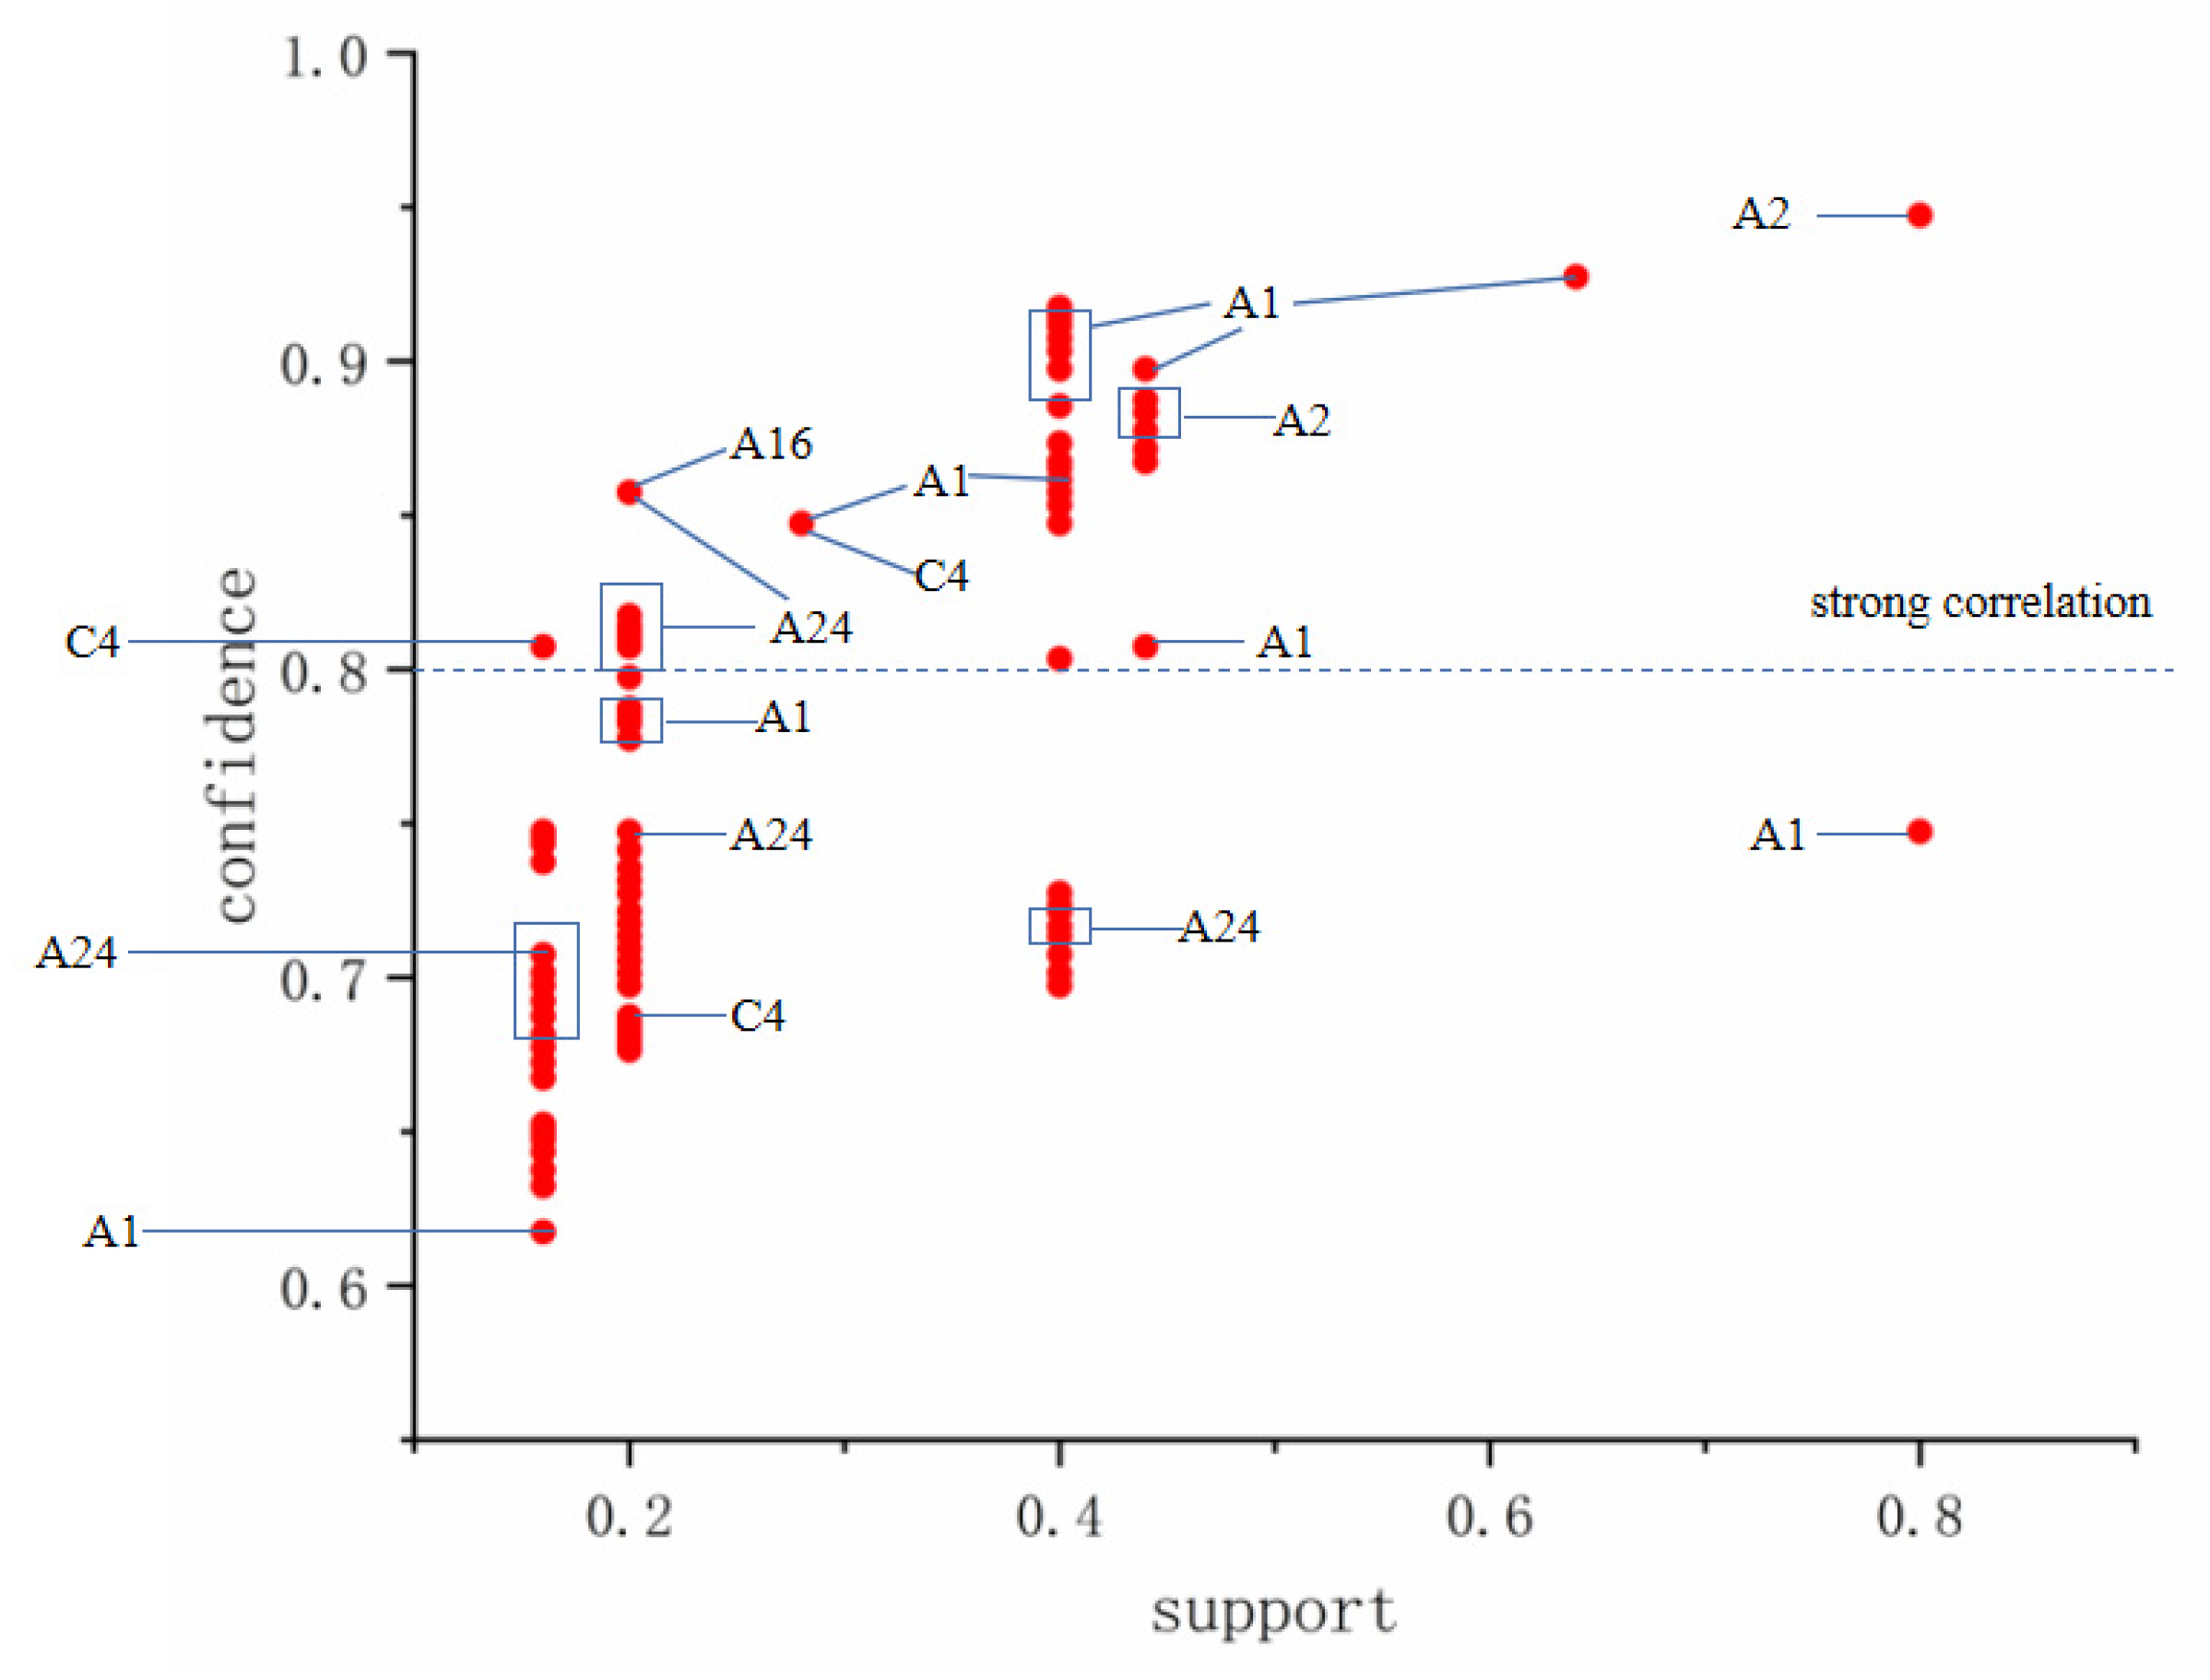
4.2. Association Rule Result

The correlation results under the minimum support and minimum confidence of the last parameter setting are shown in Table 3.
As shown in Table 3, the final results obtained need to be able to better respond to the impact of causative factors on the incident, so the correlation results with a confidence level of more than 60% were selected. Taking the first row of data as an example, the correlation factor of the causative factor A24 (Safety supervision on site is not in place) for A1 (Weak safety awareness) has a confidence level of 0.93, which indicates that if causative factor A1 (Weak safety awareness) leads to the occurrence of an object-strike incident, then there is a 93% probability that A24 (Safety supervision on site is not in place) will also occur along with it. This result indicates that if causal factor A1 (Weak safety awareness) leads to an object-strike incident, there is a 93% probability that A24 (Safety supervision on site is not in place) will also occur. Causative factor A16 (Operating procedures are not established) was found to have three associated causative factors, namely, E1 (The safety inspection system is not sound), with a confidence level of 65%; E3 (Failure to implement the main responsibility for safety production), with a confidence level of 74%; E5 (Unqualified safety organization); and A24 (Lack of on-site safety supervision), with a confidence level of 71%. These data indicate that if A16 (Failure to establish operating procedures) is the cause of the incident, there is a 65% probability that E1 (Inadequate safety inspection system) will occur, a 74% probability that E3 (The main responsibility of production safety has not been implemented) will occur, and a 71% probability that E5 (Unqualified safety organization) and A24 (Safety supervision on site is not in place) will also occur. This suggests that if causal factor A16 (Operating procedures are not established) leads to an incident, it may not be caused by a single causal factor, but is the result of a combination of multiple causal factors. Causative factor A16 (Operating procedures are not established) is associated with factors E1 (The safety inspection system is not sound), E3 (The main responsibility of production safety has not been implemented), E5 (Unqualified safety organization), and A24 (Safety supervision on site is not in place), so it is clear that causative factors E1 and E3 have a high likelihood of leading to the failure to establish operating procedures, with each having a confidence level of more than 60%, and that causative factors E5 and A24 will lead to problems with the management of the site where the technician operates, which also leads to incidents. Problems can also lead to incidents with a confidence level of over 70%.
As shown in Figure 6, the output of the confidence level between the correlation factors favors the constructor to reduce the safety problems that may be caused by the correlation factors by controlling the former factors of the correlation rules. And for the causal factors that are difficult to control in the supervision process, strong association rules can be utilized to control them indirectly. For example, the confidence level of the correlation factor of cause A2 (Crossoperations are not standardized) for A19 (Safety training and education are not in place) is as high as 92%—there is a strong correlation—and the standardization of the crosswork of the construction personnel of cause A2 is very representative of the safety education of the construction personnel of A2.

4.3. Incident Cause Prediction Based on Bayesian Network

A Bayesian network (BN) represents causal features as a network (weighted graph) by means of a directed graph and then predicts the likelihood of complex and uncertain events by performing probabilistic reasoning. Based on the information accumulated so far, the probability of occurrence of each scenario can be calculated and based on the path of occurrence, thus quantitatively representing the probability of occurrence where causality exists due to complex paths [38,39].
If the event is composed of discrete variables, then the theoretical basis of the BN analysis method is the Bayesian formula, as shown in Equation (3).
P ( A | B ) = P ( B | A )   P ( A ) P ( B ) ,
where P(A|B) is the posterior probability, P(B|A) is the likelihood probability, P(A) is the prior probability, and P(B) is the probability that event B occurs. On the basis of Bayesian formulation, for multivariate multinode Bayesian networks under the assumption of Bayesian network independence and the Bayesian directed separation theorem (D-separation), the joint probability P(X1, X2, …, Xi) can be expressed as the product of the edge probabilities of each node in Equation (4) [40]:
p ( x ) = Π p ( x i | x p a i ) ,
where xi is the i node of the BN, Xpa(i) is the corresponding i parent node, and p(xi|xpa(i)) is the probability of Xpa(i) occurring if xi occurs. The network node Xi represents the incident risk factors, and the arc from node X to node Y represents the direct influence relationship between X and Y. When there is no arc between two nodes, they are independent nodes. Each node xi has a conditional probability distribution that reflects the strength of the influence relationship between the variables.
Let G = (I,E) represent a directed acyclic graph (DAG), where I represents the set of all nodes in the graph, E represents the set of directed connected line segments, and we let X = (Xi); iI is the random variable represented by a node i in the directed acyclic graph, where the joint probability of node X can be expressed as follows [41]:
P ( X 1 , X 2     X n ) = i = 1 n P ( X i | X 1 , X 2     X i 1 ) = i = 1 n P ( X i | P a r e n t ( X i ) )
As shown in Formula (5), X is the Bayesian network, and Pa(i) is the “cause” of node i, thus meaning that pa(i) is the parent of i.
According to the results of Section 3.2, the frequent itemset is taken as the root node of the network, and the support degree of the incident causation in Section 4.1, as well as the correlation results in Section 4.2, are taken as the linkage factors; meanwhile, the frequent set is linked according to the classification of the first-level indexes, and in the frequent item set, the “man” factor has influence on the “environment” and “law” factors; this relationship depends on subjective cognition, and the “machine” and “material” factors have no logical relationship to the former. In the frequent items, the “person” factor has influence on the “environment” and “law” factors; this relationship depends on subjective cognition, and the “machine” and “material” factors have no logical relationship to the former, so we constructed a Bayesian network and then learned the parameters according to the existing samples, which could be used as linking factors. According to the existing samples for the parameter learning, it was possible to obtain the conditional probability of the influence distribution of each node, as shown in Figure 7.
Bayesian inference is an inference method used to update the probability of a particular hypothesis based on the available evidence and information [42]. At the same time, Bayesian network inference analysis should not only analyze the nodes that have the greatest impact on the target node, but should also consider the likelihood of the incidents caused by the coupling of various factors. Through the Bayesian network model for frequent itemset and association set learning, the association results obtained from the Bayesian inference were analyzed, and the association results could be obtained through the classification inference of the secondary indexes; the proportion of human factors was found to be larger, which included the following: “weak safety awareness”, “site safety supervision is not in place “Safety supervision on site is not in place”, “No hidden danger check has been performed”, and other causes that are more likely to lead to incidents. The association results obtained in Section 4.2 were verified through Bayesian inference analysis to verify the reasonableness of the association rules.

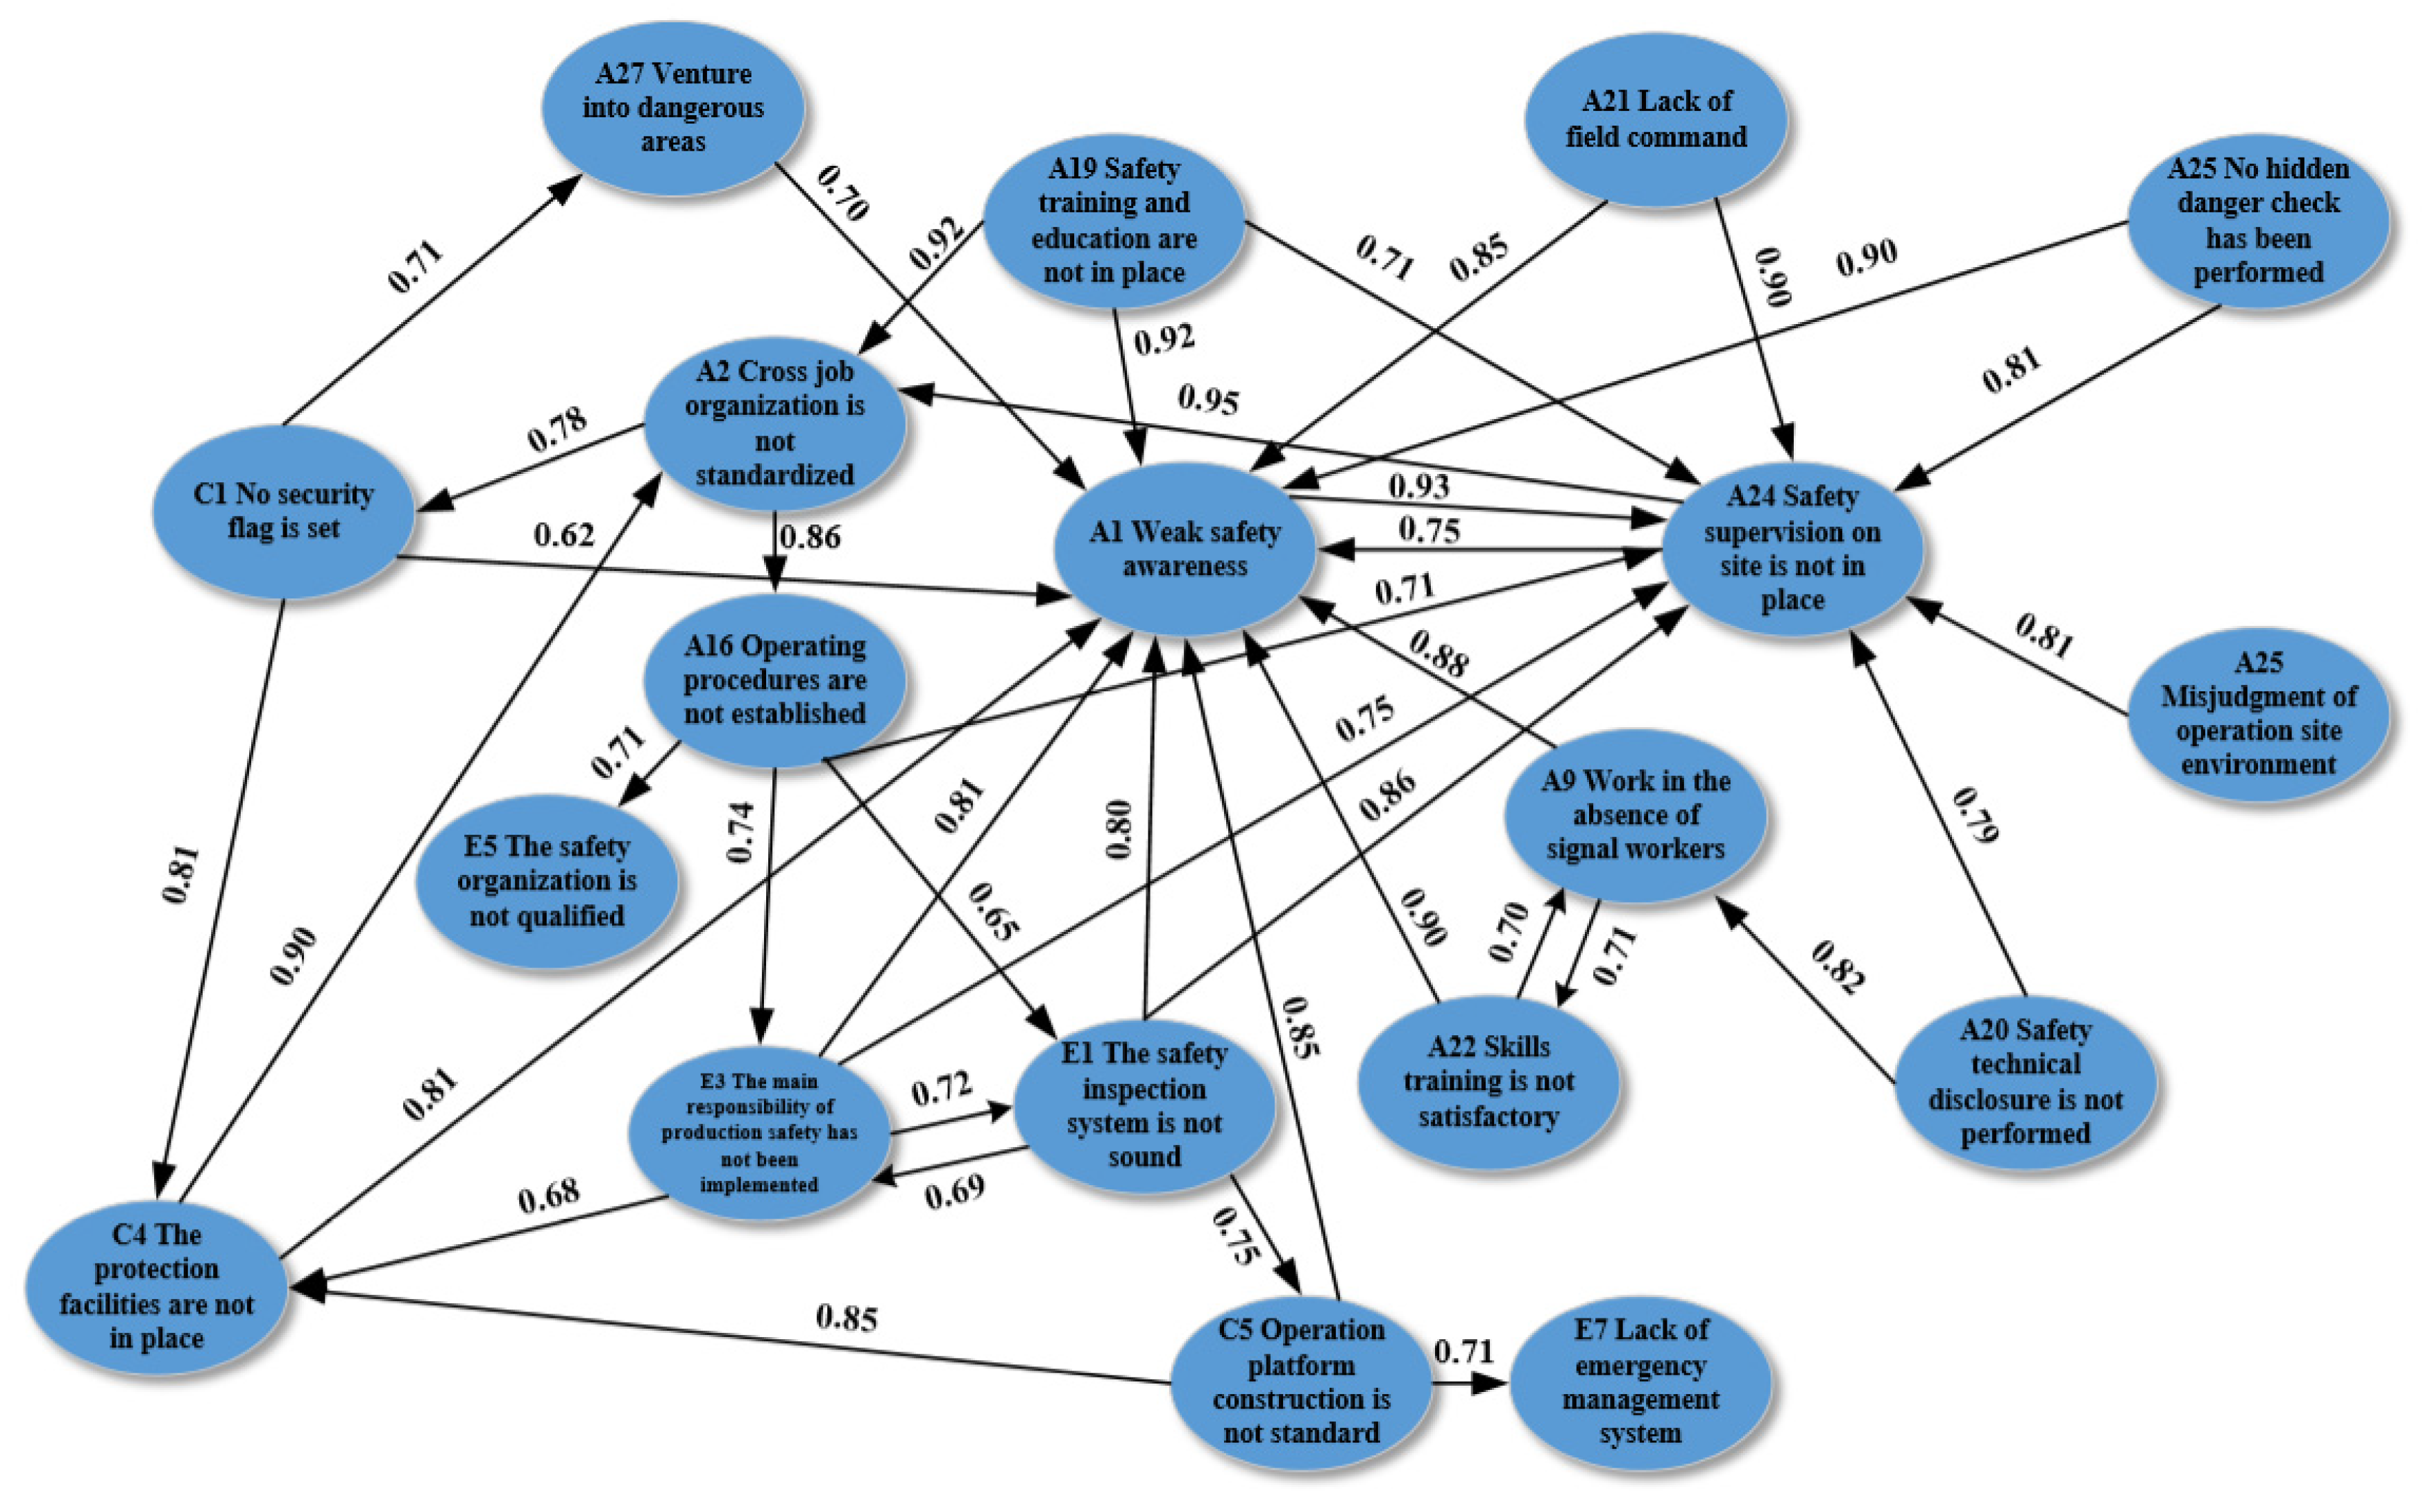
4.4. Incident Causative Association Rule Analysis
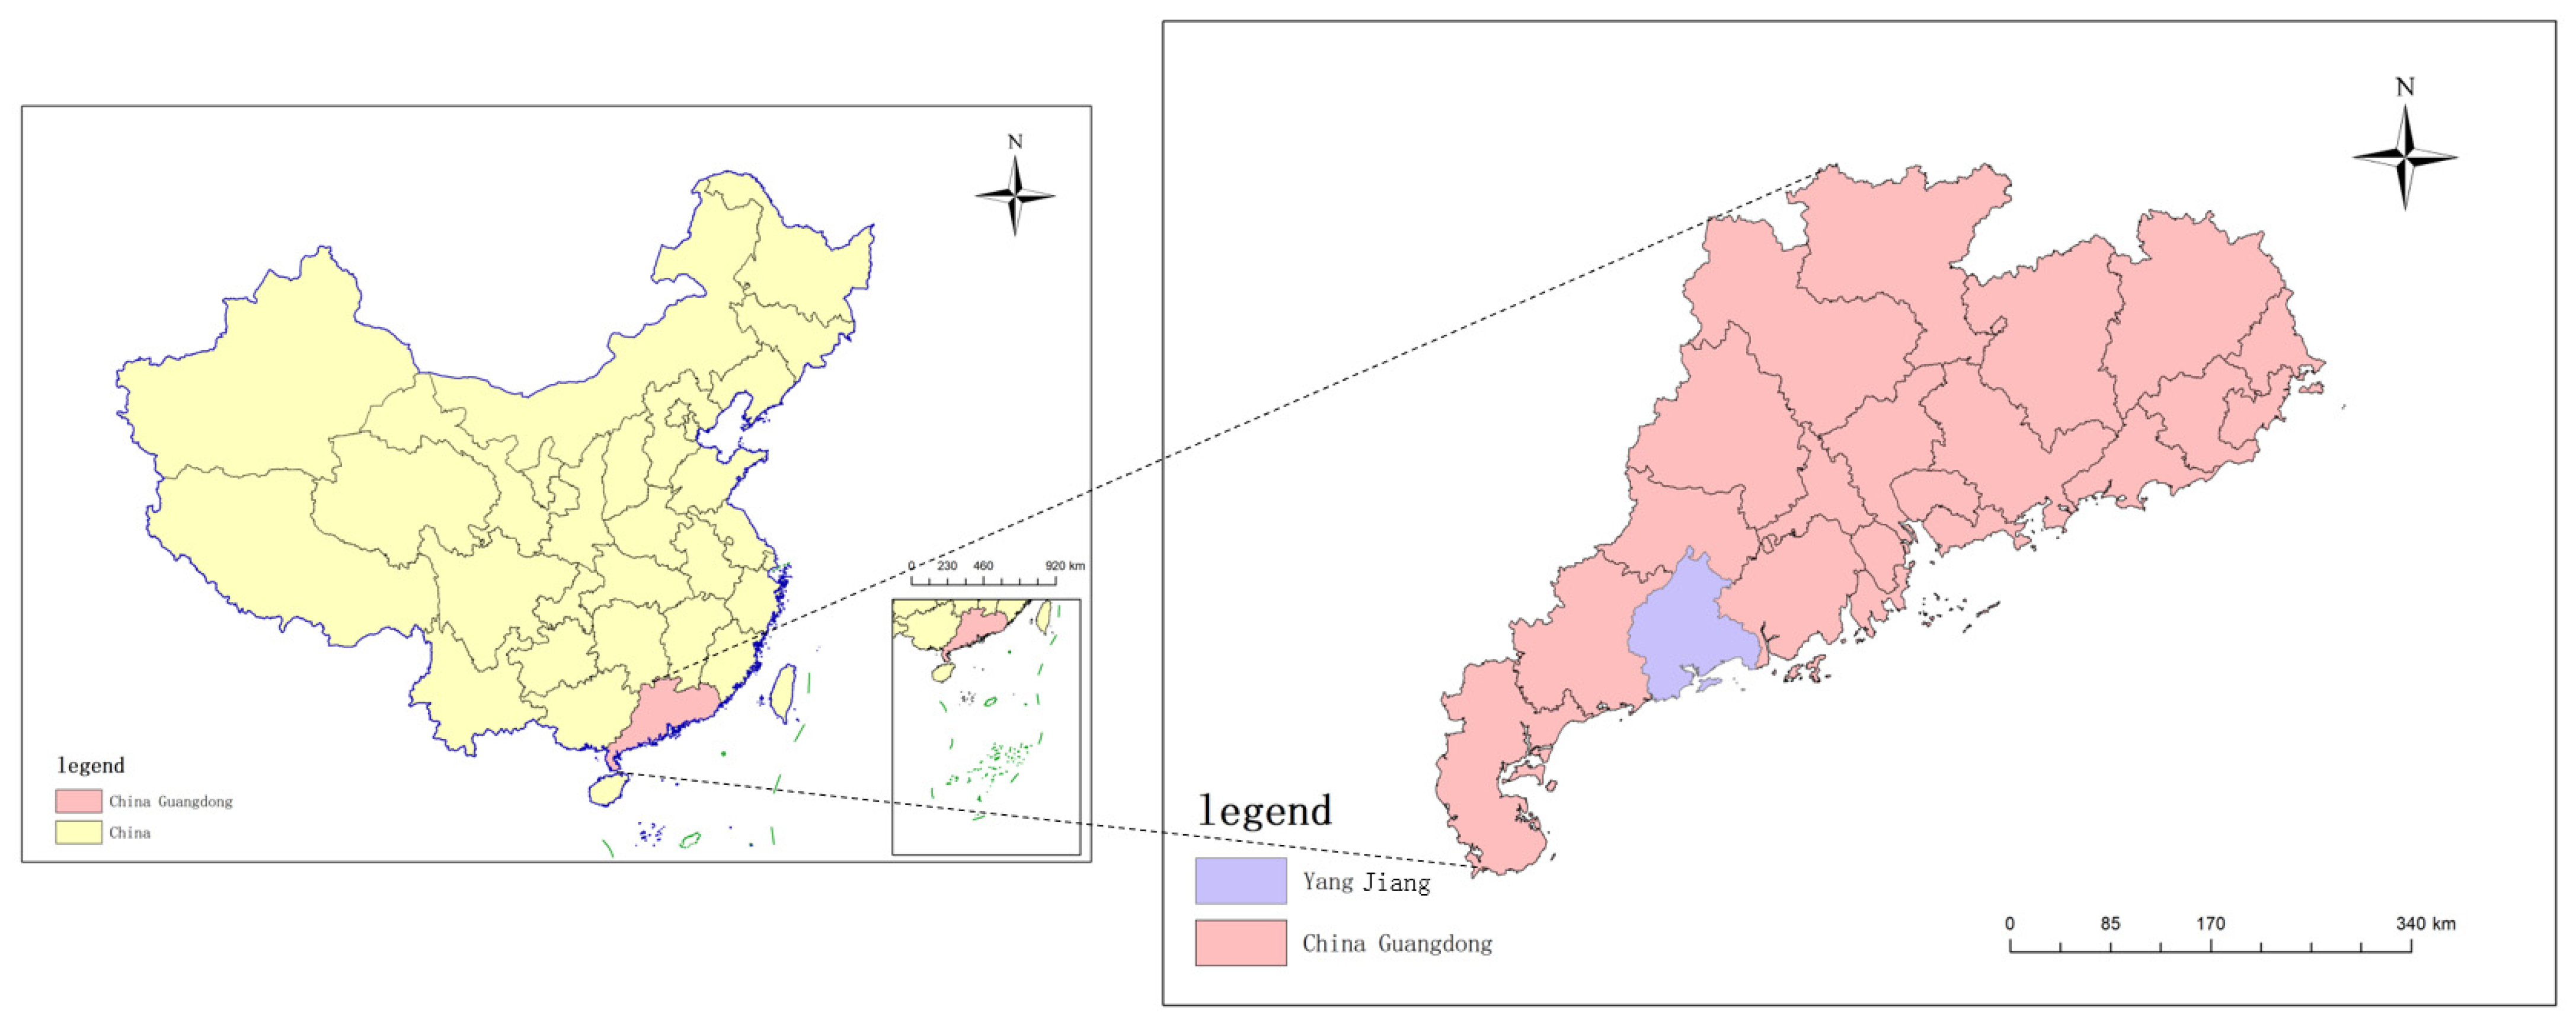
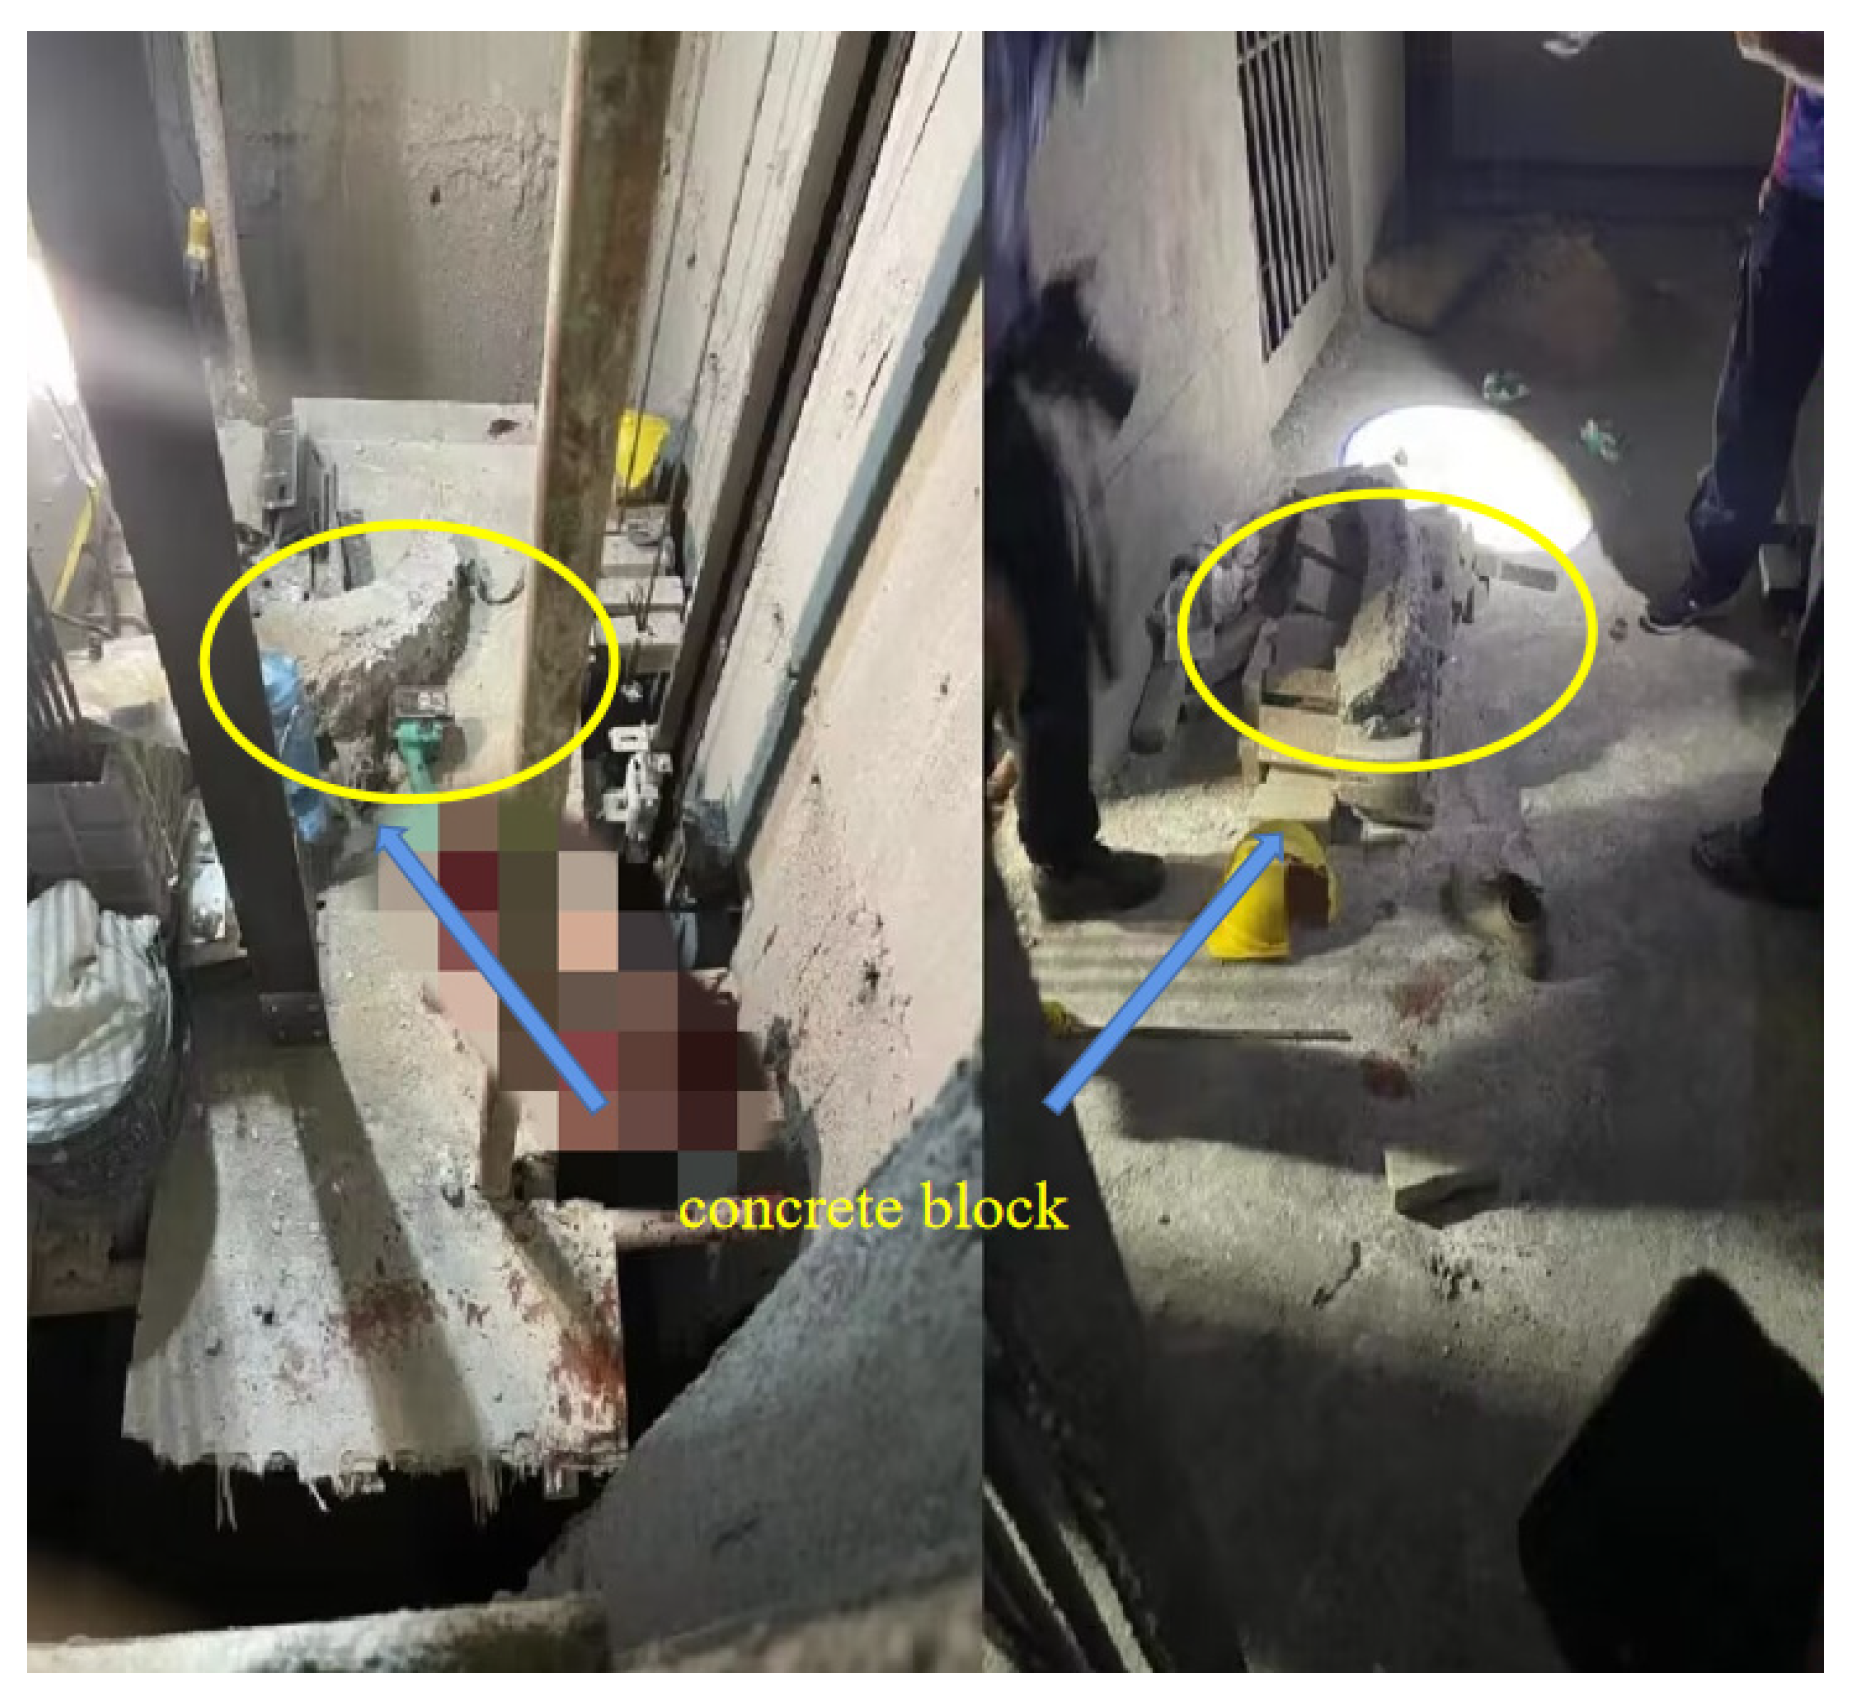
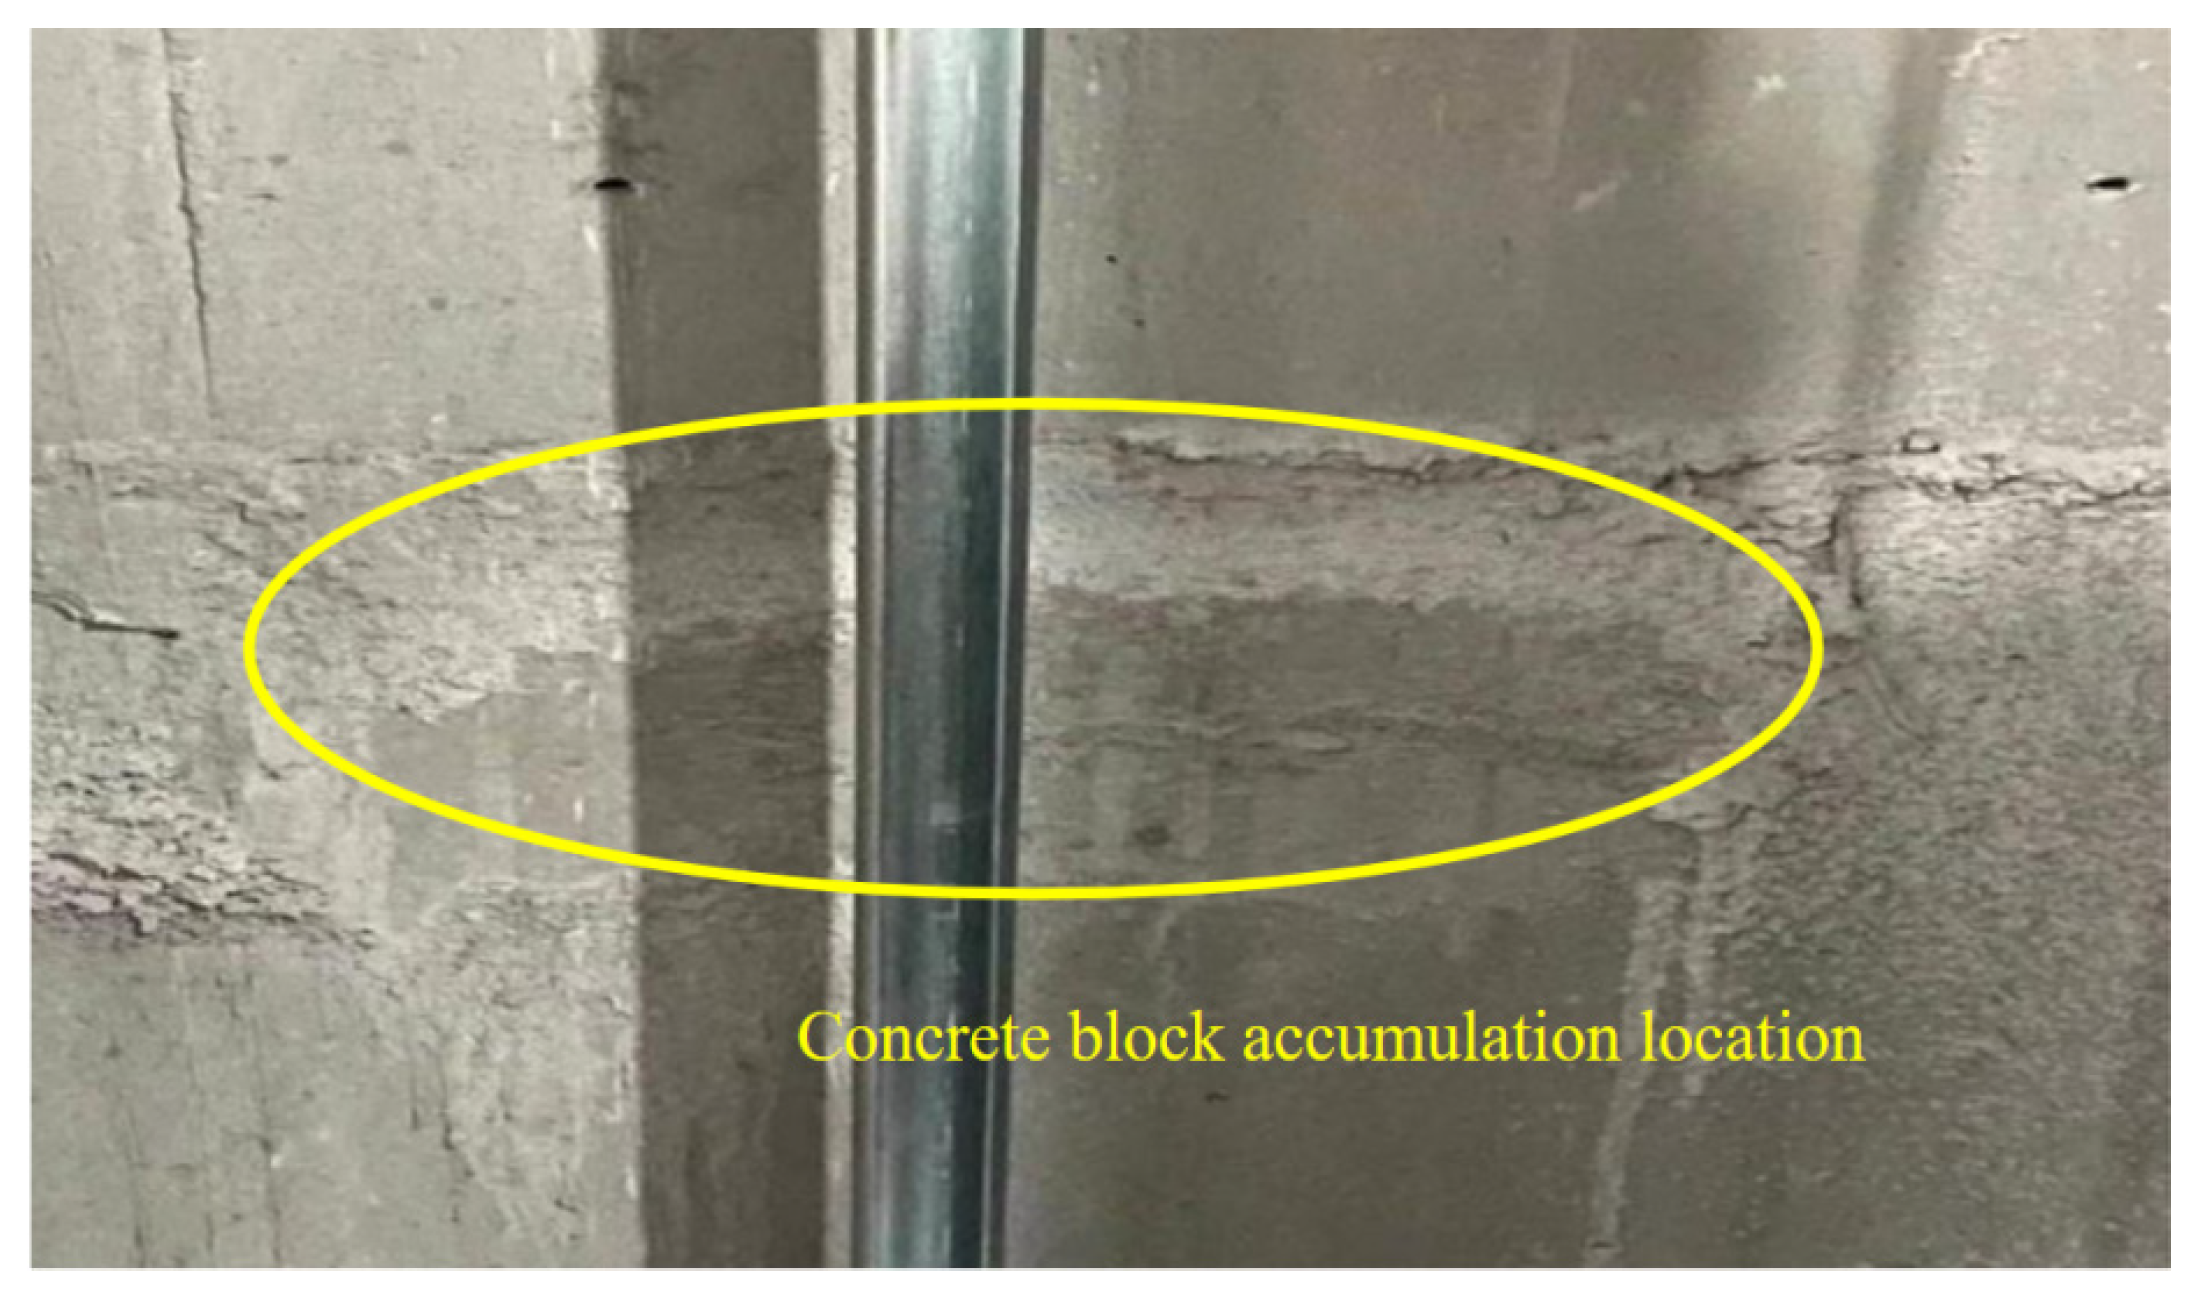
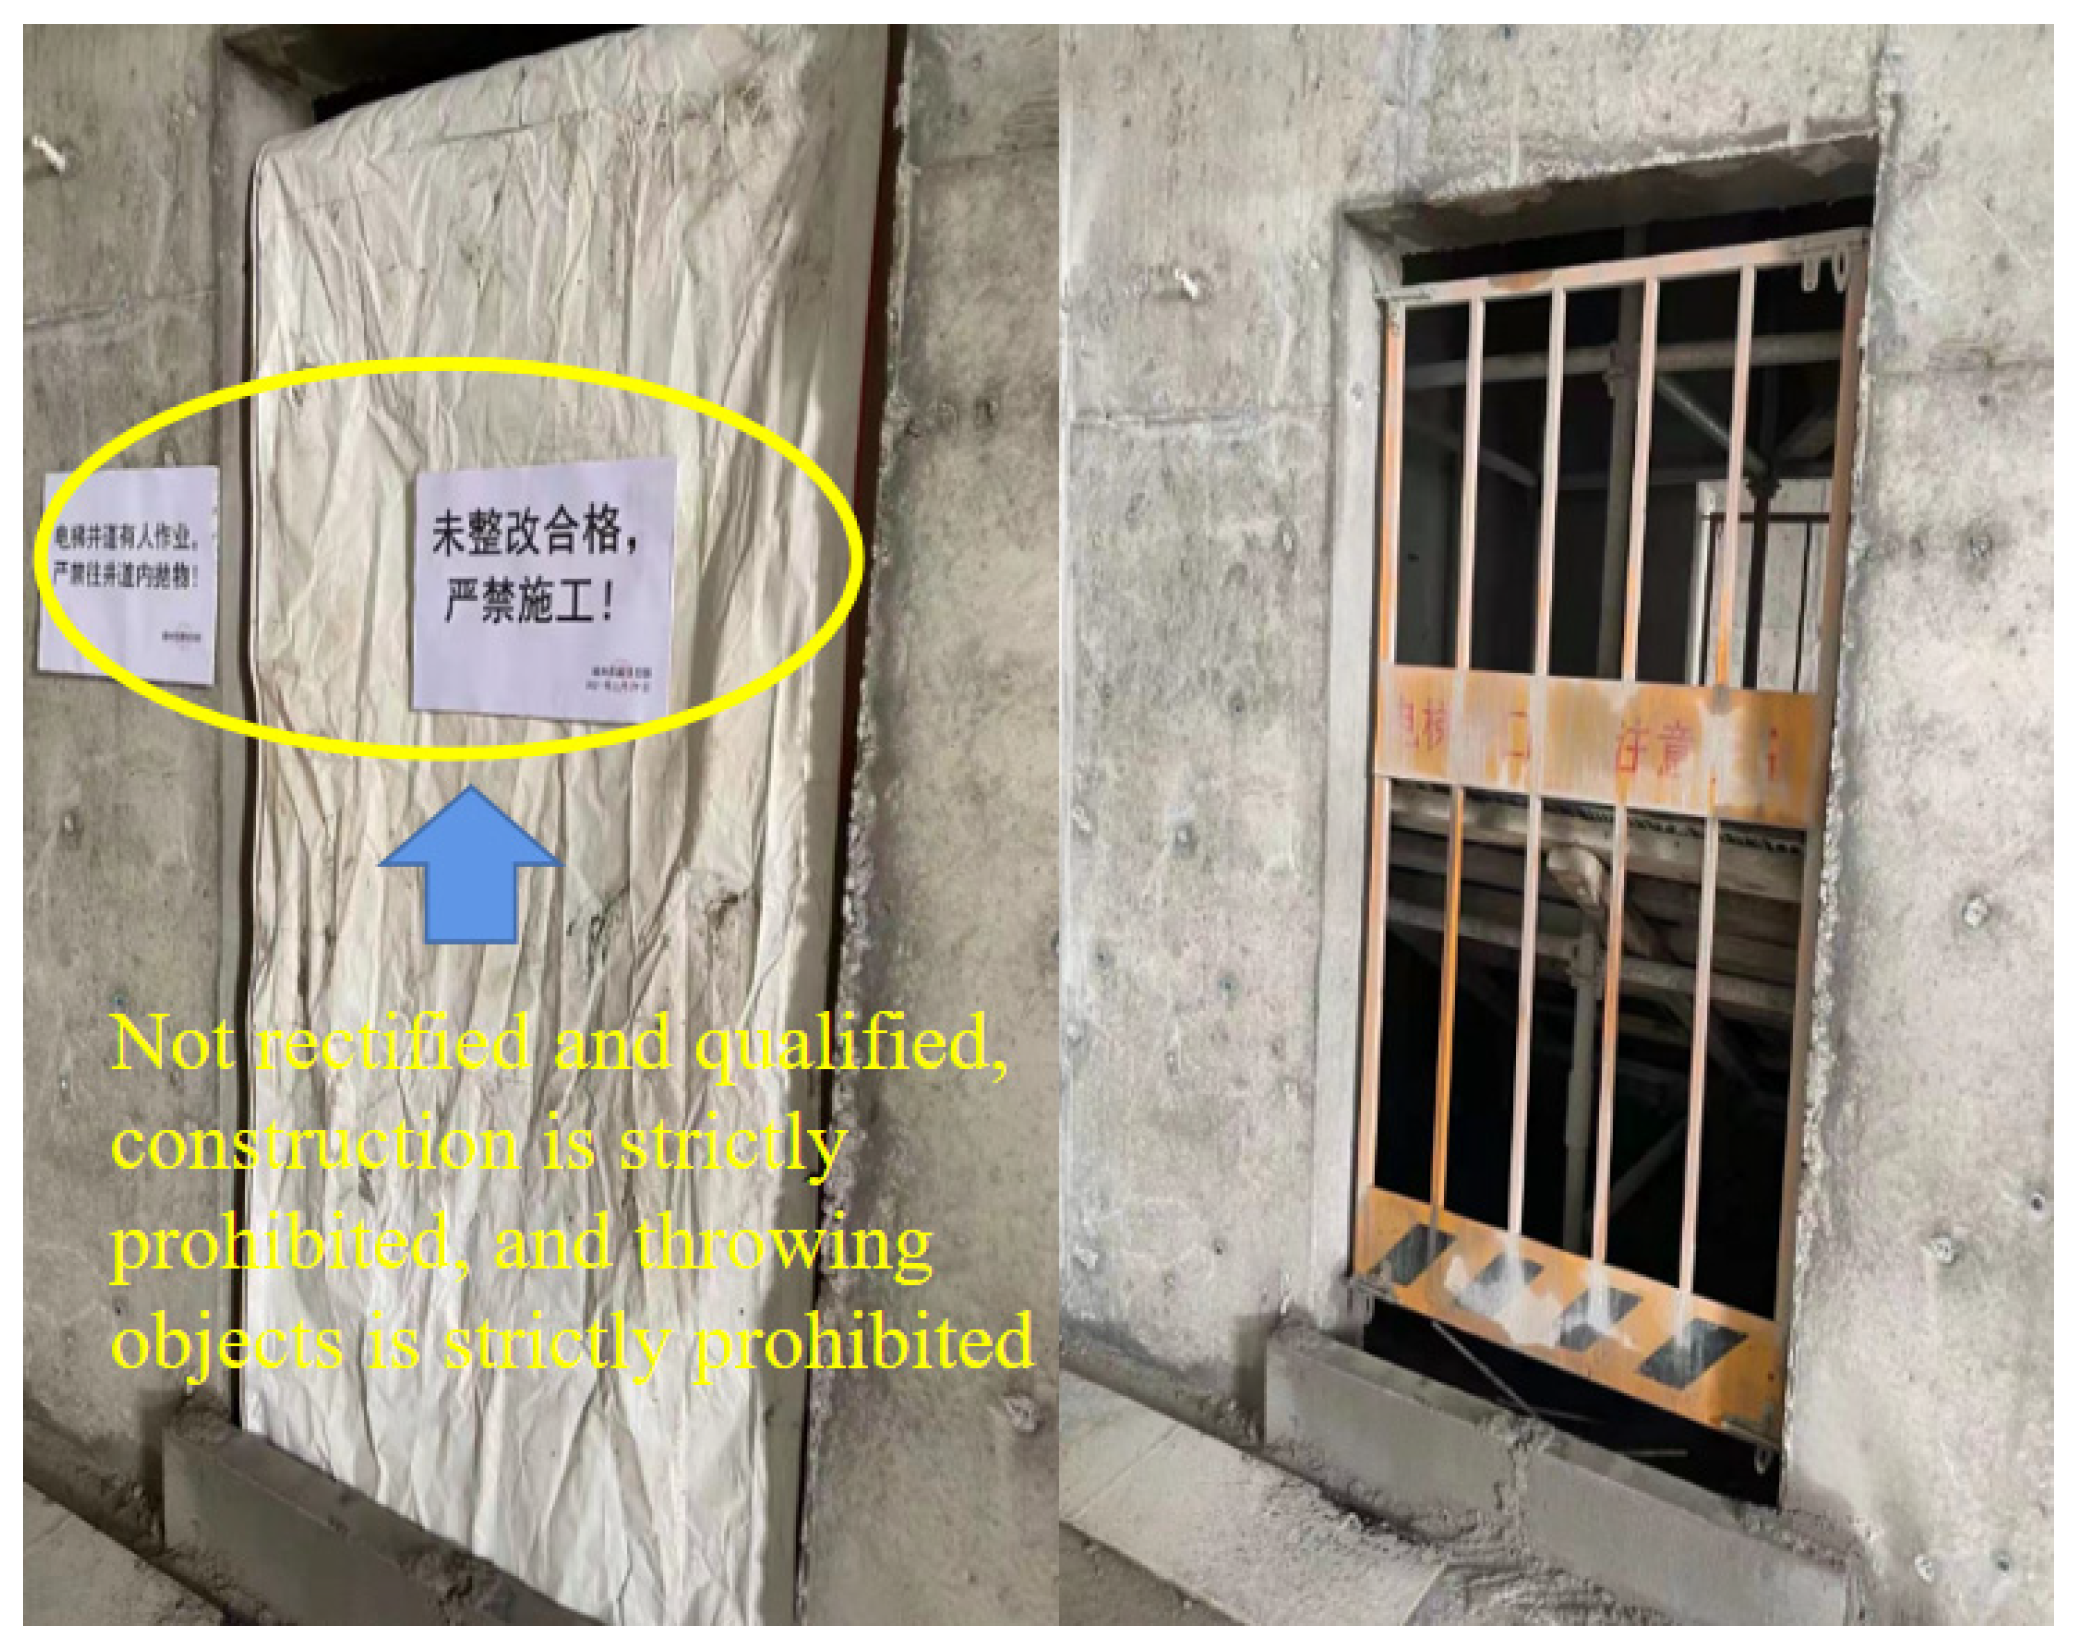
By combining the support output from Figure 5 and the association results from Table 3, a visualization of the association rules was obtained—see Figure 8—with the horizontal axis being the support of the causal factors and the vertical axis being the confidence of the associated causal factors.
The confidence level greater than 0.8 in Figure 8 can be regarded as a strong association rule. The table in the right part of Figure 4 shows the support of the horizontal coordinate causative factors, and the items labeled in Figure 4 are the vertical coordinate correlative causative factors, from which it can be seen that a small part of them is distributed on the causative factors with the support of 0.2, and another part of them is distributed around the causative factors with the support of 0.4. Finally, coordinates individually exist on 0.6 and 0.8. Among these correlates, A1 (Weak safety awareness) and A24 (Safety supervision on site is not in place) appeared more frequently, and those associated with them and with high support were A2 (Crossoperations are not standardized), A16 (Operating procedures are not established), A19 (Safety training and education are not in place), A21 (Lack of command personnel at the construction site), A22 (Poor skill training), A25 (No hidden danger check has been performed), and C4 (Inadequate protective facilities). These nine items, as the key causal items of the object striking incidents, are shown in Table 4, and they have a high probability of occurrence and strong confidence in the correlation rules. Most of the sample incidents contain one or more of these nine causal factors. Different causal factors, on the one hand, represent the different causes of incidents; on the other hand, they also represent the different evaluation angles of the incident determinants for similar causes, but there is a “similarity”, as has been mentioned earlier. In this paper, the nine key causative factors serve as the “similarity” causative factors for most of the construction incidents in recent years, while A1 and A24 of the nine key causative factors represent the “similarity” of the rest of the key causative factors.
The results of the analysis are generally consistent with the results obtained from the Bayesian inference in Section 4.3, and, therefore, the control regarding object-striking incidents can be borrowed from these nine key causal factors according to reference.

4.5. Case Study

Yangchun City (under the jurisdiction of Yangjiang City), demonstrating the “5.30” object-striking incident as an example, was the site of an event that took place at 17:00 on 30 May 2021 in Yangchun City: an elevator installation being performed by construction workers in the private installation of the elevator resulted in a falling concrete block that hit a worker in the head; the medical staff failed to rescue the worker, thus resulting in a death incident. Figure 9 shows the study area.
The incident occurred at the Yangchun City Central Garden Project elevator shaft. The project has 32 floors, with each floor measuring a height of 3 m, and the elevator shaft per-floor specifications were 2.2 m × 2.2 m × 3 m. An elevator counterweight block (width of 1 m, thickness of 0.2 m, height of 1.8 m, and total weight of about 1 t) was used for the relative balance of the weight of the elevator bridge box; the incident occurred to a Mr. Ye during the elevator shaft installation of the elevator operations. Concrete blocks fell from the 23rd floor and one hit the head of a worker. The concrete block shape was crescent-shaped: it was about 40 cm long, 10–20 cm wide, and about 10 cm thick, as shown in Figure 10.
This incident involved an object that fell from a site of concrete accumulation in the Yangchun City Central Garden Project elevator shaft wall (Figure 11). The concrete accumulation protruded from the shaft wall by about 10 cm in length. Due to the elevator installation and commissioning process, the elevator counterweight block running imbalance was hit off along the elevator shaft from the upper floors, wherein the concrete fell and smashed elevator installer Mr. Ye, thus resulting in the incident.
On 28 May, the safety officer of the Guojun Construction Company, the civil construction contractor of the City Central Garden Project in Yangchun city, China, Mr. Li, found during his daily safety inspection that the inner wall of the elevator shaft protruded by about 100 mm due to concrete accumulations. According to the “Code for acceptance of installation quality of lifts, escalators and passenger conveyors” (GB50310-2002) [43], the provision 4.2.5 of the requirements as it pertained to the shaft wall protruding by about 10 cm, indicated, according to the requirements of the civil layout, that the situation constituted an unsafe state of affairs indicating the formation of safety hazards. The safety officer, Mr. Li, faithfully recorded the safety hazard problems found during the inspection in the “Record Sheet of Safety Inspection and Hidden Hazard Rectification of the Project Department” and reported to the project department of the Yangchun Chengyang Garden of the Guojun Construction Company.
In order to completely eliminate the incident potential hazards to ensure construction safety, the civil construction side immediately took corrective measures and on May 28 issued “on the inspection of the site of the city central garden found on the elevator shaft wall beams of the existence of concrete accumulations of hidden trouble rectification notice”, which informed in writing that the Hengyuan Wei Elevator Company in Yangchun city, China, regarding the rectification of the period of the elevator installation construction team, was not allowed to enter the elevator shaft construction, and the team decided to build the elevator shaft of the various floors from 29 to 30 May. It was decided that from 29 to 30 May that the elevator shaft construction of each floor would be comprehensively inspected and cleaned up. At the same time, a notice was posted at the entrance of the elevator shaft on the first floor, announcing that it was strictly prohibited to enter the construction without passing the rectification, and the entrances and exits of the elevator shafts on each floor were closed, as shown in Figure 12.
At 16:30 on 30 May, Mr. Ye (deceased), who was a construction team leader, proceeded with the clear knowledge of the elevator shaft wall and the existence of concrete accumulations indicating safety hazards. The civil construction contractor had not eliminated the safety hazards, without the consent of the company, and he had not been approved by the construction team leader to work. In order to rush to catch up with the schedule as soon as possible to complete the installation of the task undertaken, he one-sidedly deemed, based on his own installation of elevators after many years of experience, that there was no danger—that the situation constituted the existence of a fluke—which led to Mr. Ye entering the site of construction privately, wherein he forcibly pried open the closed entrance to the elevator shaft, thus entering the elevator tracks at his own risk to carry out the construction of the installation.
At 17:00 on 30 May, Mr. Ye was in the elevator shaft for the track installation construction process; due to his failure to detect and adjust the vertical angle of the elevator counterweight block correction, this resulted in the elevator counterweight block (width of 1 m, thickness of 0.2 m, height of 1.8 m, and total weight of about one ton) being offset to the wall of the well, the counterweight block fell down and hit the 23rd floor of the elevator wall of the protruding concrete buildup. The concrete block fell along the elevator shaft wall and hit Ye.
Ye was hit on the head by the concrete accumulation in the well during the field construction. The reason for the incident is that Ye took risks and tried to rely on his experience, and the project manager failed to do a good job in the daily safety inspection; The causes involved include the lack of safety awareness of the construction personnel, safety training and education not being in place, safety supervision on the site not being in place, and no hidden danger check having been performed.
Figure 13 shows the causal factors that led to the incident: the lack of safety training led to the construction workers not working in accordance with the installation instructions, thus indicating that the construction workers’ skills training was not passable; there was also a certain degree of the construction workers practicing a low level of safety awareness, so the construction workers were not in place to protect the other construction workers and the construction workers’ risky operations. The construction project management personnel for on-site safety supervision were also not in place, which was also a cause contributing to the incident. The orange part of the key causes appears in Figure 13, which is basically in line with the Bayesian and correlation results of the analysis.
To address the above key causes, the following measures can be taken:
  • Strengthening the safety awareness of construction workers can reduce the occurrence of most striking incidents. The operation cannot take a chance; it must set up the correct concept of work, and develop the habit of construction in accordance with the norms, to fundamentally avoid the occurrence of incidents;
  • Do a good job of performing security risk investigations and rectifications. The existence of hidden dangers should be rectified in a timely manner and registered. The temporary inability to rectify such dangers must involve practical monitoring and protection measures until they are resolved;
  • The operation of a variety of machinery personnel must involve professional training; personnel must be able to master the basic knowledge of the performance of the equipment and be qualified by examination. On-duty operations must be carefully operated, involving the strict implementation of the relevant rules and regulations. The correct use of labor-protective equipment is mandatory, with workers being strictly prohibited to work without a license to use the mechanical equipment;
  • Do a good job of construction site management. On-site safety inspection is an important part of the safety management process. Every safety issue in the construction process should be effectively controlled. Safety inspections must cover the range of expectations and qualifications, including the implementation of safety rules and regulations, safety and technical delivery, the operation and maintenance of machinery and equipment, electrical safety use, safety protection facility setup, the wearing of safety labor protection products, the proper management of the site operating environment, and so on.

5. Conclusions

In this paper, by collecting the investigation reports of object-striking incidents in construction in recent years, we used the Apriori algorithm to mine the incident causative factors and analyze the results of the incident causative factors associations obtained from data mining, wherein we finally obtained 28 main incident causative factors:
  • The association rule results for incident causation reflect the fact that most incidents occur as a function of the common outcome of multiple causative factors and that incident causation can be controlled by strong association results;
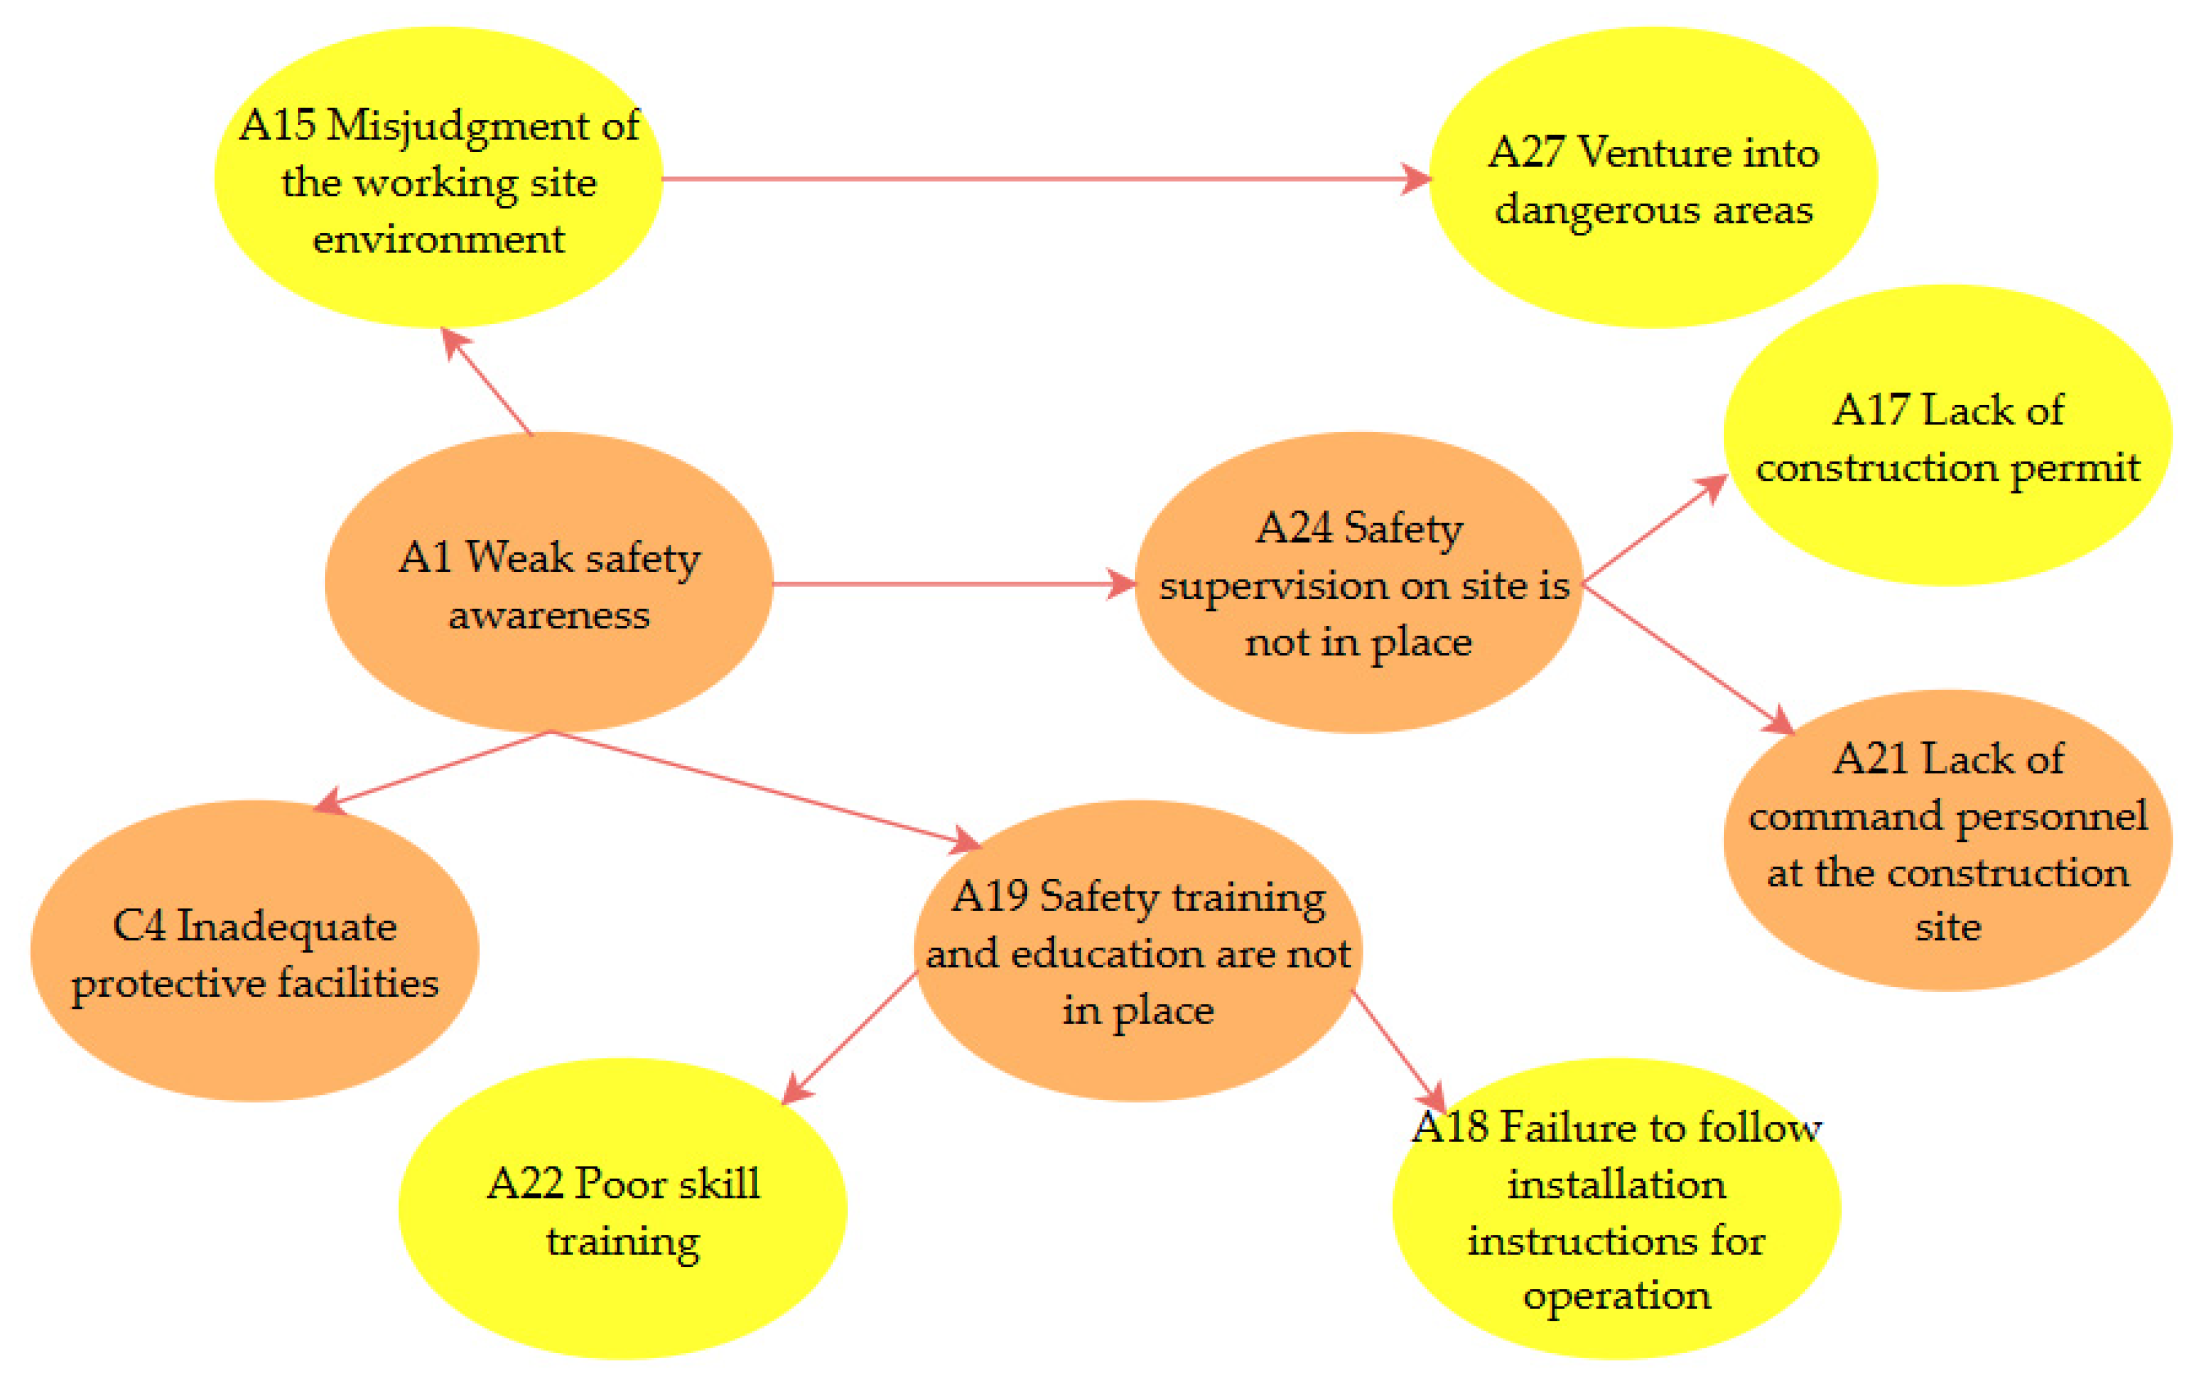
  • Nine key incident causative factors were extracted by combining the results of the incident causative factors’ support values and association rules, as well as confirming the reasonableness of the results with Bayesian inference. In particular, the factors Weak safety awareness and Safety supervision on site is not in place had the highest frequencies of occurrence, followed by Cross-operations are not standardized, Operating procedures are not established, Poor skill training, Lack of command personnel at the construction site, Safety training and education are not in place, No hidden danger check has been performed, and Inadequate protective facilities. The results of the analysis reduced the interference of human factors, and the results are more scientific, objective, and reasonable. The results are more scientific, objective, and reasonable so as to provide a reference for construction safety research;
  • In addition, the limitation of this study is that the extraction of the incident causes within the sample of incident investigation reports may be misunderstood semantically, which may result in the omission of certain incident causative factors, and a new methodology can be found for the extraction of incident causes from the incident investigation reports via a subsequent study to enhance the scientific validity of the data.
The sustainable development of modern cities has been an increasingly important issue in the field of construction production, because the wave of urbanization is becoming more and more common, and the issue of construction safety production is also called for. With the increasing demand for a better quality of life in cities, the sustainable development of modern cities cannot be separated from the perspective of construction safety production. This paper studied the causes of incidents and the links between incident factors, thus involving construction production, management, and other aspects of construction, to improve the safety of people in the process of safe production, environmental cleanliness, and building stability. The aim is to provide a guarantee for the long-term development of the construction field and to fully realize the goal of sustainable development of modern cities.

Author Contributions

Conceptualization, W.Y.; methodology, W.Y.; software, Z.L.; validation, Z.L. and W.Y.; formal analysis, Z.L.; investigation, Z.L.; resources, Z.L.; data curation, Z.L.; writing—original draft preparation, Z.L.; writing—review and editing, Z.L.; visualization, W.Y.; supervision, W.Y.; project administration, Z.L.; funding acquisition, Z.L. All authors have read and agreed to the published version of the manuscript.

Funding

Funding was provided by the Natural Science Basic Research Program of Shaanxi (Program No. 2022JM-280).

Institutional Review Board Statement

Not applicable.

Informed Consent Statement

Not applicable.

Data Availability Statement

The incident case comes from the investigation report of the “5·30” object strike incident in Yangchun City released by the Yangchun Emergency Management Bureau on 25 October 2021; please go to yangchun.gov.cn (accessed on 27 July 2023) for more information.

Conflicts of Interest

The authors declare no conflict of interest.

Appendix A

Table A1. All pre-treated accidents and their causal factors.
Incident NumberCause Number
T1A1, A28, A25, A22, A21, A24, E3
T2A1, A27, A5, A14, A15, A17, A19, A24, C3, B5
T3A1, A2, A15, A21, A22, A24, A25, A27, C5, A8, E8, A6, A9, A20
T4C4, C5, A19, A21, A24, E7, E1, E2
T5A1, C4, A19, A27
T6A1, A18, A22, A27
T7A1, A27, A9, A18, C1, A25
T8A9, A27, A24, A21
T9A1, A15, A27, A1, C1, C4
T10A22, A27, A24
T11B2, B6, A15, A24, A25
T12B4, A1, A2, A24, A25, D4
T13B3, A24
T14A5, A2, A10, A18, A21, A24, A1
T15A22, A28, C5, C4, A19, A24, E7, EA9
T16A24, A22, A21, A18, A9
T17A11, A14, A19, A1, A21, A25
T18A1, A8, A9, A19, A24, A27, B2
T19A1, A2, A9, A22, A24, E7, A19, A20, A25, A6
T20A1, A15, A24, C4, C5, A21, A24, E8, A19, A20, C1, E7
T21A9, A18, A22, C4, A24, A21, A16, D4, A25
T22A2, A14, A22, A1, C4, E1, A20, E3, E5, A5, C4, A9, A16, A17
T23A27, C5, C1, C4, E6, E7, E1, E3, A24, A25
T24A1, A9, A16, A17, A19, A20, A24, C4, C5, A19, A25, A22, E1, E3, E5
T25A9, C5, C4, A24, A8, A21, A16, A25, E1, E3, E5, E6, E7
T26B3, A24
T27A25, B2, B6, A15, A24
T28A1, A15, A24, C4, C5, A21, A24, E8, A19, A20, C1, E7
T29A15, C3, A1, A27, A5, A14, A17, A19, A24, B5
T30A2, A14, A22, A1, C4, E1, A20, E3, E5, A5, C4, A9, A16, A17
T31A19, A1, C4, A27
T32A24, A25, B2, B6, A15,
T33C4, C5, A19, A21, A24, E7, E1, E2
T34A1, A8, A9, A19, A24, A27, B2
T35A1, A27, C4, A19,
T36A24, A22, A27,
T37A5, A2, A10, A18, A21, A24, A1
T38A24, E3, A1, A28, A25, A22, A21
T39A22, A28, C5, C4, A19, A24, E7, EA9
T40A24, A27, A9, A21
T41A15, A24, A25, B2, B6,
T42A2, A14, A22, A1, C4, E1, A20, E3, E5, A5, C4, A9, A16, A17
T43A6, A20, E8, A9, A1, A2, A15, A21, A22, A24, A25, A27, C5, A8
T44A22, A28, C5, C4, A19, A24, E7, EA9
T45A5, A2, A10, A18, A21, A24, A1
T46A22, A21, A1, A28, A25, A24, E3
T47B2, B6, A15, A24, A25
T48B4, A1, A2, A24, A25, D4
T49C4, C5, A19, A21, A24, E7, E1, E2
T50B3, A24
T51A17, A24, A1, A27, A5, A14, A15, A19, C3, B5
T52A1, A2, A9, A22, A24, E7, A19, A20, A25, A6
T53A19, A27A1, C4,
T54B4, A1, A2, A24, A25, D4
T55A1, A15, A24, C4, C5, A21, A24, E8, A19, A20, C1, E7
T56A8, A6, A1, A2, A15, A21, A22, A24, A25, A27, C5, E8, A9, A20
T57A22, A27, A24
T58A19, A25, A22, E1, A1, A9, A16, A17, A19, A20, A24, C4, C5, E3, E5
T59A1, C4, A19, A27
T60A24, A22, A21, A18, A9
T61A1, A27, B5, A5, A14, A15, A17, A19, A24, C3
T62A9, C5, C4, A24, A8, A21, A16, A25, E1, E3, E5, E6, E7
T63C4, C5, A19, A21, A24, E7, E1, E2
T64A9, A18, A22, C4, A24, A21, A16, D4, A25
T65A19, A1, A27, A5, A14, A15, A17, A24, C3, B5
T66A22, A28, C5, C4, A19, A24, E7, EA9
T67A1, A2, A9, A22, A24, E7, A19, A20, A25, A6
T68A24, A27, A8, E8, A6, A9, A20, A25, C5, A1, A2, A15, A21, A22
T69A2, A14, A22, A1, C4, E1, A20, E3, E5, A5, C4, A9, A16, A17
T70C1, A1, A27, A18, A25A9,
T71A1, A15, A27, A1, C1, C4
T72A11, A14, A19, A1, A21, A25
T73A9, A18, A22, C4, A24, A21, A16, D4, A25
T74A28, A25, A1, A22, A21, A24, E3
T75A27, C5, C1, C4, E6, E7, E1, E3, A24, A25
T76B3, A24
T77A22, A28, C5, C4, A19, A24, E7, EA9
T78A17, A19, A20, A24, C4, C5, A19, A25, A22, E1, E3, E5, A1, A9, A16
T79A27, A24, A1, A2, A15, A21, A22, A25, C5, A8, E8, A6, A9, A20
T80A9, C5, C4, A24, A8, A21, A16, A25, E1, E3, E5, E6, E7
T81A1, A8, A9, A19, A24, A27, B2
T82A1, A8, A9, A19, A24, A27, B2
T83A1, A22, A18, A27
T84A22, A27, A24
T85A1, A15, A24, C4, C5, A21, A24, E8, A19, A20, C1, E7
T86A18, A1, A27, A9, C1, A25
T87B3, A24
T88A1, A15, A27, A1, C1, C4
T89B4, A1, A2, A24, A25, D4
T90A11, A14, A19, A1, A21, A25
T91A1, A2, A15, A21, A22, A24, A25, A27, C5, A8, E8, A6, A9, A20
T92A9, C5, C4, A24, A8, A21, A16, A25, E1, E3, E5, E6, E7
T93A1, A2, A9, A22, A24, E7, A19, A20, A25, A6
T94A9, A27, A24, A21
T95A9, A18, A22, C4, A24, A21, A16, D4, A25
T96A22, A28, C5, C4, A19, A24, E7, EA9
T97A27, C5, C1, C4, E6, E7, E1, E3, A24, A25
T98A1, A22, A27, A18
T99A1, A9, A16, A17, A19, A20, A24, C4, C5, A19, A25, A22, E1, E3, E5
T100A24, A22, A21, A18, A9
T101A1, A15, A24, C4, C5, A21, A24, E8, A19, A20, C1, E7
T102A1, A15, A27, A1, C1, C4
T103A24, A22, A21, A18, A9
T104A9, C5, C4, A24, A8, A21, A16, A25, E1, E3, E5, E6, E7
T105A28, A25, A22, A21, A1, A24, E3
T106A5, A2, A10, A18, A21, A24, A1
T107A11, A14, A19, A1, A21, A25
T108A9, A18, A22, C4, A24, A21, A16, D4, A25
T109A9, A18, A1, A27, C1, A25
T110A2, A14, A22, A1, C4, E1, A20, E3, E5, A5, C4, A9, A16, A17
T111A22, A27, A24
T112B4, A1, A2, A24, A25, D4
T113A18, A22, A27, A1
T114A27, C5, C1, C4, E6, E7, E1, E3, A24, A25
T115A9, A27, A24, A21
T116A1, A2, A9, A22, A24, E7, A19, A20, A25, A6
T117A1, A27, A9, A18, C1, A25
T118A9, A27, A24, A21
T119A1, A15, A27, A1, C1, C4
T120A9, A18, A22, C4, A24, A21, A16, D4, A25
T121E1, C4, A21, C5, A19, A24, E7, E2
T122A24, A22, A21, A18, A9
T123A11, A14, A19, A1, A21, A25
T124A1, A18, A22, A27
T125A27, C5, C1, C4, E6, E7, E1, E3, A24, A25
T126A5, A2, A10, A18, A21, A24, A1

References

  1. Hu, L.; Peng, S.; Wei, Q.; Huang, Y.; Wang, X. Hotel safety management model based on causal chain theory of incident. Safety 2019, 40, 35–39. [Google Scholar]
  2. Kuang, Y. Case Study of Tower Crane Incident Based on Data Mining; Huazhong University of Science and Technology: Wuhan, China, 2021. [Google Scholar]
  3. Huang, Q. Safety Management of high work in building construction project. Ind. Build. 2021, 51, 209. [Google Scholar]
  4. Ministry of Housing and Urban-Rural Development of the People’s Republic of China. Available online: http://www.mohurd.goc.cn/ (accessed on 27 July 2023).
  5. Wang, G.; Li, R.; Shen, J. Statistical Analysis and Countermeasures of Incidents in the National Construction Industry from 2015 to 2018. Sci. Technol. Innov. 2019, 15, 57–58+62. [Google Scholar] [CrossRef]
  6. Haslam, R.A.; Hide, S.A.; Gibb, A.G.; Gyi, D.E.; Pavitt, T.; Atkinson, S.; Duff, A.R. Contributing factors in construction incidents. Appl. Ergon. 2005, 36, 401–415. [Google Scholar] [CrossRef]
  7. Mousa, J.; Roghayeh, G. Developing techniques for cause-responsibility analysis of occupational incidents. Incid. Anal. Prev. 2016, 96, 101–107. [Google Scholar]
  8. Soliman, K. Building Collapse during Construction. Pract. Period. Struct. Des. Constr. 2010, 15, 99–100. [Google Scholar]
  9. Peng, J.-L.; Ho, C.-M.; Chang, Y.-P.; Chan, S.-L. Study on collapse of steel-reinforced concrete structure caused by self-weight during construction. J. Constr. Steel Res. 2019, 156, 276–286. [Google Scholar] [CrossRef]
  10. Zhou, D.; Pang, Q. Study on Prevention Measures of Falling Accidents during Construction. Int. Conf. Pipelines Trenchless Technol. 2012, 1494–1501. [Google Scholar] [CrossRef]
  11. Alizadeh, S.S.; Mortazavi, S.B.; Sepehri, M.M. Building a Model Using Bayesian Network for Assessment of Posterior Probabilities of Falling From Height at Workplaces. Health Promot. Perspect. 2014, 4, 187–194. [Google Scholar]
  12. Mistikoglu, G.; Gerek, I.H.; Erdis, E.; Usmen, P.M.; Cakan, H.; Kazan, E.E. Decision tree analysis of construction fall incidents involving roofers. Expert Syst. Appl. 2015, 42, 2256–2263. [Google Scholar] [CrossRef]
  13. Chen, H.; Luo, X. Severity prediction models of falling risk for workers at height. Procedia Eng. 2016, 164, 439–445. [Google Scholar] [CrossRef]
  14. Sun, S.; Qiu, S.; Geng, X.; Fu, G. Classification and statistical analysis of causes of construction object strike incident based on “2–4” model. Build. Saf. 2019, 35, 55–59. [Google Scholar]
  15. Cao, J. Object strike incident analysis and preventive measures. Mod. Occup. Saf. 2010, 10, 68. [Google Scholar]
  16. Jia, W.; Liu, F. Research on Construction Safety Management of prefabricated Buildings based on Incident Analysis. Gansu Sci. Technol. 2017, 37, 99–101. [Google Scholar]
  17. Duan, H.; Chen, C.; Wang, H.-H.; Liu, H.-R.; Cao, Z.-T. Study on cause analysis and control of striking incidents of construction objects. Value Eng. 2017, 36, 38–41. [Google Scholar]
  18. Li, T.Z.; You, X. Analysis of influencing factors of prefabricated building quality based on Apriori. J. Tongji Univ. (Nat. Sci.) 2022, 50, 147–152. (In Chinese) [Google Scholar]
  19. Jiang, D.; He, D.; Zhang, Z. Research on construction safety production management of construction engineering—Based on incident causation theory and data mining technology. J. Shenyang Jianzhu Univ. (Soc. Sci. Ed.) 2021, 23, 605–611. [Google Scholar]
  20. Ma, R.; Wu, H. Research and application of Association rule Mining based on FP_Growth algorithm. J. Taiyuan Norm. Univ. (Nat. Sci. Ed.) 2021, 20, 19–22. [Google Scholar]
  21. Fu, Z. Application research of Data mining C4.5 algorithm in municipal engineering cost. Comput. Mod. 2018, 1, 27–31. [Google Scholar]
  22. Zhang, Q.; Zhang, J.; Zhao, L.; Liu, X.; Ren, G. Classification method of Structural design specifications based on Naive Bayes algorithm. In Proceedings of the 7th National BIM Academic Conference, Chongqing, China, 25–26 December 2021; pp. 60–65. [Google Scholar]
  23. Singh, A.K.; Kumar, P.; Ali, R.; Al-Ansari, N.; Vishwakarma, D.K.; Kushwaha, K.S.; Panda, K.C.; Sagar, A.; Mirzania, E.; Elbeltagi, A.; et al. An Integrated Statistical-Machine Learning Approach for Runoff Prediction. Sustainability 2022, 14, 8209. [Google Scholar] [CrossRef]
  24. Zhong, S.; Hua, S.; Chen, C.; Wang, C. Ball K-Means clustering algorithm based on exploration vector. J. Dongguan Univ. Technol. 2022, 29, 78–87. (In Chinese) [Google Scholar]
  25. Jiang, D.; Zhang, Z.; He, D. Construction of vulnerability assessment index system for injury bearing body of prefabricated building safety incident: Based on Apriori algorithm. J. Shenyang Jianzhu Univ. (Soc. Sci. Ed.) 2020, 22, 259–264. [Google Scholar]
  26. Hao, T.; Wang, B. Improved FP-growth association rule Mining Algorithm. Comput. Knowl. Technol. 2017, 13, 5–8+14. [Google Scholar]
  27. Cheng, M.; Mei, A. Research on Evolution network construction of runway landing events based on association rules. China Prod. Saf. Sci. Technol. 2022, 18, 203–208. [Google Scholar]
  28. Chen, B.; Yu, P.; Zhang, Q. Research on causative association rules Mining of special road incidents based on Apriori algorithm. Road Traffic Manag. 2022, 3, 34–37. [Google Scholar]
  29. Huang, Y.; Huang, S.; Zhou, Y. Correlation analysis of vehicle traffic characteristics and Traffic incidents based on FP-growth algorithm. Road Traffic Manag. 2022, 1, 30–33. [Google Scholar]
  30. Yang, C.; Yu, T.S.; Shi, Y.-F.; Xu, M.-M.; Hou, F. Curriculum relevance analysis based on FP-growth algorithm. China Educ. Informatiz. 2019, 17, 35–38. [Google Scholar]
  31. Guo, A.; Yang, Z.; Du, K.; Zhang, X. Design and application of Coal mine safety information management system based on FP-Growth algorithm. China Min. Ind. 2019, 32, 67–73. [Google Scholar]
  32. Li, Y.; Zhang, Y.; Chen, X.-J.; Hou, T.; Li, S. Based on unsafe ACTS cause of text mining association network analysis. J. Coal Mine Saf. 2023, 54, 251–256. [Google Scholar] [CrossRef]
  33. Ruan, J. Landslide Injury Based on Association Rule Data Mining Research; Chongqing Three Gorges College: Chongqing, China, 2023. [Google Scholar]
  34. Krishankumar, R.; Mishra, A.R.; Rani, P.; Cavallaro, F.; Ravichandran, K.S. A Novel Integrated q-Rung Fuzzy Framework for Biomass Location Selection with No Apriori Weight Choices. Sustainability 2023, 15, 3377. [Google Scholar] [CrossRef]
  35. Wang, Y.; Zhang, H.; Zhang, G.; Tian, F.; Ren, F. Application of Improved Apriori Algorithm in Diagnosis of Abnormal Building Energy Consumption. E3S Web Conf. 2021, 257, 02060. [Google Scholar] [CrossRef]
  36. Chunduri, R.K.; Cherukuri, A.K. Scalable algorithm for generation of attribute implication base using FP-growth and spark. Soft Comput. 2021, 25, 9219–9240. [Google Scholar] [CrossRef]
  37. Kurniawan, R.; Nazri, M.Z.A.; Abdullah, S.N.H.; Hamzah, J.C.; Yendra, R.; Oktaviana, W. Automatic Rule Generator via FP-Growth for Eye Diseases Diagnosis. Int. J. Adv. Sci. Eng. Inf. Technol. 2019, 9, 960. [Google Scholar] [CrossRef]
  38. Ning, H.; Yu, Y.; Bai, L. Unsafe Behaviors Analysis of Sideswipe Collision on Urban Expressways Based on Bayesian Network. Sustainability 2022, 14, 8142. [Google Scholar] [CrossRef]
  39. Crema, R.E.; Kobayashi, K. A multi-proxy inference of Jōmon population dynamics using bayesian phase models, residential data, and summed probability distribution of 14 C dates. J. Archaeol. Sci. 2020, 117, 105136. [Google Scholar] [CrossRef]
  40. Neil, B. Olson’s Gap or Olson’s Extinction? A Bayesian tip-dating approach to resolving stratigraphic uncertainty. Proc. Biol. Sci. 2020, 287, 20200154. [Google Scholar]
  41. Pearl, J. Fusion, propagation, and structuring in belief networks. Artif. Intell. 1986, 29, 241–288. [Google Scholar] [CrossRef]
  42. Chen, J.; Zhang, M.; Yu, S.; Wang, J. A Bayesian Network for the Transportation Incidents of Hazardous Materials Handling Time Assessment. Procedia Eng. 2018, 211, 63–69. [Google Scholar] [CrossRef]
  43. GB 50310-2002; Code for Acceptance of Installation Quality of Lifts, Escalators and Passenger Conveyors. The Standardization Administration of the People’s Republic of China: Beijing, China, 1 April 2002.
Figure 1. Number of construction safety incidents and fatalities from 2009–2018 (data originates from the Ministry of Housing and Urban-Rural Development).
Sustainability 15 15609 g001
Figure 2. Proportion of incident types from 2014 to 2018.
Sustainability 15 15609 g002
Figure 3. Algorithm execution flow.
Sustainability 15 15609 g003
Figure 4. Frequent sets obtained from Apriori and FP-Growth.
Sustainability 15 15609 g004
Figure 5. Support degree of incident causative output.
Sustainability 15 15609 g005
Figure 6. Association rule topology result.
Sustainability 15 15609 g006
Figure 7. Bayesian network parameter learning results.
Sustainability 15 15609 g007
Figure 8. Visualization of association rules.
Sustainability 15 15609 g008
Figure 9. The study area.
Sustainability 15 15609 g009
Figure 10. Fallen concrete block.
Sustainability 15 15609 g010
Figure 11. Location of concrete accumulation.
Sustainability 15 15609 g011
Figure 12. Seal off elevator shaft entrances and exits on all floors.
Sustainability 15 15609 g012
Figure 13. The main causes of incident.
Sustainability 15 15609 g013
Table 1. All causes of object impact incidents.
Serial NumberCausative TermSerial NumberCausative TermSerial NumberCausative Term
ManA1Weak safety awarenessA11Edge protection failureA21Lack of command personnel at the construction site
A2Crossoperations are not standardizedA12Unauthorized removal of edge protectionA22Poor skill training
A3The builder throws tools and materialsA13Not according to the construction planA23illegal subcontracting
A4Work at height without a tool bagA14Not wearing safety equipmentA24Safety supervision on site is not in place
A5Helmet wearing is not standard, or workers forget to wear a helmetA15Misjudgment of the working site environmentA25No hidden danger check has been performed
A6No special operation qualificationA16Operating procedures are not establishedA26Weak government supervision
A7No project management qualificationA17Lack of construction permitsA27Venture into dangerous areas
A8Signal worker’s incorrect commandA18Failure to follow installation instructions for operationA28Failure to evacuate dangerous areas in time
A9The signal worker was not on site during constructionA19Safety training and education are not in place
A10No edge protectionA20Safety technical disclosure is not performed
MachineB1The steel wire of the winch is worn and brokenB3Pump trucks have maintenance deficienciesB5Damaged dense mesh
B2Equipment screws looseB4Lifting equipment has hidden dangersB6Pile machine bottom frame is damaged
EnvironmentC1No security flag is setC3Stacked disorderly on the work platformC5The construction of the work platform is not standardized
C2Big storm, rain, bad weatherC4Inadequate protective facilities
MaterialD1Safety helmet quality is not up to standardD3Defective quality of materials such as guardrails
D2The high-altitude work tool bag has been damagedD4Failure to maintain equipment according to regulations
LawE1The safety inspection system is not soundE4No production safety management agreement has been signedE7Lack of emergency management system
E2Incomplete coordination system for cross operationE5Unqualified safety organizationE8Illegal contracting
E3The main responsibility of production safety has not been implementedE6Lack of safety technical disclosure
Table 2. Pretreated incidents and their causes.
Incident NumberCause Number
T1A1, A28, A25, A22, A21, A24, E3
T2A1, A27, A5, A14, A15, A17, A19, A24, C3, B5
T3A1, A2, A15, A21, A22, A24, A25, A27, C5, A8, E8, A6, A9, A20
T4C4, C5, A19, A21, A24, E7, E1, E2
…………
T126A2, A14, A22, A1, C4, E1, A20, E3, E5, A5, C4, A9, A16, A17
Table 3. Result of the association rule.
Influence FactorConnected FactorsConfidence Coefficient
A1A240.93
A2A160.86
C10.78
A9A220.71
A10.88
A15A240.81
A16E10.65
E30.74
E50.71
A240.71
A19A10.92
A20.92
A240.71
A20A90.82
A240.79
A21A10.85
A240.9
A22A90.7
A10.9
A24A10.75
A20.95
A25A240.81
A10.90
A27A10.7
C1A10.62
A270.75
C40.81
C4A20.90
A10.81
C5A10.85
C40.85
E70.71
E1A10.8
A240.86
C50.75
E30.69
E3E10.72
A10.81
C40.68
A240.75
Table 4. Key causative term.
Serial NumberCausative TermSerial NumberCausative TermSerial NumberCausative Term
A1Weak safety awarenessA16Operating procedures are not establishedA22Poor skill training
A24Safety supervision on site is not in placeA19Safety training and education are not in placeA25No hidden danger check has been performed
A2Crossoperations are not standardizedA21Lack of command personnel at the construction siteC4Inadequate protective facilities
Disclaimer/Publisher’s Note: The statements, opinions and data contained in all publications are solely those of the individual author(s) and contributor(s) and not of MDPI and/or the editor(s). MDPI and/or the editor(s) disclaim responsibility for any injury to people or property resulting from any ideas, methods, instructions or products referred to in the content.

