Article

A Scientometric Analysis of Payments for Ecosystem Services Research: Mapping Global Trends and Directions

1
Department of Social & Ecological Studies, Chinese Academy of Governance, Beijing 100091, China
2
State Key Laboratory of Urban and Regional Ecology, Research Center for Eco-Environmental Sciences, Chinese Academy of Sciences, Beijing 100085, China
3
College of the Life and Environmental Science, Minzu University of China, Beijing 100081, China
4
School of Agriculture Economics and Rural Development, Renmin University of China, Beijing 100872, China
*
Author to whom correspondence should be addressed.
These authors contributed equally to this work.
Sustainability 2023, 15(21), 15649; https://doi.org/10.3390/su152115649
Submission received: 8 September 2023 / Revised: 31 October 2023 / Accepted: 2 November 2023 / Published: 6 November 2023
(This article belongs to the Special Issue Urban Environment and Low-Carbon Cities)

Abstract

:
Payment for ecosystem services (PES) is an innovative economic intervention to mitigate the decline of ecosystem services and biodiversity; it plays a key role in harmonizing protection and development. Based on numerous PES practices worldwide, PES has emerged as a research hotspot in the field of sustainability. This paper presents a comprehensive scientometric analysis of PES academic publications between 1987 and 2022. The study aims to characterize the intellectual landscape of PES by identifying and visualizing the evolution of the collaboration network, the co-citation network, and emerging research trends. The findings reveal a rapid increase in publications of this field, indicating its growing importance as an interdisciplinary research subject. In particular, PES has gained significant attention from numerous researchers since 2007. Environmental sciences and ecology (50.77%) have been the core subjects, followed by business economics (11.04%) and biodiversity conservation (9.58%). Engineering (3.52%) and water resources (3.40%) have emerged as new fields in recent years. Notably, productive authors and institutions in this domain are primarily located in the United States, China, and the United Kingdom. However, fewer stable collaborations were found between China and European countries. Regarding the keywords, the most popular keywords of this topic were “ecosystem service” (1423), “conservation” (1324), and “biodiversity” (1029). By synthesizing the literature, this paper identifies pressing topics related to the effectiveness of PES, including the evaluation of effectiveness, efficiency assessment, and equity. Through an in-depth analysis, this paper elucidates global trends and directions in PES research. It is important to create a fair and efficient market that boosts the motivation and initiative of society to engage in PES initiatives, to increase investment in comprehensive PES projects, which helps improve the efficiency of fund utilization, especially concerning climate change mitigation. It is proposed to integrate natural sciences and social sciences to comprehensively assess the effectiveness of climate-friendly PES, which contributes to the sustainable development of PES research and application.

1. Introduction

Globally, the use of financial or nonfinancial compensation as a policy instrument to reconcile economic interests with environmental protection has become an effective tool. Such mechanisms, known as PES, are widely used in diverse contexts, including forest protection, water source conservation, wildlife preservation, and carbon offset initiatives, which are intended to provide ecosystem services (ES). Notably, the United Nations–led global initiative, REDD (Reducing Emissions from Deforestation and Degradation), represents one of the most extensive PES experiments worldwide. REDD+ extends this concept by promoting the commodification of ecosystems’ carbon storage and sequestration functions on a global scale, with an overarching goal of mitigating climate change through afforestation efforts. Several countries have successfully implemented PES projects. In Brazil, for instance, the government has effectively curbed the rate of Amazon rainforest loss by providing economic incentives to farmers and landowners [1]. Similarly, Mexico has developed a water conservation plan to safeguard water sources and address the water supply demands of Mexico City. This initiative involved offering compensation to upstream farmers and landowners for their contributions to water protection [2]. Likewise, the Commonwealth of Australia has pursued biodiversity protection and restoration based on economic compensation to farmers and land managers [3]. In the United States, the environmental quality incentive program and protective reserve program have been instrumental in preserving crucial natural and cultural resources. These initiatives offered economic incentives to landowners to encourage responsible stewardship [4,5]. The Chinese government has been actively involved in numerous PES projects since the 1990s, with the most notable being a large-scale project aimed at reforesting converted farmland, which ranks among the most substantial PES undertakings worldwide. The use of compensation mechanisms has effectively driven a positive response to environmental conservation, addressing the socioeconomic needs of local communities.
In recent years, the study of PES as a policy tool has emerged as a prominent field within environmental economics, yielding a substantial body of research results that have significantly influenced policy practice. Prior to the conceptualization of ecosystem services, scholars referred to this financial policy for environmental benefits as “payments for agro-biodiversity conservation services” or “investments in biodiversity conservation”. However, with the introduction of the ecosystem services concept, researchers have leaned toward the term “payment for ecosystem services” (PES) to define this policy tool. Despite the varying nomenclature, the fundamental essence of PES remains consistent (a transfer payment from ecosystem service beneficiaries to providers), which serves to harmonize the relationship between protection and development. There are diverse perspectives regarding the definition and understanding of PES. Wunder (2015) [6] characterizes PES as specific ecosystem service transactions voluntarily undertaken by buyers and sellers and rooted in economic principles. Conversely, Muradian et al. (2010) [7] and Engel (2008) [8] view PES as an institutional arrangement, highlighting the significance of third-party payments to counteract activities that degrade the social environment. In this context, government interventions may provide economic or noneconomic incentives to ecosystem service providers, fostering ecosystem protection and sustainable use. To facilitate the exchange and dissemination of scientific research, this paper consolidates relevant concepts from environmental and economic policy tools to offer a comprehensive understanding and critical insights on policy design, implementation, and management.
Traditionally, subject reviews have relied on qualitative literature reviews that are limited in scope to gain an understanding of research progress and theoretical advancements in specific fields. Extensive evidence demonstrates the positive impact of PES on ecological restoration and biodiversity conservation. In the past, scholars have conducted literature reviews and analyses based on case studies. For instance, Nelson Grima et al. (2016) [9] examined 40 cases that investigated the costs of ecosystem services in Latin America. The researchers systematically summarized the ecosystem types, compensation schemes, incentive measures, institutional arrangements, and policy frameworks of PES using spatial and temporal scales, which provided valuable insights for the policymakers charged with designing future PES plans. Another meta-study by Wunder (2018) [10] analyzed 70 case datasets to summarize the costs, targets, compensation subjects, and compensation methods of ecosystem services worldwide. Martin-Ortega et al. (2013) [11] conducted an analysis of the implementation process and constraints of PES but only focused on cases related to water supply traded as an ecosystem service [1]. However, to fully grasp the current status and development trends, relying only on qualitative literature reviews may not be sufficient, given the complexity of the subject, which spans multiple disciplines. Therefore, this paper aims to complement the traditional approach by incorporating a broader scope and adopting a quantitative analysis in addition to qualitative literature review techniques.
The analysis of big data has assumed an increasingly vital role in extracting valuable academic information, while knowledge maps offer a powerful means for drawing, mining, analyzing, classifying, and displaying knowledge. In the realm of science and technology management, CiteSpace Win 5.7.R5 stands as an analytical visualization tool that enhances the clarity and interpretability of bibliometric analysis and data mining algorithms, thereby aiding in the identification of important trends and key aspects of knowledge structures. Over the past decade, research based on CiteSpace has been focused on the ecosystem services of farm land [12], forest land [13,14,15], freshwater space [16] or urbanized land [13,14,15], has addressed the PES of specific regions such as Latin America [17], or has covered only single research fields, including agriculture science [18] and green technology [19]. Holistic summaries focusing on both the ecosystem services of various landscapes and the relevant PES of various countries are scarce. Previous research has focused on the thematic evolution of PES research based on bibliometric analysis, but it lacks in-depth insight into the effectiveness of PES [20]. Thus, this study aims to present the global research hotspots and knowledge networks of PES, covering the practical experiences of PES in various countries and regions.
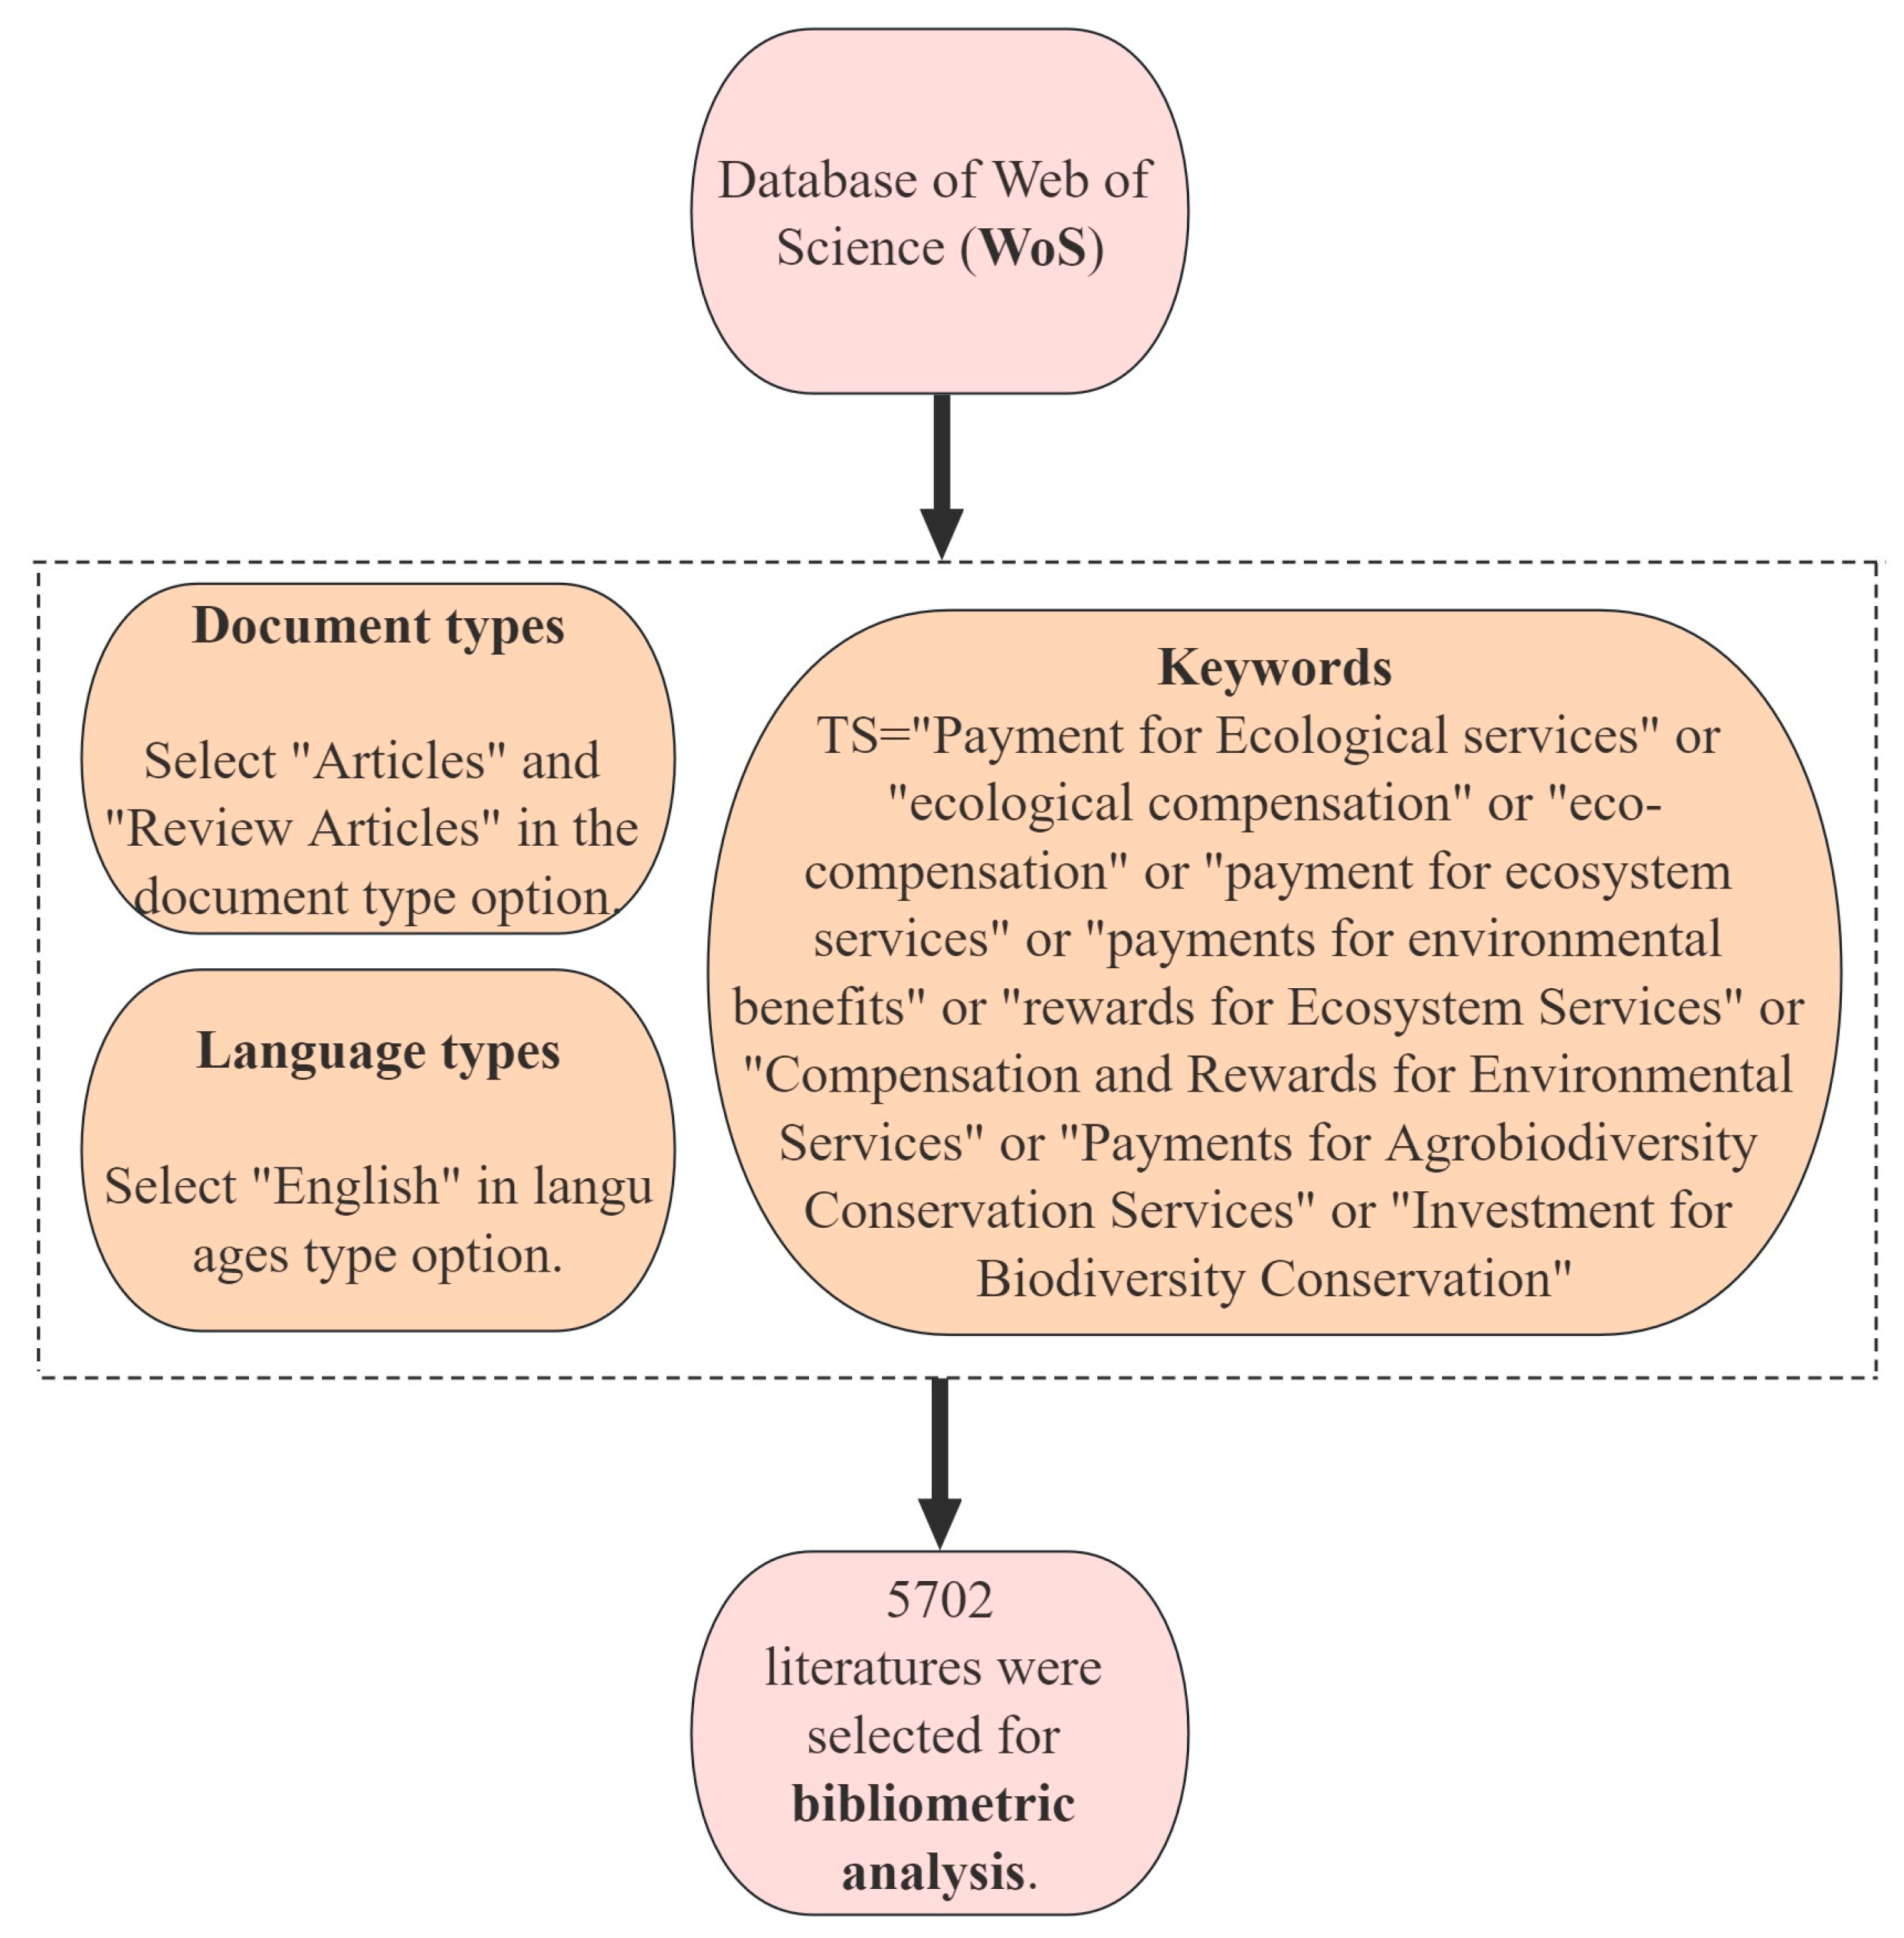
Through the integration of qualitative and quantitative literature, this paper systematically organizes and analyzes research outcomes and practical experiences in the field of PES. The study seeks to provide a more comprehensive perspective and an in-depth understanding for PES researchers and practitioners, offering valuable references for both academic circles and policy makers. Drawing on scientometrics analysis based on CiteSpace, the research establishes the bibliometric characteristics of articles published on the Web of Science from 1987 to 2022 and visualizes their interrelationships. Specifically, the study is guided by four primary objectives: (1) to comprehend the global definition of PES; (2) to identify the most-cited scholars, documents, and periodicals in the field; (3) to elucidate the main research hotspots in this domain and their evolutionary trajectory; and (4) to explore emerging topics related to ecosystem service payments for future consideration in climate change mitigation. This paper aims to complement the traditional disciplinary review approach by expanding its scope and incorporating both qualitative and quantitative methodologies.

2. Materials and Methods

2.1. Data Collection

There are two steps in collecting data for CiteSpace analysis. The first step is to select a reputable and comprehensive bibliographic database that offers wide-ranging access to high-quality refereed journal articles as reliable sources of knowledge. The publications selected for this study were identified in WoS. Thomson Reuters’s WoS—including the Science Citation Index Expanded (SCI-EXPANDED), the Social Sciences Citation Index (SSCI), and the Arts & Humanities Citation Index (AHCI) databases—covers approximately 12,000 leading journals worldwide and provides powerful access to bibliographic and citation information pertaining to published research articles; it is considered as an ideal data source for bibliometric investigations [21].
Another step involves the use of appropriate keywords to select articles from a bibliographic database. Special attention should be given to the validity and representativeness of keywords, with checking performed to assess the relevance of each study returned [21]. The literature was retrieved from 1987 to 2022. The topic search consisted of index words related to PES as follows: “ecological compensation” or “eco-compensation” or “payments for ecosystem services” or “payments for environmental benefits” or “rewards for ecosystem services” or “compensation and rewards for environmental services” or “payments for agrobiodiversity conservation services” or “investment for biodiversity conservation”. This search generated 8042 records, with articles as the document type. To eliminate “noise” in the database, that is, errors or abnormal data that might impact the results of the data analysis, the dataset was reduced to 5702 records, limited to articles and reviews after filtering other record types (e.g., editorial material, proceedings papers). The article document type records were exported to CiteSpace for further analysis.

2.2. CiteSpace and Analysis

CiteSpace is a Java-based scientific visualization software package used for analyzing and visualizing co-citation networks, developed by Dr. Chaomei Chen (2006). It has improved the clarity and interpretability of visualizations with a variety of visual analytic functions as compared to earlier visualization tools [22]. In this study, we used the method of bibliometric analysis to reveal the research trend and clarify the research status. First, we constructed the national collaboration network, institutional collaboration network, author collaboration network, journal collaboration network, and document co-citation network and analyzed their influence degree in this field using a visualization map. We identified the countries, institutions, authors, and journals that made the most contributions in this field as well as the literature with high co-citation frequency [23]. Secondly, we analyzed the degree of emergence and frequency of specific keywords to understand their importance and to identify the research interests in the field. By using CiteSpace for bibliometric analysis in this paper, we can have a more comprehensive understanding of the research status and development trends in this field; the analysis process is shown in Figure 1 [24].

3. Results

3.1. Overview of PES Definition and Main PES Projects

At first, we collated the definition and projects related to PES by reviewing the relevant literature. Table 1 shows the concepts and definitions similar to PES, including payments for environmental benefits, rewards for ecosystem services, compensation and rewards for environmental services, payments for agrobiodiversity conservation services, and investment for biodiversity conservation. Table 2 lists the projects that have been implemented to protect forest ecosystems, watersheds, and biodiversity in the USA, Europe, Africa, and Asia.

3.2. Research Outputs and Their Categories from CiteSpace

The progression of papers published related to PES during 1987–2022 is shown in Figure 2. A clear upward trend over time can be observed, indicating increasing scientific research in PES. According to Figure 2, since 2007, PES has gained significant attention from numerous researchers as a powerful tool for achieving sustainable development and effective environmental governance. A substantial amount of research has been conducted on PES, leading to an ongoing increase in the literature related to PES. As of 2021, a large amount of research has been carried out in this field; however, recently, research progress may has been hampered by the global COVID-19 epidemic, which has indirectly caused delays in academic publishing. Therefore, the number of studies in 2022 is relatively low.

3.2.1. Research Direction of PES

All articles covered one of 110 ISI (Institute for Scientific Information)-identified subject categories in the WoS. Before 2007, the classification of subject categories was not obvious due to the limited number of studies. With a large increase in research, the division of research directions has become increasingly significant since 2007. The top 10 subject categories include environmental sciences and ecology (50.77%), business economics (11.04%), biodiversity conservation (9.58%), science technology and other topics (7.54%), forestry (5.14%), agriculture (4.17%), engineering (3.52%), water resources (3.40%), geography (2.76%), and public administration (2.07%), which are shown in Figure 3. Since 2007, related papers have been published in 248 different journals (Figure A1), including Ecological Economics, which is the most prominent, with 2837 citations (Table A1), followed by Science (2404) and Conservation Biology (2040). Journals with a high impact factor may have a higher frequency of citations. In addition, top academic journals that publish original research in a wide range of scientific fields are included; in addition to the previously mentioned Science, there is also Nature. Science has the highest Betweenness Centralities (BC: a metric of a node that measures how likely it is that an arbitrary shortest path in a network will go through the node, which shows the contribution of a node in making connections with other nodes in a network) ratio (0.96), and its published papers have been consistently cited since 2007. Other journals with high relative BC ratios include Ecological Economics (0.86) and Nature (0.93). Therefore, these three journals are the core nodes connecting other nodes in the co-citation network of PES research journals.

3.2.2. Country Collaboration Network

In order to better show the research of PES in various countries and their connections, CiteSpace was used to analyze the cooperation between countries and form a PES national cooperation network, as shown in Figure 4. In the figure, the colors of the nodes indicate the year of publication, the sizes of the nodes represent the number of publications, the lines between the nodes represent the cooperative relationship, and the thickness of the lines represents the strength of the cooperative relationship. Table A2 lists the top 10 countries with the highest number of publications. The United States was the largest contributor, with 1484 published papers, followed by China (777). The United Kingdom ranked third, with 521 publications. Australia and Germany have between 400 and 500 articles. Countries that have produced 200 to 300 articles include Spain, France, Brazil, and Canada. Other countries, such as the Netherlands, have less than 200 articles. In general, the amount of output in each country is related to the number of research institutions, access to research funding, and the proportion of research institutions with a research focus on PES. The United States is one of the important participants and leaders in PES research and has a significant influence on the policy development and management practices of PES research. In China, one of the world’s most populous country, PES research has received the extensive attention of scholars. In order to realize the strategy of sustainable development, China has rich experience in PES research and practice, which provides numerous case studies for global PES research. From Figure 4, it can be seen that certain links (indicated by the lines representing the cooperative relationship) have been established between various countries (Australia plays a core role in the international collaboration), but the overall level of cooperation is low, and the links are weak, especially between China and European countries, which indicates that the aforementioned research gaps should be addressed further by future PES research.

3.2.3. Institution Collaboration Network

From 1987 to 2022, the Agency Collaboration Network consisted of 531 agencies and 645 collaboration segments; the institutions with a large number of publications and significant cooperation with partners are shown in Figure 5. As a market-oriented and economic approach for most countries, PES can promote the protection and restoration of the environment through economic incentive mechanisms. The maturity of the research community is relatively high, showing that the structure is relatively solid and that there are many close relationships. Table A3 lists the top 20 institutions contributing to total output. As a first-class scientific research institution in China, the Chinese Academy of Sciences has published 210 relevant articles, aiming at supporting government decision making and promoting the construction of ecological civilization based on scientific research on PES policies and practices. The other institutions with a high number of publications are the University of Queensland (126), the University of Cambridge (91), Wageningen University (78), and the Nature Conservancy (75). China has made the greatest contribution to PES research, with two institutions (Chinese Academy of Sciences and Beijing Normal University) ranking first and sixth, respectively). The United States has also produced a significant amount of research on PES.

3.2.4. Document Co-Citation Network (DCN)

CiteSpace analyzed 1254 references co-cited between 1987 and 2022 and used keyword clustering to label the clusters. The most-cited articles are often seen as milestones because of their pioneering contribution [6]. As shown in Table 3, as a homogeneity or consistency measure of cluster quality, the 15 largest clusters all scored above 0.8, indicating reliable quality, as they were close to the maximum value of 1.00. The largest cluster—#0 sustainable livelihoods—contains 70 papers and is slightly larger than the others. Based on the average reference year of each cluster, most are relatively new clusters, while #6 Asia has a longer duration and is an older problem. Table A4 shows the top 10 papers, cited more than 91 times each. Three of the top 10 papers are from cluster #2. Clusters #10 and #25 contain two papers each, and the remaining three are from #12, #18, #16, and #3.
Wunder (2015) [6] published a paper entitled “Revisiting the concept of payments for environmental services”, which is the most-cited article in our dataset, with 167 citations. This paper revisits the concept of PES and reviews existing PES definitions, explaining many valid conceptual issues raised in the recent PES literature. In addition, Engel, Pagiola, and Wunder (2008) [61] published a paper entitled “Designing payments for environmental services in theory and practice: An overview of the issues”, which discusses issues arising from the design and implementation of PES from the perspective of environmental economics. PES projects vary in the type and size of ES demand, source of payment, type of activity of payment, performance measures used, and payment mode and amount. In addition, the effectiveness and efficiency of PES mainly depend on the program design [8]. The 10 most frequently cited studies are shown in Table A4.

3.2.5. Author Co-Citation Network

The conclusions in this section are intended to illustrate frequently cited authors. Importantly, in this analysis, all publications of a given author were combined into one, which means that only the first author was considered. The most-cited author is Wunder, who is also a key node in the network, because the high BC value is an indicator of the translational potential of scientific contributions. Wunder bridges different stages of development in the field of PES. Table 4 lists the top 10 authors with more than 371 citations. The Engel co-citation frequency is 778, the Ferraro co-citation frequency is 634, the Pagiola co-citation frequency is 620, and Muradian, Costanza, and Corbera have citation frequencies between 500 and 600. Kosoy, Ostrom, and Vatn are cited fewer than 400 times.

3.2.6. References with Citation Bursts

Citation bursts refer to those articles that have seen a sharp increase in citations, which can reflect the dynamics of a field to some extent. The top ten most frequently cited references are shown in Table 5 below. The earliest citation escalation began in 2008, entering a stage of continual development since 2008; the relevant research content is routinely updated. The research focus has evolved with changes in the ecological environment and the formulation and implementation of policies. From 2007 to 2022, researchers redefined the PES concept based on more case studies [6]. This paper discusses the problems in the design and implementation of PES from the perspective of environmental economics [8], provides a new theoretical approach to PES, emphasizing institutional and political economy issues [7], evaluates the trends and status of PES mechanisms, and expands the key functions of PES [62]. In addition, it critically discusses the applicability of PES and the most important challenges that have emerged, as well as social equity issues [63,64]. Finally, it discusses the characteristics and experiences of PES cases in developing and developed countries to explore the view that PES projects are both more effective overall and cost-effective [61,65].

3.2.7. Keyword Analysis

Keyword collinear analysis can accurately grasp the current research hotspots in the field and predict future research trends [68]. In this paper, a total of 491 keyword nodes and 618 connection lines were obtained. The size of nodes in the figure directly reflects the frequency of keywords, as shown in Figure 6. The most popular keywords of PES research were ecosystem service (1423), conservation (1324), and biodiversity (1029). In order to further highlight the changing trend of PES topics, we selected burst keywords to reflect the hotspots of PES research with different persistent periods of popularity and to further explore new research directions. The top 15 keywords with the strongest citation bursts are shown in Table 6. “Cost” is the earliest keyword that emerged, in 1999. From the perspective of emergence intensity, the top three keywords with the highest emergence intensity are REDD (14.89), poverty (11.75), and tropical forest (11.21). From 2007 to 2011, poverty, ecology, wildlife, REDD, and tropical forest appeared more frequently. This shows that the research has mainly focused on tropical forests, wildlife protection, and other issues related to ecosystem conservation. From 2012 to 2016, the keywords “property rights” and “market-based instruments” appeared most frequently, which demonstrates that researchers were paying more attention to social–ecological systems during this period. From 2017 to 2022, land conversion programs and ecological compensation appeared most frequently. During this period, research tended to integrate PES with biodiversity conservation and the environmental management of ecosystem services.

4. Discussion

The discussion section provides an overview of the concepts related to PES and explores the development and trends of documents and journals as well as the focus of scholars in the field of PES using the visualization results from CiteSpace. It elaborates on the research hotspots in the field of PES during this period and concludes with an outlook and trend predictions. This analysis, based on CiteSpace, of bibliographic records in the field of PES provides a unique and interesting snapshot of PES.

4.1. Development of PES Understanding

The priorities and objectives of payment schemes for ecosystem services vary, leading to differences in their design and implementation (see Table 1). Our findings reveal certain commonalities between project practices and concept definitions, including (1) the utilization of financial or nonfinancial incentives, (2) definite identification of trading parties, (3) government-led initiatives, (4) emphasis on sustainable management and protection, and (5) integration of social development goals. The theoretical framework underpinning these practices encompasses Coase’s market transaction theoretical framework [8], Pigou’s tax collection and subsidy framework, and the theories of environmental economics and social systems [69]. In the evolution of PES projects worldwide, contextual factors play a crucial role, leading to specific research focuses within the PES conceptual framework. Notably, scholars such as Wunder and Pagiola advocate for addressing externalities and the inadequate supply of ecosystem services through market transactions [70,71]. Pigou’s framework of tax collection and subsidies proposes government intervention to ensure an effective supply of ecosystem services, with taxation being a primary means of generating funds for PES. Researchers in environmental ecology and economics argue that the primary goal of PES is to stimulate the production of public goods, such as ecosystem services, while averting potential ecosystem degradation and biodiversity loss. Additionally, the foundational economic and social system influences the design and implementation of PES schemes. Scholars in the social sciences have shown a growing interest in exploring the role of ecosystem payments in achieving social and economic development goals and promoting equitable distribution within society [7]. By integrating insights from diverse theoretical perspectives and empirical studies, the understanding of PES practices can be enriched, facilitating more effective and contextually relevant ecological compensation strategies [10,72,73].

4.2. Scholars, Documents, and Journals in PES Promotion

Based on the analysis of 5702 articles published between 1987 and 2022, this study found a significant increase in research output by researchers during this period (Figure 2). In terms of countries represented, authors and institutions from the USA, China, the UK, Australia, and Germany have been the most productive in this field. In general, the number of outputs is related to the number of research institutions, access to research funding, and the proportion of research institutions with a research focus on PES. The USA, as the main birthplace of ecosystem services research, is relatively ahead of other countries in both theoretical research and methodology. China has the largest scale of PES investment and practical experience to promote the provision of ecosystem services and human well-being in the world. The Chinese Academy of Sciences is the most productive institution. The University of Queensland from Australia has also made great contributions to PES-related research [74], focusing more on areas related to biodiversity conservation and water resource protection, which are important issues in Australia. In terms of scholars, Wunder and Engel of Brazil have significantly influenced the field [8,10]. Scholars from the USA, including Ferraro and Pagiola, as well as Muradian from the Netherlands, have contributed to over 10% of the publications in the field of PES. These highly productive scholars come from developed countries that have well-established PES mechanisms, and they provide a solid research foundation for scholars.
From the journal perspective, Ecological Economics has the highest citation frequency, followed by Science, which indicates the prominent role of ecological economics in PES research [74]. As the focus of researchers shifts, PES research on watersheds and biodiversity has gradually become a hot topic, leading to the increased influence of related journals such as Conservation Biology. In terms of keywords, “cost” is the earliest keyword, emerging in 1999. In the early stage of PES research, researchers paid more attention to cost. With the maturity and improvement of PES, the cost gradually decreased, and more economic, social, and environmental benefits were seen. The three most prominent keywords are REDD, poverty, and tropical forests. REDD is a global PES project led by the United Nations [75], and its implementation, effectiveness evaluation, and impact assessment are topics receiving global scholarly attention [76]. Poverty has a high prominence because ecological issues, poverty, and economically sustainable development are the focal points of research in PES. Simultaneously, PES research initially focused on forests, especially tropical forests, which is why tropical forests is a prominent keyword. However, by analyzing more keywords, PES is gradually shifting from focusing on forests to a more comprehensive direction, which includes wildlife, land resources, and other elements. The research is transitioning from fundamental research to social application research that provides specialized technical guidance and policy decision supports.

4.3. Research Hotpots of PES

Our findings reveal that the top 15 keywords exhibiting the most pronounced citation bursts serve as proxies for the principal subjects of research attention, notably tropical forest ecology, wildlife, and river basin dynamics. In addition, topics such as REDD, ecological compensation, natural resource management, land conversion programs, and market-based instruments are the main points of the study. However, it is essential to note that bibliometrics can only provide certain statistical information. Consequently, based on these findings, we synthesized insights from the literature to highlight three research hotpots related to the effectiveness of PES, including the evaluation of effectiveness, efficiency assessment, and equity evaluation.
(1)
Evaluation of effectiveness
The evaluation of the effectiveness of ecosystem service compensation projects represents a pivotal focus within PES research. Extensive integrated assessments of nationally and internationally significant projects have been conducted, as shown in Table 2. Evaluating the impact of PES projects typically entails establishing a baseline for ecological compensation and comparing scenarios before and after intervention to ascertain whether additional benefits exceed the baseline [77]. Effectiveness assessments first require the establishment of ecological baselines and the utilization of biophysical indicators, such as forest cover and landscape patterns, to evaluate the additionality [78]. Simultaneously, discussions are emerging regarding the management of effects, encompassing the integration of natural sciences into decision-making processes, dynamic baselines, trade-offs among various services, synergistic effects, monitoring mechanisms, standards, and ecological sustainability principles [73,77,79]. Furthermore, factors influencing the effectiveness of PES projects have become subjects of extensive research. The voluntary nature of PES project implementation has emerged as a significant consideration, prompting scholars to focus on the willingness of both parties involved in ecosystem service transactions. Key research imperatives include assessing various participation models [17], incorporating local priorities into monitoring efforts [20], investigating the interactions between social and ecological outcomes [64], devising pragmatic metrics [7], and researching the long-term impacts on communities [80]. Attention is directed towards ensuring that issues such as land tenure, social capital acquisition, environmental attitudes, and the development of alternative livelihood strategies are integral aspects of PES project effectiveness evaluation.
(2)
Efficiency assessment
Efficiency studies in PES focus on maximizing overall ecological benefits, providing a basis for rational ecological conservation planning for governments and organizations. To effectively achieve the goals of PES, it is crucial to maximize the net value of natural capital conservation and sustainable ecological supply while subtracting all associated social costs. The efficiency of ecological compensation mechanisms fundamentally relies upon consideration of both societal benefits and the gains accrued by participants. Pagiola’s efficiency analysis framework provides a theoretical foundation, balancing the net private profits of landowners with the net value of ecosystem services generated by land use changes [71]. Cost–benefit analysis is a central criterion in evaluating the efficiency of PES projects, calculating opportunity costs induced by changes in land use patterns while aiming to maximize ecological conservation output [81]. Current research in PES projects is concentrated on efficiency measurement tools, spatial institutions, and model designs. Efficiency measurement tools for PES projects include considerations of temporal and spatial dimensions, budget constraints, additionality, and PES ecological baselines. On the other hand, spatial modeling integrates multiple objectives of ecosystem services and combines participant cost factors to select appropriate compensation areas [82]. Utilizing benefit-based positioning principles and applying gap analysis help determine priority areas for biodiversity conservation [83].
(3)
Equity evaluation
The findings of bibliometric analysis underscore “poverty” as a keyword of significance, ranking second only to the intensity associated with “REDD.” This observation indicates a pronounced international scholarly interest in investigating the role of PES projects in the context of poverty alleviation. The potential for replicating and extending ecosystem service compensation initiatives emerges as an opportunity to catalyze equitable development, particularly within protected areas and rural communities [6]. Primary research areas of focus are oriented towards the design of mechanisms that ensure the inclusive participation and equitable benefit accrual of vulnerable demographic segments [17,20]. There is an emphasis on integrating insights from the social sciences to achieve an equilibrium among economic, ecological, and equity imperatives [55]. Additionally, investigations are directed towards the intricate evaluation of trade-offs between efficiency and equity across diverse scales [7]. The experiential insights garnered from projects with a pronounced emphasis on fairness, such as South Africa’s “Working for Water” [59] and Costa Rica’s “Pago por Servicios Ambientales” [80], serve as invaluable references in the formulation of ecosystem service compensation models conducive to poverty alleviation.

4.4. Perspective on the Stronger Role of PES for Cliamte Change Mitgation

From a global perspective, we can anticipate that there will be more PES projects in the future, and the demand for scarce environmental funds will continue to increase. Especially in the current era when the world is constantly challenged by climate change, the PES projects should be designed beyond REDD+ and well-funded to effectively articulate ecological conservation and carbon dioxide (CO2) emission reduction.
It is undeniable that curbing deforestation in less developed regions is regarded as one of most cost-effective ways to cut global CO2 [84], which leads REDD+ to be preferred for most PES projects. As to the PES for other ecosystems, including grassland, wetland, farmland, bare land, and even developed land, they also can be improved with adequate funds to strengthen the role of PES in climate change mitigation. Several international cases demonstrate this possibility. For instance, the possibility of PES compensating for lost livestock revenue under grazing bans and provide carbon sequestration is proven to be effective during salt marsh protection [85]. Meanwhile, PES is proven to be an appropriate countermeasure to promote CSA (climate-smart agriculture), which can increase the productivity of farmland for farmer benefits and reduce CO2 for climate change mitigation [86]. From the perspective of PES project planning, governments have played a crucial role in policy formulation and funding allocation. For instance, many PES projects in China have benefited from significant government investment. However, the instances related to strengthened PES for climate change mitigation remain lacking. After all, governmental PES for climate change mitigation provide fewer benefits (e.g., public acknowledgment, tax exemption, tourism income) in the short term than those for poverty alleviation and biological conservation.
China has proposed an ecological compensation mechanism [87] and implemented a comprehensive plan for PES funding, which helps improve the efficiency of fund utilization. Scholars have proposed that the need for maximization of high-quality PES is urgent [84]. In the future, in addition to government contributions, it is important to fully mobilize the power of society and establish corresponding incentive mechanisms to create a framework where users pay and protectors benefit [88]. Considering the global challenges brought by climate change, a fair and efficient market articulating PES and carbon reduction is needed. The general carbon trade market and clean development mechanisms may boost the motivation and initiative of businesses to engage in PES. It is acknowledged that a pure carbon market may have limited impacts on consumers’ incentives to buy carbon services [85]. In terms of effective economic investment, a premium carbon market offering bundled with PES profits may help reduce carbon emissions across a large number of previous PES projects and thereby foster more climate-friendly PES in the future.
In terms of regulatory oversight for PES projects, currently, there is a lack of scientifically sound evaluation indicators to assess their effectiveness [62]. It is necessary to integrate natural sciences and social sciences to comprehensively assess the effectiveness of the impacts of PES projects on climate change mitigation and other fields. Additional scientific evaluation frameworks and mathematical models may contribute to the sustainable development of PES projects [73], which contribute to the establishment of integrated indicator systems for PES concerning the effectiveness of protection, the efficiency of fund utilization, and the equity of compensation. For example, the gross ecosystem product (GEP) indicator proposed by Chinese scientists is a valuable reference for monitoring and evaluating the effectiveness of ecological conservation [89].
Overall, PES will continue to be a core topic in research and practice. If designed appropriately, it can ultimately achieve a win–win situation, which is particularly important for developing countries [90]. For example, China’s PES projects have not only played a role in ecological protection [91] but have also effectively contributed to alleviating poverty and rural revitalization [92]. In the future, if more climate-friendly PES emerge, they will play more significant roles in both climate change mitigation and poverty reduction.

5. Conclusions

In this study, we investigated the characteristics of PES research trends in the past and present, based on a bibliometrics analysis on a global scale. We therefore have gained a better understanding of the PES-related studies, which help us to identify several challenges to PES development and offer suggestions for PES improvement. We found that environmental sciences and ecology are the core subject area, especially focusing on the research direction of “ecosystem service”, “conservation”, and “biodiversity”.
Productive authors and institutions in this field are mostly from the United States, China, and the United Kingdom. But fewer stable collaborations were found between different countries, institutions, and researchers. We propose that stronger cooperation in future PES research is needed between China and European countries. In terms of practices, the biggest challenge is scarce environmental funds. There are few scientific evaluation indicators to assess the effectiveness of PES in practice. We conclude that the assessment of the effectiveness, efficiency, and equity of PES projects constitutes a hotspot in the current research, and the strengthened role of PES in climate change will influence future PES. For the future, it is proposed to integrate natural sciences and social sciences to comprehensively assess the effectiveness of climate-friendly PES, which contributes to the sustainable development of PES research and application. It is necessary to create a fair and efficient market that boosts the motivation and initiative of society to engage in PES projects, to increase investment in comprehensive PES projects, helping to improve the efficiency of fund utilization, especially concerning climate change mitigation.
Overall, this study highlights the importance of PES in ecological restoration, biodiversity conservation, climate change mitigation, and poverty alleviation. By analyzing the challenges and future directions associated with PES, our study can offer several suggestions for improving the sustainable development of PES research and practice, which will be meaningful for the management of ecosystems, the mitigation of climate change, and the harmony between protection and development.

Author Contributions

Conceptualization, C.S., Y.L. and C.X.; methodology, C.S., Y.L. and L.L.; software, L.L.; validation, C.S., Y.L. and C.X.; formal analysis, C.S., Y.L., L.L. and X.W.; investigation, L.L. and X.W.; data curation, C.S., Y.L. and C.X.; writing—original draft preparation, C.S., Y.L., L.L. and X.W.; writing—review and editing, C.S. and C.X.; visualization, C.S., Y.L. and L.L. All authors have read and agreed to the published version of the manuscript.

Funding

This research was funded by the National Key Research and Development Program of China (2022YFB3903701), the National Natural Science Foundation of China (No. 42101290), and the Second Tibetan Plateau Scientific Expedition and Report, grant number 2019QZKK0308.

Institutional Review Board Statement

Not applicable.

Informed Consent Statement

Not applicable.

Data Availability Statement

The original contributions presented in the study are included in the article; further inquiries can be directed to the corresponding authors.

Conflicts of Interest

The authors declare no conflict of interest.

Appendix A

Figure A1. A visualization of the journal co-citation network.
Sustainability 15 15649 g0a1
Table A1. Top 10 most-cited journals with co-citation frequency.
JournalFrequencyBCImpact Factor
Ecological Economics28370.867
Science24040.9656.9
Conservation Biology20400.16.3
Proceedings of the National Academy of Sciences20230.07
Biological Conservation18230.565.9
Nature18040.9364.8
Land Use Policy15570.157.1
Journal of Environmental Planning and Management14830.433.9
PloS One134003.7
Ecosystem Services12400.147.6
Table A2. Top 10 countries based on frequency.
CountryFrequencyBCCountryFrequencyBC
USA14840.16Spain2490.28
The People’s
Republic of China
7770.16Brazil2350.51
England5210.19France2310.16
Australia4920.94Canada2000.72
Germany4090.11Netherlands1880.22
Table A3. Top 10 institutions based on frequency.
InstitutionCountryFrequencyInstitutionCountryFrequency
Chinese Academy of SciencesChina210Beijing Normal UniversityChina74
The University of QueenslandAustralia126The Australian National UniversityAustralia73
University of CambridgeEngland91Michigan State UniversityUSA71
Wageningen UniversityNetherlands78University of British ColumbiaCanada71
The Nature ConservancyUSA75University of FloridaUSA70
Table A4. Top 10 most-cited papers with co-citation frequency.
Citation CountsReferencesCluster
167Sven Wunder (2015) [6]25
162Engel et al. (2008) [8]10
149Roldan Muradian et al. (2010) [7]2
123Salzman et al. (2018) [62]12
120Borner et al. (2017) [65]25
111Vatn (2010) [67]2
108Muradian et al. (2013) [63]18
103Sven Wunder et al. (2008) [61]10
95Pascual et al. (2014) [64]16
91Wunder et al. (2018) [10]3

References

  1. Nepstad, D.; McGrath, D.; Stickler, C.; Alencar, A.; Azevedo, A.; Swette, B.; Bezerra, T.; DiGiano, M.; Shimada, J.; Seroa da Motta, R.; et al. Slowing Amazon deforestation through public policy and interventions in beef and soy supply chains. Science 2014, 344, 1118–1123. [Google Scholar] [CrossRef] [PubMed]
  2. Wester, P.; Merrey, D.J.; de Lange, M. Boundaries of Consent: Stakeholder Representation in River Basin Management in Mexico and South Africa. World Dev. 2003, 31, 797–812. [Google Scholar] [CrossRef]
  3. Huang, B.; Li, T.J.; Li, Y.; Ding, J.L.; Zhang, L.T.; Zho, L. The enlightenment of Australia′s experience in biodiversity conservation. J. Agric. Resour. Environ. 2022, 39, 65–71. [Google Scholar]
  4. Day, E. Targeting and the Environmental Quality Incentive Program; American Farmland Trust, Center for Agriculture in the Environment: Washington, DC, USA, 2001. [Google Scholar]
  5. Follett, R.F.; Samson-Liebig, E.; Kimble, J.M.; Pruessner, E.G.; Waltman, S. Carbon sequestration under CRP in the historic grassland soils of the USA. SSSA Spec. Publ. 2001, 57, 27–40. [Google Scholar]
  6. Wunder, S. Revisiting the concept of payments for environmental services. Ecol. Econ. 2015, 117, 234–243. [Google Scholar] [CrossRef]
  7. Muradian, R.; Corbera, E.; Pascual, U.; Kosoy, N.; May, P.H. Reconciling theory and practice: An alternative conceptual framework for understanding payments for environmental services. Ecol. Econ. 2010, 69, 1202–1208. [Google Scholar] [CrossRef]
  8. Engel, S.; Pagiola, S.; Wunder, S. Designing payments for environmental services in theory and practice: An overview of the issues. Ecol. Econ. 2008, 65, 663–674. [Google Scholar] [CrossRef]
  9. Grima, N.; Singh, S.J.; Smetschka, B.; Ringhofer, L. Payment for Ecosystem Services (PES) in Latin America: Analysing the performance of 40 case studies. Ecosyst. Serv. 2016, 17, 24–32. [Google Scholar] [CrossRef]
  10. Wunder, S.; Brouwer, R.; Engel, S.; Ezzine-de-Blas, D.; Muradian, R.; Pascual, U.; Pinto, R. From principles to practice in paying for nature’s services. Nat. Sustain. 2018, 1, 145–150. [Google Scholar] [CrossRef]
  11. Martin-Ortega, J.; Ojea, E.; Roux, C. Payments for Water Ecosystem Services in Latin America: A literature review and conceptual model. Ecosyst. Serv. 2013, 6, 122–132. [Google Scholar] [CrossRef]
  12. Porto, R.G.; de Almeida, R.F.; Cruz-Neto, O.; Tabarelli, M.; Viana, B.F.; Peres, C.A.; Lopes, A.V. Pollination ecosystem services: A comprehensive review of economic values, research funding and policy actions. Food Secur. 2020, 12, 1425–1442. [Google Scholar] [CrossRef]
  13. Liu, S.L.; Dong, Y.H.; Liu, H.; Wang, F.F.; Yu, L. Review of Valuation of Forest Ecosystem Services and Realization Approaches in China. Land 2023, 12, 1102. [Google Scholar] [CrossRef]
  14. Chen, S.Y.; Chen, J.; Jiang, C.Q.; Yao, R.T.; Xue, J.; Bai, Y.; Wang, H.; Jiang, C.; Wang, S.; Zhong, Y.; et al. Trends in Research on Forest Ecosystem Services in the Most Recent 20 Years: A Bibliometric Analysis. Forests 2022, 13, 1087. [Google Scholar] [CrossRef]
  15. Xie, H.L.; Zhang, Y.W.; Choi, Y.; Li, F.Q. A Scientometrics Review on Land Ecosystem Service Research. Sustainability 2020, 12, 2959. [Google Scholar] [CrossRef]
  16. Zhang, H.X.; Nijhuis, S.; Newton, C. Freshwater blue space design and human health: A comprehensive research mapping based on scientometric analysis. Environ. Impact Assess. Rev. 2022, 97, 15. [Google Scholar] [CrossRef]
  17. Perevochtchikova, M.; Castro-Díaz, R.; Langle-Flores, A.; José, J.; Ugalde, T.J.E.S. A systematic review of scientific publications on the effects of payments for ecosystem services in Latin America, 2000–2020. Ecosyst. Serv. 2021, 49, 101270. [Google Scholar] [CrossRef]
  18. Tancoigne, E.; Barbier, M.; Cointet, J.P.; Richard, G. The place of agricultural sciences in the literature on ecosystem services. Ecosyst. Serv. 2014, 10, 35–48. [Google Scholar] [CrossRef]
  19. Tang, J.; Fang, Y.D.; Tian, Z.Y.; Gong, Y.H.; Yuan, L. Ecosystem Services Research in Green Sustainable Science and Technology Field: Trends, Issues, and Future Directions. Sustainability 2023, 15, 658. [Google Scholar] [CrossRef]
  20. Wang, L.; Lv, T.G.; Zhang, X.M.; Hu, H.; Cai, X. Global research trends and gaps in ecological compensation studies from 1990 to 2020: A scientometric review. J. Nat. Conserv. 2022, 65, 13. [Google Scholar] [CrossRef]
  21. Fang, Y.; Yin, J.; Wu, B. Climate change and tourism: A scientometric analysis using CiteSpace. J. Sustain. Tour. 2017, 26, 108–126. [Google Scholar] [CrossRef]
  22. Chen, C. CiteSpace II: Detecting and visualizing emerging trends and transient patterns in scientific literature. J. Am. Soc. Inf. Sci. Tec. 2006, 57, 359–377. [Google Scholar] [CrossRef]
  23. Small, H. Co-citation in the scientific literature: A new measure of the relationship between two documents. J. Am. Soc. Inf. Sci. Tec. 1973, 24, 265–269. [Google Scholar] [CrossRef]
  24. Wu, X.; Shen, Y.-S. The Bibliometric Analysis of Low-Carbon Transition and Public Awareness. Atmosphere 2023, 14, 970. [Google Scholar] [CrossRef]
  25. Pattanayak, S.K.; Wunder, S.; Ferraro, P.J. Show Me the Money: Do Payments Supply Environmental Services in Developing Countries? Rev. Environ. Econ. Policy 2010, 4, 254–274. [Google Scholar] [CrossRef]
  26. Pagiola, S.; Arcenas, A.; Platais, G. Can Payments for Environmental Services Help Reduce Poverty? An Exploration of the Issues and the Evidence to Date from Latin America. World Dev. 2005, 33, 237–253. [Google Scholar] [CrossRef]
  27. Narloch, U.; Drucker, A.G.; Pascual, U. Payments for agrobiodiversity conservation services for sustained on-farm utilization of plant and animal genetic resources. Ecol. Econ. 2011, 70, 1837–1845. [Google Scholar] [CrossRef]
  28. Kate, K.T.; Bishop, J.; Bayon, R. Biodiversity Offsets: Views, Experience and the Business Case; IUCN—The World Conservation Union: Gland, Switzerland, 2004. [Google Scholar]
  29. Wunder, S. Payments for Environmental Service: Some Nuts and Bolts; CIFOR Occasional Paper; CIFOR: Bogor, Indonesia, 2005; Volume 42. [Google Scholar]
  30. Angus, W.D.; Mitchell, G. A Senate Review in the Wake of BP’s Deepwater Horizon Incident 2010. Available online: http://cip.management.dal.ca/publications/rep08aug10-e.pdf (accessed on 7 September 2023).
  31. Jones, G.H. The Canadian experience in frontier environmental protection. AAPG Bull. 1991, 75, 603–604. [Google Scholar]
  32. Assogba, N.P.; Zhang, D. The conservation reserve program and timber prices in the southern United States. For. Policy Econ. 2022, 140, 102752. [Google Scholar] [CrossRef]
  33. Sullins, D.S.; Bogaerts, M.; Verheijen, B.H.; Naugle, D.E.; Griffiths, T.; Hagen, C.A. Increasing durability of voluntary conservation through strategic implementation of the Conservation Reserve Program. Biol. Conserv. 2021, 259, 109177. [Google Scholar] [CrossRef]
  34. Gottfried RRBrockett, C.D.; Davis, W.C. Models of sustainable development and forest resource management in Costa Rica. Ecol. Econ. 1994, 9, 107–120. [Google Scholar] [CrossRef]
  35. Sierra, R.; Russman, E. On the efficiency of environmental service payments: A forest conservation assessment in the Osa Peninsula, Costa Rica. Ecol. Econ. 2006, 59, 131–141. [Google Scholar] [CrossRef]
  36. Ding, M. Ecological Compensation System of Forest in Costa Rica. World Environ. 2007, 18, 66–69. [Google Scholar]
  37. Smith, F.; Smillie, K.; Fitzsimons, J.; Lindsay, B.; Wells, G.; Marles, V.; Hutchinson, J.; O’Hara, B.; Perrigo, T.; Atkinson, I. Reforms required to the Australian tax system to improve biodiversity conservation on private land. Environ. Plan. Law J. 2016, 33, 443–450. [Google Scholar]
  38. Engert, J.E.; Laurance, S.G.W. Economics and optics influence funding for ecological restoration in a nation-wide program. Environ. Res. Lett. 2023, 18, 054020. [Google Scholar] [CrossRef]
  39. Hunt, C. Economy and ecology of emerging markets and credits for bio-sequestered carbon on private land in tropical Australia. Ecol. Econ. 2008, 66, 309–318. [Google Scholar] [CrossRef]
  40. Lin, J.; Zhang, L.; Zhang, M.; Zhang, H.; Guo, C.; Feng, S.; Xu, J. Distribution, sources, and ecological risk of organophosphate esters in the urbanized Jiaozhou Bay, East China. Environ. Sci. Pollut. Res. 2022, 29, 70167–70178. [Google Scholar] [CrossRef]
  41. Liu, Y.F.; Sun, H.J. Research on Bottleneck and Countermeasures of Ecological Civilization Construction in Greater Khingan Range Forest Region. Chin. For. Econ. 2014, 6, 7–11+38. [Google Scholar]
  42. Shi, P.J.; Yuan, Y.; He, C.Y.; Li, X.; Chen, Y. Land Use Pattern Adjustment under Ecological Security: Look for Secure Land Use Pattern in China. Geogr. Rev. Jpn. 2004, 77, 866–882. [Google Scholar] [CrossRef]
  43. Liu, S.R.; Dai, L.M.; Wen, Y.G.; Wang, H. A review on forest ecosystem management towards ecosystem services: Status, challenges, and future perspectives. Acta Ecol. Sin. 2015, 35, 1–9. [Google Scholar]
  44. Zhou, H.J.; Huang, S.L.; Wang, Y.Y.; Wang, A.J.; Jia, H.C. Multi-scales Analysis of Driving Forces on Land Use/Cover Change in China: Taking Farmland Returning to Forest or Grassland as a Case. Chin. J. Popul. Resour. 2006, 4, 21–27. [Google Scholar]
  45. Liu, J.G.; Li, S.X.; Ouyang, Z.Y.; Tam, C.; Chen, X.D. Ecological and socioeconomic effects of China’s policies for ecosystem services. Proc. Natl. Acad. Sci. USA 2008, 105, 9477–9482. [Google Scholar] [CrossRef]
  46. Luo, M.; Li, G.X. Effects of Different Operation Patterns of Returning Farmland to Forest (Grassland) on Rural Economy—A Case of Wuqi County. China J. Anhui Agri. Sci. 2010, 38, 5937–5939. [Google Scholar]
  47. Chen, B.P.; Chang, Z.F.; Qiao, J.; Chang, F.; Fan, B. Estimation of relative ecological value of returning farmland to forest & mountain enclosure: A case of Yongxing Township of Jingyuan County, Gansu Province. Arid Lan Geogr. 2013, 36, 1144–1152. [Google Scholar]
  48. de Koning, G.H.J.; Veldkamp, E.; López-Ulloa, M. Quantification of carbon sequestration in soils following pasture to forest conversion in northwestern Ecuador. Glob. Biogeochem. Cycles 2003, 17, 1098. [Google Scholar] [CrossRef]
  49. Bruso, X. Realizing Global Environmental Objectives Through Local Environmental Initiatives: The Incentives Behind Stakeholder Participation in Forest Carbon Sequestration Projects. Ph.D. Thesis, Massachusetts Institute of Technology, Cambridge, MA, USA, 2002. [Google Scholar]
  50. Van Hecken, G.; Merlet, P.; Lindtner, M.; Bastiaensen, J. Can Financial Incentives Change Farmers’ Motivations? An Agrarian System Approach to Development Pathways at the Nicaraguan Agricultural Frontier. Ecol. Econ. 2019, 156, 519–529. [Google Scholar] [CrossRef]
  51. Pagiola, S.; Honey-Rosés, J.; Freire-González, J. Assessing the Permanence of Land-Use Change Induced by Payments for Environmental Services: Evidence From Nicaragua. Trop. Conserv. Sci. 2020, 13, 15. [Google Scholar] [CrossRef]
  52. Paterson, K. INSIGHTS: Supporters Say Another Mexican Forest Defender Framed. Environment News Services 2005. Available online: https://www.worldpress.org/americas/2004.cfm (accessed on 7 September 2023).
  53. Hendrayanto, H.; Soedomo, S. Hydrological Services of Forests and Their Compensation Initiatives. J. Manaj. Hutan Trop. 2013, 19, 79–84. [Google Scholar] [CrossRef]
  54. Doron, I. Courts, ombudsman, and health-care policy: An exploratory study of israel’s national health care insurance act. Eur. J. Health Law 2004, 11, 391. [Google Scholar] [CrossRef]
  55. Danal, P. Asian Models of entrepreneurship—From the Indian Union and the Kingdom of Nepal to the Japanese Archipelago; World Scientific Publishing: Singapore, 2017. [Google Scholar]
  56. Han, L.; Bao, H.J.; Wang, C.C. International Comparison of Land-Lost Farmers’ Entrepreneurship Policy Patterns and Their Implications; Shanghai Land & Resources: Shanghai, China, 2020; Volume 41. [Google Scholar]
  57. Coetzer, A.; Louw, J. An evaluation of the Contractor Development Model of Working for Water. Water SA 2012, 38, 793–802. [Google Scholar] [CrossRef]
  58. Pienaar, W. Principles of Social Cost-Benefit Analysis of Public Road Projects Followed in South Africa. S. Afr. J. Ind. Eng. 2018, 29, 129–140. [Google Scholar] [CrossRef]
  59. Morton, A.; Yip-Hoi, T. Balancing Development with Environmental Stewardship in a UK Special Area of Conservation. In Proceedings of the SPE International Conference on Health, Safety and Environment in Oil and Gas Exploration and Production, Rio de Janeiro, Brazil, 12 April 2010; Volume 2010. [Google Scholar]
  60. Simpson, K.; Armsworth, P.R.; Dallimer, M.; Nthambi, M.; de Vries, F.P.; Hanley, N. Improving the ecological and economic performance of agri-environment schemes: Payment by modelled results versus payment for actions. Land Use Policy 2023, 130, 12. [Google Scholar] [CrossRef]
  61. Wunder, S.; Engel, S.; Pagiola, S. Taking stock: A comparative analysis of payments for environmental services programs in developed and developing countries. Ecol. Econ. 2008, 65, 834–852. [Google Scholar] [CrossRef]
  62. Salzman, J.; Bennett, G.; Carroll, N.; Goldstein, A.; Jenkins, M. The global status and trends of Payments for Ecosystem Services. Nat. Sustain. 2018, 1, 136–144. [Google Scholar] [CrossRef]
  63. Muradian, R.; Arsel, M.; Pellegrini, L.; Adaman, F.; Aguilar, B.; Agarwal, B.; Corbera, E.; Ezzine de Blas, D.; Farley, J.; Urama, K. Payments for ecosystem services and the fatal attraction of win-win solutions. Conserv. Lett. 2013, 6, 274–279. [Google Scholar] [CrossRef]
  64. Pascual, U.; Phelps, J.; Garmendia, E.; Brown, K.; Corbera, E.; Martin, A.; Gomez-Baggethun, E.; Muradian, R. Social Equity Matters in Payments for Ecosystem Services. BioScience 2014, 64, 1027–1036. [Google Scholar] [CrossRef]
  65. Börner, J.; Baylis, K.; Corbera, E.; Ezzine-de-Blas, D.; Honey-Rosés, J.; Persson, U.M.; Wunder, S. The Effectiveness of Payments for Environmental Services. World Dev. 2017, 96, 359–374. [Google Scholar] [CrossRef]
  66. Wunder, S. The Efficiency of Payments for Environmental Services in Tropical Conservation. Conserv. Biol. 2007, 21, 48–58. [Google Scholar] [CrossRef] [PubMed]
  67. Vatn, A. An institutional analysis of payments for environmental services. Ecol. Econ. 2010, 69, 1245–1252. [Google Scholar] [CrossRef]
  68. Ouyang, W.; Wang, Y.; Lin, C.; He, M.; Hao, F.; Liu, H.; Zhu, W. Heavy metal loss from agricultural watershed to aquatic system: A scientometrics review. Sci. Total Environ. 2018, 637–638, 208–220. [Google Scholar] [CrossRef]
  69. Farley, J.; Costanza, R. Payments for ecosystem services: From local to global. Ecol. Econ. 2010, 69, 2060–2068. [Google Scholar] [CrossRef]
  70. Wunder, S.; Alban, M. Decentralized payments for environmental services: The cases of Pimampiro and PROFAFOR in Ecuador. Ecol. Econ. 2008, 65, 685–698. [Google Scholar] [CrossRef]
  71. Pagiola, S. Payments for environmental services in Costa Rica. Ecol. Econ. 2008, 65, 712–724. [Google Scholar] [CrossRef]
  72. Wunder, S. When payments for environmental services will work for conservation. Conserv. Lett. 2013, 6, 230–237. [Google Scholar] [CrossRef]
  73. Naeem, S.; Ingram, J.C.; Varga, A.; Agardy, T.; Barten, P.; Bennett, G.; Bloomgarden, E.; Bremer, L.L.; Burkill, P.; Cattau, M.; et al. Get the science right when paying for nature’s services. Science 2015, 347, 1206–1207. [Google Scholar] [CrossRef]
  74. Gong, X.; Zhang, C.; Pang, Q. Quantitative analysis of international ecological compensation research literature from 1990 to 2013. J. Sichuan For. Sci. Technol. 2017, 38, 39–45. [Google Scholar]
  75. Engel, S. Conservation Payments under Uncertainty. Land Econ. 2015, 91, 36–56. [Google Scholar] [CrossRef]
  76. Corbera, E. Problematizing REDD+ as an experiment in payments for ecosystem services. Environ. Sustain. 2012, 4, 612–619. [Google Scholar] [CrossRef]
  77. Kalacska, M.; Sanchez-Azofeifa, G.; Rivard, B.; Calvo-Alvarado, J.; Quesada, M. Baseline assessment for environmental services payments from satellite imagery: A case study from Costa Rica and Mexico. Environ. Manag. 2008, 88, 348–359. [Google Scholar] [CrossRef]
  78. Sattler, C.; Trampnau, S.; Schomers, S.; Meyer, C.; Matzdorf, B. Multi-classification of payments for ecosystem services: How do classification characteristics relate to overall PES success? Ecosyst. Serv. 2013, 6, 31–45. [Google Scholar] [CrossRef]
  79. Alix-Garcia, J.; Janvry, A.; Sadoulet, E. The Role of Risk Targeting Payments for Environmental Services. SSRN 836144. Available online: https://are.berkeley.edu/~esadoulet/papers/PESsimulations-8-05.pdf (accessed on 7 September 2023).
  80. Pinchansky, S.C.; Cordero, R.C.; Salazar, R.C. Increasing Forest Cover for a CO2 Neutral Future: Costa Rica Case Study. Estud. Econ. Appl. 2021, 39, 23. [Google Scholar]
  81. Johst, K.; Drechsler, M.; Economics, F.W.J.E. An ecological-economic modelling procedure to design compensation payments for the efficient spatio-temporal allocation of species protection measures. Ecol. Econ. 2002, 41, 37–49. [Google Scholar] [CrossRef]
  82. Wünscher, T.; Engel, S.; Wunder, S. Spatial targeting of payments for environmental services: A tool for boosting conservation benefits. Ecol. Econ. 2008, 65, 822–833. [Google Scholar] [CrossRef]
  83. Powell, G.; Barborak, J.; Rodriguez, M. Assessing representativeness of protected natural areas in Costa Rica for conserving biodiversity: A preliminary gap analysis. Biol. Conserv. 2000, 93, 35–41. [Google Scholar] [CrossRef]
  84. Jayachandran, S.; De Laat, J.; Lambin, E.F.; Stanton, C.Y.; Audy, R.; Thomas, N.E.J.S. Cash for Carbon: A Randomized Controlled Trial of Payments for Ecosystem Services to Reduce Deforestation. Science 2017, 357, 267–273. [Google Scholar] [CrossRef]
  85. Muenzel, D.; Martino, S. Assessing the feasibility of carbon payments and Payments for Ecosystem Services to reduce livestock grazing pressure on saltmarshes. Environ. Manag. 2018, 225, 46–61. [Google Scholar] [CrossRef] [PubMed]
  86. Engel, S.; Adrian, J. Payments for environmental services to promote “climate-smart agriculture”? Potential and challenges. Agric. Econ. 2016, 47, 173–184. [Google Scholar] [CrossRef]
  87. Liu, G.; Wen, Y. Ecological and environmental compensation policies in China in the new era: Reform and innovation. Environ. Prot. 2018, 46, 6. [Google Scholar]
  88. Guerry, A.D.; Polasky, S.; Lubchenco, J.; Chaplin-Kramer, R.; Daily, G.C.; Griffin, R.; Ruckelshaus, M.; Bateman, I.J.; Duraiappah, A. Natural capital and ecosystem services informing decisions: From promise to practice. Proc. Natl. Acad. Sci. USA 2015, 112, 7348–7355. [Google Scholar] [CrossRef]
  89. Ouyang, Z.Y.; Song, C.S.; Zheng, H.; Polasky, S.; Xiao, Y.; Bateman, I.J.; Liu, J.; Ruckelshaus, M.; Shi, F.; Xiao, Y.; et al. Using gross ecosystem product (GEP) to value nature in decision making. Proc. Natl. Acad. Sci. USA 2020, 117, 14593–14601. [Google Scholar] [CrossRef]
  90. Kinzig, A.P.; Perrings, C.; Chapin Iii, F.S.; Polasky, S.; Smith, V.K.; Tilman, D.; Turner, B.L. Paying for Ecosystem Services—Promise and Peril. Science 2011, 334, 603–604. [Google Scholar] [CrossRef]
  91. Ouyang, Z.; Zheng, H.; Xiao, Y.; Polasky, S.; Liu, J.; Xu, W.; Wang, Q.; Zhang, L.; Xiao, Y.; Rao, E.; et al. Improvements in ecosystem services from investments in natural capital. Science 2016, 352, 1455–1459. [Google Scholar] [CrossRef] [PubMed]
  92. Shi, Y. Ecological poverty alleviation: The combination of precision poverty alleviation and ecological protection. Gansu Soc. Sci. 2018, 6, 169–176. [Google Scholar]
Figure 1. Flow chart of literature data collected for the PES. Note: TS means topic tag, which searches terms in title and abstract, author keywords, and keywords plus fields.
Sustainability 15 15649 g001
Figure 2. The number of published papers on PES (1987–2022).
Sustainability 15 15649 g002
Figure 3. The number of articles in the top 10 subject categories.
Sustainability 15 15649 g003
Figure 4. A visualization of the country collaboration network.
Sustainability 15 15649 g004
Figure 5. A visualization of the institution collaboration network.
Sustainability 15 15649 g005
Figure 6. A visualization of the keyword co-occurrence.
Sustainability 15 15649 g006
Table 1. Overview of PES-related definitions.
The TermDefinition
Payments for environmental benefitsThe economic incentives provided to individuals or communities who manage their land or natural resources in a way that generates positive environmental outcomes. These payments can take various forms, including direct cash payments, tax incentives, or in-kind transfers, and are typically made by beneficiaries who value the environmental services provided by the land managers [8].
Rewards for Ecosystem ServicesThe financial or non-financial incentives, provided to individuals or communities in exchange for their actions, that contribute to the provision of ecosystem services. These rewards can be in the form of direct payments, subsidies, tax incentives, or other types of compensation and are intended to encourage and support the sustainable management of natural resources and the conservation of ecosystems [25].
Compensation and Rewards for Environmental ServicesThe various forms of incentives provided to individuals or communities, in exchange for their actions, that contribute to environmental conservation and the provision of ecosystem services. These incentives can take the form of direct compensation, subsidies, tax incentives, or other types of rewards and are designed to address both environmental and poverty alleviation objectives [26].
Payments for Agrobiodiversity Conservation ServicesThe incentives provided to farmers or communities for their role in conserving and enhancing agricultural biodiversity. These incentives can take various forms, including financial payments, technical assistance, capacity building, and market access opportunities. The goal of PACS is to promote the conservation and sustainable use of agrobiodiversity, which contributes to food security, resilience, and sustainable agricultural development [27].
Investment for Biodiversity ConservationThe allocation of financial resources, either public or private, towards activities and initiatives that aim to protect, restore, or enhance biodiversity. These investments can take various forms, such as funding for protected areas, habitat restoration projects, species conservation programs, sustainable land management practices, and capacity-building efforts. The objective of investment for biodiversity conservation is to secure the long-term viability of ecosystems and species, promote sustainable development, and maintain the essential services provided by biodiversity [28].
Ecological compensationEcological compensation is a mechanism that provides economic incentives to individuals or organizations that provide environmental services, in order to promote the protection, restoration, and sustainable use of ecosystems [29].
Table 2. List of main PES projects.
PES Project NameCountryYearProtected ObjectsCompensation Mode
Canadian offshore oil spill Compensation mechanism project [30,31]Canada1991OceanLegislation establishes compensation mechanisms to clarify responsibility for oil spills
United States Protective Reserve Program project [5,32,33]The United States1991VegetationThe government compensates farmers on behalf of beneficiaries on the basis of returning farmland to forest
Costa Rica Forest ecological compensation project [34,35,36]Costa Rica1995ForestThe beneficiary pays through the market transaction; energy tax
Australian Federal Government biodiversity offsetting system [3,37,38,39]Australia1996BiodiversityLandlords sell credit to developers who need credit to fully compensate for the ecological damage caused by their development activities.
China Ecological Ranger Project [40,41,42,43]China2000ForestEcological compensation and ecological protection project funds are used to train some of the local poor people who have the ability to work to become forest rangers and other ecological protection personnel
China’s project of returning farmland to forest (grassland) [44,45,46,47]China2002Forest and GrassThe government compensates households that have returned farmland by providing subsidies for food, cash, and seedlings
Forest carbon sequestration project in Ecuador [48,49]Ecuador2002ForestThe beneficiary enters into an agreement with the farmer to pay through market transactions
Agricultural and animal husbandry complex ecological compensation project in Nicaragua [50,51]Nicaragua2003Agro-pastoral complex ecologyThe direct and opportunity costs of the GEF compensate farmers for their losses
Mexican Forest Hydrological Service compensation project [52,53]Mexico2005ForestThe government compensates the injured party on behalf of the beneficiary, and the compensation is paid annually and renewed every five years
Japan Land Requisition Compensation Project [54,55,56]Japan2012Cultivated landGovernments and water users work together to hire workers to remove invasive plants
Water Ecological Compensation Project in South Africa [57,58]South
Africa
2015WatershedGovernments and water users work together to hire workers to remove invasive plants
UK environmental sensitive area project [59,60]The United Kingdom2016Biodiversity, good landscapes, aquatic environmentThe EU and UK governments each bear half of the compensation funds and provide tiered compensation to farmers who meet the requirements
Table 3. Summary of the 20 largest clusters.
Cluster IDSizeSilhouetteLabelMean (Year)
0700.865sustainable livelihoods2017
1610.941ecological compensation mechanism2017
2600.989rural–urban2010
3530.902spatial targeting2012
4520.92Ecological–economic modelling2005
5510.95REDD2009
6490.968Asia2005
7450.974no net loss2015
8420.958peat-swamp forest2010
9410.979REDD+2012
10400.96incentive mechanisms2007
11390.932policy appraisal2009
12390.971forest water supply2016
13380.982governmentality2015
14360.977relational values2016
Size: the number of references that a cluster contains.
Table 4. Top 10 most-cited authors with co-citation frequency.
AuthorFrequencyBCAuthorFrequencyBC
Wunder, S11010.49Costanza, R5380.08
Engel, S7780.01Corbera, E4310.14
Ferraro, Pj6340.23Kosoy, N3960.14
Pagiol, S6200.04Ostrom, E3950.01
Muradian, R5850.4Vatn, A3710.11
Table 5. Top 10 references with the strongest citation bursts.
ReferencesStrengthBeginningEnd1987–2022 *
Engel et al. (2008) [8]69.042320082013Sustainability 15 15649 i001
Wunder (2007) [66]34.071320082012Sustainability 15 15649 i002
Wunder et al. (2008) [61]44.370520092013Sustainability 15 15649 i003
Vatn (2010) [67]31.734220102015Sustainability 15 15649 i004
R. Muradian et al. (2010) [7]42.851220112015Sustainability 15 15649 i005
Pattanayak et al. (2010) [25]30.663920122015Sustainability 15 15649 i006
R. Muradian et al. (2013) [63]31.024120152018Sustainability 15 15649 i007
Wunder (2015) [6]45.274720162020Sustainability 15 15649 i008
Salzman et al. (2018) [62]43.465220192022Sustainability 15 15649 i009
Börner et al. (2017) [65]34.584920192022Sustainability 15 15649 i010
* The color of dark blue indicates the period of the published articles with the reference, while the red color presents the emergence period of strongest citation bursts.
Table 6. Top 15 keywords with the strongest citation bursts.
KeywordsStrengthBeginningEnd1987–2022 *
cost7.4419992011Sustainability 15 15649 i011
poverty11.7520072014Sustainability 15 15649 i012
payments for environmental service10.6420082015Sustainability 15 15649 i013
issue9.0520082016Sustainability 15 15649 i014
ecology10.7820092013Sustainability 15 15649 i015
wildlife8.9120092012Sustainability 15 15649 i016
efficiency7.2920092013Sustainability 15 15649 i017
REDD14.8920102014Sustainability 15 15649 i018
tropical forest11.2120102013Sustainability 15 15649 i019
property right8.7520122014Sustainability 15 15649 i020
market-based instrument8.3620122015Sustainability 15 15649 i021
natural resource management7.8520142017Sustainability 15 15649 i022
land conversion program7.7720182020Sustainability 15 15649 i023
river basin7.3920192022Sustainability 15 15649 i024
ecological compensation7.8920202022Sustainability 15 15649 i025
* The color of dark blue indicates the period of the published articles with the keyword, while the red color presents the emergence period of strongest citation bursts.
Disclaimer/Publisher’s Note: The statements, opinions and data contained in all publications are solely those of the individual author(s) and contributor(s) and not of MDPI and/or the editor(s). MDPI and/or the editor(s) disclaim responsibility for any injury to people or property resulting from any ideas, methods, instructions or products referred to in the content.

