Article

An Assessment of the Impact of Climate Change on Asphalt Binder Selection in East China Based on the ARIMA Model

1
National Center for Materials Service Safety, University of Science and Technology Beijing, Beijing 100083, China
2
School of Environmental, Civil, Agricultural and Mechanical Engineering, University of Georgia, Athens, GA 30602, USA
*
Author to whom correspondence should be addressed.
Sustainability 2023, 15(21), 15667; https://doi.org/10.3390/su152115667
Submission received: 16 September 2023 / Revised: 1 November 2023 / Accepted: 3 November 2023 / Published: 6 November 2023

Abstract

:
Temperature is a key factor considered in the selection of asphalt binders for asphalt pavement construction. Currently, the asphalt binders used in some regions’ asphalt pavements are no longer suitable for anticipated climate conditions. The reasonable selection of asphalt binder is an important measure for asphalt pavement to adapt to climate change. This paper focuses on the potential impact of climate change on asphalt binder selection in East China in the future. This study is based on the performance grade (PG) system with SUPERPAVE specifications. It involved collecting meteorological data from 109 meteorological stations in East China from 1960 to 2019 and used the ARIMA prediction model to calculate the maximum and minimum design temperatures for road surfaces over the next 20 years. Based on the forecasted road surface temperature data, the impact of climate change on the choice of asphalt binder in East China was discussed. The research findings indicate that, validated by historical data, using the ARIMA model for future temperature prediction has proven reliability. There are some differences in different regions regarding the change in maximum and minimum pavement design temperatures. In 2019 and 2039, there are three and four high temperature grades in East China; these are PG52, PG58, and PG64 and PG52, PG58, and PG64, PG70 respectively. The dominant high temperature grade in East China will remain PG64, and a total of 23.80% of the regions in East China will experience a one-grade upward shift in high temperature grades. PG-28, PG-22, PG-16, and PG-10 are the four low temperature grades distributed in East China in both 2019 and 2039. Compared with 2019, the proportion of areas with grade PG-16 will increase from 33.86% to 34.89%, and the dominant low temperature grade in East China will remain PG-10 in 2039. In the next 20 years, low-temperature cracking issues related to asphalt pavement in some areas of East China will intensify, but the primary challenge will still be problems caused by high temperatures.

1. Introduction

The World Meteorological Organization reported in a statement of global meteorological conditions that July 2019 is the hottest month on record on Earth [1]. The global average temperature in this year was 1.1 °C higher than the pre-industrial level [2]. The past decade has become the hottest decade on record. More than a dozen countries around the world have reported record annual high temperatures, and the global climate will continue to warm in the future [1,3]. This ongoing rise in temperature trends will have profound impacts on infrastructure, with asphalt roads, a key part of infrastructure, receiving special attention. From a material performance perspective, the temperature sensitivity of asphalt binders makes asphalt pavement a highly temperature-sensitive structure [4,5]. The service performance and service life of asphalt pavement are significantly affected by temperature conditions. Both increases in annual average temperature and seasonal changes in temperature may directly lead to the degradation and damage of pavement structures [6]. In response to the impact of climate change on asphalt pavement, a series of related studies were carried out in various regions of the world [7,8,9,10].
Asphalt binders, affected by temperature, exhibit accelerated aging [11], reduced viscoelasticity [12], decreased viscosity [13], insufficient toughness [14], and enhanced brittleness [15], leading to performance issues in asphalt pavements such as rutting at high temperatures, low-temperature cracking, and fatigue damage [16,17,18,19]. Furthermore, the improper use of asphalt binders may also pose certain threats to the environment, such as noise pollution [20] and the release of toxic substances [21]. Given the current degree of climate change and anticipated future trends, material selection for existing asphalt pavements no longer meets requirements [22,23]. In a study involving 799 observation stations in the United States, Underwood et al. [24] found that 35% of the observation stations had chosen inappropriate materials over the past 20 years, resulting in additional maintenance and repair costs. Research by Stone et al. [18] also indicates that, with the ongoing progression of climate change, pavement performance is declining even under current design standard conditions. However, these studies also suggest that, by making informed choices about asphalt binders during the design phase, the durability and performance of asphalt pavements can be significantly enhanced [25]. Therefore, in the context of rising global temperatures, making a prudent selection of asphalt binders becomes particularly critical.
Researchers, integrating future climate prediction models, have analyzed and assessed the potential pavement issues induced by climate change. Liu et al. [26] highlighted that, with the continual rise in global temperatures, ruts and fatigue have become major challenges in climate change, anticipating that, by 2050, as many as 35% of road surfaces will confront more severe thermal cracking issues. Similarly, Gudipudi and colleagues [27], through quantitative studies, revealed the impact of climate change on U.S. pavement performance, estimating an increase of 2–9% in fatigue cracking and 9–40% in rutting issues over the next 20 years. Swarna et al. [28,29] evaluated asphalt concrete under future climate conditions, finding an average increase of 24.7% in permanent deformation and 11.46% in fatigue cracking. Research focused on southern Canada has shown similar trends, with climate change expected to intensify rutting issues, necessitating the maintenance, repair, and reconstruction of infrastructure earlier in its designed lifespan [30], practically implying an 8–16% advancement in the timing for pavement maintenance [17].
Considering the dramatic changes in future climate change, premature failure or higher maintenance costs may occur for flexible pavements [31,32,33,34]. The United States currently requires about USD 134 billion in government funds annually for road maintenance, but with the intensification of climate change, this cost is expected to rise by USD 785 million by 2050 [8]. By 2070, the total maintenance cost will increase further by USD 2.18 to USD 35.8 billion [24]. A global temperature rise of 1.5 °C would necessitate an additional expenditure of USD 2.8 billion by the U.S. to maintain its road network [8]. Without actions to adapt to climate change, South African road infrastructure could face an annual cost of USD 116.8 to USD 228.7 million [35]. Studies indicate that climate change leads to a reduction in the effective subgrade modulus and Hot-Mix Asphalt modulus, causing the average lifespan of pavements to drop from 16 years to 4 years. Over the next 100 years, with climate change taken into account, maintenance costs are projected to increase by 160%, significantly elevating pavement costs [36]. According to research based on data from the past 20 years, a typical asphalt pavement’s design life, when factoring in the impact of higher temperatures due to climate change, may see a reduction of approximately 6 million in allowable traffic load repetitions, which, in practical terms, means that the service life or design period of the pavement could be shortened by about 4 years [10].
However, once the pavement is constructed, the materials are unchanged during service (except for repairs), while temperatures are rising and extreme events are becoming more frequent [37,38]. Therefore, climate change should be considered in selecting materials. This paper focuses on asphalt binder selection in East China according to the SUPERPAVE performance grading system in a climate change context. The meteorological observation data of 109 meteorological stations in East China from 1960 to 2019 were employed to calculate the related temperature parameters in 2019 and to predict them in 2039 using the autoregressive integrated moving average model (ARIMA) [39,40]. On this basis, the trend of pavement design temperature in East China was evaluated. The appropriate selection of asphalt binders used in asphalt pavements in East China in the next two decades was discussed to achieve the purpose of reducing certain economic losses.

2. Calculation of Pavement Design Temperature

2.1. Pavement Design Temperature

Once the asphalt pavement is put into use, its performance is affected by climatic conditions, especially by the pavement temperature. In the 1990s, the United States finished a strategic highway research program (SHRP). One of the major contributions of SHRP was the SUPERPAVE (superior performance asphalt pavements) specification [41,42]. The SUPERPAVE specifications provide a comprehensive framework for the selection of asphalt binders through its performance grade (PG) system, with a particular focus on the performance of material under specific climatic conditions. The PG system is established based on the performance of material at various temperatures, considering issues of pavement softening at high temperatures and cracking at low temperatures [42,43,44,45]. Furthermore, this system allows for the selection of asphalt based on predicted weather changes, promoting the long-term adaptability of infrastructure [23,29]. Climate change, with its temperature fluctuations and extreme weather events [37], poses new challenges to the performance of pavement materials, making the selection of asphalt grades capable of functioning within an appropriate temperature range increasingly important.
In the PG system [41,42], the maximum pavement design temperature (T20) is defined as the maximum pavement temperature at 20 mm depth, which can be calculated according to Equation (1).
T 20 = 0.955 T s ( m a x ) 0.8
where T20 is the maximum pavement design temperature at 20 mm depth (°C), and Ts(max) is the maximum temperature of the pavement (°C), which can be calculated with Equation (2).
T s ( m a x ) = T a ( m a x ) 0.00618 φ 2 + 0.2289 φ + 24.4
where Ta(max) is the average 7-day highest air temperature (°C), and φ is the latitude in degree for a given location.
The minimum pavement design temperature (Ts) is defined as the minimum pavement temperature on the surface, and the calculation is shown in Equation (3).
T s = 0.859 T a ( m i n ) + 1.7 ( °C )
where Ts is the minimum pavement design temperature (°C), and Ta(min) is daily minimum temperature (°C).
Based on SUPERPAVE, both maximum and minimum pavement design temperatures should be determined based on at least 20 years of weather records.

2.2. Data and Methods

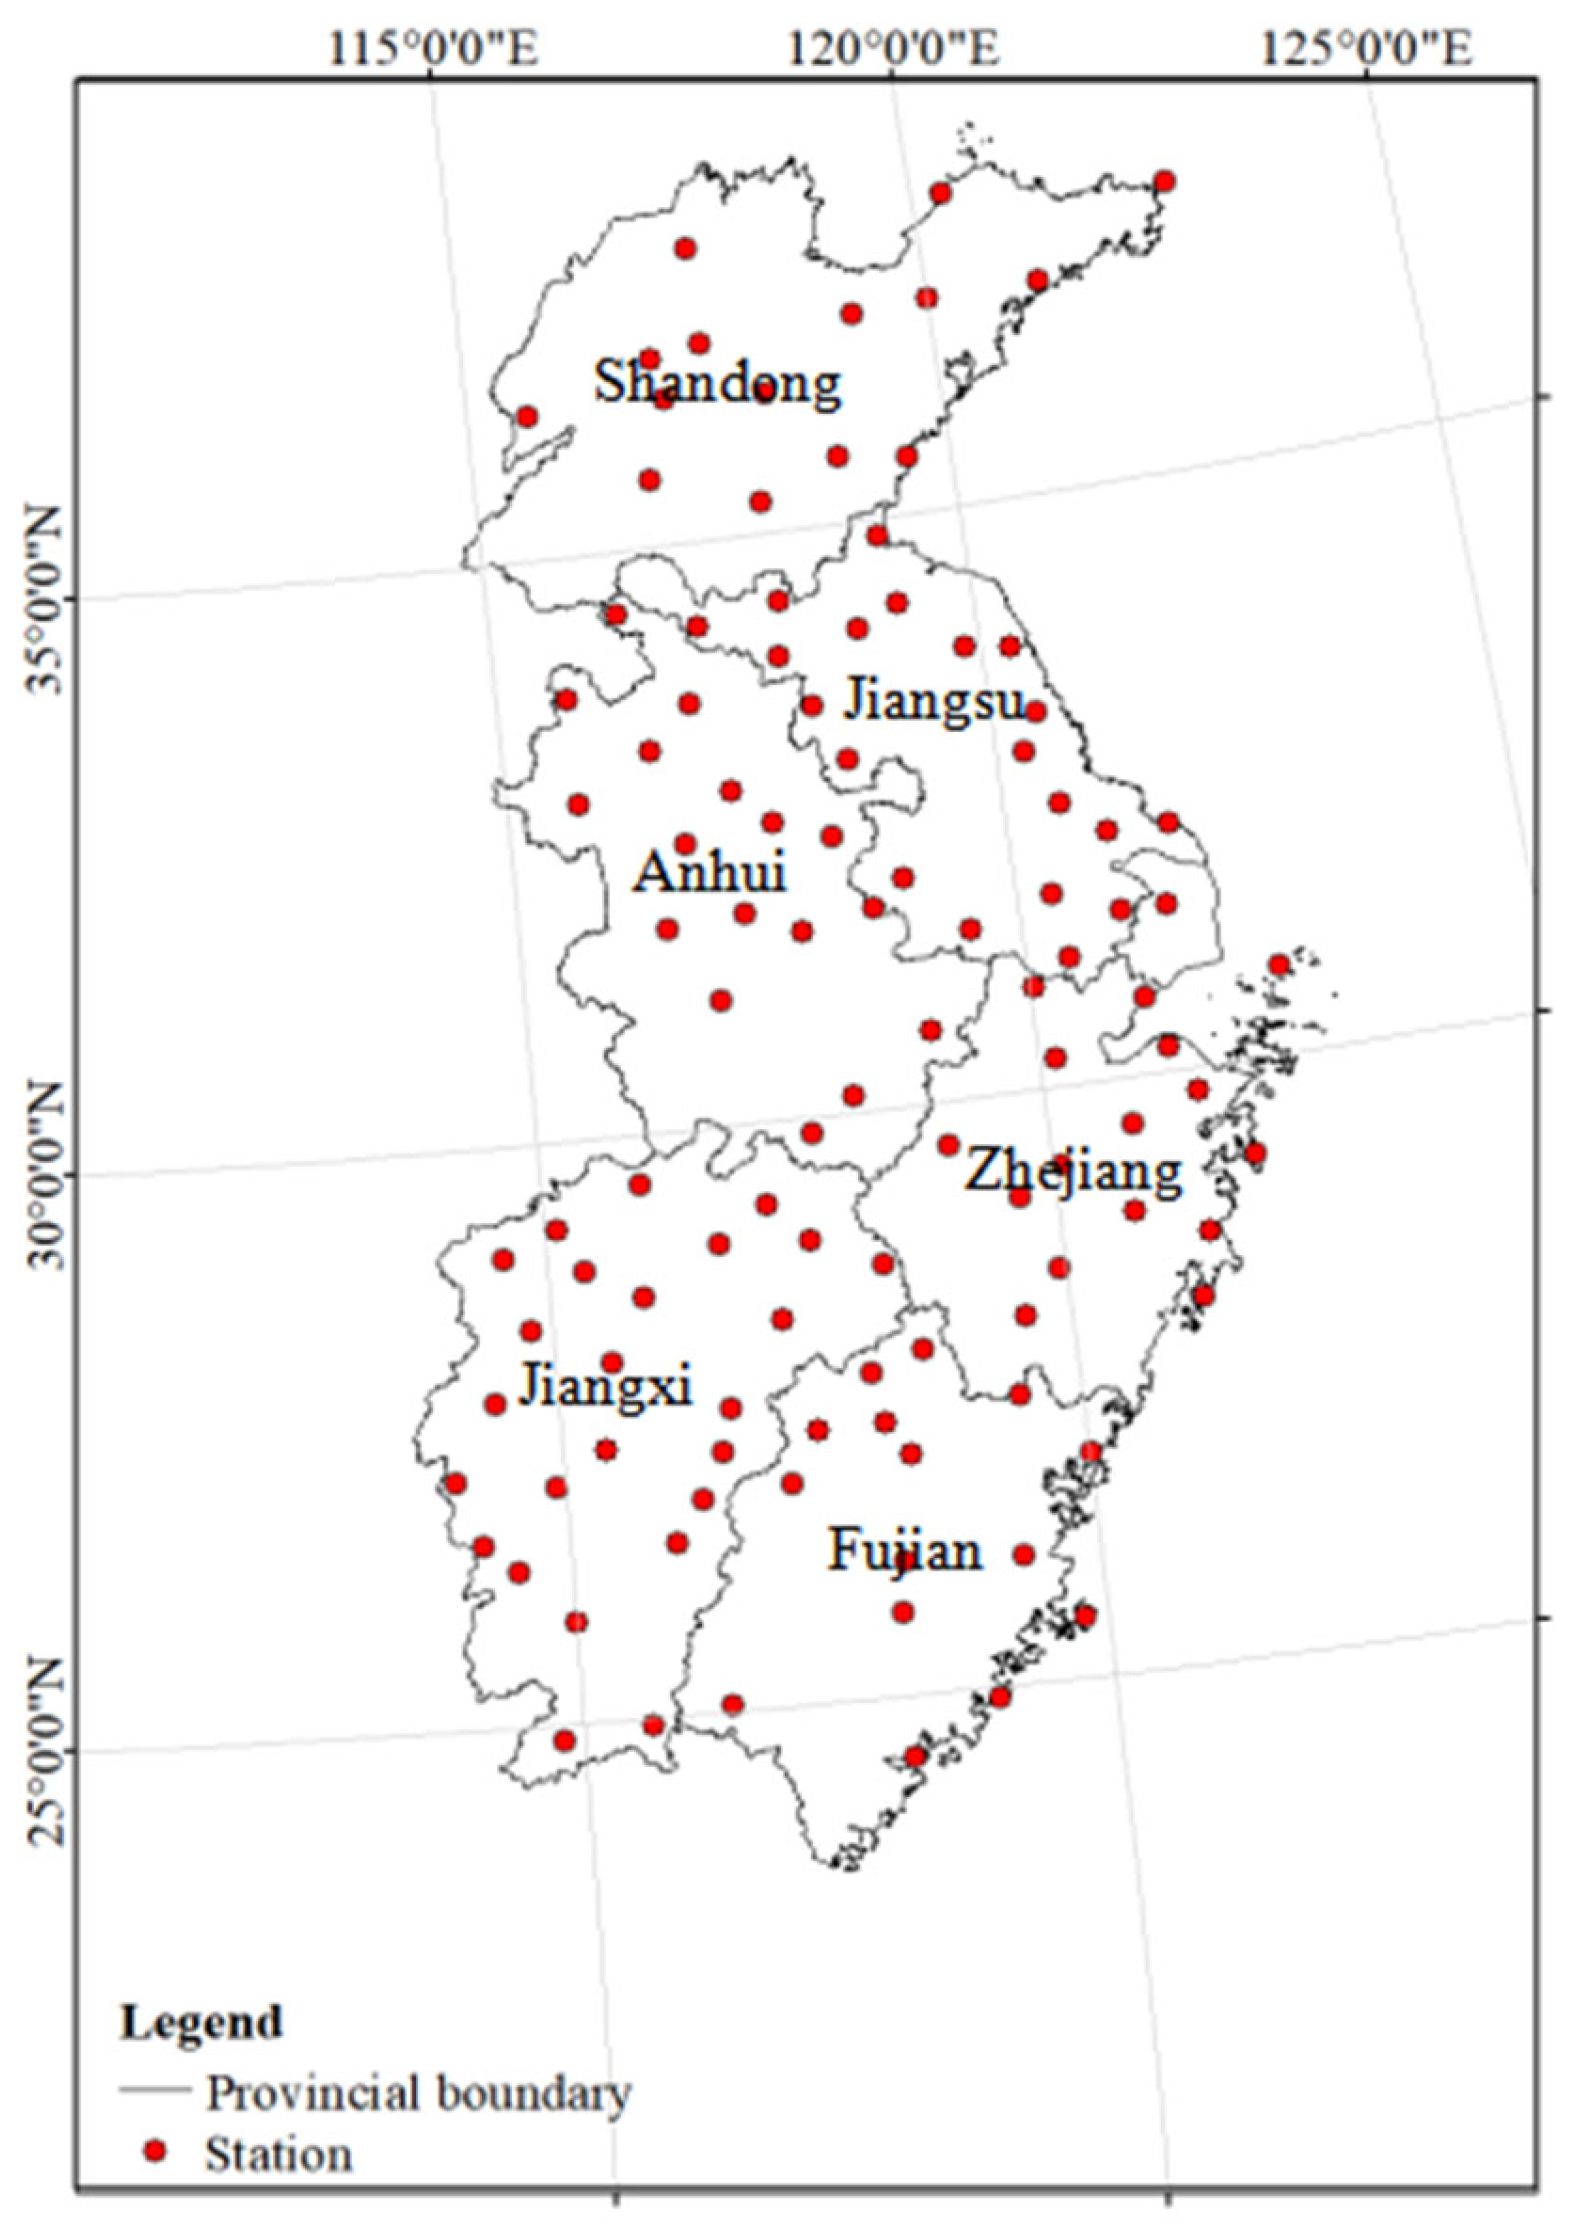
2.2.1. Study Area and Climate Data

As an important part of the transportation system, road transportation plays an increasingly important role in the passenger and freight transportation market and is inseparable from the national economy. Since the 1980s, alongside China’s rapid economic growth, road traffic construction has also experienced unprecedented expansion. By the end of 2022, the mileage of expressways in China had reached 177,300 km [46], with asphalt pavement being the primary form of construction [47,48,49]. However, the demand for roads varies across regions, leading to significant regional disparities in the development of transportation infrastructure. All major population centers in China are connected by expressways, and most new expressways are built in densely populated areas in eastern and southern China [50,51].
Especially in the East China region, there are significant climatic differences between provinces within this area [52], necessitating the targeted selection of asphalt binders to ensure optimal performance under all weather conditions. Moreover, the increase in extreme weather events [52] poses significant challenges to road infrastructure, not only accelerating road wear, aging, and damage [26,53,54] but also potentially leading to more frequent road maintenance and replacements, thereby incurring substantial economic costs [36] and social inconvenience [55]. In this context, the use of appropriate asphalt binders becomes particularly important, as it not only reduces negative environmental impacts but is also key to achieving regional sustainable development goals.
In this study, the part of East China that is also one of the regions with the densest highway networks in the country was selected as the study area. The meteorological observation data of 109 meteorological stations in East China from 1960 to 2019 were employed, which were provided by the National Meteorological Science Data Center. The location of the meteorological stations included is shown in Figure 1. The values of T20 and Ts were calculated year by year.
Given that the number of meteorological stations with complete observational data is not entirely consistent across years and considering the need in this study to use historical values for future predictions, with a focus on examining the changes in the PG of current and future asphalt binders, the completeness of meteorological stations data can affect predictions of future values, leading to biases in the analysis of PG changes. Therefore, stations with discontinuous years of observation were excluded from this study. Finally, 109 stations were included in the analysis of pavement design temperature.

2.2.2. Prediction of Future Pavement Design Temperature Using the ARIMA Model

The T20 and Ts values of each station from 1960 through 2019 were calculated year by year and employed to predict the values of each station in the next 20 years using the ARIMA model. The ARIMA model [39,40] is mainly composed of the autoregressive (AR) model, the moving average (MA) model, and the difference model. It is one of the most commonly used and effective time series prediction models, with a clear working principle, relying entirely on historical data for predictions, without the need for considering other assumptions [53]. It possesses a certain flexibility and can adapt to different time series by adjusting its parameters. The ARIMA model is expressed as ARIMA (p, d, q), where p, d, and q are the parameters of the AR model, the difference model, and the MA model, respectively, representing the order of autoregressive, difference, and moving average.
The general expression of the ARIMA model is shown in Equation (4).
Y t = c + φ 1 Y t 1 + φ 2 Y t 2 + + φ p Y t p + μ t + θ 1 μ t 1 + θ 2 μ t 2 + + θ q μ t q
where Yti is the time series data, c is a constant term, t is a point in time, φi is the parameter of the AR model, θi is the parameter of the MA model, and μti is the error term at time point t.
The construction steps of the ARIMA model include data import; the stationarity test and the determination of difference order; the determination of ARMA model order; the residual test; and model prediction.
  • Import data: The T20 and Ts values of each station in 1960 through 2019 were introduced, the prediction step size was determined to be 20, and the maximum value of p and q was 5;
  • Stationarity test and determination of difference order: The stability of the T20 and Ts value series of each station in the past 60 years was tested using the Augmented Dickey–Fuller test (ADF) method and the Kwiatkowski–Phillips–Schmidt–Shin test (KPSS) method. A number of less than or equal to 5 difference orders (d ≤ 5) means the data set passes the stationarity test. If d > 5, it means that the sequence cannot be smoothed by difference, and the operation is terminated;
  • Determine the order of the ARMA model: After the data pass the stationary test, the order is automatically selected from the stationary signal autocorrelation coefficient diagram (ACF) and the partial autocorrelation coefficient diagram (PACF) according to Akaike Information Criterion (AIC) and the Bayesian Information Criterion (BIC), and p and q are initially determined; that is, the ARIMA model order is initially determined;
  • Residual test: The residual test is carried out based on the preliminarily determined values of p, q, and d. Then, the model is optimized to re-determine the values of p and q by comparing the relative errors between the actual and predicted values of T20 and Ts at each station from 1960 to 2019;
  • Model prediction: After the ARIMA model is determined, the values of T20 and Ts for each station in the next 20 years are predicted, and the 98% confidence interval of the prediction results is expressed at a significance level of 0.02.
The prediction results of the model include three sets of data, the predicted value, and the 98% confidence lower and upper limits. The predicted data were also interpolated using the cokriging interpolation method with consideration of the station elevation to generate 1 km × 1 km raster data covering East China. The raster data are the basic data for the analysis of the PG changes in the asphalt binder.

2.2.3. PG Classification in 2019 and 2039

In this study, the T20 and Ts values at each station from 2000 through 2019 were employed for PG classification in 2019. Those in 2020 through 2039 were employed for PG classification in 2039. The cokriging interpolation method, considering the station elevation, was applied to obtain the spatial distribution of each indicator in 2019 and 2039. Thus, the PG classification results in East China for 2019 and 2039 were obtained.

3. Results

3.1. Effectiveness of the Model

The meteorological observation data of 109 meteorological stations in East China from 1960 through 2019 were used to calculate the T20 and Ts values of each station year by year as experimental data. Two-thirds of the data were employed for model training, and one-third of the data were employed for model testing.
The mean absolute error (MAE) and root mean square error (RMSE) serve as metrics for model performance, reflecting the discrepancies between observed and predicted values, and are typically utilized to evaluate the effectiveness of a model. The MAE and RMSE can be calculated according to Equations (5) and (6). Theoretically, the smaller their values are, the closer the prediction is to the actual value. Utilizing the ARIMA model, the evaluation results are shown in Figure 2: For Ts, with actual values ranging from −27.10 °C to 8.60 °C, the MAE and RMSE did not exceed 3.30 and 3.71, respectively. For T20, where actual values lie between 43.42 °C and 63.68 °C, neither the MAE exceeded 2.29 nor the RMSE surpassed 2.66, with the mean absolute percentage error remaining below 3.87%. The prediction results are accepted for this study.
M A E = 1 n i = 1 n y i y ^ i
R M S E = 1 n i = 1 n ( y i y ^ i ) 2
where n is the number of samples, yi is the true value, and y ^ i is the predicted value.

3.2. A Calculation Example

The prediction of the maximum pavement design temperature at Rizhao Station (33.38 N, 119.53 E, 13.8 m) in Shandong Province is taken as an example. Firstly, the data set is imported. The prediction step size is determined to be 20. Then, the stationarity test is carried out, and the difference order is determined to be d = 1. According to the stationary signal autocorrelation graph (ACF) and the stationary signal partial autocorrelation graph (PACF), the values of p and q are initially determined (as shown in Figure 3). Next, the residual test is performed. The purpose is to further accurately determine the values of p and q so that the data can pass the ARIMA prediction with the highest fitting degree. The test results are shown in Figure 4. Figure 4a,b show that the model successfully captures the characteristics of the input data without leaving significant autocorrelation and partial autocorrelation to further determine the values of p and q. Figure 4c–e show that the residual distribution approximately obeys the normal distribution with zero mean. The results show that the model is appropriate. Figure 5 depicts the prediction results. Finally, ARIMA (4,1,3) was selected as the prediction model. At a significance level of 0.02 and a confidence level of 98%, the prediction was carried out (the 98% confidence interval calculation of the prediction results is shown in Equation (7)).
[ μ z × σ , μ + z × σ ]
where μ is the sample mean, σ is the sample standard deviation, and z is the standard normal distribution table; z = 2.33 for 98% reliability.

3.3. Change in the Maximum Pavement Design Temperature

In 2019, East China included three high temperature grades, PG52, PG58, and PG64, according to the range of T20. Figure 6 depicts the spatial distribution of each high temperature grade in 2019. As shown in Figure 6, the high temperature grade PG52 was mainly distributed in high-altitude areas. The proportion of areas with grade PG52 was only about 1.00%, which was mainly distributed in mountains such as Mount Tai in Shandong Province, Mount Huangshan in Anhui Province, and Jiu Xian Mountain in Fujian Province. The main high temperature grades in East China were PG58 and PG64 in 2019. The areas with grades PG58 and PG64 occupied 37.77% and 61.23% of the area in East China, respectively. The areas with grade PG58 were mainly distributed in the north of East China, and grade PG64 possessed a wider area in the central and southern parts of East China.
Figure 7 shows the spatial distribution of areas with each high temperature grade in East China in 2039. In 2039, East China will be classified into four high temperature grades, PG52, PG58, PG64, and PG70, according to the time series prediction results, but the area ratio of each grade will change. The areas with grades PG52 and PG58 will decrease in proportion, which will account for 0.42% and 15.34%, respectively, in 2039. Grade PG64 will remain the dominant grade. The areas with that grade will expand northward and account for 84.04%. The areas with a new high temperature grade, PG70, will be mainly distributed in Zhejiang Province, which will account for 0.21%.
The percentages of areas with each high temperature grade in East China in 2019 and 2039 were calculated according to the spatial distribution of T20 in 2019 and 2039 and are listed in Table 1. For the maximum pavement design temperature, the area with grade PG64 in the next 20 years will be more extensive compared with 2019. The dominant high temperature grade in East China will remain unchanged in the future.
Figure 8 depicts the changes in high temperature grades from 2019 to 2039 in East China, where 0 means no grade change, and +1 means an upward change in one grade: an upgrade change. As shown in Figure 8, the distribution of high temperature grades will change significantly in the next 20 years. Nearly 23.80% of areas in East China will shift one grade upward, which will be mainly distributed in the northern and southern parts of East China and the junction of Anhui Province and Jiangxi Province. In the future, these regions should be more considered regarding the permanent deformation of asphalt pavement given the increase in the maximum pavement design temperature.

3.4. Change in the Minimum Pavement Design Temperature

In 2019, East China included four low temperature grades, PG-28, PG-22, PG-16, and PG-10, according to the range of Ts. Figure 9 depicts the spatial distribution of each low temperature grade in 2019. As shown in Figure 9, the low temperature grades showed a downward trend with an increase in latitude and altitude. The areas with grade PG-28 were mainly distributed around Mount Tai in the north, which occupied 0.35% of the area. The areas with grade PG-22 were distributed in Shandong Province and Huangshan Mountain in Anhui Province, which occupy 15.88% of the area. The proportion of areas with grade PG-16 was about 33.86%, which was mainly distributed around Jiu Xian Mountain in Fujian Province and the central part of East China. Furthermore, the dominant low temperature grade was PG-10 in East China in 2019, and the areas with grade PG-10 were distributed in the southern part of East China and occupied 49.90% of the area.
Figure 10 shows the spatial distribution of areas with each low temperature grade in East China in 2039. In 2039, East China will maintain the same four low temperature grades, PG-28, PG-22, PG-16, and PG-10, but the percentage of areas with each grade will change compared with 2019. The areas with grade PG-28 will remain at Mount Tai, and the proportion will decrease to 0.28%. The boundary between PG-22 and PG-16 will shift to areas further north, which will result in the proportion of areas with grade PG-22 decreasing to 14.89% and the proportion of areas with grade PG-16 expanding to 34.89% in East China. The dominant low temperature grade in East China will remain PG-10, which accounts for 49.94% of areas in East China.
The percentages of areas with each low temperature grade in East China in 2019 and 2039 were calculated according to the spatial distribution of Ts in 2019 and 2039 and are listed in Table 2. Compared with 2019, the percentage of areas with grade PG-22 will decrease significantly, and the percentage of areas with grade PG-16 will increase. The dominant low temperature grade in East China will remain PG-10 in 2039.
Figure 11 depicts the changes in low temperature grades from 2019 to 2039 in East China, where 0 and +1 maintain the same meaning as in Figure 8, and −1 means a downward change of one grade. As shown in Figure 11, most areas in East China will maintain the same low temperature grades in the future as in 2019. However, nearly 6.30% of areas of East China will experience changes in their low temperature grades. The areas shifting one grade upward account for 3.75%, which are mainly distributed around Mount Tai; Mount Huangshan; Mount Jiu Xian; the coastal areas of Shandong Province; and the junction of Anhui Province, Jiangsu Province, and Zhejiang Province. Furthermore, some areas in East China will experience a downward change of one grade, accounting for 2.55%, which are mainly distributed in the central and northern parts of East China. In the future, these regions should be considered more often regarding the low-temperature cracking of asphalt pavement due to decreases in the minimum pavement design temperature.

3.5. Alteration of Asphalt Binder Performance Grades in the Next 20 Years

Table 3 lists the percentages of areas with each asphalt binder performance grade in East China. The percentages are calculated in accordance with the spatial distributions of the high temperature and low temperature grades shown in Figure 6, Figure 7, Figure 9, and Figure 10. In the future, the dominant asphalt binder grade will remain PG64-10 in East China. In addition, the proportion of grades PG64-22 and PG64-16 will significantly increase, and a new asphalt binder grade, PG70-10, will emerge. The areas with grades PG58-22, PG58-16, and PG58-10 will shrink in 2039 compared with 2019. The shift to higher grades of asphalt binder in the future means that distress due to high temperatures will worsen for the existing asphalt pavement, while distress due to low temperatures will be alleviated.
This viewpoint has also been corroborated by other researchers. Miao et al. [56] evaluated the impact of climate change on the performance of asphalt pavements in China, noting that, with temperature rises of 1.5 °C and 2 °C, the permanent deformation of asphalt pavements increased by 18.63% and 36.71% respectively, though issues of low-temperature cracking were mitigated. A study from Canada predicts that, over the next 50 years, low-temperature cracks will decrease, and the freezing period will shorten, but rutting issues under high temperatures may become more severe [30]. Similarly, Liu et al. [26] highlight that, while low-temperature cracking may intensify in certain regions of China in the future, the primary concerns remain rutting and fatigue cracking caused by high temperatures. Choosing harder bitumen can effectively alleviate rutting issues but might also increase stress caused by low-temperature shrinkage, leading to cracking [25]. Therefore, when selecting the type of asphalt for actual engineering applications, it is necessary to consider various factors such as regional climate, traffic load, and expected road lifespan.

4. Conclusions

In this research, the potential impact of climate change on asphalt binder selection in East China was investigated according to the SUPERPAVE PG system. The meteorological data from 109 meteorological stations in East China from 1960 to 2019, provided by the National Meteorological Science Data Center, were employed to calculate the maximum and minimum design temperatures of asphalt pavement in 2019 and to predict the parameters in 2039 using the ARIMA prediction model. Some findings can be determined as follows according to the comparison between the results in 2019 and 2039.
  • The change in the maximum pavement design temperature from 2019 to 2039 is different between regions. There were three and four high temperature grades in East China in 2019 and 2039; those were PG52, PG58, and PG64 and PG52, PG58, PG64, and PG70 respectively. In 2039, the dominant high temperature grade in East China will remain PG64, which accounts for 84.04% of areas in East China. By 2039, the areas with high temperature grades shifting one grade upward will account for 23.80%.
  • In both 2019 and 2039, there are four low temperature grades in East China, PG-28, PG-22, PG-16, and PG-10. Compared with 2019, the boundary between grade PG-22 and grade PG-16 will shift to areas further north in 2039. The proportion of areas with grade PG-16 will increase from 33.86% to 34.89%. In 2039, the dominant low temperature grade in East China will remain PG-10, which accounts for 49.94% of areas in East China. The areas with low temperature grades shifting one grade upward will account for 3.75% by 2039.
  • We found that the suitable grades of asphalt binders in some regions in East China will change in the next 20 years. Although the dominant asphalt binder grade in East China will remain PG64-10 by 2039, its proportion will significantly increase. Similarly, the proportion of areas with grades PG64-22 and PG64-16 will significantly increase too. The shift to higher grades of asphalt binders in the future means that distress due to high temperatures will worsen for the existing asphalt pavement, while distress due to low temperatures will be alleviated.

Author Contributions

Conceptualization, J.S. and Y.M.; methodology, J.S. and Y.M.; validation, J.S., Y.M. and L.W.; formal analysis, J.S., Y.M. and L.W.; data curation, J.S., Y.M. and L.W.; writing—original draft preparation, J.S.; writing—review and editing, J.S., Y.M. and L.W.; visualization, J.S. and Y.M.; project administration, Y.M.; funding acquisition, Y.M. All authors have read and agreed to the published version of the manuscript.

Funding

The research reported in this paper was funded by the National Natural Science Foundation of China (No. 51978048).

Institutional Review Board Statement

Not applicable.

Informed Consent Statement

Not applicable.

Data Availability Statement

Not applicable.

Acknowledgments

The authors thank the National Meteorological Science Data Center for providing detailed meteorological data for the study in this paper.

Conflicts of Interest

The authors declare no conflict of interest.

References

  1. Blunden, J.; Arndt, D.; Johnson, G.C.; Lyman, J.M. State of the Climate in 2019. Bullet. Am. Meteorol. Soc. 2020, 101, 429. [Google Scholar] [CrossRef]
  2. Kappelle, M. WMO Statement on the State of the Global Climate in 2019; World Meteorological Organization: Geneva, Switzerland, 2020. [Google Scholar]
  3. Collins, M.; Knutti, R.; Arblaster, J.M.; Dufresne, J.-L.; Fichefet, T.; Friedlingstein, P.; Gao, X.; Gutowski, W.J.; Johns, T.; Krinner, G.; et al. Long-Term Climate Change Projections, Commitments and Irreversibility; Cambridge University Press: New York, NY, USA, 2013; p. 1065. [Google Scholar]
  4. Deng, Y.; Luo, H.; Wang, H. Backcalculation of damage density of in-service asphalt pavements using artificial intelligence-based finite element model updating. Fatigue Fract. Eng. Mater. Struct. 2022, 45, 671–686. [Google Scholar] [CrossRef]
  5. Zhang, Y.; Deng, Y.; Shi, X. Model development and prediction of anti-icing longevity of asphalt pavement with salt-storage additive. J. Infrastruct. Preservat. Resil. 2022, 1, 1–28. [Google Scholar] [CrossRef]
  6. Meyer, M.; Flood, M.; Keller, J.; Lennon, J.; McVoy, G.; Dorney, C.; Leonard, K.; Hyman, R.; Smith, J. Climate Change, Extreme Weather Events and the Highway System: A Practitioner’s Guide; Transportation Research Board, National Academy of Sciences: Washington, DC, USA, 2014. [Google Scholar]
  7. Rattanachot, W.; Wang, Y.; Chong, D.; Suwansawas, S. Adaptation strategies of transport infrastructures to global climate change. Transp. Policy 2015, 41, 159–166. [Google Scholar] [CrossRef]
  8. Chinowsky, P.S.; Price, J.C.; Neumann, J.E. Assessment of climate change adaptation costs for the U.S. road network. Global Environ. Change Hum. Policy Dimens. 2013, 23, 764–773. [Google Scholar] [CrossRef]
  9. Mahpour, A.; El-Diraby, T. Incorporating climate change in pavement maintenance policies: Application to temperature rise in the Isfahan County, Iran. Sustain. Cities Soc. 2021, 71, 102960. [Google Scholar] [CrossRef]
  10. Kumlai, S.; Jitsangiam, P.; Pichayapan, P. The implications of increasing temperature due to climate change for asphalt concrete performance and pavement design. KSCE J. Civ. Eng. 2017, 21, 1222–1234. [Google Scholar] [CrossRef]
  11. Meng, Y.; Liu, L.; Huang, W.; Li, M. Effect of increasing preheating temperature on the activation and aging of asphalt binder in reclaimed asphalt pavement (RAP). J. Clean. Prod. 2023, 402, 136780. [Google Scholar] [CrossRef]
  12. Xu, H.; Zhan, H.; Wang, M.; Tan, Y. Microstructural characteristics evolution of asphalt mastics under cyclic environmental temperature variations. Construct. Build. Mater. 2023, 400, 132795. [Google Scholar] [CrossRef]
  13. Fu, Q.; Chen, X.; Qiu, X. Spatial distribution characterization of the Temperature-induced gradient viscoelasticity inside asphalt pavement. Construct. Build. Mater. 2022, 346, 128454. [Google Scholar] [CrossRef]
  14. Zhang, C.; Tan, Y.; Gao, Y.; Fu, Y.; Li, J.; Li, S.; Zhou, X. Resilience assessment of asphalt pavement rutting under climate change. Transp. Res. Part D Transp. Environ. 2022, 109, 103395. [Google Scholar] [CrossRef]
  15. Al-Atroush, M.E.; Marouf, A.; Aloufi, M.; Marouf, M.; Sebaey, T.A.; Ibrahim, Y.E. Structural performance assessment of geothermal asphalt pavements: A comparative experimental study. Sustainability 2022, 14, 12855. [Google Scholar] [CrossRef]
  16. Knott, J.F.; Sias, J.E.; Dave, E.V.; Jacobs, J.M. Seasonal and long-term changes to pavement life caused by rising temperatures from climate change. Transp. Res. Rec. 2019, 2673, 267–278. [Google Scholar] [CrossRef]
  17. Qiao, Y.; Dawson, A.R.; Parry, T.; Flintsch, G.W. Evaluating the effects of climate change on road maintenance intervention strategies and life-cycle costs. Transp. Res. Part D Transp. Environ. 2015, 41, 492–503. [Google Scholar] [CrossRef]
  18. Stoner, A.M.K.; Daniel, J.S.; Jacobs, J.M.; Hayhoe, K.; Scott-Fleming, I. Quantifying the impact of climate change on flexible pavement performance and lifetime in the United States. Transp. Res. Rec. 2019, 2673, 110–122. [Google Scholar] [CrossRef]
  19. Budzińsk, B.; Ratajczak, M.; Majer, S.; Wilmański, A. Influence of bitumen grade and air voids on low-temperature cracking of asphalt. Case Stud. Construct. Mater. 2023, 19, e02255. [Google Scholar] [CrossRef]
  20. Wang, H.; Zhang, X.; Jiang, S. A Laboratory and field universal estimation method for tire–pavement interaction noise (TPIN) based on 3D image technology. Sustainability 2022, 14, 12066. [Google Scholar] [CrossRef]
  21. Li, H.; Jia, M.; Zhang, X.; Wang, Z.; Liu, Y.; Yang, J.; Yang, B.; Sun, Y.; Wang, H.; Ma, H. Laboratory investigation on fumes generated by different modified asphalt binders. Transp. Res. Part D Transp. Environ. 2023, 121, 103828. [Google Scholar] [CrossRef]
  22. Delgadillo, R.; Arteaga, L.; Wahr, C.; Alcafuz, R. The influence of climate change in Superpave binder selection for Chile. Road Mater. Pavem. Des. 2020, 21, 607–622. [Google Scholar] [CrossRef]
  23. Viola, F.; Celauro, C. Effect of climate change on asphalt binder selection for road construction in Italy. Transp. Res. Part D Transp. Environ. 2015, 37, 40–47. [Google Scholar] [CrossRef]
  24. Underwood, B.S.; Guido, Z.; Gudipudi, P.; Feinberg, Y. Increased costs to US pavement infrastructure from future temperature rise. Nat. Clim. Change 2017, 7, 704–707. [Google Scholar] [CrossRef]
  25. Ma, J.; Hesp, S.A.M.; Chan, S.; Chan, S.; Li, J.Z.; Lee, S. Lessons learned from 60 years of pavement trials in continental climate regions of Canada. Chem. Eng. J. 2022, 444, 136389. [Google Scholar] [CrossRef]
  26. Liu, T.; Yang, S.; Jiang, X.; Liao, B.; Castillo-Camarena, E.S. Adaptation measures for asphalt pavements to climate change in China. J. Clean. Prod. 2023, 415, 137861. [Google Scholar] [CrossRef]
  27. Gudipudi, P.P.; Underwood, B.S.; Zalghout, A. Impact of climate change on pavement structural performance in the United States. Transp. Res. Part D Transp. Environ. 2017, 57, 172–184. [Google Scholar] [CrossRef]
  28. Swarna, S.T.; Hossain, K.; Pandya, H.; Mehta, Y. Assessing climate change impact on asphalt binder grade selection and its implications. Transp. Res. Rec. J. Transp. Res. Board 2021, 2675, 1–14. [Google Scholar] [CrossRef]
  29. Swarna, S.T.; Hossain, K.; Mehta, Y.A.; Bernier, A. Climate change adaptation strategies for Canadian asphalt pavements; Part 1: Adaptation strategies. J. Clean. Prod. 2022, 363, 132313. [Google Scholar] [CrossRef]
  30. Mills, B.N.; Tighe, S.L.; Andrey, J.; Smith, J.; Huen, K. Climate change implications for flexible pavement design and performance in Southern Canada. J. Transp. Eng. 2009, 135, 773–782. [Google Scholar] [CrossRef]
  31. Swarna, S.T.; Hossain, K.; Bernier, A. Climate change adaptation strategies for Canadian asphalt pavements; Part 2: Life cycle assessment and life cycle cost analysis. J. Clean. Prod. 2022, 370, 133355. [Google Scholar] [CrossRef]
  32. Qiao, Y.; Guo, Y.; Stoner, A.M.K.; Santos, J. Impacts of future climate change on flexible road pavement economics: A life cycle costs analysis of 24 case studies across the United States. Sustain. Cities Soc. 2022, 80, 103773. [Google Scholar] [CrossRef]
  33. Al-Atroush, M.E. Structural behavior of the geothermo-electrical asphalt pavement: A critical review concerning climate change. Heliyon 2022, 8, e12107. [Google Scholar] [CrossRef]
  34. Daniel, J.S.; Jacobs, J.M.; Douglas, E.; Mallick, R.B.; Hayhoe, K. Impact of climate change on pavement performance: Preliminary lessons learned through the Infrastructure and Climate Network (ICNet). In Proceedings of the International Symposium of Climatic Effects on Pavement and Geotechnical Infrastructure, Fairbanks, Alaska, 8 April 2014; pp. 1–9. [Google Scholar]
  35. Schweikert, A.; Chinowsky, P.; Kwiatkowski, K.Y.; Johnson, A.; Shilling, E.; Strzepek, K.; Strzepek, N. Road infrastructure and climate change: Impacts and adaptations for South Africa. J. Infrastruct. Syst. 2014, 21, 04014046. [Google Scholar] [CrossRef]
  36. Mallick, R.B.; Radzicki, M.; Daniel, J.S.; Jacobs, J.M. Use of system dynamics to understand the long-term impact of climate change on pavement performance and maintenance cost. Transp. Res. Rec. J. Transp. Res. Board 2014, 2455, 1–9. [Google Scholar] [CrossRef]
  37. Trenberth, K.E. Changes in precipitation with climate change. Clim. Res. 2010, 47, 123–138. [Google Scholar] [CrossRef]
  38. Miao, Y. Research on Impact of Climate on Highway and Climatic Regionalization for Highway. Ph.D. Thesis, Chang’An University, Xi’an, China, 2006. [Google Scholar]
  39. Box, G.E.P.; Jenkins, G.M.; Reinsel, G.C. Time Series Analysis Forecasting and Control, 3rd ed.; Prentice Hall: Englewood Cliffs, NJ, USA, 1994. [Google Scholar]
  40. Nair, M.; Dey, S.; Bherwani, H.; Ghosh, A.K. Long-term changes in aerosol loading over the ‘BIHAR’ State of India using nineteen years (2001–2019) of high-resolution satellite data (1 × 1 km2). Atmosph. Pollut. Res. 2022, 13, 101259. [Google Scholar] [CrossRef]
  41. Huber, G.A. Weather Database for the Superpave Mix Design System; National Research Council: Washington, DC, USA, 1994.
  42. Kennedy, T.W.; Huber, G.A. Superior Performing Asphalt Pavements (Superpave)’. The Product of the SHRP Asphalt Research Program; National Research Council: Washington, DC, USA, 1994.
  43. Basit, A.; Shafiee, M.; Bashir, R.; Perras, M.A. Climate change and asphalt binder selection across ontario: A quantitative analysis towards the end of the century. Construct. Build. Mater. 2022, 361, 129682. [Google Scholar] [CrossRef]
  44. Zhao, K.; Ma, X.; Zhang, H.; Dong, Z. Performance zoning method of asphalt pavement in cold regions based on climate indexes: A case study of Inner Mongolia, China. Construct. Build. Mater. 2022, 361, 129650. [Google Scholar] [CrossRef]
  45. Zhang, H.; Gong, M.; Huang, Y.; Miljković, M. Study of the high and low-temperature behavior of asphalt based on a performance grading system in Northeast China. Construct. Build. Mater. 2020, 254, 119046. [Google Scholar] [CrossRef]
  46. Ministry of Transport of the People’s Republic of China. Statistical Bulletin on the Development of Transportation Industry in 2022; Ministry of Transport of the People’s Republic of China: Beijing, China, 2023.
  47. Wang, L.; Wei, J.; Wu, W.; Zhang, X.; Xu, X.; Yan, X. Technical development and long-term performance observations of long-life asphalt pavement: A case study of Shandong Province. J. Road Eng. 2022, 2, 369–389. [Google Scholar] [CrossRef]
  48. Huang, Y.; Qiao, Z.; Zhang, H. Evaluation of an economy-technology-green development system for asphalt pavement construction in China based on synergetics. J. Clean. Prod. 2021, 289, 125132. [Google Scholar] [CrossRef]
  49. Yang, M.; Zhang, X.; Zhou, X.; Liu, X. Research and Exploration of phase change materials on solar pavement and asphalt pavement: A review. J. Energy Storage 2021, 35, 102246. [Google Scholar] [CrossRef]
  50. Peter, H.E.; Gabriel, L.; Nicole, L. China’s dazzling transport-infrastructure growth measurement and effects. J. Int. Econ. 2023, 142, 103734. [Google Scholar]
  51. Zhu, F.; Wu, X.; Peng, W. Road transportation and economic growth in China: Granger causality analysis based on provincial panel data. Transp. Lett. 2022, 14, 710–720. [Google Scholar] [CrossRef]
  52. Chen, Y.; Wang, A. Role of land–atmosphere coupling in persistent extreme climate events in eastern China in summer 2022. Atmosph. Ocean. Sci. Lett. 2023, 100419. [Google Scholar] [CrossRef]
  53. Pregnolato, M.; Ford, A.; Wilkinson, S.M.; Dawson, R.J. The impact of flooding on road transport: A depth-disruption function. Transp. Res. Part D Transp. Environ. 2017, 55, 67–81. [Google Scholar] [CrossRef]
  54. Sarroukh, M.; Lahlou, K.; Farah, M. Effect of the bitumen type on the temperature resistance of hot mix asphalt. Mater. Today Proceed. 2021, 45, 7428–7431. [Google Scholar] [CrossRef]
  55. Huang, Y.; Bird, R.; Bell, M. A comparative study of the emissions by road maintenance works and the disrupted traffic using life cycle assessment and micro-simulation. Transp. Res. Part D Transp. Environ. 2009, 14, 197–204. [Google Scholar] [CrossRef]
  56. Miao, Y.; Sheng, J.; Ye, J. An Assessment of the impact of temperature rise due to climate change on asphalt pavement in China. Sustainability 2022, 14, 9044. [Google Scholar] [CrossRef]
Figure 1. Distribution of meteorological stations.
Sustainability 15 15667 g001
Figure 2. Model evaluation: (a) histogram of MAE of Ts; (b) histogram of RMSE of Ts; (c) histogram of MAE of T20; (d) histogram of RMSE of T20.
Sustainability 15 15667 g002aSustainability 15 15667 g002b
Figure 3. The order of autoregressive and moving average: (a) autocorrelation of stationary signal; (b) partial autocorrelation of stationary signal.
Sustainability 15 15667 g003
Figure 4. Residual test: (a) optimized autocorrelation of stationary signal; (b) optimized partial autocorrelation of stationary signal; (c) standardized residuals; (d) standardized residuals; (e) standard normal distribution QQ diagram.
Sustainability 15 15667 g004aSustainability 15 15667 g004b
Figure 5. Prediction of the maximum pavement design temperature at Rizhao Station.
Sustainability 15 15667 g005
Figure 6. Spatial distribution of high temperature grades in 2019.
Sustainability 15 15667 g006
Figure 7. Spatial distribution of high temperature grades in 2039.
Sustainability 15 15667 g007
Figure 8. Changes in high temperature grades from 2019 to 2039.
Sustainability 15 15667 g008
Figure 9. Spatial distribution of low temperature grades in 2019.
Sustainability 15 15667 g009
Figure 10. Spatial distribution of low temperature grades in 2039.
Sustainability 15 15667 g010
Figure 11. Changes in low temperature grades from 2019 to 2039.
Sustainability 15 15667 g011
Table 1. The percentages of areas with each high temperature grade in East China.
T20PG52PG58PG64PG70
20191.0037.7761.23
20390.4215.3484.040.21
Table 2. The percentages of areas with each low temperature grade in East China.
TsPG-28PG-22PG-16PG-10
20190.3515.8833.8649.90
20390.2814.8934.8949.94
Table 3. The percentages of areas with each asphalt binder performance grade in East China.
YearPG52PG58PG64PG70
PG-28PG-22PG-16PG-10PG-28PG-22PG-16PG-10PG-22PG-16PG-10PG-10
20190.350.360.260.0215.1214.717.940.4118.8941.94
20390.260.090.07<0.010.026.346.282.708.4628.5447.040.21
Disclaimer/Publisher’s Note: The statements, opinions and data contained in all publications are solely those of the individual author(s) and contributor(s) and not of MDPI and/or the editor(s). MDPI and/or the editor(s) disclaim responsibility for any injury to people or property resulting from any ideas, methods, instructions or products referred to in the content.

