Article

The Coupling Coordination and Interaction Mechanism of Land Ecological Security and High-Quality Economic Development in the Beijing–Tianjin–Hebei Region

1
Chinese Academy of Natural Resources Economics, Beijing 101149, China
2
College of Earth Sciences, Jilin University, Changchun 130061, China
3
School of Emergency Management, Institute of Disaster Prevention, Sanhe 065201, China
4
School of Public Administration and Policy, Renmin University of China, Beijing 100101, China
*
Authors to whom correspondence should be addressed.
Sustainability 2023, 15(21), 15670; https://doi.org/10.3390/su152115670
Submission received: 31 August 2023 / Revised: 7 October 2023 / Accepted: 9 October 2023 / Published: 6 November 2023
(This article belongs to the Section Sustainable Urban and Rural Development)

Abstract

:
Land ecological security (LES) and high-quality economic development (HED) are mutually influential. China has three world-class urban agglomerations; the Beijing–Tianjin–Hebei (BTH) region is one of them. It is an important platform for participating in international competition and cooperation. To promote regional sustainable development, it is critical to study the coupling coordination and interaction mechanism of LES–HED subsystems over time and space in the BTH region. This study involved the construction of an aggregated index system to obtain a comprehensive understanding of the subsystems, and then investigated the coupling coordination degree (CCD) of the LES–HED subsystems from 2007 to 2018 using a CCD model. Additionally, a panel vector autoregressive (PVAR) model was applied to analyze the interactive mechanism of the LES–HED subsystems. Finally, a model of the degree of relative development was used to classify the types of regional development. The results showed that the CCD of the LES–HED subsystems in the BTH region had significant spatial and temporal differences. The spatial distribution could be characterized as low in the central area and high in the peripheral area, and the evolutionary law of CCD in the system was from lower to higher levels over time. In addition, improvements in LES promoted HED, but the impact of HED on LES was limited. The development patterns within the cities of the study area included three development types, including an slightly lagging type of LES, a slightly lagging type of HED, and a significantly lagging type of HED. Given the spatial variability of the coupled and coordinated development of LES–HED subsystems, it is necessary to implement different development strategies. This study can inform decisions promoting the coordinated development of LES–HED subsystems for sustainable regional development.

1. Introduction

In 2015, the United Nations set out 17 Sustainable Development Goals (SDGs), representing a global compass for humanity to address ecological, economic, and social challenges [1]. China’s rapid economic development has also brought ecological security challenges, such as land degradation, soil erosion, environmental pollution, ecological deterioration, etc. [2,3]. Land ecological security (LES) is the basis of regional ecological security. However, because of the continued overuse of land resources in many areas, land ecosystems have become dysfunctional [4,5,6,7,8]. A conflict between LES and economic development has always existed, restricting sustainable regional development. With an increase in the frequency and intensity of climate and weather extremes, the interactions among climate change, ecosystems, and human societies are mainly negative, so humans need to take effective measures to secure a livable and sustainable future for all [9]. Therefore, there is a need to find a sustainable approach that harmonizes the LES–economy nexus.
Rigorous research on the LES–economy nexus is important for enabling sustainable regional development, and the LES–economy nexus has become an attractive research field. Two methods are frequently used in studies on the coupling relationship between LES and economic development: the environmental Kuznets curve (EKC) and the CCD model. The EKC was first proposed to understand the inverse-U-shaped correlation between environmental quality and economic growth [10]. The EKC has been used in several empirical studies to represent the nonlinear relationship that characterizes the relationship between LES and economic development [11,12,13]. The EKC assumes independence between the economic and environmental systems, ignoring the interactions between the two systems [14]. This gap is bridged by the study of coupling, which refers to the interaction of two or more systems through various pathways, and which has recently been used to inform the measurement of nonlinear interactions between the environment and urbanization [15]. Therefore, the CCD model has recently been applied in most studies to measure the nonlinear interaction between the subsystems of LES and economic development [16,17,18,19,20,21,22]. A coupled coordination analysis can fully determine the CCD of LES and economic development, which is important for achieving coordinated development. In the context of high-quality development and the construction of an ecological civilization, the coupling coordination relationships and the interactive mechanisms of LES–HED subsystems require significant emphasis, though the present understanding is still far from adequate. Current research on the coordinated development of both the LES and economic development subsystems has provided inspiration for this study but still has the following shortcomings. Firstly, the 19th National Congress of the Communist Party of China reported that the Chinese economy has transformed from high-speed growth to high-quality development. HED is an essential requirement for adapting to changes in the main conflicts in Chinese society and to maintain sustainable and healthy economic development. Current studies have mostly focused on the coupling coordination of LES and economic growth, rather than the LES–HED subsystems. The indicators used to evaluate economic development frequently ignore the implications and intrinsic needs of HED in favor of focusing on the total growth rate and the structure of the economy. Second, there has been a lack of consideration of the interactive mechanisms of LES–HED subsystems in existing studies, such as the dynamic and causal relationships.
The panel vector autoregressive (PVAR) model was developed by Love and Zicchin [23]. The PVAR model allows investigations of the dynamic response of variables to shocks. It has been extensively used in research on the interaction mechanisms among macroeconomic and financial systems [24], urbanization, and the maritime economy [25] in recent years. However, few studies have explored the interaction mechanisms of the LES–HED subsystems using the PVAR model. This is an urgent current problem requiring a solution, and addressing this represents an innovative feature of the present study.
Therefore, the purpose of this research was to remedy this deficiency and to seek a more accurate understanding of the LES–HED nexus through applying the CCD and PVAR models. This study can contribute to the coherent development of regional LES–HED subsystems. To quantitatively study the coupling coordination and interaction mechanism of LES–HED subsystems over time and space, the Beijing–Tianjin–Hebei (BTH) region was chosen as the study area, using an aggregated indicator system constructed for the period 2007–2018. The integrated levels of LES–HED subsystems were determined using an entropy-weighted method and a technique for order preference, similar to the ideal solution (TOPSIS) model. The CCD model was then applied to investigate the status of coupling coordination in LES–HED subsystems. Additionally, the PVAR model was utilized to investigate the interactive mechanism of the two subsystems. Finally, a model of the degree of relative development was used to classify the types of regional development in order to provide a basis for selecting the paths of sustainable development. In conclusion, we hope that this study will provide theoretical support for sustainable development and a model of ecological economic transformation in China and globally.
The present study was organized as follows. Section 2 describes the materials and methods. Section 3 presents the results and analysis, which mainly include the coupling coordination relationship, the interaction mechanism, and the types of regional development. Section 4 provides the discussion. Section 5 presents the research conclusions and policy recommendations.

2. Materials and Methods

2.1. Study Area

China has three world-class urban agglomerations, and the BTH region is one of them. It is an important platform for participating in international competition and cooperation. The BTH region includes Beijing, Tianjin, and Hebei Province, and includes 13 cities (Figure 1). As of the end of 2018, its overall population made up approximately 8.1% of China, its regional GDP made up about 9.3% of China, and its water resources made up about 0.79% of China [26]. With the rapid socioeconomic development and urbanization, the unbalanced economic structure, the large differences in social security, the lack of water, and land degradation have severely constrained LES and HED in the BTH region. Promoting the coordinated development of HED and LES in the BTH region is the basis for promoting regional synergistic development and building world-class city clusters.

2.2. Data Sources

The data are from the statistical yearbooks, including the China Statistical Yearbook (2008–2019), the China Urban Statistical Yearbook (2008–2019), the Hebei Economic Yearbook (2008–2019), and the Hebei Rural Statistical Yearbook (2008–2019). The data on changes in land use and cover (at a resolution of 1000 m) were obtained from the Resource and Environment Data Cloud Platform of the Data Center for Resources and Environmental Sciences, Chinese Academy of Sciences (https://www.resdc.cn/DOI/DOI.aspx?DOIID=54, accessed on 6 December 2021). The administrative boundaries were obtained from Standard Map Service Platform, Ministry of Natural Resources of the People’s Republic of China (http://bzdt.ch.mnr.gov.cn/, accessed on 6 December 2021).

2.3. Methods

2.3.1. Construction of the Evaluation Index System

The close relationship of LES–HED subsystems is mainly reflected in two aspects [27,28,29]. First, the impacts of HED on LES are mainly a positive dynamic effect and a negative coercive effect, which are realized through controlling the source, providing an economic basis, and institutional supply. Second, the impact of LES on HED is both positive and negative, which is realized by providing food security, high-quality production factors, and value-added carriers of ecological wealth (Figure 2). The coupling relationship of LES–HED subsystems contains two indispensable parts, including expansion of the amount of development and improvements in the quality of coordination. The government, enterprises, and all sectors of society jointly promote the optimal allocation of the two systems and their internal elements to integrate them into an open and dynamic integrated system. The integrated system develops continuously from low levels to high levels, which is the premise and foundation of regional sustainable development.
This study established a mechanism of assessment to assess the LES–HED subsystems. As described in Table 1, in this research, an LES assessment index was constructed, based on the PSR model. Major issues such as deconstruction of the population, industrial transfers, construction of transportation infrastructure, and ecological protection need to be pioneered in the process of collaborative regional development. Therefore, four component layers (population, industry, traffic, and the environment) formed the foundation of the layer of the pressure and reaction criteria. The status included two fundamental levels of the land’s structure and function, and depicted the real condition of the land ecosystem under pressure [26].
This study established a system for an evaluation index of HED in the BTH region including five parts (Table 2), namely, innovative development, coordinated development, green development, open development, and shared development [30].

2.3.2. Entropy-Weighted TOPSIS Model

(1)
Entropy-Weighted Method
The entropy-weighting method is an objective weighting method that determines the weight based on the high or low entropy of the indicator’s information [26,30]. The data are first standardized using the range technique, and the weight is then determined using the entropy-weighting method. Equations (1)–(3) display the formulas. Matrix F i j is the normalization matrix of the initial data, E j is the information entropy, and W j is the entropy weight.
F i j = Y i j / i = 1 m Y i j
E j = ln m 1 i = 1 m F i j ln F i j , 0 E j 1
W j = ( 1 E j ) / j = 1 n 1 E j
(2)
TOPSIS
In this study, the LES and HED were evaluated using the TOPSIS approach. This is method is frequently chosen for multiobjective decision analyses of finite schemes in systems engineering that methodically examine the discrepancies between the ideal state and the actual level [26,30]. Equations (4)–(8) display the formulas. V i j represents the weighted normalization matrix; V j + represents the ideal positive solution; V j represents the ideal negative solution; D i + and D i , respectively, represent the distance between the evaluated unit and the ideal positive and negative solutions; and U i stands for the LES or HED of the research object.
V i j = Y i j × W j , m × n
V j + = m a x V i j , j = 1,2 , , m
V j = m i n V i j , j = 1,2 , , m
D i + = j = 1 n V i j V j + 2 ; D i = j = 1 n V i j V j 2
U i = D i D i + + D i

2.3.3. CCD Model

In this study, the coupling degree describes the degree of interaction in the LES–HED subsystems. The CCD is a quantitative indicator used to assess the condition or level of coordination of LES–HED subsystems. Equations (9) and (10) display the formulas [31]. C is the coupling degree, D is the CCD, UL is the LES-, and UH is the H E D . The classification criteria of the stages of coupling are shown in Table 3. The classification criteria of the relationships of coupling coordination are shown in Table 4.
C = 2 × ( U L × U H ) / ( U L + U H ) 2
D = C × ( 0.5 × U L + 0.5 × U H )

2.3.4. PVAR Model

The PVAR model was applied to quantitatively analyze the interactive response mechanism between LES and HED in the BTH region. Equations (11) and (12) display the formulas. Y i t is the explanatory variable, LES and HED are explanatory variables, I is the region, t is time, n is the number of lags, α i t is the region’s fixed effect, f t is the time effect, n t I is the coefficient matrix to be estimated, and μ i t is the error term with an independent and identical distribution.
Y n = α i t + f t + t 1 n n t I i , t n + μ i t
Y i t = L E S , H E D

2.3.5. Model of the Degree of Relative Development

The CCD model is unable to describe the status of the development of LES–HED subsystems accurately. This study used a model of the degree of relative development to examine the level of relative development [32]. Equation (13) displays the formula. E is the degree of relative development. The types of development are divided according to the degree of relative development, and the division criteria are shown in Table 5.
E = U H / U L , U L > U H U L / U H , U L < U H 1 , U L = U H

3. Results

3.1. Characteristics of Coupling Coordination

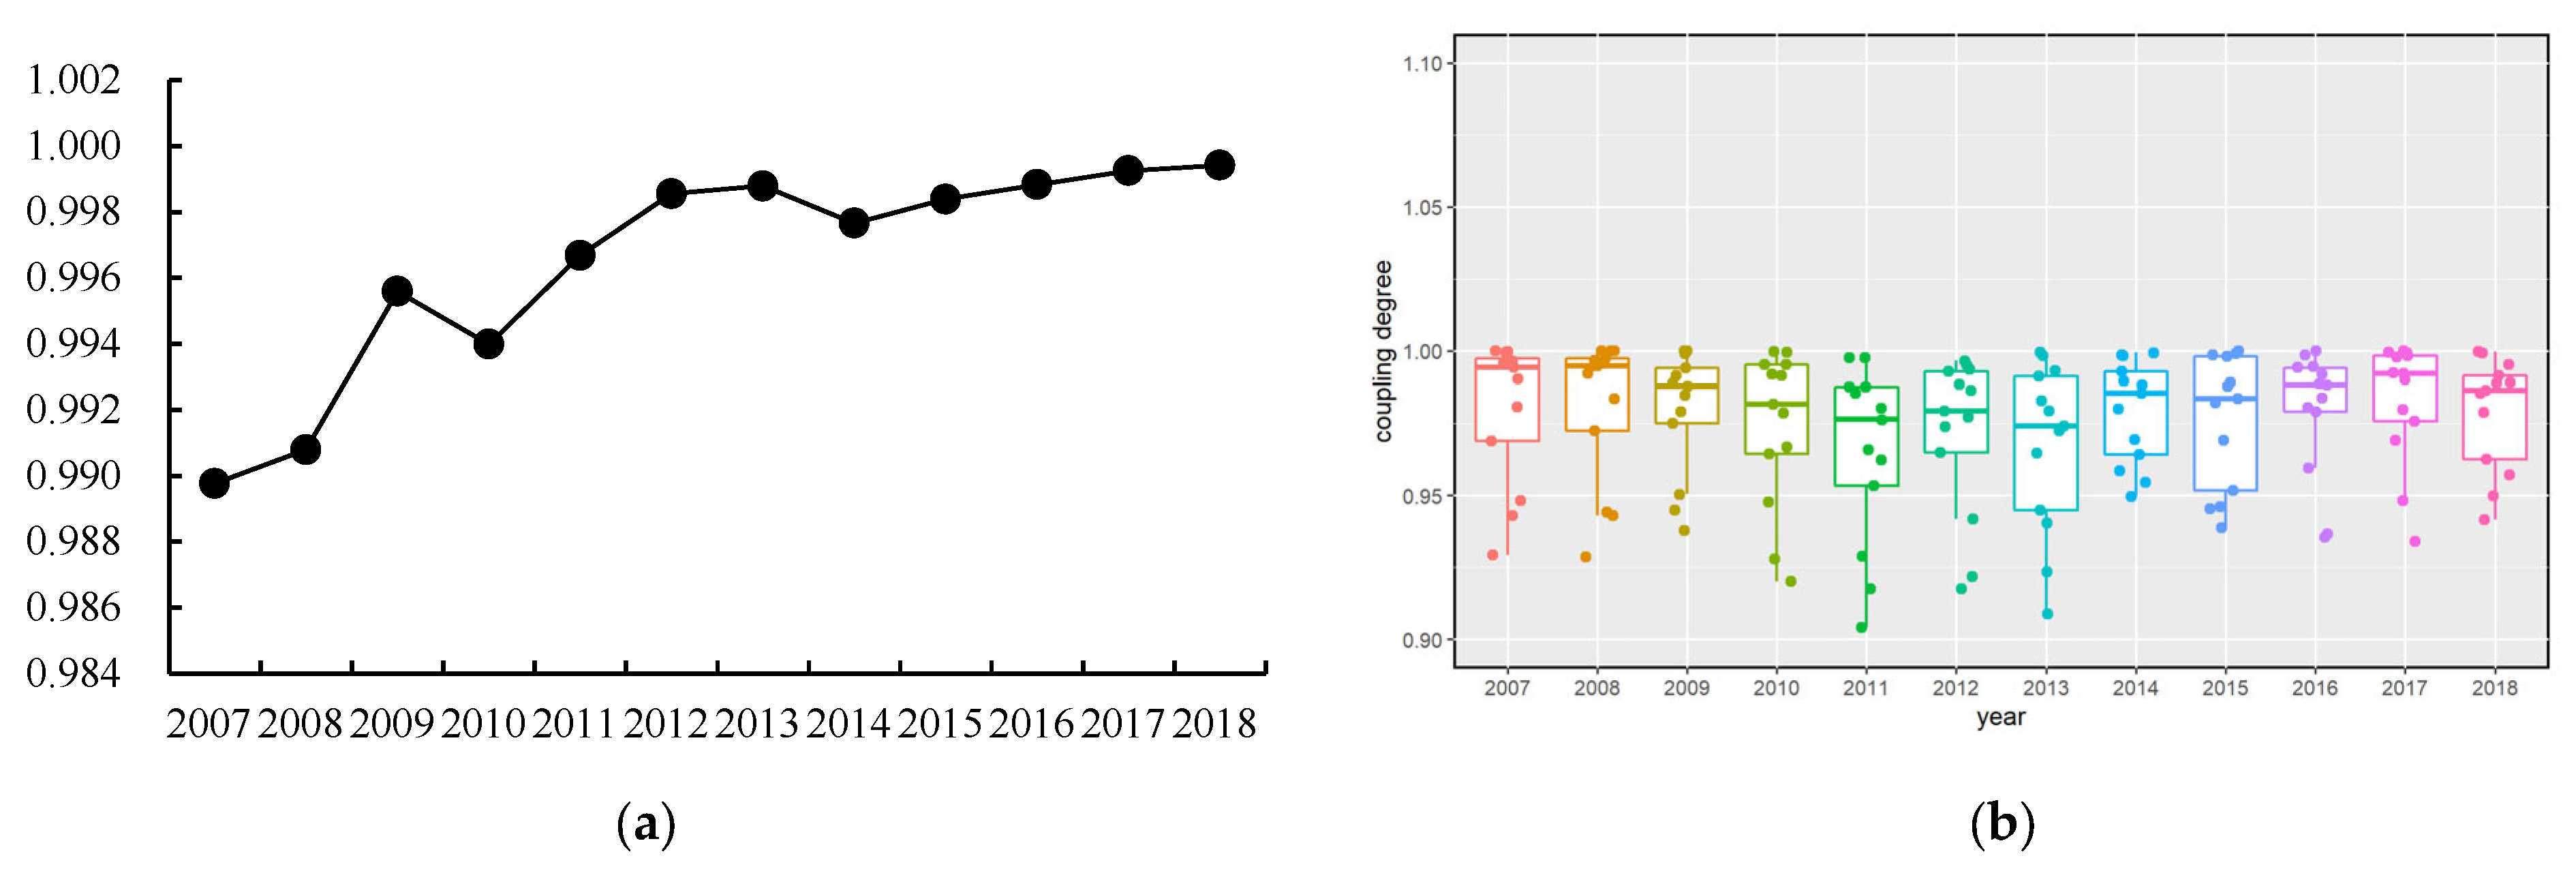
3.1.1. Degree of Coupling

We determined the strength of the coupling in the LES–HED subsystems in the BTH region between 2007 and 2018 using the CCD model. Over the previous 12 years, the degree of coupling has progressively trended upward (from 0.9898 to 0.9994), and the BTH area is at a stage of high coupling (Figure 3). The cities of the BTH have a degree of coupling between 0.92 and 1.00, which indicates that they are at the stage of high coupling (Figure 3). According to the findings, there was a high correlation between LES and HED in the BTH region, and it was gradually improving.

3.1.2. Coupling Coordination Degree

We estimated the CCD of LES–HED subsystems in the BTH area between 2007 and 2018 using the CCD model (Figure 4). Over the previous 12 years, the CCD has progressively risen (from 0.47 to 0.58), changing the relationship of coordination from virtual dissonance to slight coordination. In particular, the CCD grew from 0.47 to 0.50 in 2010, and the coupling coordination was on the verge of dissonance, showing that the impact of the LES–HED subsystems was not clear, and the relationship of coordination was weak. The CCD grew from 0.50 in 2010 to 0.58 in 2018, indicating that there was some mutual effect but no improvement in the coupling coordination, which was barely correlated.
Within the research area’s cities, the CCD of the LES–HED subsystems showed a general upward trend and included good coordination, moderate coordination, strong coordination, and barely detectable dissonance. The CCD increased over time, rising from 0.3499–0.4422 in 2007 to 0.4141–0.8402 in 2018, and changed from mild dissonance to strong coordination (Figure 4). The spatiotemporal pattern is shown in Figure 5, which clearly reflects the CCD of each city in 2007, 2010, 2015, and 2018. The general spatial pattern throughout the research period was “center > periphery”. There is no doubt that the CCD in Beijing and Tianjin was superior to that in other areas. The year 2018 saw Beijing and Tianjin establish a strong level of coordination. Shijiazhuang, Langfang, and Qinhuangdao were all quite weak and slight coordinated. The other nine cities (Chengde, Zhangjiakou, Tangshan, Baoding, Cangzhou, Hengshui, Xingtai, and Handan) were near dissonance. The evolution of the curve of the relationship of coupling coordination showed a clear wave shape (Figure 6), where the coupling coordination degree steadily improved and the curve’s peak advanced continuously, showing that the LES and HED system were developing sustainably and in an orderly fashion. The proportion of cities with mild dissonance gradually decreased (30.77%→23.08%→0→0), the proportion of cities with near dissonance increased and then decreased (53.85%→61.54%→84.62%→61.54%), the proportion of cities with slight coordination decreased and then increased (7.69%→0→0→23.08%), the proportion of cities with primary coordination first increased and then decreased (7.69%→15.38%→0→0), the proportion of cities with intermediate coordination increased (0→0→15.38%→7.69%), and the proportion of cities with good coordination increased (0→0→0→7.69%).

3.2. Results of the PVAR Model

3.2.1. Unit Root Test

Before performing a dynamic analysis, a unit root test was required (Table 6). A single test method is easily prone to error. This study used the HT and IPS tests because the original sample included short-run panel data. It turned out that the initial data did not pass the stationarity test and that the data were unstable. However, the first-order difference value of the original data passed the 1% significance level, meeting the same-order single integer condition. It can be seen that LES and HED are first-order single integer data.

3.2.2. Selection of the Optimal Lag Order

The optimal lag order was determined first, followed by estimation of the model. In this study, the test was performed using the information criterion, and the lag orders were set to 1, 2, 3, 4, and 5. The values of the information criterion were calculated for AIC, BIC, and HQIC. The test results indicated that the best lag order was 1 (Table 7).

3.2.3. Cointegration Tests

LES and HED had the same order of single integration, which met the basic conditions of the test of the cointegration relationship. This study tested the possible cointegration relationship of LES–HED subsystems and examined whether there was a long-term and stable equilibrium in the relationship of LES–HED subsystems and whether they could develop dynamically. A single test method made it easy to introduce errors. This study selected two methods for the cointegration tests, including the Kao test and the Pedroni test. The results showed that the statistical results of the ADF (augmented Dickey–Fuller) test obtained by the Kao test passed the significance level of 10% and that the statistical results of the modified PP (Phillips–Perron) and ADF tests obtained by the Pedroni test passed the significance level of 1% (Table 8). Therefore, there was a long-term and stable equilibrium in the relationship between LES and HED, and the two could develop dynamically.

3.2.4. Granger Causality Tests

Granger causality tests were used to verify the statistical causation of the variables. HED is not the Granger reason for LES, and LES is the Granger reason for HED (Table 9). Therefore, an improvement in LES promoted HED, but the impact of HED on LES was limited in the BTH region.

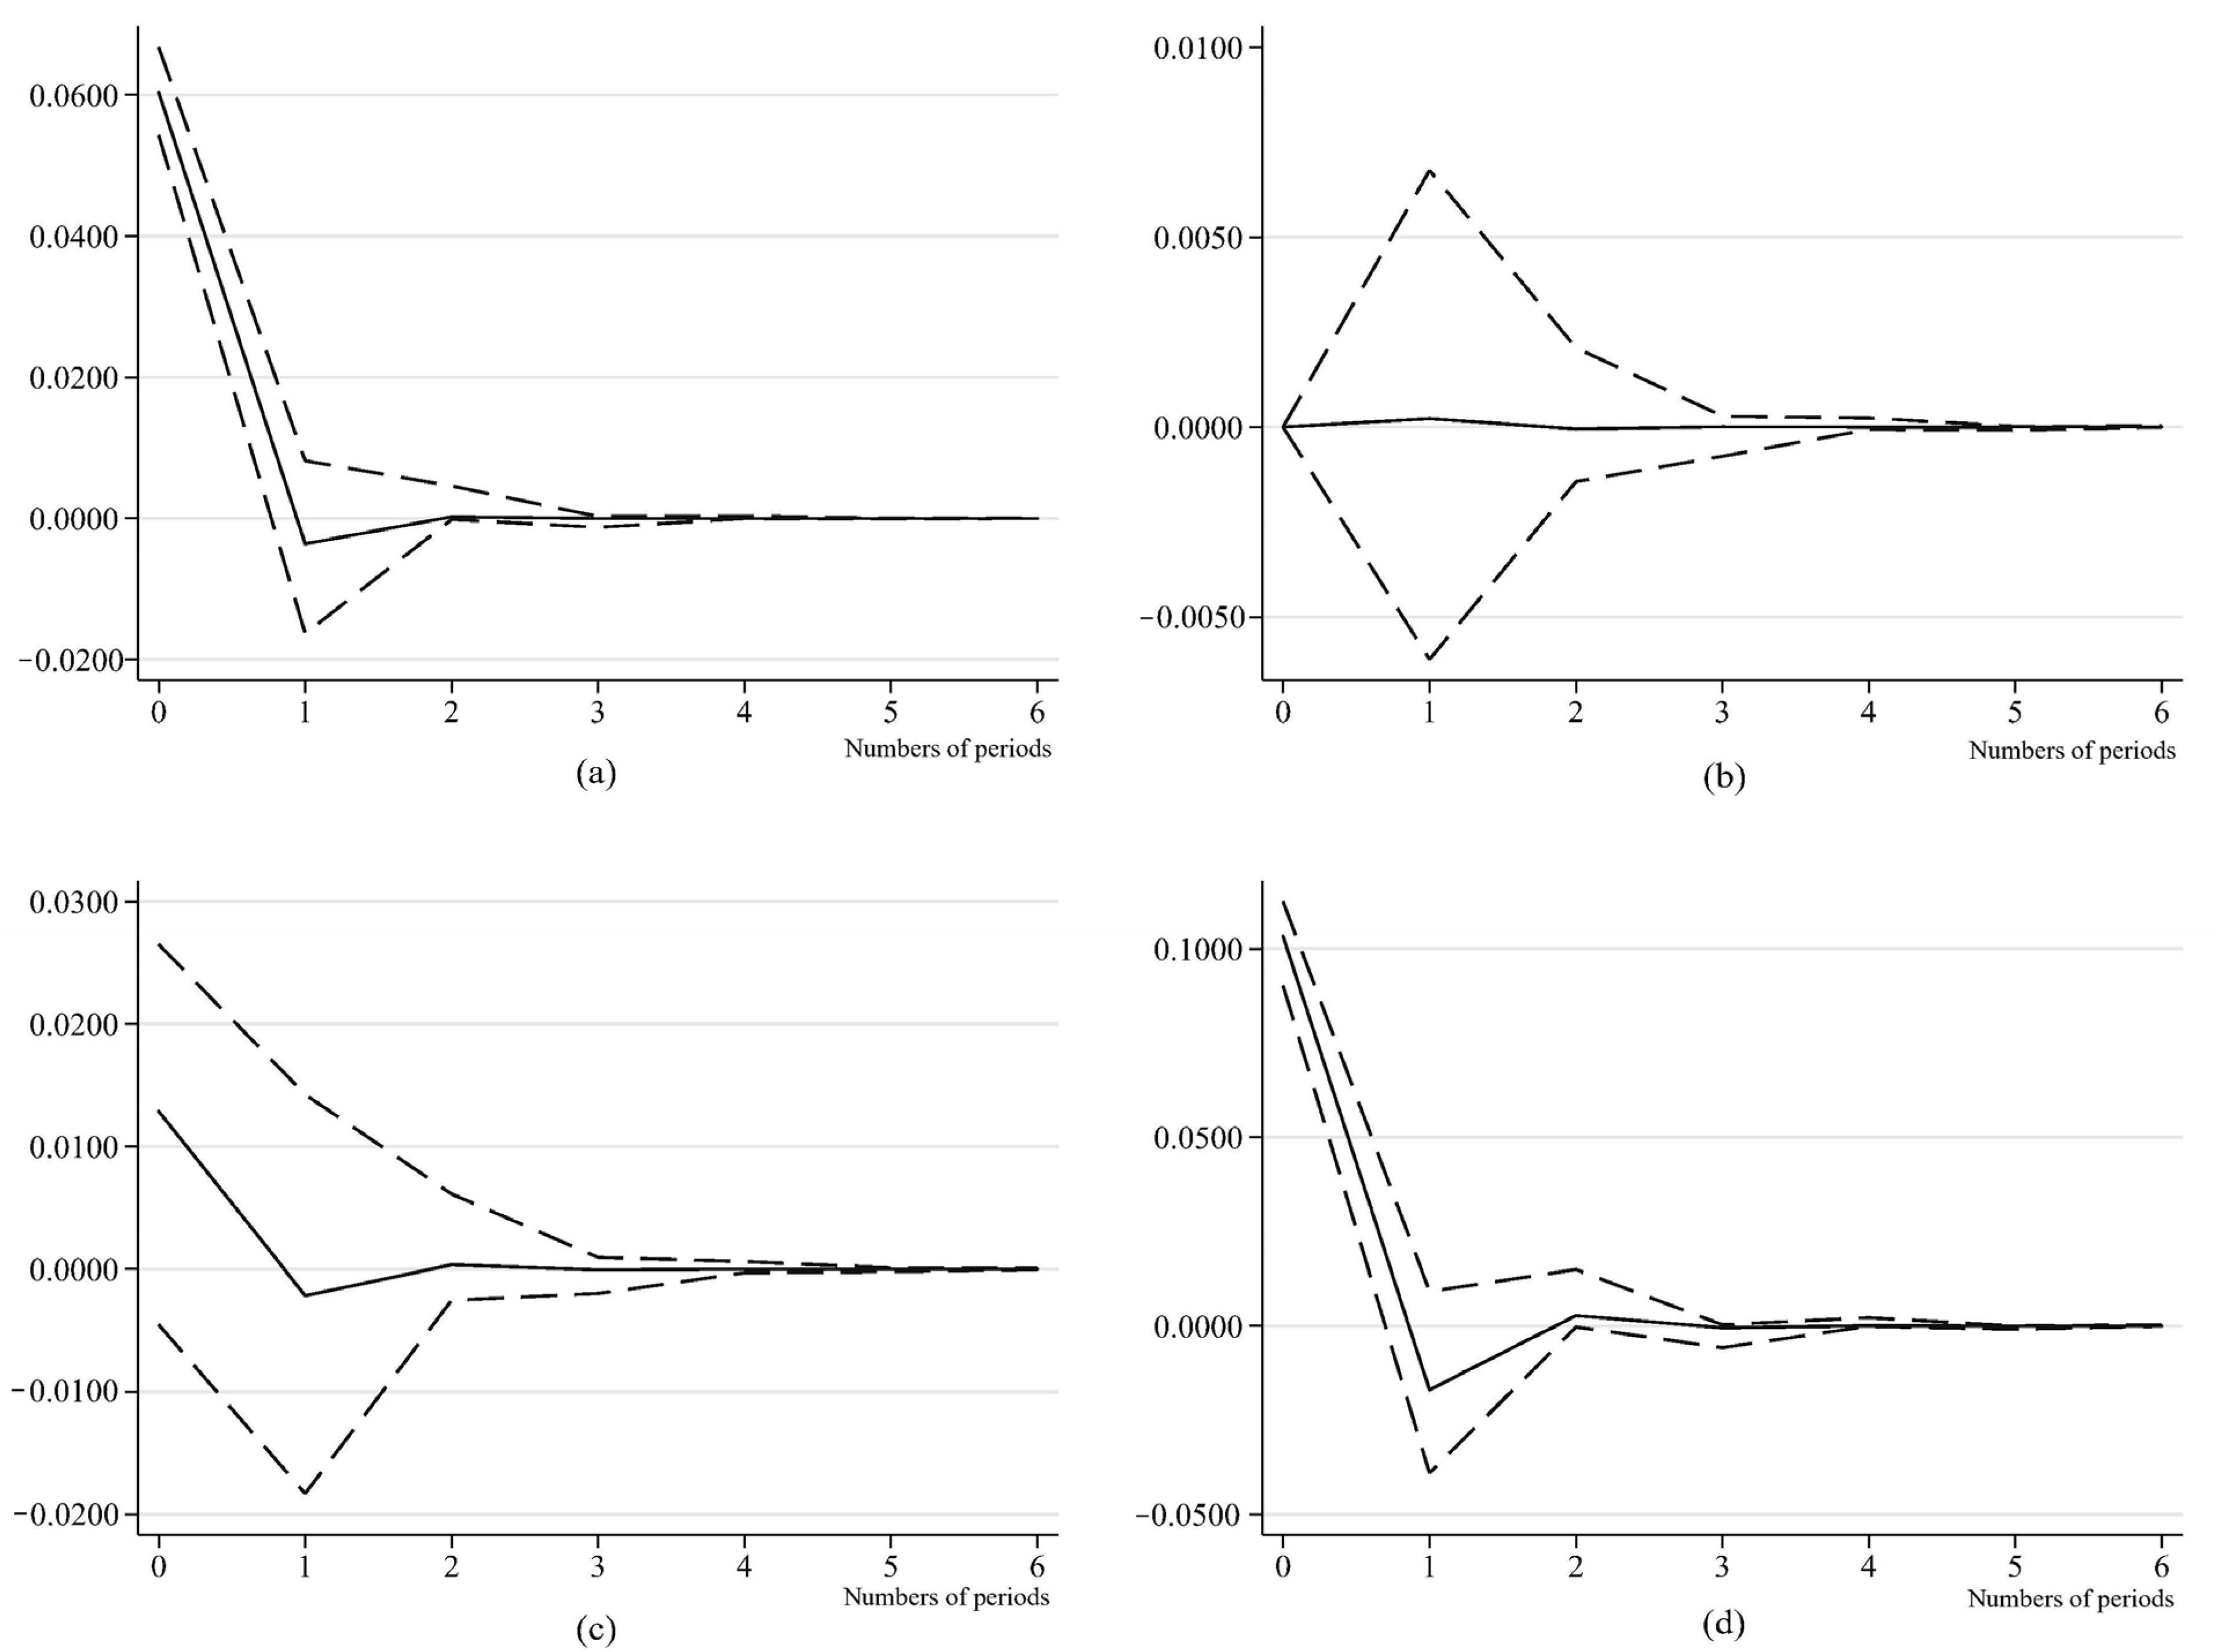
3.2.5. Analysis of the Interaction Mechanism

The impulse response function can visualize the dynamic interactive effects between different variables. Impulse response analysis was conducted for LES–HED subsystems, and Monte Carlo simulation was conducted to explore the dynamic trends of the interactions of LES–HED subsystems over the following 6 years (Figure 7). The LES–HED subsystems showed characteristics of self-improvement, and their impact gradually decreased with the passage of time. The effect of LES on itself showed a tendency to rise and then fall, with the maximum value appearing in the first stage and stabilizing after about two stages. The impact of HED on itself rose at first and then fell. The maximum value of the impact also appeared in the first phase, and the impact was stable after about three phases. The impact of LES on HED showed a positive fluctuation, but the amplitude of the change was relatively small. The maximum value of the impact appeared in the first phase, and the impact was stable after about two phases. The result showed that although HED had a driving effect on LES, the effect was not significant. The effect of HED on LES showed a tendency to rise and then fall, with the maximum value appearing in the first phase and becoming stable after about three phases. The results showed that LES had an obvious supporting effect on HED, but the effect gradually decreased over time.

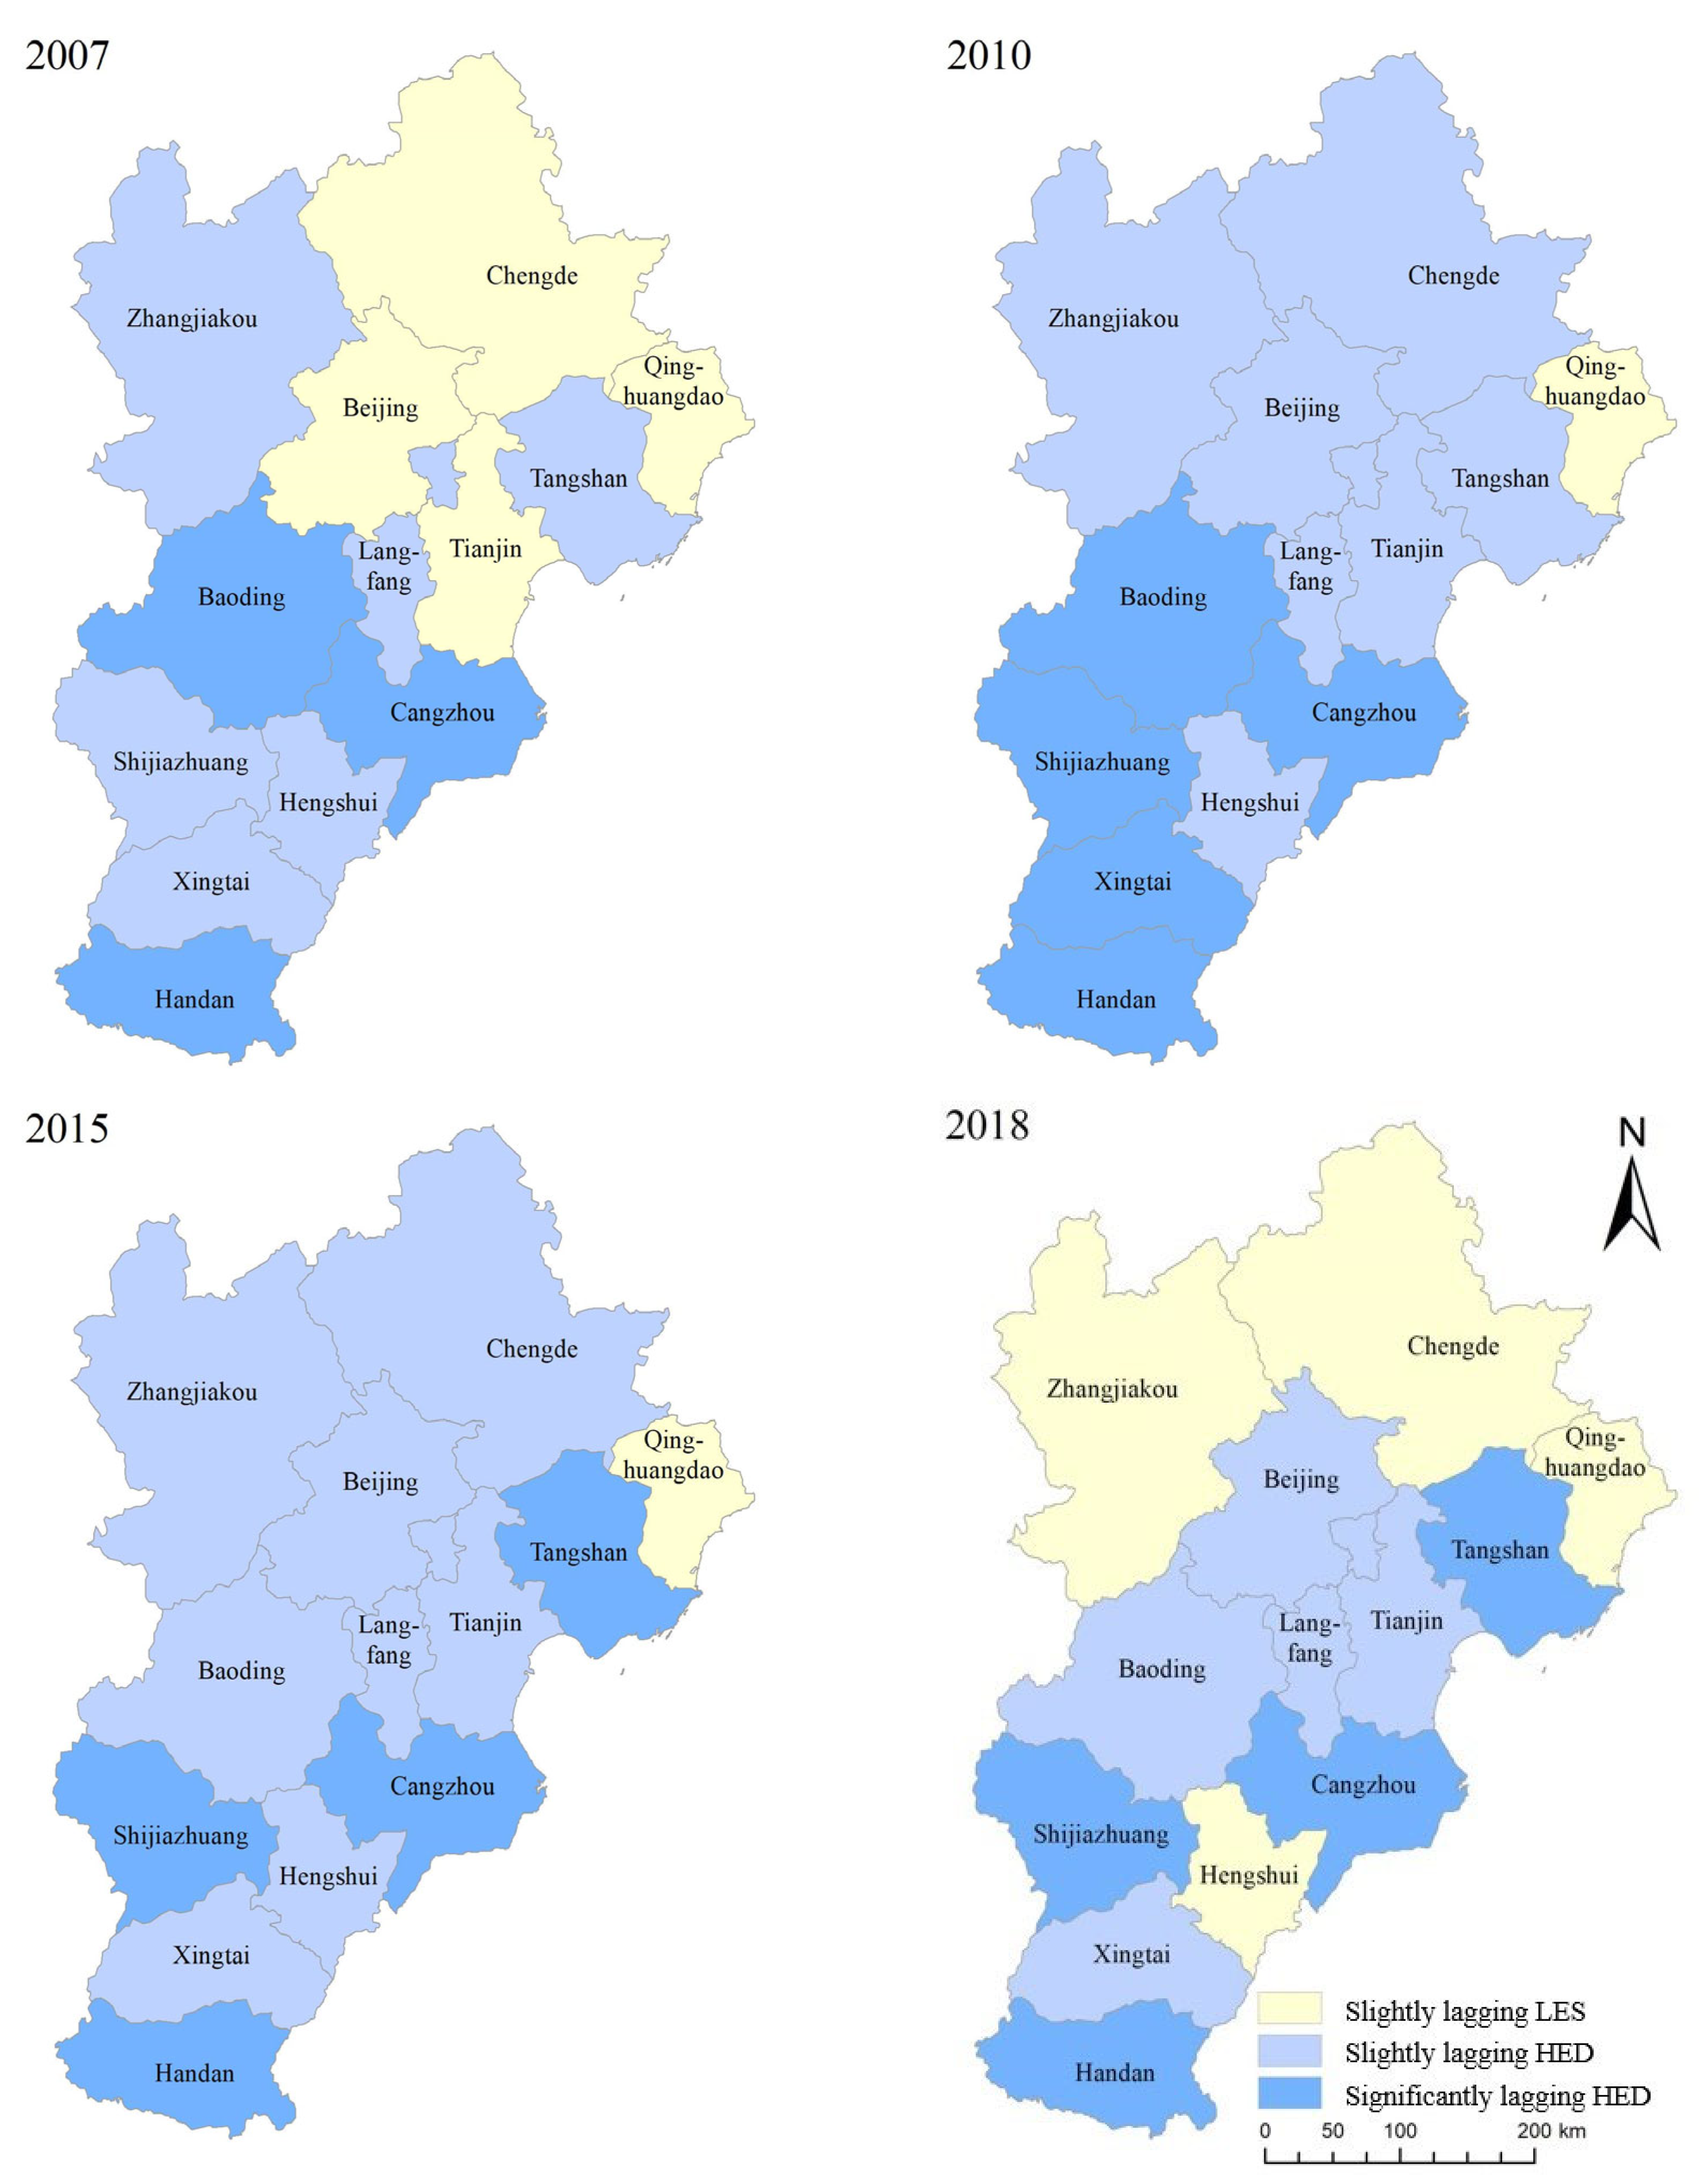
3.3. Types of Development

On the basis of the model of relative development and the classification standards of the types of development, we divided the development patterns of the cities in 2007, 2010, 2015, and 2018 (Figure 8). The development patterns within the cities of the study area included slightly lagging LES, slightly lagging HED, and significantly lagging HED. The proportion of cities with slightly lagging HED first rose and then descended (46.15%→53.85%→61.54%→38.46%). The proportion of cities with slightly lagging LES first decreased and then increased (30.77%→7.69%→7.69%→30.77%). The proportion of cities with significantly lagging HED first increased and then decreased (23.08%→38.46%→30.77%→30.77%). From the perspective of spatial patterns, the cities with slightly lagging LES were mainly distributed in the northern part of the research area, such as Chengde, Zhangjiakou, Qinhuangdao, and Hengshui. The cities with slightly lagging HED were mainly distributed in the central part of the research area, such as Beijing, Tianjin, Langfang, Baoding, and Xingtai. The cities with significantly lagging HED were mainly distributed in the southern part of the research area, such as Tangshan, Cangzhou, Shijiazhuang, and Handan.

4. Discussion

The CCD model based on coupling theory can help monitor the dynamics, depict the evolutionary processes, and identify whether the coupling system has a coordinated development pattern, which is essential for making decisions to achieve coordinated regional development [33]. This research showed that the area is in a stage of high coupling stage, the CCD has generally been at a low level but continues to improve, and the interaction between the two systems has gradually strengthened and developed in an orderly direction according to the CCD model. In line with this, this study also explored the interactive mechanism of the two systems with the PVAR model. The research showed that a long-term and stable equilibrium existed in the LES–HED subsystems. An increase in LES can promote HED, but an increase in HED has less effect on LES. Due to the complex and systematic coupling between LES and HED, this study demonstrated that the CCD model and PVAR model were efficient tools for studying the coupling coordination and mechanism of the interactions of LES–HED subsystems in sustainable regional development, as well as for understanding the effects of synergistic interactions.
The key to realizing the development of coupling coordination in LES–HED subsystems is to promote a positive relationship between the two subsystems. The CCD and PVAR models could reflect the strength of the correlation of LES–HED subsystems well but could not represent the level of relative development of the two systems. Therefore, this study used the model of relative development to analyze the status of development in the LES–HED subsystems. The research showed that the cities with slightly lagging LES were mainly distributed in the northern part of the research region, the cities with slightly lagging HED were mainly distributed in the middle part of the research region, and the cities with significantly lagging HED were mainly distributed in the southern part of the research region. HED should be promoted in five aspects in areas where it lags behind: comprehensively improving innovative capacity, promoting coordinated regional development, forming a new pattern of opening up, accelerating green and shared development, and implementing differentiated development programs. Specific policy recommendations touching on six aspects should be proposed in areas where LES is lagging behind: establishing a mechanism of coordinated development, optimizing the spatial distribution of the population, promoting integrated industrial development, optimizing a comprehensive transportation network, strengthening ecological protection of the land, and improving the level of LES appropriately.
Considering the coupling stage, coordination relationships, and types of development, the study clarified the functional division of coordinated development. In 2018, the research area was in the high coupling stage. According to the coordination relationship and type of development, the study area was divided into six functional zones. The leading development zone of HED mainly included Tangshan, Cangzhou, and Handan; these areas were nearly dissonant, and the HED was significantly lagging. The key economic development zone of HED mainly included Baoding and Xingtai; these areas were nearly dissonant, and the HED was slightly lagging. The key development zone of LES mainly included Chengde, Zhangjiakou, and Hengshui; these areas were nearly dissonant, and the LES was slightly lagging. The zone of steady development of LES mainly included Qinghuangdao; the area was barely coordinated, and the LES was slightly lagging. The zone of steady development of HED mainly included Langfang and Shijiazhuang; these areas were barely coordinated, and the HED was slightly or significantly lagging. The zone of sustainable development of HED mainly included Beijing and Tianjin; these areas had good coordination or intermediate coordination, and the HED was slightly lagging.
This study theoretically analyzed the close relationship between the LES–HED subsystems, explored the coupling coordination and mechanism of the interactions of the subsystems using the CCD model and PVAR model, and used the model of relative development to classify the types of regional development, which could provide a basis for selecting paths of sustainable development. However, due to data limitations and imperfect knowledge, this study still has room for further improvement in the modeling process. First, selecting evaluation metrics based on theoretical analysis will lead to more reliable results. For example, an analysis of the driving force was used to determine the key factors affecting LES or HED. Second, the coefficients of contribution in the CCD model’s equations are usually defined on the basis of previous knowledge, which may lead to distorted results in the evaluation because of subjectivity. Therefore, we could consider defining coefficients of contribution based on synergy theory in future studies [34].

5. Conclusions

Using the BTH region as the research region, this research quantitatively measured the state of coupling coordination of the LES–HED subsystems and analyzed the spatial and temporal properties of their coordination relationships based on data obtained from 2007 to 2018. The PVAR model was then used to analyze the interaction–response mechanism of the LES–HED subsystems, and a model of the degree of relative development was used to classify the types of the regional development. The following are the main conclusions reached and drawn in this study.
(1)
The BTH region is in a stage of high coupling, and the degree of coupling showed a trend of gradual enhancement.
(2)
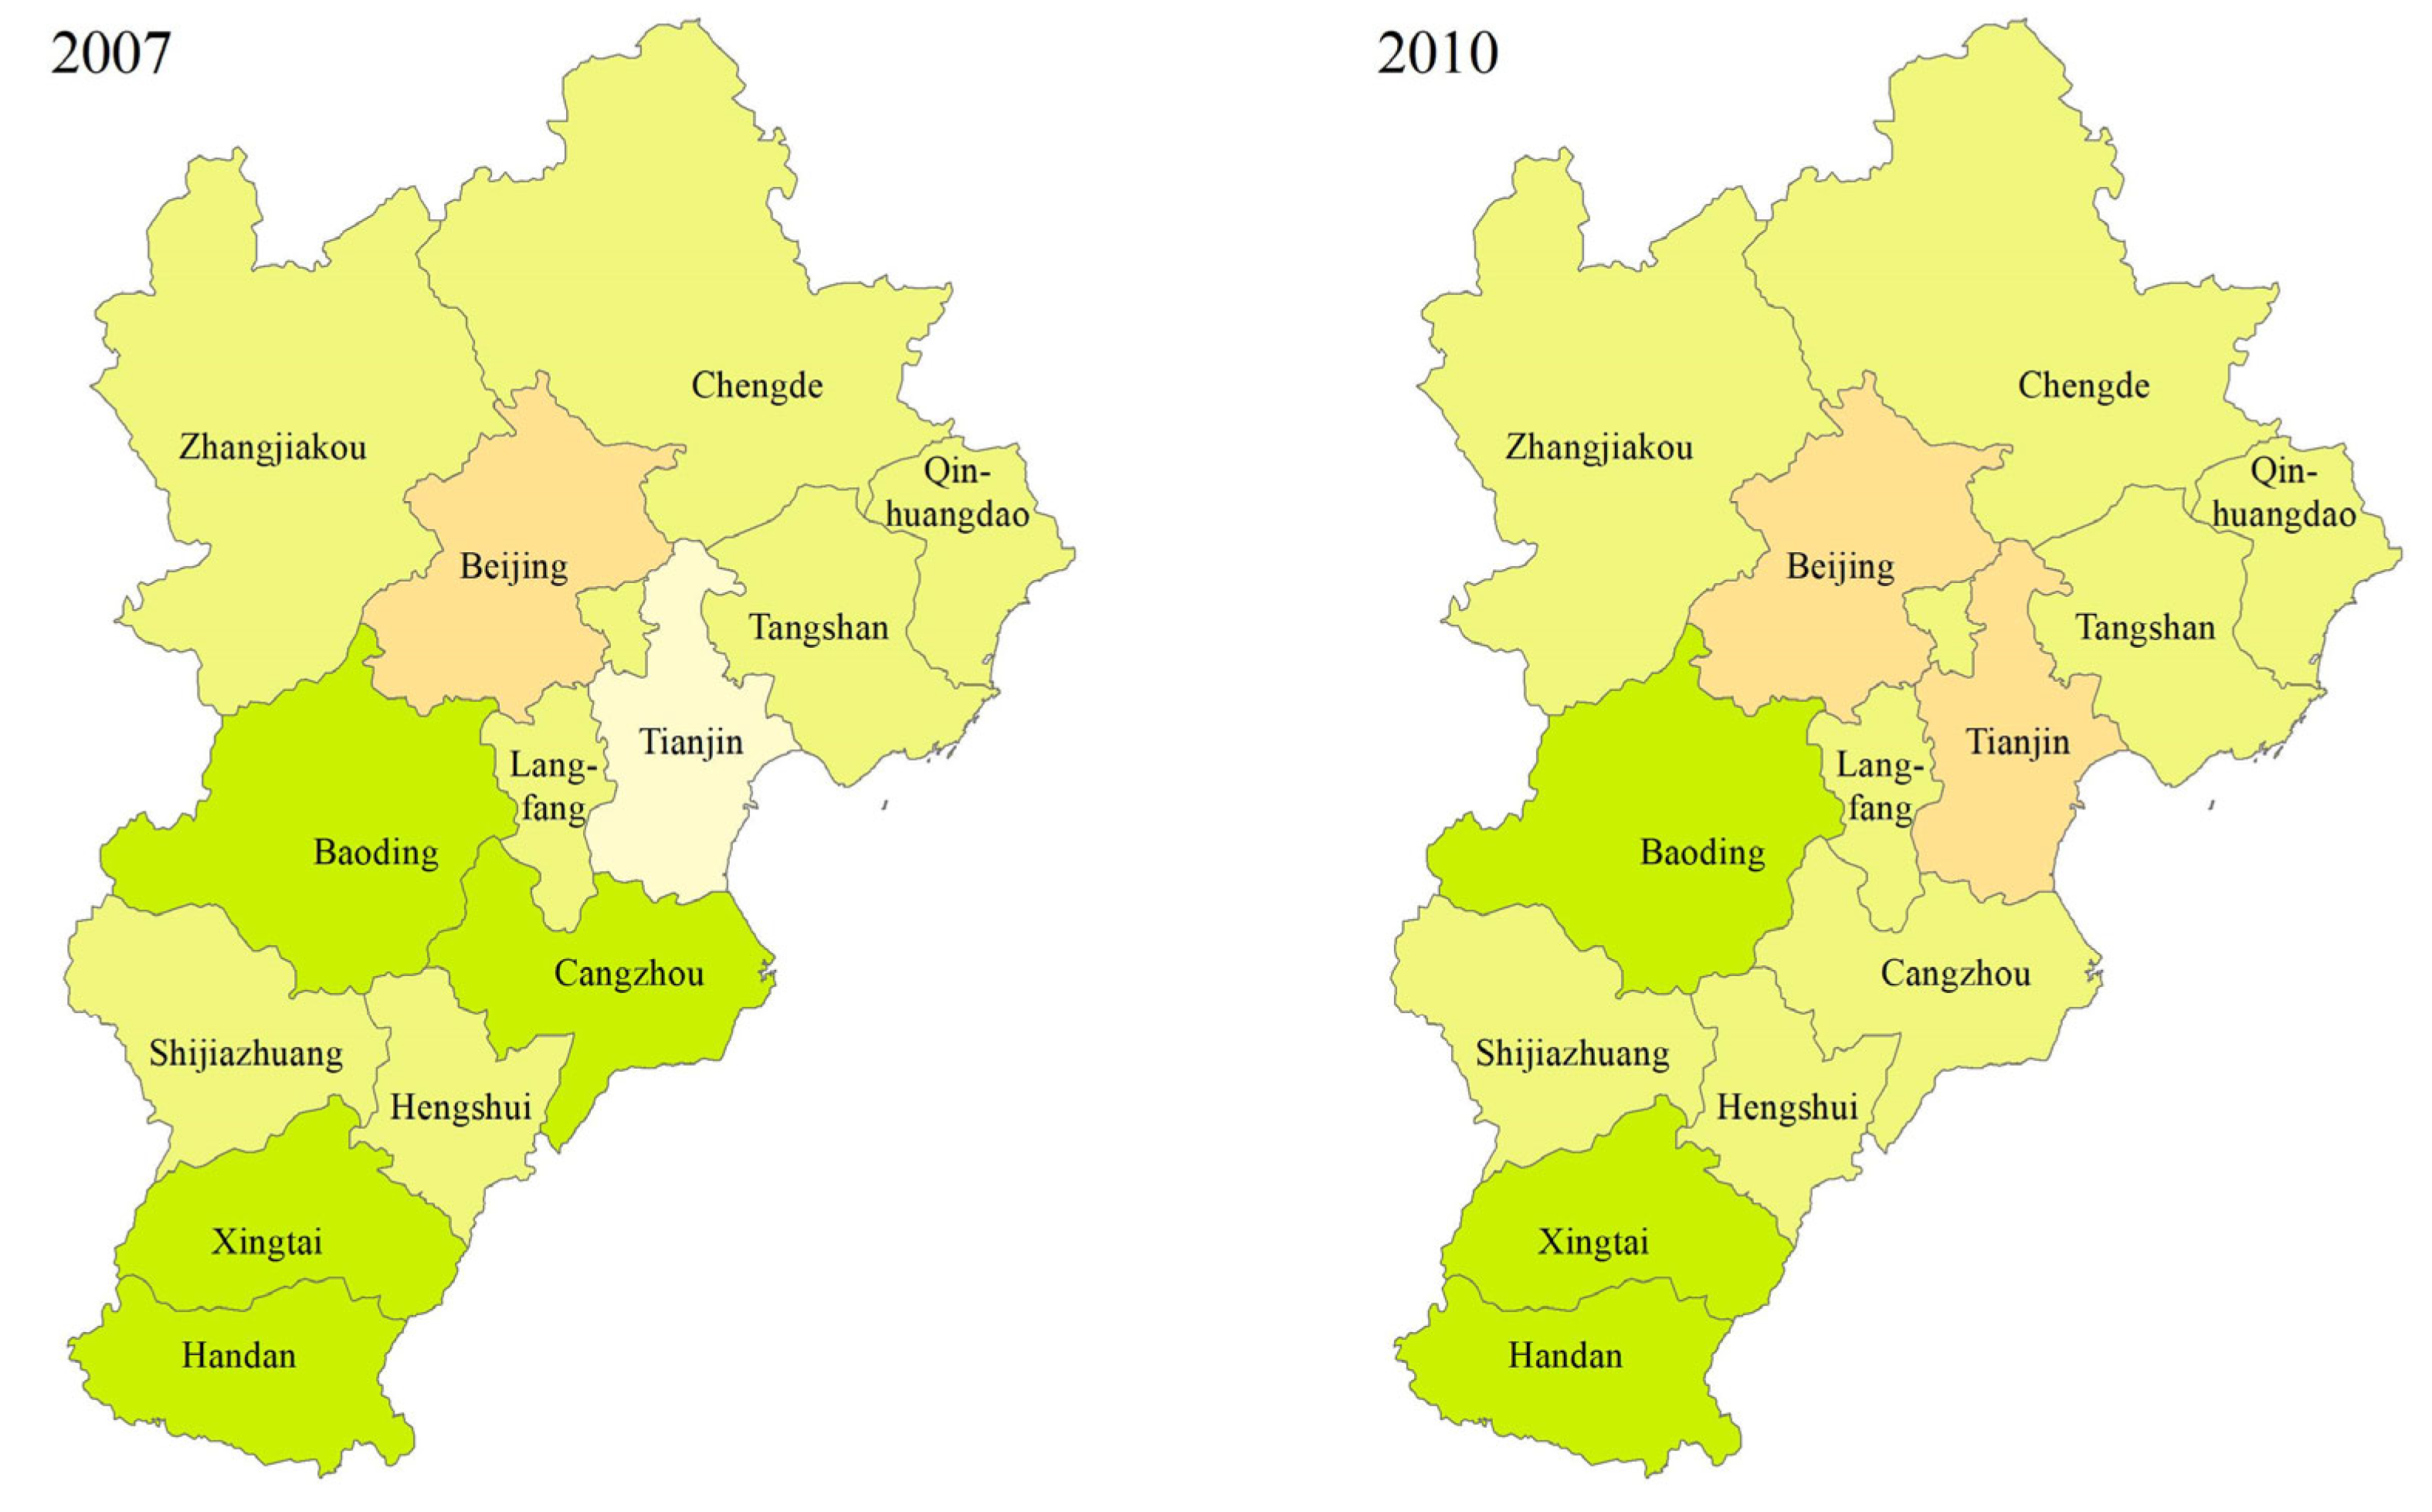
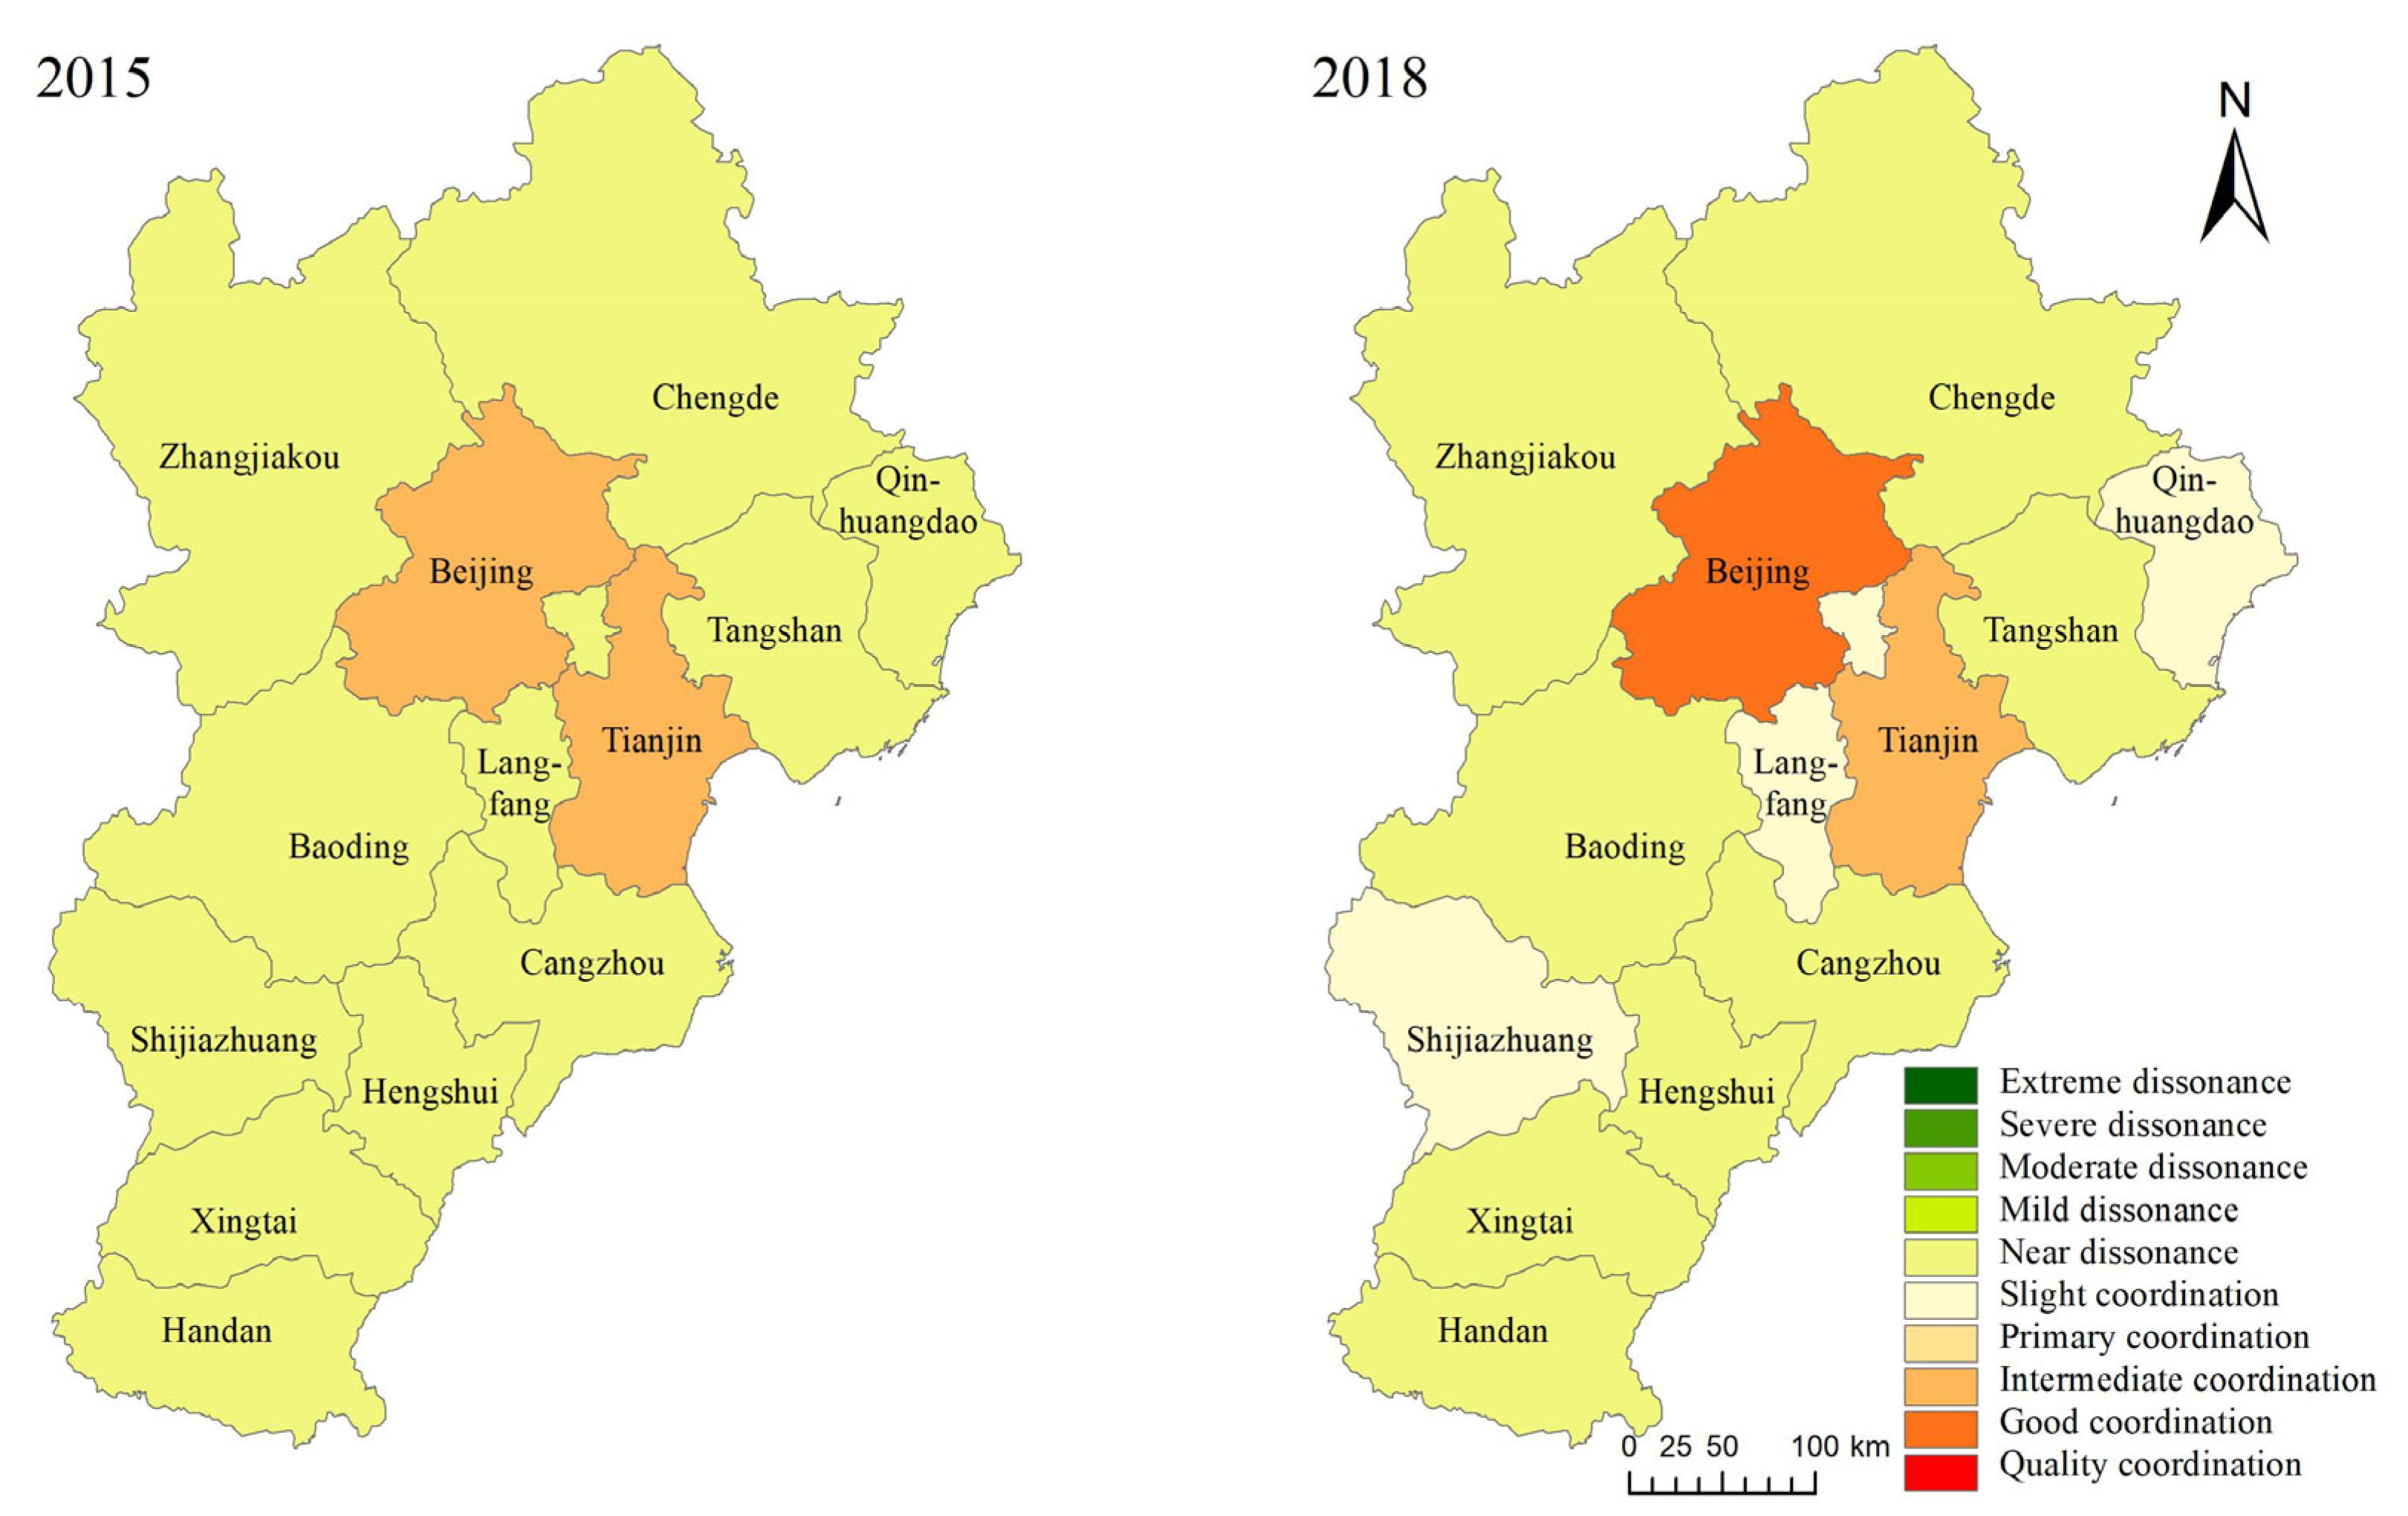
During the study period, with a slow increase in CCD (from 0.47 to 0.58), the coordination relationship changed from near dissonance to slight coordination in the BTH region. The CCD rose from 0.3499–0.4422 (2007) to 0.4141–0.8402 (2018) and evolved from mild dissonance to good coordination over time within the research area’s cities. The spatial distribution was characterized as being low in the central area and high in the peripheral area. The CCD showed a clear wave-like curve of evolution over time.
(3)
A long-term and stable equilibrium relationship existed in the LES–HED subsystems. The two systems of LES and HED showed characteristics of self-improvement. HED had a positive driving effect on LES, but the effect was not obvious. LES had an obvious supporting effect on HED, but the effect gradually decreased over time.
(4)
The patterns of development within the cities of the study area included three types of development. The cities with slightly lagging HED were scattered in the middle of the region; the proportion of these cities was the highest. Cities with slightly lagging LES were scattered throughout the north of the region. Cities with significantly lagging HED were mostly concentrated in the south. According to the coordination relationship and type of development, the research was divided into six functional zones, namely, the leading development zones of HED, the key development zones of HED, the key development zone of LES, the steady development zones of LES, the steady development zones of HED, and the sustainable development zones of HED.
Given the spatial variability in the coupled and coordinated development of LES–HED subsystems, it is necessary to implement different strategies of development. This study can inform decisions to promote the coordinated development of LES–HED subsystems for sustainable regional development.

Author Contributions

Conceptualization, D.G. and D.W.; methodology, D.G.; validation, X.Z.; formal analysis, X.Z. and Y.Y.; data curation, D.G.; writing—original draft preparation, D.G.; writing—review and editing, D.G. and H.J.; visualization, D.G. and Y.Y.; supervision, X.Z.; funding acquisition, F.Y., D.W. and Y.Y. All authors have read and agreed to the published version of the manuscript.

Funding

This research was funded by the National Natural Science Foundation of China (grant numbers 42071255 and 42071231) and the departmental budget project of the Ministry of Natural Resources of the People’s Republic of China (121102000000180076).

Institutional Review Board Statement

Not applicable.

Informed Consent Statement

Not applicable.

Data Availability Statement

Data presented in the study are available on request from the corresponding author.

Acknowledgments

We gratefully acknowledge the detailed and helpful comments of the anonymous reviewers, who enabled us to improve this article considerably.

Conflicts of Interest

The authors declare no conflict of interest.

References

  1. United Nations (UN). Transforming Our World: The 2030 Agenda for Sustainable Development. Working Papers 2015. Available online: https://ideas.repec.org/p/ess/wpaper/id7559.html (accessed on 1 January 2020).
  2. Managi, S.; Kaneko, S. Environmental performance and returns to pollution abatement in China. Ecol. Econ. 2009, 68, 1643–1651. [Google Scholar] [CrossRef]
  3. Wang, H.Y.; Qin, F.; Zhang, X.C. A spatial exploring model for urban land ecological security based on a modified artificial bee colony algorithm. Ecol. Inform. 2019, 50, 51–61. [Google Scholar] [CrossRef]
  4. Wessels, K.J.; Prince, S.D.; Frost, P.E.; Zyl, D.V. Assessing the effects of human-induced land degradation in the former homelands of northern South Africa with a 1 km AVHRR NDVI time-series. Remote Sens. Environ. 2004, 91, 47–67. [Google Scholar] [CrossRef]
  5. Schrad, M.L. Threat level green: Conceding ecology for security in eastern Europe and the former Soviet Union. Glob. Environ. Chang. 2006, 16, 400–422. [Google Scholar] [CrossRef]
  6. Honson, M.; Marvin, S. Urban Ecological Security: A new urban paradigm? Int. J. Urban Reg. Res. 2009, 33, 193–215. [Google Scholar] [CrossRef]
  7. Salvati, L.; Bajocco, S. Land sensitivity to desertification across Italy: Past, present, and future. Appl. Geogr. 2011, 31, 223–231. [Google Scholar] [CrossRef]
  8. Liang, W.; Bian, Z.F.; Chen, H.Q. Land ecological security assessment for Yancheng city based on catastrophe theory. Earth Sci. Res. J. 2014, 18, 181–187. [Google Scholar] [CrossRef]
  9. Pörtner, H.O.; Roberts, D.C.; Tignor, M.M.B.; Poloczanska, E.; Mintenbeck, K.; Alegría, A.; Craig, M.; Langsdorf, S.; Löschkef, S.; Möller, V.; et al. Climate Change 2022: Impacts, Adaptation and Vulnerability; IPCC: Geneva, Switzerland, 2022. Available online: https://www.ipcc.ch/report/ar6/wg2/resources/press/press-release/ (accessed on 15 April 2023).
  10. Grossman, G.M.; Krueger, A.B. Economic growth and the environment. Q. J. Econ. 1995, 110, 353–377. [Google Scholar] [CrossRef]
  11. Li, H.; Nan, L.; Li, S.P. Evaluation of land ecological security based on panel data cluster analysis: A case study in Shanxi province. Areal Res. Dev. 2017, 36, 136–141. [Google Scholar]
  12. Yang, K.; Li, R.K.; Zhang, H.X. Assessment and research of economic growth in ecological zones and urban land ecological safety. Acta Agric. Jiangxi 2016, 28, 109–113. [Google Scholar]
  13. Wang, P.; Zeng, H. The relationship between economic growth and urban land ecological security based on the model of the EKC. Ecol. Environ. Sci. 2013, 22, 351–356. [Google Scholar]
  14. Müller-Fürstenberger, G.; Wagner, M. Exploring the environmental Kuznets hypothesis: Theoretical and econometric problems. Ecol. Econ. 2007, 62, 648–660. [Google Scholar] [CrossRef]
  15. Srinivasan, V.; Seto, K.C.; Emerson, R.; Gorelick, S.M. The impact of urbanization on water vulnerability: A coupled human–environment system approach for Chennai, India. Glob. Environ. Chang. 2013, 23, 229–239. [Google Scholar] [CrossRef]
  16. Dai, J. Analysis on the coupling and coordination of land ecological security and economic development in hunan province. Rural Econ. Sci.-Technol. 2019, 30, 42–45. [Google Scholar]
  17. Xiong, J.H.; Tang, J.W. On the coupling harmonic coordination between the land ecological security and the social economic development—A case sampling study of Guangzhou. J. Saf. Environ. 2019, 19, 615–620. [Google Scholar]
  18. Yao, F.; Ma, L. Coupling and coordination analysis of land ecological security and green economy in Henan province. S. China Rural Area 2019, 35, 28–32. [Google Scholar]
  19. He, R.H.; Rao, Q.; Yang, H.Y.; Zhang, X.L. Evaluation of the relationship between land ecological security and economic development in anhui province based on the coupling eoordination model. J. Heilongjiang Bayi Agric. Univ. 2020, 32, 119–124+132. [Google Scholar]
  20. Hou, X.F.; Jiang, Y.Z. Evaluation of the relationship between land ecological security and economic development based on the coupling coordination degree in Jieyang City, China. J. Hainan Norm. Univ. (Nat. Sci.) 2020, 33, 446–452. [Google Scholar]
  21. Xiao, H.Y.; Ren, H.L. Coupling coordination relationship and obstacle factor analysis of land ecological security and social economic development in Bijie, Guizhou. Shanghai Land Resour. 2021, 42, 33–38. [Google Scholar]
  22. Zhang, K.; Li, H.; Zhou, J.C.; Guo, Z.L.; Liu, J. Coupling and coordination analysis on land eco-security and economic development of counties in the Changsha-Zhuzhou-Xiangtan Region. Sci. Technol. Manag. Land Resour. 2021, 38, 1–17. [Google Scholar]
  23. Love, I.; Zicchino, L. Financial development and dynamic investment behavior: Evidence from panel VAR. Q. Rev. Econ. Financ. 2006, 46, 190–210. [Google Scholar] [CrossRef]
  24. Sun, Y.; Chen, Q. Effect of green finance on technological progress and economic growth: Empirical analysis based on PVAR approach. J. Financ. Econ. 2019, 5, 28–33. [Google Scholar]
  25. Shao, Q.L.; Guo, J.J.; Kang, P. Environmental response to growth in the marine economy and urbanization: A heterogeneity analysis of 11 Chinese coastal regions using a panel vector autoregressive model. Mar. Policy 2021, 124, 104350. [Google Scholar] [CrossRef]
  26. Guo, D.Y.; Wang, D.Y.; Zhong, X.Y.; Yang, Y.Y.; Jiang, L.X. Spatiotemporal changes of land ecological security and its obstacle indicators diagnosis in the Beijing–Tianjin–Hebei region. Land 2021, 10, 706. [Google Scholar] [CrossRef]
  27. Xue, X.D.; Ma, L. Analysis on the coupling and coordination of land ecological and food security in main grain producing areas. Chin. J. Agric. Resour. Reg. Plan. 2022, 43, 1–11. [Google Scholar]
  28. Liu, L.K.; Liang, L.T.; Gao, P.; Fan, C.S.; Wang, H.H.; Wang, H. Coupling relationship and Interaction Relationship between ecological protection and high-quality development in the Yellow River Basin. J. Nat. Resour. 2021, 36, 176–195. [Google Scholar]
  29. Zhou, Y.; He, R.H. Research on the coupling relationship between economic development and land ecological security in the Yangtze River Delta. J. Shandong Agric. Univ. (Soc. Sci. Ed.) 2021, 23, 80–89+186. [Google Scholar]
  30. Guo, D.Y.; Wang, D.Y.; Zhong, X.Y.; Yang, Y.Y. Spatiotemporal changes of high quality development and its obstacle indicators diagnosis in the Beijing–Tianjin–Hebei region. Stat. Decis. 2022, 38, 122–126. [Google Scholar]
  31. Li, J.S.; Sun, W.; Li, M.Y.; Meng, L.L. Coupling coordination degree of production, living and ecological spaces and its influencing factors in the Yellow River Basin. J. Clean. Prod. 2021, 298, 126803. [Google Scholar] [CrossRef]
  32. Liu, B.T. Research on Coordination Development of New Urbanization and Land Health Utilization in Jilin Province; Jilin University: Changchun, China, 2017. [Google Scholar]
  33. Shi, T.; Yang, S.; Zhang, W.; Zhou, Q. Coupling coordination degree measurement and spatiotemporal heterogeneity between economic development and ecological environment–Empirical evidence from tropical and subtropical regions of China. J. Clean. Prod. 2020, 244, 118739. [Google Scholar] [CrossRef]
  34. Shen, L.Y.; Huang, Y.L.; Huang, Z.H.; Lou, Y.L.; Ye, G.; Wong, S.W. Improved coupling analysis on the coordination between socio-economy and carbon emission. Ecol. Ind. 2018, 94, 357–366. [Google Scholar] [CrossRef]
Figure 1. Administrative boundary and patterns of land use of the BTH region.
Sustainability 15 15670 g001
Figure 2. Diagram of the coupling mechanism of LES–HED subsystems.
Sustainability 15 15670 g002
Figure 3. The degree of coupling of the LES–HED subsystems: (a) degree of coupling in the BTH region; (b) degree of coupling in the cities of the BTH.
Sustainability 15 15670 g003
Figure 4. The CCD of the LES–HED subsystems: (a) CCD in the BTH region; (b) CCD in the cities of the BTH.
Sustainability 15 15670 g004
Figure 5. The relationships of coupling coordination in the cities of the BTH.
Sustainability 15 15670 g005aSustainability 15 15670 g005b
Figure 6. Evolution of the curve of the relationship of coupling coordination.
Sustainability 15 15670 g006
Figure 7. Analysis of the impulse response: (a) the response of LES to its own impact; (b) the response of LES to the impact of HED; (c) the response of HED to the impact of LES; (d) the response of HED to its own impact.
Sustainability 15 15670 g007
Figure 8. The types of development in the cities of the BTH.
Sustainability 15 15670 g008
Table 1. System of the LES evaluation index used for the BTH region.
Target
Layer
Criterion
Layer
Factor
Layer
Index LayerDirection *
Land
ecological
security
PressurePopulationD1 Population density (person/km2)
IndustryD2 Proportion of secondary industries (%)
TrafficD3 Highway passenger traffic per unit of land area
(10 thousand/km2)
D4 Road freight per unit of land area (10 thousand ton/km2)
EnvironmentD5 The usage of fertilizer per unit of cultivated area (ton/km2)
D6 Industrial dust emissions per unit of land area (ton/km2)
D7 Industrial wastewater discharge per unit of land area
(10 thousand ton/km2)
StateLand structureD8 Proportion of cultivated land (%)+
D9 Green coverage of urban built-up areas (%)+
Land functionD10 Food production per unit of land area (ton/km2)+
D11 Economic density of the land (10 thousand CNY/km2)+
ResponsePopulationD12 Population growth rate (%)+
IndustryD13 Per capita GDP (10 thousand CNY/person)+
D14 Proportion of tertiary industries (%)+
TrafficD15 Transportation, warehousing, and postal investment per unit of land area (10 thousand CNY/km2)+
EnvironmentD16 Comprehensive utilization rate of industrial solid waste (%)+
* “+” and “−” represent positive and negative indicators, respectively.
Table 2. System of the HED evaluation index used for the BTH region.
Primary IndexSecondary IndexLevel III IndexDirection *
High-quality
economics
development
Innovative developmentC1 Number of patents authorized per 10,000 persons+
C2 Intensity of investment into R & D (%)+
Coordinated developmentC3 Demand structure (%)+
C4 Urban–rural structure (%)
C5 Regional structure (%)+
Green developmentC6 Energy consumption per unit of GDP (%)
C7 Sewage treatment rate (%)+
C8 Rate of harmless treatment of domestic waste (%)+
Open developmentC9 Proportion of foreign investment (%)+
C10 Degree of financial development (%)+
Shared developmentC11 Proportion of workers’ remuneration (%)+
C12 Elasticity of income growth (%)+
C13 Engel coefficient (%)
* “+” and “−” represent positive and negative indicators, respectively.
Table 3. The standards of the stages of coupling.
Degree of Coupling Stages of Coupling
0–0.30Low coupling
0.30–0.50Antagonism
0.50–0.80Running-in
0.80–1.00High coupling
Table 4. The standards of the coupling coordination relationship.
Coupling Coordination DegreeCoupling Coordination Relationship
0.00–0.10Extreme dissonance
0.10–0.20Severe dissonance
0.20–0.30Moderate dissonance
0.30–0.40Mild dissonance
0.40–0.50Near dissonance
0.50–0.60Slight coordination
0.60–0.70Primary coordination
0.70–0.80Intermediate coordination
0.80–0.90Good coordination
0.90–1.00Quality coordination
Table 5. Classification of the standards of the types of development.
Contrasting RelationshipDegree of Relative Development Type of Development
U L > U H E > 0.6 Slightly lagging HED
0.4 < E 0.6 Significantly lagging HED
0 < E 0.4 Severely lagging HED
U L < U H E > 0.6 Slightly lagging LES
0.4 < E 0.6 Significantly lagging LES
0 < E 0.4 Severely lagging LES
U L = U H E = 1 Synchronous development
Table 6. Unit root tests.
VariableResultsIPS HT Conclusion
ln L E S Statistic measurement0.45960.3335Unstable data
p-value0.67710.0596
ln H E D Statistic measurement0.35260.4320Unstable data
p-value0.63780.3502
Dln L E S Statistic measurement−7.0049−0.1701Stable data
p-value0.00000.0000
Dln H E D Statistic measurement−5.0849−0.2352Stable data
p-value0.00000.0000
Table 7. Selection of the optimal lag order.
Lag PeriodAICBICHQIC
1−3.96962 −3.24929 −3.67697
2−3.94210−3.06829−3.58757
3−3.69766−2.64257−3.27090
4−3.56758−2.2943−3.05573
5−2.54992−1.00809−1.93748
Table 8. Cointegration tests.
Test PresuppositionStatistical ResultsStatistical Measurementp-Value
Kao testNo cointegration relationshipModified Dickey–Fuller0.05500.4781
Dickey–Fuller−2.39080.0084
Augmented Dickey-Fuller1.29660.0974
Unadjusted modified Dickey–Fuller−1.49040.0681
Unadjusted Dickey–Fuller−3.39510.0003
Pedroni testModified Phillips–Perron 0.93570.1747
Phillips–Perron −4.09970.0000
Augmented Dickey–Fuller−5.59070.0000
Table 9. Granger causality tests.
PresuppositionF-Statisticp-ValueYes or No
HED is not the Granger reason for LES−0.81530.4149Yes
LES is not the Granger reason for HED2.47680.0133No
Disclaimer/Publisher’s Note: The statements, opinions and data contained in all publications are solely those of the individual author(s) and contributor(s) and not of MDPI and/or the editor(s). MDPI and/or the editor(s) disclaim responsibility for any injury to people or property resulting from any ideas, methods, instructions or products referred to in the content.

