
Measuring the Performance of a Strategic Asset Management Plan through a Balanced Scorecard

 ,
,  ,
,  ,
,  ,
, 
Abstract
:1. Introduction
1.1. Framework
1.2. Methodology and Research Questions
- (a)
- Framing questions for a review
- (i)
- While building an Asset Management System (AMS), is it a core element to measure its performance?
- (ii)
- How can we measure the SAMP performance?
- (iii)
- Since the SAMP is the central figure in the AMS, how can it be measured?
- (b)
- Identifying relevant work
- (i)
- Section 2 provides the literature review.
- (c)
- Assessing the quality of studies
- (i)
- Indexed papers from scientific libraries.
- (d)
- Summarizing the evidence
- (i)
- Using available data to demonstrate the robustness of the proposed model.
- (e)
- Interpreting the findings
- (i)
- The results obtained are discussed and the strongest and weakest aspects of the research are identified.
1.3. Paper Structure
- Section 2 synthesizes the relevant literature on the performance measuring tool of a strategic asset management plan;
- Section 3 presents the scorecard;
- Section 4 presents the performance measuring tool of a strategic asset management plan through a balanced scorecard;
- Section 5 presents a discussion;
- Section 6 offers the conclusions.
2. Literature Review
- Process understanding and the system’s components identification;
- Identification of failure modes or stop causes of each component;
- Reliability, maintainability, and operation data acquisition (Time between Failures (TBF) and Time to Repair (TTR));
- Modeling of the as-is system through Reliability Block Diagram (RBD) logic;
- Simulation (Monte Carlo);
- Technical performance calculation of the system;
- Cost model setting;
- Cost data acquisition;
- Calculation of TCO.
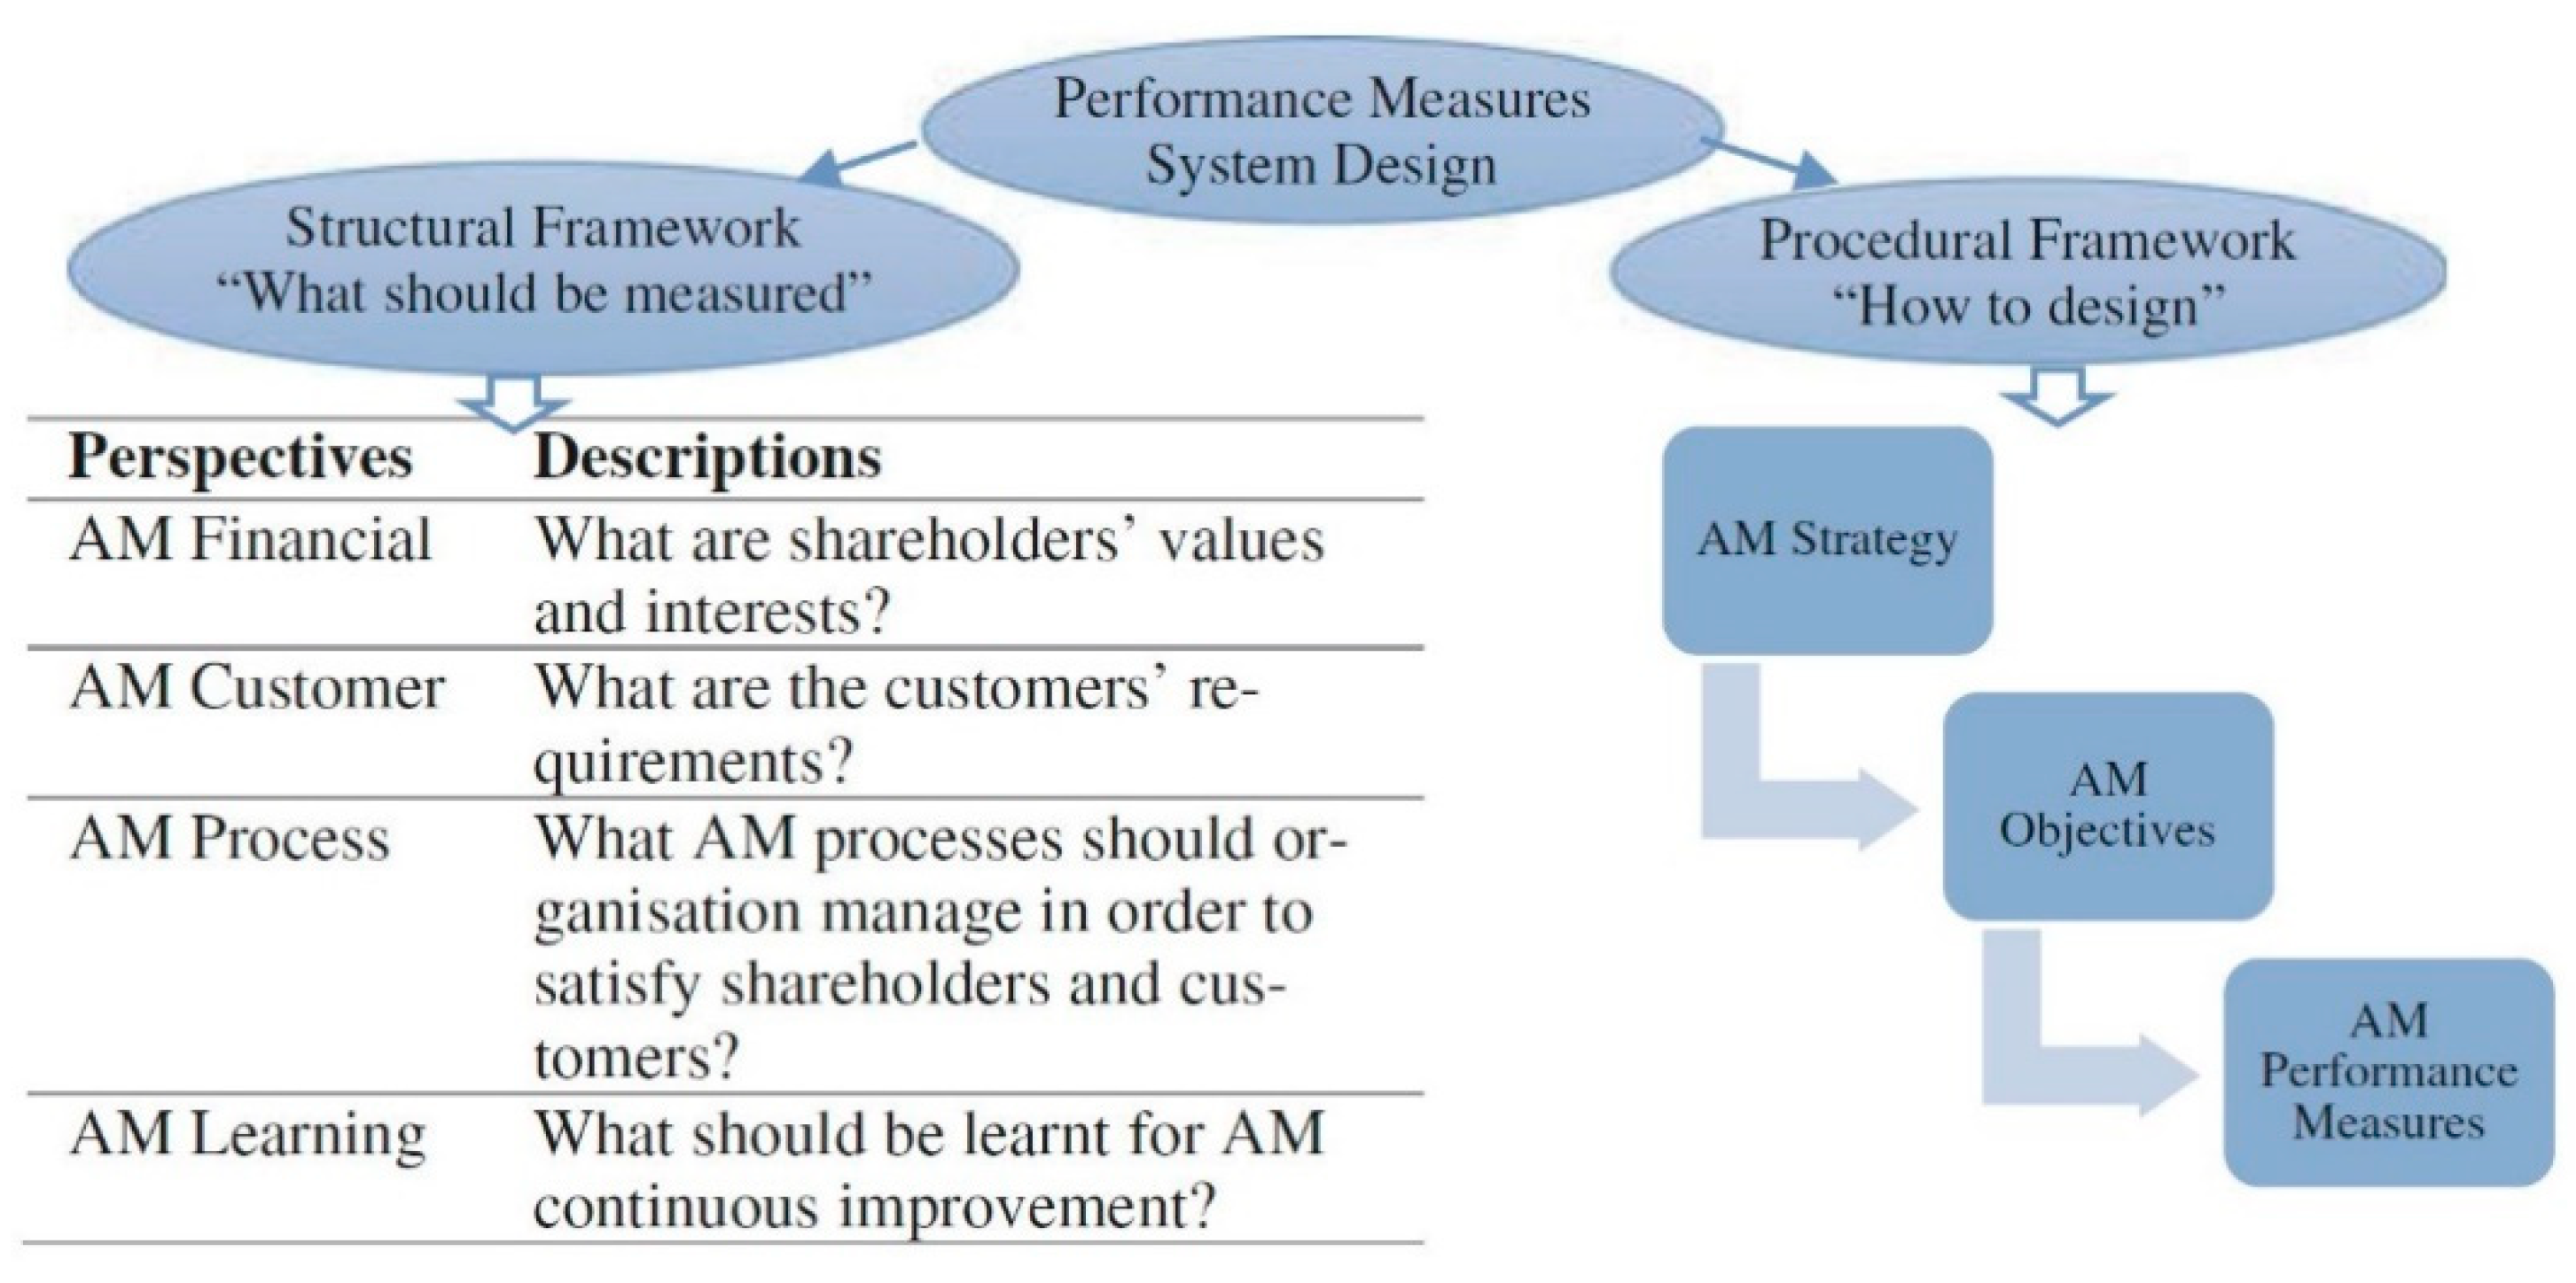
- Develop the AM strategy and identify AM objectives;
- Select performance indicators;
- Test for alignment or line of sight;
- Reflect on the process and outcomes.
- Is it really only about delivering an absolute amount, like the produced volume, the availability of an asset, or staying within budget limits?
- Or is it more about ensuring that the available resources are used in the most effective and efficient way, like driving towards the best value per unit of cost or the lowest cost per unit of production?
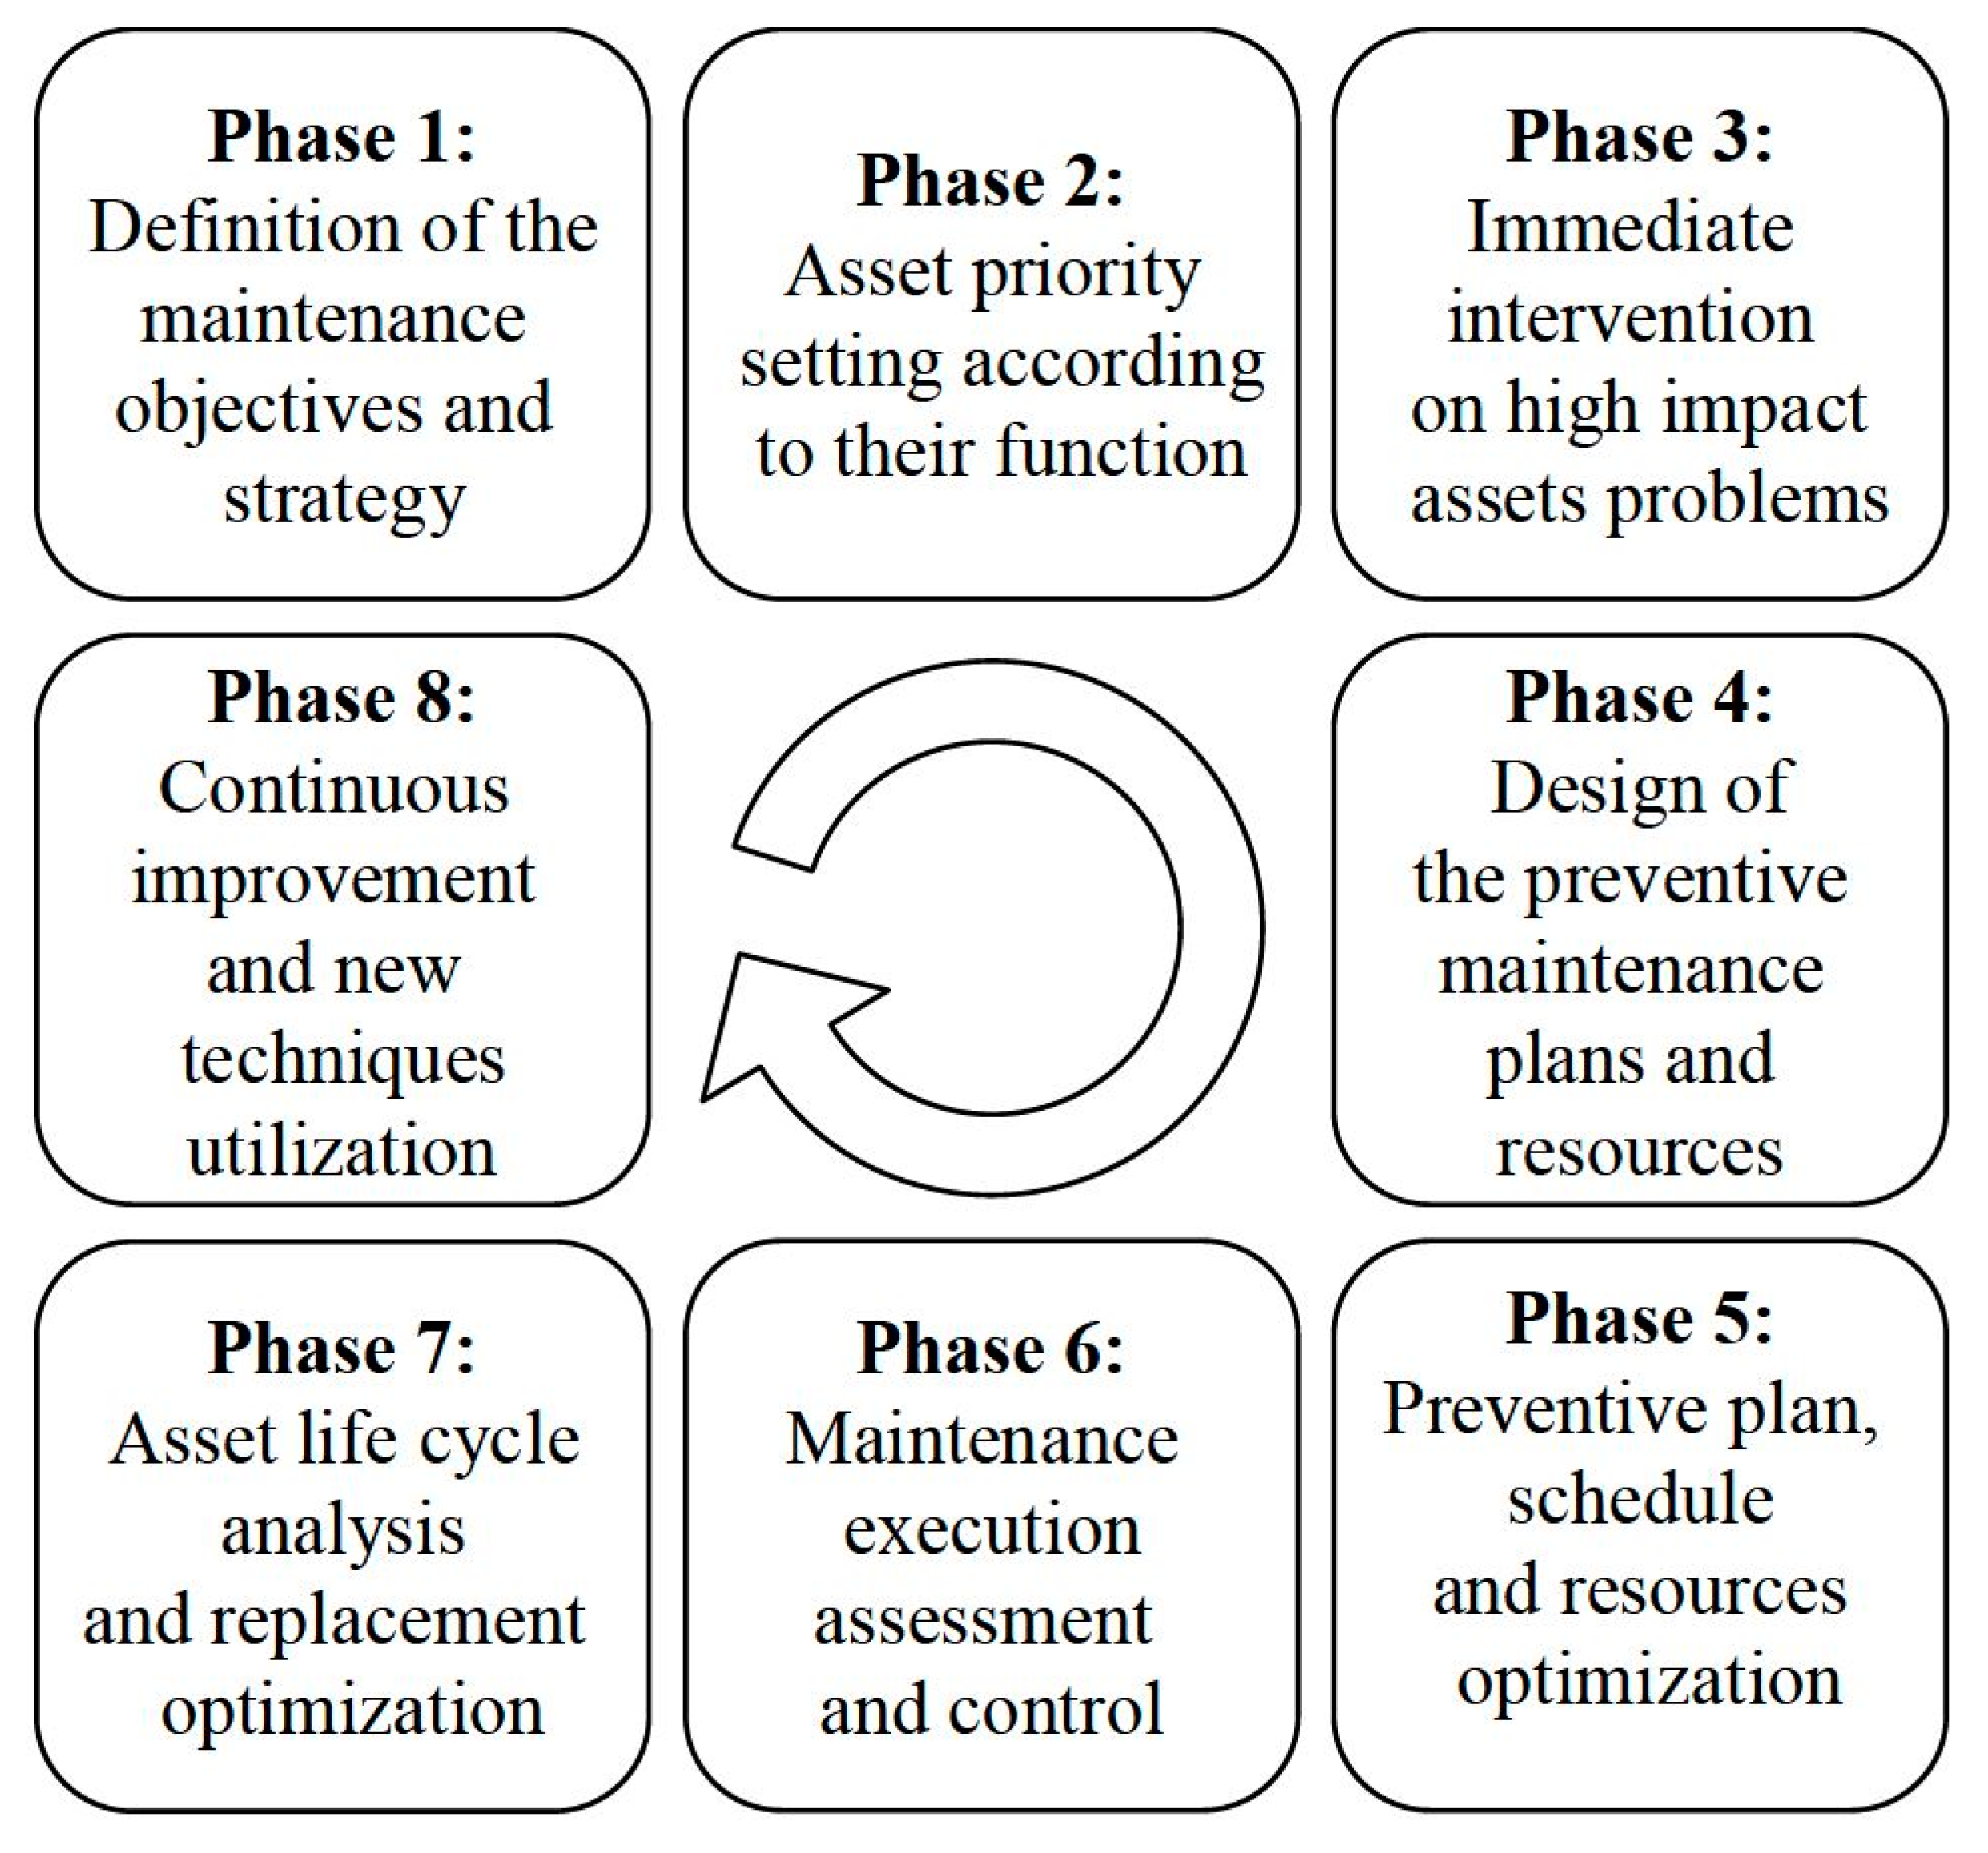
- Definition of the maintenance objectives and KPIs;
- Asset priority and maintenance strategy definition;
- Immediate intervention on high impact weak point;
- Design of the preventive maintenance plans and resources;
- Preventive plan, schedule, and resources optimization;
- Maintenance execution assessment and control;
- Asset life cycle analysis and replacement optimization;
- Continuous improvement and new technologies.
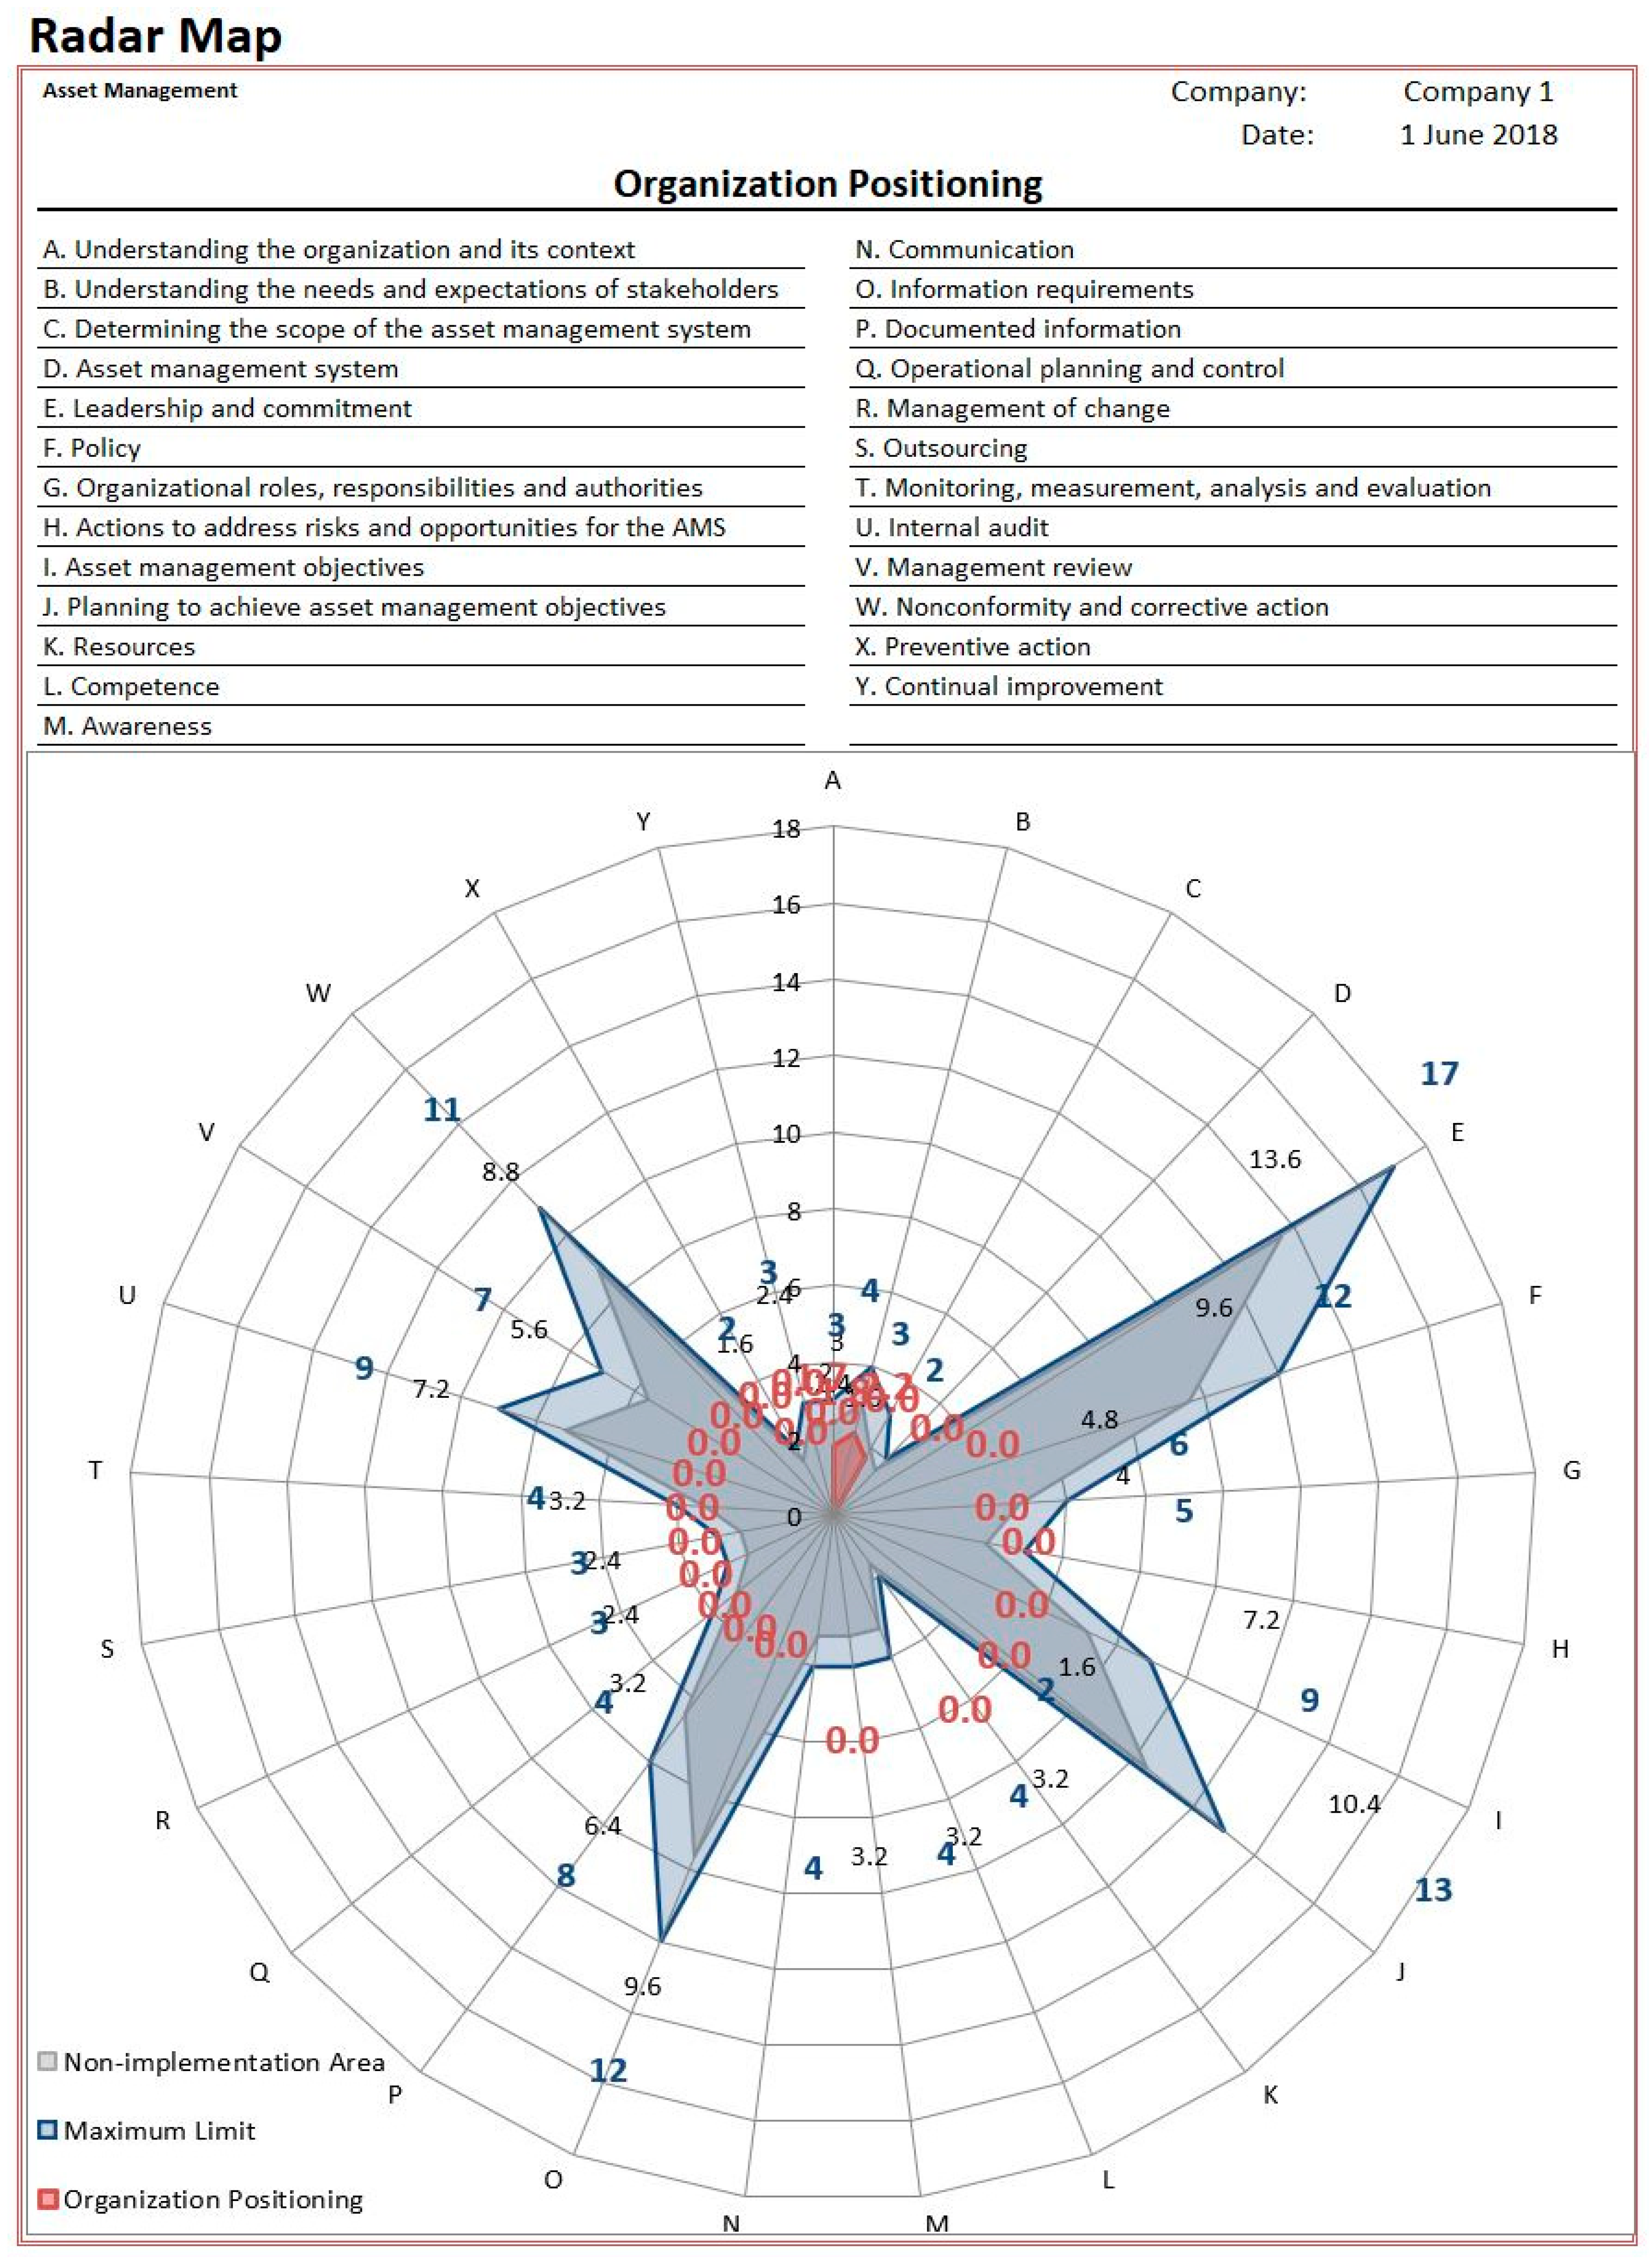
- Context of the organization;
- Leadership;
- Planning;
- Support;
- Operation;
- Performance evaluation;
- Improvement.
- Recommendations for performance measures;
- Recommendations and issues for PM framework and system design.
3. Balanced Scorecard
- Profitability (measured by residual income);
- Market share;
- Productivity;
- Product leadership;
- Public responsibility (legal and ethical behavior and responsibility to stakeholders including shareholders, vendors, dealers, distributors, and communities);
- Personnel development;
- Employee attitudes;
- Balance between short-range and long-range objectives.
- Vision barrier—No one in the organization understands the strategies of the organization;
- People barrier—Most people have objectives that are not linked to the strategy of the organization;
- Resource barrier—Time, energy, and money are not allocated to those things that are critical to the organization. For example, budgets are not linked to strategy, resulting in wasted resources;
- Management barrier—Management spends a small amount of time on strategy and a large amount of time on short-term tactical decision making.
4. Balanced Scorecard in a Strategic Asset Management Plan
5. Discussion
6. Conclusions
Author Contributions
Funding
Institutional Review Board Statement
Informed Consent Statement
Data Availability Statement
Conflicts of Interest
References
- Uva, J.S. ‘6° Inventário Florestal Nacional (IFN6)’, ICNF, Lisbon, Portugal, 2015. Available online: https://www.icnf.pt/api/file/doc/c8cc40b3b7ec8541 (accessed on 1 March 2023).
- Maktav, D.; Erbek, F.S.; Jürgens, C. Remote sensing of urban areas. Int. J. Remote Sens. 2005, 26, 655–659. [Google Scholar] [CrossRef]
- Frolking, S.; Milliman, T.; Seto, K.C.; Friedl, M.A. A global fingerprint of macro-scale changes in urban structure from 1999 to 2009. Environ. Res. Lett. 2013, 8, 024004. [Google Scholar] [CrossRef]
- Seto, K.C.; Fragkias, M.; Güneralp, B.; Reilly, M.K. A Meta-Analysis of Global Urban Land Expansion. PLoS ONE 2011, 6, e23777. [Google Scholar] [CrossRef] [PubMed]
- Liu, Y.; Xu, W.; Hong, Z.; Wang, L.; Ou, G.; Lu, N. Assessment of Spatial-Temporal Changes of Landscape Ecological Risk in Xishuangbanna, China from 1990 to 2019. Sustainability 2022, 14, 10645. [Google Scholar] [CrossRef]
- Lach, D.; Rayner, S.; Ingram, H. Taming the waters: Strategies to domesticate the wicked problems of water resource management. Int. J. Water 2005, 3, 2005. [Google Scholar] [CrossRef]
- Ghaleb, M.; Taghipour, S. Assessing the impact of maintenance practices on asset’s sustainability. Reliab. Eng. Syst. Saf. 2022, 228, 108810. [Google Scholar] [CrossRef]
- Wang, X.; Xu, Z.; Qin, Y.; Skare, M. Innovation, the knowledge economy, and green growth: Is knowledge-intensive growth really environmentally friendly? Energy Econ. 2022, 115, 106331. [Google Scholar] [CrossRef]
- Dastaki, M.S.; Afrazeh, A.; Mahootchi, M. A two-phase decision-making model for product development based on a product-oriented knowledge inventory model. J. Knowl. Manag. 2022, 26, 943–971. [Google Scholar] [CrossRef]
- Hassan, A.M.; Adel, K.; Elhakeem, A.; Elmasry, M.I.S. Condition Prediction for Existing Educational Facilities Using Artificial Neural Networks and Regression Analysis. Buildings 2022, 12, 1520. [Google Scholar] [CrossRef]
- Amaechi, C.V.; Reda, A.; Kgosiemang, I.M.; Ja’e, I.A.; Oyetunji, A.K.; Olukolajo, M.A.; Igwe, I.B. Guidelines on Asset Management of Offshore Facilities for Monitoring, Sustainable Maintenance, and Safety Practices. Sensors 2022, 22, 7270. [Google Scholar] [CrossRef]
- Weerasekara, S.; Lu, Z.; Ozek, B.; Isaacs, J.; Kamarthi, S. Trends in Adopting Industry 4.0 for Asset Life Cycle Management for Sustainability: A Keyword Co-Occurrence Network Review and Analysis. Sustainability 2022, 14, 12233. [Google Scholar] [CrossRef]
- Jamwal, A.; Agrawal, R.; Sharma, M.; Manupati, V.K.; Patidar, A. Industry 4.0 and Sustainable Manufacturing: A Bibliometric Based Review. In Recent Advances in Smart Manufacturing and Materials; Springer: Singapore, 2021; pp. 1–11. [Google Scholar] [CrossRef]
- Kamble, S.S.; Gunasekaran, A.; Gawankar, S.A. Sustainable Industry 4.0 framework: A systematic literature review identifying the current trends and future perspectives. Process Saf. Environ. Prot. 2018, 117, 408–425. [Google Scholar] [CrossRef]
- Deng, Y.; Shi, X. An Accurate, Reproducible and Robust Model to Predict the Rutting of Asphalt Pavement: Neural Networks Coupled with Particle Swarm Optimization. IEEE Trans. Intell. Transp. Syst. 2022, 23, 22063–22072. [Google Scholar] [CrossRef]
- Rodrigues, J.A.; Farinha, J.T.; Mendes, M.; Mateus, R.J.G.; Cardoso, A.J.M. Comparison of Different Features and Neural Networks for Predicting Industrial Paper Press Condition. Energies 2022, 15, 6308. [Google Scholar] [CrossRef]
- Rodrigues, J.A.; Martins, A.; Mendes, M.; Farinha, J.T.; Mateus, R.J.G.; Cardoso, A.J.M. Automatic Risk Assessment for an Industrial Asset Using Unsupervised and Supervised Learning. Energies 2022, 15, 9387. [Google Scholar] [CrossRef]
- Rodrigues, J.A.; Farinha, J.T.; Cardoso, A.M.; Mendes, M.; Mateus, R. Prediction of Sensor Values in Paper Pulp Industry Using Neural Networks. In Proceedings of IncoME-VI and TEPEN 2021; Springer: Berlin/Heidelberg, Germany, 2023; pp. 281–291. [Google Scholar] [CrossRef]
- Martins, A.; Fonseca, I.; Farinha, J.T.; Reis, J.; Cardoso, A.J.M. Maintenance Prediction through Sensing Using Hidden Markov Models—A Case Study. Appl. Sci. 2021, 11, 7685. [Google Scholar] [CrossRef]
- Shen, S.; Chang, R.H.; Kim, K.; Julian, M. Challenges to maintaining disaster relief supply chains in island communities: Disaster preparedness and response in Honolulu, Hawai’i. Nat. Hazards 2022, 114, 1829–1855. [Google Scholar] [CrossRef]
- Shalamzari, M.J.; Zhang, W. Assessing Water Scarcity Using the Water Poverty Index (WPI) in Golestan Province of Iran. Water 2018, 10, 1079. [Google Scholar] [CrossRef]
- Khatibi, S.; Arjjumend, H. Water Crisis in Making in Iran. Grassroots J. Nat. Resour. 2019, 2, 45–54. [Google Scholar] [CrossRef]
- Orimoloye, I.R.; Belle, J.A.; Olusola, A.O.; Busayo, E.T.; Ololade, O.O. Spatial assessment of drought disasters, vulnerability, severity and water shortages: A potential drought disaster mitigation strategy. Nat. Hazards 2021, 105, 2735–2754. [Google Scholar] [CrossRef]
- Procházka, P.; Hönig, V.; Maitah, M.; Pljučarská, I.; Kleindienst, J. Evaluation of Water Scarcity in Selected Countries of the Middle East. Water 2018, 10, 1482. [Google Scholar] [CrossRef]
- Pais, J.E.d.A.; Raposo, H.D.N.; Farinha, J.T.; Cardoso, A.J.M.; Marques, P.A. Optimizing the Life Cycle of Physical Assets through an Integrated Life Cycle Assessment Method. Energies 2021, 14, 6128. [Google Scholar] [CrossRef]
- IPMA. Indice PDSI (Palmer Drought Severity Index). Available online: https://www.ipma.pt/pt/oclima/observatorio.secas/ (accessed on 19 December 2022).
- IPMA. Precipitação Forte na Região Lisboa. Available online: https://www.ipma.pt/pt/media/noticias/documentos/2022/Precipitacao-intensa-lisboa_vrs1.pdf (accessed on 19 December 2022).
- Szwagrzyk, M.; Kaim, D.; Price, B.; Wypych, A.; Grabska, E.; Kozak, J. Impact of forecasted land use changes on flood risk in the Polish Carpathians. Nat. Hazards 2018, 94, 227–240. [Google Scholar] [CrossRef]
- Paul, G.C.; Saha, S.; Hembram, T.K. Application of the GIS-Based Probabilistic Models for Mapping the Flood Susceptibility in Bansloi Sub-basin of Ganga-Bhagirathi River and Their Comparison. Remote Sens. Earth Syst. Sci. 2019, 2, 120–146. [Google Scholar] [CrossRef]
- Saha, S.; Gayen, A.; Bayen, B. Deep learning algorithms to develop Flood susceptibility map in Data-Scarce and Ungauged River Basin in India. Stoch. Environ. Res. Risk Assess. 2022, 36, 3295–3310. [Google Scholar] [CrossRef]
- Tehrany, M.S.; Pradhan, B.; Jebur, M.N. Flood susceptibility analysis and its verification using a novel ensemble support vector machine and frequency ratio method. Stoch. Environ. Res. Risk Assess. 2015, 29, 1149–1165. [Google Scholar] [CrossRef]
- Arabameri, A.; Saha, S.; Chen, W.; Roy, J.; Pradhan, B.; Bui, D.T. Flash flood susceptibility modelling using functional tree and hybrid ensemble techniques. J. Hydrol. 2020, 587, 125007. [Google Scholar] [CrossRef]
- Kanani-Sadat, Y.; Arabsheibani, R.; Karimipour, F.; Nasseri, M. A new approach to flood susceptibility assessment in data-scarce and ungauged regions based on GIS-based hybrid multi criteria decision-making method. J. Hydrol. 2019, 572, 17–31. [Google Scholar] [CrossRef]
- Krautkraemer, J.A. Economics of Natural Resource Scarcity: The State of the Debate; Resources for the Future: Washington, DC, USA, 2005. [Google Scholar] [CrossRef]
- Neumayer, E. Scarce or Abundant? The Economics of Natural Resource Availability. J. Econ. Surv. 2002, 14, 307–335. [Google Scholar] [CrossRef]
- Mok, W.K.; Tan, Y.X.; Chen, W.N. Technology innovations for food security in Singapore: A case study of future food systems for an increasingly natural resource-scarce world. Trends Food Sci. Technol. 2020, 102, 155–168. [Google Scholar] [CrossRef]
- Hall, D.C.; Hall, J.V. Concepts and measures of natural resource scarcity with a summary of recent trends. J. Environ. Econ. Manag. 1984, 11, 363–379. [Google Scholar] [CrossRef]
- Smith, V.K. Natural Resource Scarcity: A Statistical Analysis. Rev. Econ. Stat. 1979, 61, 423. [Google Scholar] [CrossRef]
- Afgan, N.H.; Al Gobaisi, D.; Carvalho, M.G.; Cumo, M. Sustainable energy development. Renew. Sustain. Energy Rev. 1998, 2, 235–286. [Google Scholar] [CrossRef]
- Root, T.L.; Price, J.T.; Hall, K.R.; Schneider, S.H.; Rosenzweig, C.; Pounds, J.A. Fingerprints of global warming on wild animals and plants. Nature 2003, 421, 57–60. [Google Scholar] [CrossRef] [PubMed]
- Dasgupta, P.; Heal, G. The Optimal Depletion of Exhaustible Resources. Rev. Econ. Stud. 1974, 41, 3. [Google Scholar] [CrossRef]
- Desing, H.; Widmer, R.; Beloin-Saint-Pierre, D.; Hischier, R.; Wäger, P. Powering a Sustainable and Circular Economy—An Engineering Approach to Estimating Renewable Energy Potentials within Earth System Boundaries. Energies 2019, 12, 4723. [Google Scholar] [CrossRef]
- Subhoni, M.; Kholmurodov, K.; Doroshkevich, A.; Asgerov, E.; Yamamoto, T.; Lyubchyk, A.; Almasan, V.; Madadzada, A. Density functional theory calculations of the water interactions with ZrO2 nanoparticles Y2O3 doped. J. Phys. Conf. Ser. 2018, 994, 012013. [Google Scholar] [CrossRef]
- Coutinho, M.L.; Miller, A.Z.; Rogerio-Candelera, M.A.; Mirão, J.; Alves, L.C.; Veiga, J.P.; Águas, H.; Pereira, S.; Lyubchyk, A.; Macedo, M.F. An integrated approach for assessing the bioreceptivity of glazed tiles to phototrophic microorganisms. Biofouling 2016, 32, 243–259. [Google Scholar] [CrossRef]
- Makarova, T.; Zakharchuk, I.; Geydt, P.; Lahderanta, E.; Komlev, A.; Zyrianova, A.; Lyubchyk, A.; Kanygin, M.; Sedelnikova, O.; Kurenya, A.; et al. Assessing carbon nanotube arrangement in polystyrene matrix by magnetic susceptibility measurements. Carbon 2016, 96, 1077–1083. [Google Scholar] [CrossRef]
- Zhang, Y.; Dilanchiev, A. Economic recovery, industrial structure and natural resource utilization efficiency in China: Effect on green economic recovery. Resour. Policy 2022, 79, 102958. [Google Scholar] [CrossRef]
- Padilla-Lozano, C.P.; Collazzo, P. Corporate social responsibility, green innovation and competitiveness—Causality in manufacturing. Compet. Rev. Int. Bus. J. 2022, 32, 21–39. [Google Scholar] [CrossRef]
- Digalwar, A.K.; Saraswat, S.; Rastogi, A.; Thomas, R.G. A comprehensive framework for analysis and evaluation of factors responsible for sustainable growth of electric vehicles in India. J. Clean. Prod. 2022, 378, 134601. [Google Scholar] [CrossRef]
- Saleem, H.; Khosravi, M.; Maroufi, S.; Sahajwalla, V.; O’Mullane, A.P. Repurposing metal containing wastes and mass-produced materials as electrocatalysts for water electrolysis. Sustain. Energy Fuels 2022, 6, 4829–4844. [Google Scholar] [CrossRef]
- Shylo, A.; Doroshkevich, A.; Lyubchyk, A.; Bacherikov, Y.; Balasoiu, M.; Konstantinova, T. Electrophysical properties of hydrated porous dispersed system based on zirconia nanopowders. Appl. Nanosci. 2020, 10, 4395–4402. [Google Scholar] [CrossRef]
- Liyanage, J.P.; Badurdeen, F.; Ratnayake, R.C. Industrial Asset Maintenance and Sustainability Performance: Economical, Environmental, and Societal Implications. In Handbook of Maintenance Management and Engineering; Springer: London, UK, 2009; pp. 665–693. [Google Scholar] [CrossRef]
- WCED. Report of the World Commission on Environment and Development: Our Common Future Acronyms and Note on Terminology Chairman’ s Foreword. In Report of the World Commission on Environment and Development: Our Common Future; WCED: Cape Town, South Africa, 1987. [Google Scholar]
- Stahel, W.R. The circular economy. Nature 2016, 531, 435–438. [Google Scholar] [CrossRef] [PubMed]
- Pais, J.E.A. ISO 55001; Diagnosis of the Organization’s State. IPC—ISEC—Instituto Superior de Engenharia de Coimbra: Coimbra, Portugal, 2019. Available online: http://hdl.handle.net/10400.26/40250 (accessed on 5 July 2023).
- Halkos, G.; Petrou, K.N. Analysing the Energy Efficiency of EU Member States: The Potential of Energy Recovery from Waste in the Circular Economy. Energies 2019, 12, 3718. [Google Scholar] [CrossRef]
- Zink, T.; Geyer, R. Circular Economy Rebound. J. Ind. Ecol. 2017, 21, 593–602. [Google Scholar] [CrossRef]
- Prieto-Sandoval, V.; Jaca, C.; Ormazabal, M. Towards a consensus on the circular economy. J. Clean. Prod. 2018, 179, 605–615. [Google Scholar] [CrossRef]
- Rajput, S.; Singh, S.P. Connecting Circular Economy and Industry 4.0. Int. J. Inf. Manag. 2019, 49, 98–113. [Google Scholar] [CrossRef]
- Kirchherr, J.; Reike, D.; Hekkert, M. Conceptualizing the circular economy: An analysis of 114 definitions. Resour. Conserv. Recycl. 2017, 127, 221–232. [Google Scholar] [CrossRef]
- Dutt, N.; King, A.A. The Judgment of Garbage: End-of-Pipe Treatment and Waste Reduction. Manag. Sci. 2014, 60, 1812–1828. [Google Scholar] [CrossRef]
- Rokicki, T.; Perkowska, A.; Klepacki, B.; Szczepaniuk, H.; Szczepaniuk, E.K.; Bereziński, S.; Ziółkowska, P. The Importance of Higher Education in the EU Countries in Achieving the Objectives of the Circular Economy in the Energy Sector. Energies 2020, 13, 4407. [Google Scholar] [CrossRef]
- Henriques, J.D.; Azevedo, J.; Dias, R.; Estrela, M.; Ascenço, C.; Vladimirova, D.; Miller, K. Implementing Industrial Symbiosis Incentives: An Applied Assessment Framework for Risk Mitigation. Circ. Econ. Sustain. 2022, 2, 669–692. [Google Scholar] [CrossRef]
- Henriques, J.; Ferrão, P.; Iten, M. Policies and Strategic Incentives for Circular Economy and Industrial Symbiosis in Portugal: A Future Perspective. Sustainability 2022, 14, 6888. [Google Scholar] [CrossRef]
- Henriques, J.; Ferrão, P.; Castro, R.; Azevedo, J. Industrial Symbiosis: A Sectoral Analysis on Enablers and Barriers. Sustainability 2021, 13, 1723. [Google Scholar] [CrossRef]
- Danilenko, I.; Gorban, O.; Shylo, A.; Volkova, G.; Yaremov, P.; Konstantinova, T.; Doroshkevych, O.; Lyubchyk, A. Humidity to electricity converter based on oxide nanoparticles. J. Mater. Sci. 2022, 57, 8367–8380. [Google Scholar] [CrossRef]
- Shylo, A.; Danilenko, I.; Gorban, O.; Doroshkevich, O.; Nosolev, I.; Konstantinova, T.; Lyubchyk, A. Hydrated zirconia nanoparticles as media for electrical charge accumulation. J. Nanopart. Res. 2022, 24, 18. [Google Scholar] [CrossRef]
- Akhkozov, L.; Danilenko, I.; Podhurska, V.; Shylo, A.; Vasyliv, B.; Ostash, O.; Lyubchyk, A. Zirconia-based materials in alternative energy devices—A strategy for improving material properties by optimizing the characteristics of initial powders. Int. J. Hydrogen Energy 2022, 47, 41359–41371. [Google Scholar] [CrossRef]
- Lyubchyk, A.; Filonovich, S.A.; Mateus, T.; Mendes, M.J.; Vicente, A.; Leitão, J.P.; Falcão, B.P.; Fortunato, E.; Águas, H.; Martins, R. Nanocrystalline thin film silicon solar cells: A deeper look into p/i interface formation. Thin Solid Films 2015, 591, 25–31. [Google Scholar] [CrossRef]
- Doroshkevich, A.S.; Asgerov, E.B.; Shylo, A.V.; Lyubchyk, A.I.; Logunov, A.I.; Glazunova, V.A.; Islamov, A.K.; Turchenko, V.A.; Almasan, V.; Lazar, D.; et al. Direct conversion of the water adsorption energy to electricity on the surface of zirconia nanoparticles. Appl. Nanosci. 2019, 9, 1603–1609. [Google Scholar] [CrossRef]
- Doroshkevich, A.S.; Lyubchyk, A.I.; Shilo, A.V.; Zelenyak, T.Y.; Glazunova, V.A.; Burhovetskiy, V.V.; Saprykina, A.V.; Holmurodov, K.T.; Nosolev, I.K.; Doroshkevich, V.S.; et al. Chemical-electric energy conversion effect in zirconia nanopowder systems. J. Surf. Investig. X-ray Synchrotron Neutron Tech. 2017, 11, 523–529. [Google Scholar] [CrossRef]
- Sarmas, E.; Marinakis, V.; Doukas, H. A data-driven multicriteria decision making tool for assessing investments in energy efficiency. Oper. Res. 2022, 22, 5597–5616. [Google Scholar] [CrossRef]
- Liu, H.; Khan, I.; Zakari, A.; Alharthi, M. Roles of trilemma in the world energy sector and transition towards sustainable energy: A study of economic growth and the environment. Energy Policy 2022, 170, 113238. [Google Scholar] [CrossRef]
- Department of Economic and Social Affairs—United Nations. World Population Prospects 2022. Available online: https://population.un.org/wpp/ (accessed on 21 December 2022).
- BP. Statistical Review of World Energy. Available online: https://www.bp.com/en/global/corporate/energy-economics/statistical-review-of-world-energy.html (accessed on 21 December 2022).
- Khan, I.; Zakari, A.; Dagar, V.; Singh, S. World energy trilemma and transformative energy developments as determinants of economic growth amid environmental sustainability. Energy Econ. 2022, 108, 105884. [Google Scholar] [CrossRef]
- Luciani, G. The Impacts of the Energy Transition on Growth and Income Distribution. In The Geopolitics of the Global Energy Transition; Springer: Berlin/Heidelberg, Germany, 2020; pp. 305–318. [Google Scholar] [CrossRef]
- Sinha, A.; Mishra, S.; Sharif, A.; Yarovaya, L. Does green financing help to improve environmental & social responsibility? Designing SDG framework through advanced quantile modelling. J. Environ. Manag. 2021, 292, 112751. [Google Scholar] [CrossRef]
- Chakraborty, D.; Mukherjee, S. The Relationship between Trade, Investment and Environment. Foreign Trade Rev. 2010, 45, 3–37. [Google Scholar] [CrossRef]
- Li, W.; Elheddad, M.; Doytch, N. The impact of innovation on environmental quality: Evidence for the non-linear relationship of patents and CO2 emissions in China. J. Environ. Manag. 2021, 292, 112781. [Google Scholar] [CrossRef] [PubMed]
- ISO 55002:2018; Asset Management—Management Systems—Guidelines for the Application of ISO 55001. ISO: Geneva, Switzerland, 2018.
- Mateus, B.; Mendes, M.; Farinha, J.T.; Martins, A.B.; Cardoso, A.M. Data Analysis for Predictive Maintenance Using Time Series and Deep Learning Models—A Case Study in a Pulp Paper Industry. In Proceedings of IncoME-VI and TEPEN 2021; Springer: Berlin/Heidelberg, Germany, 2023; pp. 11–25. [Google Scholar] [CrossRef]
- Khan, K.S.; Kunz, R.; Kleijnen, J.; Antes, G. Five steps to conducting a systematic review. J. R. Soc. Med. 2003, 96, 118–121. [Google Scholar] [CrossRef]
- De-Almeida-e-Pais, J.E.; Cardoso, A.J.M.; Farinha, J.T.; Raposo, H. ISO 55001—A Proposal for a Strategic Asset Management Plan. In Proceedings of the M2D2022—9th International Conference on Mechanics and Materials in Design, Funchal, Portugal, 26–30 June 2022; Silva, J.F., Meguid, S.A., Eds.; Universidade do Porto: Porto, Portugal, 2022; pp. 577–590. [Google Scholar]
- Pais, E.; Farinha, J.T.; Cardoso, A.J.M.; Raposo, H. Optimizing the Life Cycle of Physical Assets—A Review. WSEAS Trans. Syst. Control 2020, 15, 417–430. [Google Scholar] [CrossRef]
- Raposo, H.; Farinha, J.T.; Pais, E.; Galar, D. An Integrated Model for Dimensioning the Reserve Fleet based on the Maintenance Policy. WSEAS Trans. Syst. Control 2021, 16, 43–65. [Google Scholar] [CrossRef]
- Arthur, D.; Schoenmaker, R.; Hodkiewicz, M.; Muruvan, S. Asset Planning Performance Measurement. In Proceedings of the 10th World Congress on Engineering Asset Management (WCEAM 2015), Tampere, Finland, 28–30 September 2016; pp. 79–95. [Google Scholar] [CrossRef]
- Roda, I.; Garetti, M. Application of a Performance-driven Total Cost of Ownership (TCO) Evaluation Model for Physical Asset Management. In 9th WCEAM Research Papers, Proceedings of 2014 World Congress on Engineering Asset Management, Pretoria, South Africa, 28–31 October 2014; Springer International Publishing: Cham, Switzerland, 2015; Volume 1, pp. 11–23. [Google Scholar] [CrossRef]
- Simões, J.; Gomes, C.; Yasin, M. A literature review of maintenance performance measurement. J. Qual. Maint. Eng. 2011, 17, 116–137. [Google Scholar] [CrossRef]
- Wang, J.; Chen, Z.; Parlikad, A. Designing Performance Measures for Asset Management Systems in Asset-Intensive Manufacturing Companies: A Case Study. In Proceedings of the 10th World Congress on Engineering Asset Management (WCEAM 2015), Tampere, Finland, 28–30 September 2016; Koskinen, K.T., Kortelainen, H., Aaltonen, J., Uusitalo, T., Komonen, K., Mathew, J., Laitinen, J., Eds.; Springer International Publishing: Berlin/Heidelberg, Germany, 2016; pp. 655–662. [Google Scholar] [CrossRef]
- Abdul-Nour, G.; Gauthier, F.; Diallo, I.; Komljenovic, D.; Vaillancourt, R.; Côté, A. Development of a Resilience Management Framework Adapted to Complex Asset Systems: Hydro-Québec Research Chair on Asset Management. In Lecture Notes in Mechanical Engineering; Springer: Berlin/Heidelberg, Germany, 2021; pp. 126–136. [Google Scholar] [CrossRef]
- Kumar, U.; Galar, D.; Parida, A.; Stenström, C.; Berges, L. Maintenance performance metrics: A state-of-the-art review. J. Qual. Maint. Eng. 2013, 19, 233–277. [Google Scholar] [CrossRef]
- Maletič, D.; Maletič, M.; Al-Najjar, B.; Gomišček, B. The role of maintenance in improving company’s competitiveness and profitability. J. Manuf. Technol. Manag. 2014, 25, 441–456. [Google Scholar] [CrossRef]
- Wijnia, Y. Pragmatic Performance Management: Aligning Objectives across Different Asset Portfolios. In Lecture Notes in Mechanical Engineering; Springer: Berlin/Heidelberg, Germany, 2022; pp. 163–172. [Google Scholar] [CrossRef]
- Márquez, A.C. The Maintenance Management Framework; Springer Series in Reliability Engineering; Springer: London, UK, 2007. [Google Scholar] [CrossRef]
- Parra, C.; Viveros, P.; Kristjanpoller, F.; Marquez, A.C. Técnicas de Auditoría para los Procesos de: Mantenimiento, Fiabilidad Operacional y Gestión de Activos (AMORMS & AMS-ISO 55001); Universidad de Sevilla: Sevilla, Spain; Universidad Técnica Federico Santa María: Valparaíso, Chile, 2021. [Google Scholar]
- Duque, P.; Parra, C.; Pizarro, F.; Aránguiz, A.; Vega, E. Audit models for asset management, maintenance and reliability processes: A case study applied to the copper mining sector. In 16th WCEAM Research Papers; Springer International Publishing: Cham, Switzerland, 2022. [Google Scholar]
- Folan, P.; Browne, J. A review of performance measurement: Towards performance management. Comput. Ind. 2005, 56, 663–680. [Google Scholar] [CrossRef]
- Kaplan, R.S.; Norton, D.P. The Balanced Scorecard: Measures that Drive Performance; Harvard Business Publishing: Brighton, MA, USA, 1992; pp. 71–79. [Google Scholar]
- Kaplan, R.S. Conceptual Foundations of the Balanced Scorecard. In Handbook of Management Accounting Research; Chapman, C., Hopwood, A., Shields, M.D., Eds.; Elsevier Ltd.: Amsterdam, The Netherlands, 2009; pp. 1253–1269. [Google Scholar] [CrossRef]
- Lewis, R.W. Measuring, reporting and appraising results of operations with reference to goals, plans and budgets. In Planning, Managing and Measuring the Business: A Case Study of Management Planning and Control at General Electric Company; Controllership Foundation: New York, NY, USA, 1955. [Google Scholar]
- Drucker, P. The Practice of Management; HarperCollins: New York, NY, USA, 1954. [Google Scholar]
- Simon, H.A. A Framework for Decision Making. In Proceedings of a Symposium on Decision Theory; College of Business Administration, Ohio University: Athens, OH, USA, 1963; pp. 1–9, 22–28. [Google Scholar]
- Simon, H.; Guetzkow, H.; Kozmetsky, G.; Tyndall, G. Centralization vs. Decentralization in Organizing the Controller’s Department; Controllership Foundation Scholars Book Co.: New York, NY, USA, 1954. [Google Scholar]
- Vaszkun, B.; Tsutsui, W.M. A modern history of Japanese management thought. J. Manag. Hist. 2012, 18, 368–385. [Google Scholar] [CrossRef]
- Punniyamoorthy, M.; Murali, R. Balanced score for the balanced scorecard: A benchmarking tool. Benchmarking Int. J. 2008, 15, 420–443. [Google Scholar] [CrossRef]
- Scopus. Balanced Scorecard Research. Available online: https://www.scopus.com/ (accessed on 23 December 2022).
- Nørreklit, H. The Balanced Scorecard: What is the score? A rhetorical analysis of the Balanced Scorecard. Account. Organ. Soc. 2003, 28, 591–619. [Google Scholar] [CrossRef]
- Silk, S. Automating the Balanced Scorecard. Manag. Account. 1998, 79, 38–44. [Google Scholar]
- Anand, M.; Sahay, B.S.; Saha, S. Balanced Scorecard in Indian Companies. Vikalpa J. Decis. Mak. 2005, 30, 11–26. [Google Scholar] [CrossRef]
- Johanson, U.; Skoog, M.; Backlund, A.; Almqvist, R. Balancing dilemmas of the balanced scorecard. Account. Audit. Account. J. 2006, 19, 842–857. [Google Scholar] [CrossRef]
- Pink, G.H.; McKillop, I.; Schraa, E.G.; Preyra, C.; Montgomery, C.; Baker, G.R. Creating a balanced scorecard for a hospital system. J. Health Care Financ. 2001, 27, 1–20. [Google Scholar]
- Ahn, H. Applying the Balanced Scorecard Concept: An Experience Report. Long Range Plan. 2001, 34, 441–461. [Google Scholar] [CrossRef]
- Aidemark, L.-G. The Meaning of Balanced Scorecards in the Health Care Organisation. Financ. Account. Manag. 2001, 17, 23–40. [Google Scholar] [CrossRef]
- Karathanos, D.; Karathanos, P. Applying the Balanced Scorecard to Education. J. Educ. Bus. 2005, 80, 222–230. [Google Scholar] [CrossRef]
- Cullen, J.; Joyce, J.; Hassall, T.; Broadbent, M. Quality in higher education: From monitoring to management. Qual. Assur. Educ. 2003, 11, 5–14. [Google Scholar] [CrossRef]
- O’Neil, H.F.; Bensimon, E.M.; Diamond, M.A.; Moore, M.R. Designing and Implementing an Academic Scorecard. Chang. Mag. High. Learn. 1999, 31, 32–40. [Google Scholar] [CrossRef]
- Walter, F.; Gasparetto, V.; Neto, F.J.K. The Building of the Balanced Scorecard for Academical Environments: Application in a German Academic Unit the Building of the Balanced Scorecard for Academical Environments: Application in a German Academic Unit. In Proceedings of the VIII Congresso Brasileiro de Custos, São Leopoldo, RS, Brazil, 2–4 August 2001. [Google Scholar]
- Beard, D.F. Successful Applications of the Balanced Scorecard in Higher Education. J. Educ. Bus. 2009, 84, 275–282. [Google Scholar] [CrossRef]
- Kiriri, P.N. Management of Performance in Higher Education Institutions: The Application of the Balanced Scorecard (BSC). Eur. J. Educ. 2022, 5, 141–154. [Google Scholar] [CrossRef]
- Sharaf-Addin, H.H.; Fazel, H. Balanced Scorecard Development as a Performance Management System in Saudi Public Universities: A Case Study Approach. Asia-Pac. J. Manag. Res. Innov. 2021, 17, 57–70. [Google Scholar] [CrossRef]
- Stewart, J.; Carpenter-Hubin, A.C. The balanced scorecard. Plan. High. Educ. 2001, 29, 37–42. [Google Scholar]
- Hatcher, W.; Sivorn, J.; Arrowsmith, R.; Whittlestone, A. A service framework for highway asset management. In Proceedings of the IET & IAM Asset Management Conference, London, UK, 27–28 November 2012; p. 91. [Google Scholar] [CrossRef]
- Mizusawa, D.; McNeil, S. Trinitiy in transportation planning: Strategic planning, asset management, and performance measures. In Proceedings of the Annual Conference—Canadian Society for Civil Engineering, Toronto, ON, Canada, 2–4 June 2005. [Google Scholar]
- Posavljak, M.; Tighe, S.L.; Godin, J.W. Strategic Total Highway Asset Management Integration. Transp. Res. Rec. J. Transp. Res. Board 2013, 2354, 107–114. [Google Scholar] [CrossRef]
- Márquez, A.C.; Márquez, C.P.; Fernández, J.F.G.; Campos, M.L.; Díaz, V.G.-P. Life cycle cost analysis. In Asset Management: The State of the Art in Europe from a Life Cycle Perspective; Van der Lei, T., Herder, P., Wijnia, Y., Eds.; Springer: Dordrecht, The Netherlands, 2012; Volume 9789400727, pp. 81–99. [Google Scholar] [CrossRef]
- Duffuaa, S.O. Mathematical Models in Maintenance Planning and Scheduling. In Maintenance, Modeling and Optimization; Springer: Boston, MA, USA, 2000; pp. 39–53. [Google Scholar] [CrossRef]

| KPI | Description | Groundings |
|---|---|---|
| ROI | Return On Investment | Measures the return on investment |
| EPS | Earnings per Share | Presents the profit increase |
| RG | Revenue Growth | Presents the revenue increase |
| NPS | Net Promoter Score | Measures customer experience |
| RPR | Repeat Purchase Rate | Measures the customers retention |
| RC | Revenue Concentration | Measures the revenue generated from the highest paying client |
| CSAT | Customer Satisfaction Score | Measures the happiness of the costumer with a product or service |
| QCR | Quality Control Rate | Measures the product/service quality |
| IQI | Inventory Quality Index | Measures the inventory quality |
| PLTF | Product Lead Time Forecast | Measures the time it takes to create a product and deliver it to a consumer |
| ESR | Employee Skills Rate | Measures the skills that employees have |
| ETR | Employee Training Rate | Measures the training that employees have |
| ERR | Employee Retention Rate | Measures the retention on employees |
| ESI | Employee Satisfaction Index | Measures the employees satisfaction |
| Perspectives | Questions | Measurements | Physical Assets Intervention | ISO 55001 Requirements | KPI |
|---|---|---|---|---|---|
| Financial Perspective | How to reduce costs? | Revenue, Expenses, ROI, Net Income | Maintenance policies; Availability vs. Production | 6.2.1; 6.2.2 | ROI, EPS, RG |
| How to increase profitability? | |||||
| How to increase revenue? | |||||
| Customer Perspective | What are the customer’s needs? | Customer Satisfaction, Customer Retention | Quality level related to Physical Assets performance | 4.1; 4.3; 5.3 | NPS, RPR, RC, CSAT |
| What stakeholders expect? | |||||
| What the interested parties expect? | |||||
| Internal Business Process Perspective | What are my assets? | Inventory, Quality Control, Product Lead Time | Physical Assets Life Cycle vs. SAMP | 4.4; 5.3; 6.2.1; 6.2.2 | IQI, QCR, PLTF |
| What is the value of my assets? | |||||
| My assets are in line with the organization’s objectives? | |||||
| What assets will I focus on? | |||||
| How to extend the life cycle of the assets? | |||||
| What are the non-core assets for the organization? | |||||
| What new assets are needed? | |||||
| How to dispose of old assets? | |||||
| How to manage risk? | |||||
| Innovation Learning and Growth Perspective | Increase availability | Employee Skills, Employee Training, Employee Retention, Employee Satisfaction | Maintenance policies vs. TPM | 6.2.1; 6.2.2 | ESR, ETR, ERR, ESI |
| Improve reliability |
| KPI | Data |
|---|---|
| ROI | Current Value of Investment |
| Cost of Investment | |
| EPS | Net Income—Preferred Dividends |
| End-of-Period Common Shares Outstanding | |
| RG | Initial Revenue |
| Final Revenue | |
| NPS | Percentage of Promoters—Percentage of Detractors |
| RPR | Number of customers who made a repeat purchase |
| Number of customers | |
| RC | Amount of revenue that your business earned from the best customer |
| Amount by your business’s total revenue | |
| CSAT | Number of satisfied customers |
| Total customers asked | |
| QCR | Number of good products produced |
| Total of product produced | |
| IQI | Number of assets correctly inventoried |
| Total of assets | |
| PLTF | Estimated total time |
| Real total time | |
| ESR | Number of employees with skills to their work |
| Total number of employees | |
| ETR | Number of hours in training |
| Number of hours planned for training | |
| ERR | Total of new employees retained |
| Total of new employees | |
| ESI | (How satisfied are you with your job + How well does your job meet your expectations + How close is your workplace to your ideal job)/3 |
| KPI | Data | Value | KPI Value | Unit |
|---|---|---|---|---|
| ROI | Current Value of Investment | 22.36 | 11.78 | % |
| Cost of Investment | 20.00 | |||
| EPS | Net Income—Preferred Dividends | 106.05–0.43 | 7.04 | € |
| End-of-Period Common Shares Outstanding | 15 | |||
| RG | Initial Revenue | 5.36 | 17.91 | % |
| Final Revenue | 6.32 | |||
| NPS | Percentage of Promoters—Percentage of Detractors | 85–23 | 62.00 | % |
| RPR | Number of customers who made a repeat purchase | 86 | 68.25 | % |
| Number of customers | 126 | |||
| RC | Amount of revenue that your business earned from the best customer | 2.35 | 72.31 | % |
| Amount by your business’s total revenue | 3.25 | |||
| CSAT | Number of satisfied customers | 126 | 47.55 | % |
| Total customers asked | 265 | |||
| QCR | Number of good product produced | 12.69 | 88.37 | % |
| Total of product produced | 14.36 | |||
| IQI | Number of assets correctly inventoried | 64 | 77.11 | % |
| Total of assets | 83 | |||
| PLTF | Estimated total time | 54.00 | 90.00 | % |
| Real total time | 60.00 | |||
| ESR | Number of employees with skills to their work | 20 | 76.92 | % |
| Total number of employees | 26 | |||
| ETR | Number of hours in training | 58.00 | 100.00 | % |
| Number of hours planned for training | 50.00 | |||
| ERR | Total of new employees retained | 7 | 77.78 | % |
| Total of new employees | 9 | |||
| ESI | (How satisfied are you with your job + How well does your job meet your expectations + How close is your workplace to your ideal job)/3 | 9/8/9 | 86.7 | % |
Disclaimer/Publisher’s Note: The statements, opinions and data contained in all publications are solely those of the individual author(s) and contributor(s) and not of MDPI and/or the editor(s). MDPI and/or the editor(s) disclaim responsibility for any injury to people or property resulting from any ideas, methods, instructions or products referred to in the content. |
© 2023 by the authors. Licensee MDPI, Basel, Switzerland. This article is an open access article distributed under the terms and conditions of the Creative Commons Attribution (CC BY) license (https://creativecommons.org/licenses/by/4.0/).
Share and Cite
de-Almeida-e-Pais, J.E.; Raposo, H.D.N.; Farinha, J.T.; Cardoso, A.J.M.; Lyubchyk, S.; Lyubchyk, S. Measuring the Performance of a Strategic Asset Management Plan through a Balanced Scorecard. Sustainability 2023, 15, 15697. https://doi.org/10.3390/su152215697
de-Almeida-e-Pais JE, Raposo HDN, Farinha JT, Cardoso AJM, Lyubchyk S, Lyubchyk S. Measuring the Performance of a Strategic Asset Management Plan through a Balanced Scorecard. Sustainability. 2023; 15(22):15697. https://doi.org/10.3390/su152215697
Chicago/Turabian Stylede-Almeida-e-Pais, José Edmundo, Hugo D. N. Raposo, José Torres Farinha, Antonio J. Marques Cardoso, Svitlana Lyubchyk, and Sergiy Lyubchyk. 2023. "Measuring the Performance of a Strategic Asset Management Plan through a Balanced Scorecard" Sustainability 15, no. 22: 15697. https://doi.org/10.3390/su152215697
APA Stylede-Almeida-e-Pais, J. E., Raposo, H. D. N., Farinha, J. T., Cardoso, A. J. M., Lyubchyk, S., & Lyubchyk, S. (2023). Measuring the Performance of a Strategic Asset Management Plan through a Balanced Scorecard. Sustainability, 15(22), 15697. https://doi.org/10.3390/su152215697