Article

Maritime Network Analysis Based on Geographic Information System for Water Supply Using Shipboard Seawater Desalination System

Korea Institute of Civil Engineering and Building Technology, Environment Research Institute, Goyang-si 10223, Republic of Korea
*
Author to whom correspondence should be addressed.
Sustainability 2023, 15(22), 15746; https://doi.org/10.3390/su152215746
Submission received: 5 September 2023 / Revised: 24 October 2023 / Accepted: 28 October 2023 / Published: 8 November 2023
(This article belongs to the Section Sustainable Engineering and Science)

Abstract

:
Small islands are supplied with water from underground sources, simple seawater desalination facilities, or water supply shipment. However, this water supply can be interrupted because of the sudden depletion of groundwater, as groundwater level prediction is inaccurate. Additionally, seawater desalination facilities are difficult to maintain, resulting in frequent breakdowns. When the water tank capacity is below a certain level, island residents contact the water supply shipment manager to request a shipment from land. In Korea, a seawater desalination plant project using ships was newly attempted to solve the water supply problem for island regions. Through this project, an attempt was made to supply water to many island areas suffering water supply disruptions due to drought. The purpose of this study is to compare water supply routes to multiple island regions using existing water supply shipment with desalination plants on ships through network analysis based on a geographic information system. To optimize sailing route, length (m), road connection type, and name of each road section, actual operation data, distance, etc., were set up on a network dataset and analyzed. In addition, the operational model predicted the stability of water supply using the GoldSim simulator. As a result, when sailing on the optimal route based on network analysis, the existing water supply routes could be reduced (2153 km -> 968 km) by more than 55%, and operational costs can be verified to be reduced. Additionally, the validity of the network analysis results was confirmed through actual travel of the representative route.

1. Introduction

According to a report on the current status of island areas, South Korea has 3348 islands, 470 of which are inhabited by approximately 840,000 residents. Among them, ~29% receive direct water supply, while the others use simple water supply facilities and groundwater for domestic use. Thus, securing stable drinking water sources for these island communities is urgent [1,2,3,4]. According to the current operation method of water supply shipment, residents directly check the water level of storage tanks and contact the local administrative division to request water supply in the case of shortage. The person in charge of the cargo ship loads water onto the ship on land and starts the engine [5]. This water supply method is non-systematic, and supplying water efficiently is difficult if the operation schedule of the water supply ship does not match the requirements of the island; this may inevitably lead to a limited water supply. Moreover, this method is vulnerable to weather conditions such as droughts and typhoons. Therefore, calculated water supply plans are required. A nationwide, severe drought occurred in the Midwest region in 2015, causing a shortage of constant drinking water in island areas that depend on a single water source [5,6]. For several years, the rainfall in the islands in the southwest region constituted only 50.8% of the average yearly rainfall. The water storage rate for 7900 residents around Wando in South Korea was only 12.9% [7].
Moreover, since the water storage rate of small islands in South Korea without a water source was reduced to 0.3%, the residents have suffered from a shortage of domestic water supply, resulting in the limited water supply to these areas [2,8]. The survival of residents in the western region of South Korea has been threatened by severe spring droughts, with a rainfall of only ~60 mm, less than half of the average yearly rainfall. However, concrete water supply plans for these island areas are not included in the high-level plans. This is because measures for water supply to island areas are not included in the basic plan for strategic environmental evaluation of the water supply maintenance overall plan regularly published by the Ministry of Environment [5,6,9,10,11,12]. This study aimed to apply a shipboard seawater desalination plant model to present a cost-effective alternative to the current water supply shipment operation method and prepare for emergencies, such as droughts. Shipboard desalination ships are those with an onboard sea-water desalination plant that can process fresh water from seawater, which is then easily supplied to small islands without water sources while the ship tours. The shipboard desalination ship is developed by the Desalination by Resilient, Energy-efficient & Advanced Mobile System (DREAMS) Research Project. Although some research has been conducted on mounting small-scale desalination facilities on ships, this is the first time a ship has been developed for desalination and water supply [13,14]. This desalination facility applied a reverse osmosis system by comparing various desalination methods [14,15,16]. Islands in the southwestern region of South Korea were selected as target areas for planning. Applicability was evaluated by focusing on the travel distance that saved maximum cost and time, excluding items identical to those included in existing operation methods, such as labor and water supply costs. Few studies have been conducted on the applicability of shipboard desalination ships and the optimal operating model. The geographic information system (GIS) is software that is used to store, manipulate, analyze, and visualize geographic data. Furthermore, it can effectively solve problems such as emergency response and alternatives [17]. It is specialized in spatial analysis, analyzing big data, and monitoring in real-time based on geographic information. It is possible to find a facility to arrive on time or to calculate the optimal route to move to multiple points using these functions. In this study, unlike most existing algorithms focusing on the minimum movement distance, various parameters are applied to derive the optimal movement path. Additional parameters like average speed by the tide, U-turn time, and obstacles were added to differentiate the sailing road network. Thus, more efficient operation is expected compared with the existing method of setting routes intuitively.

2. Materials and Methods
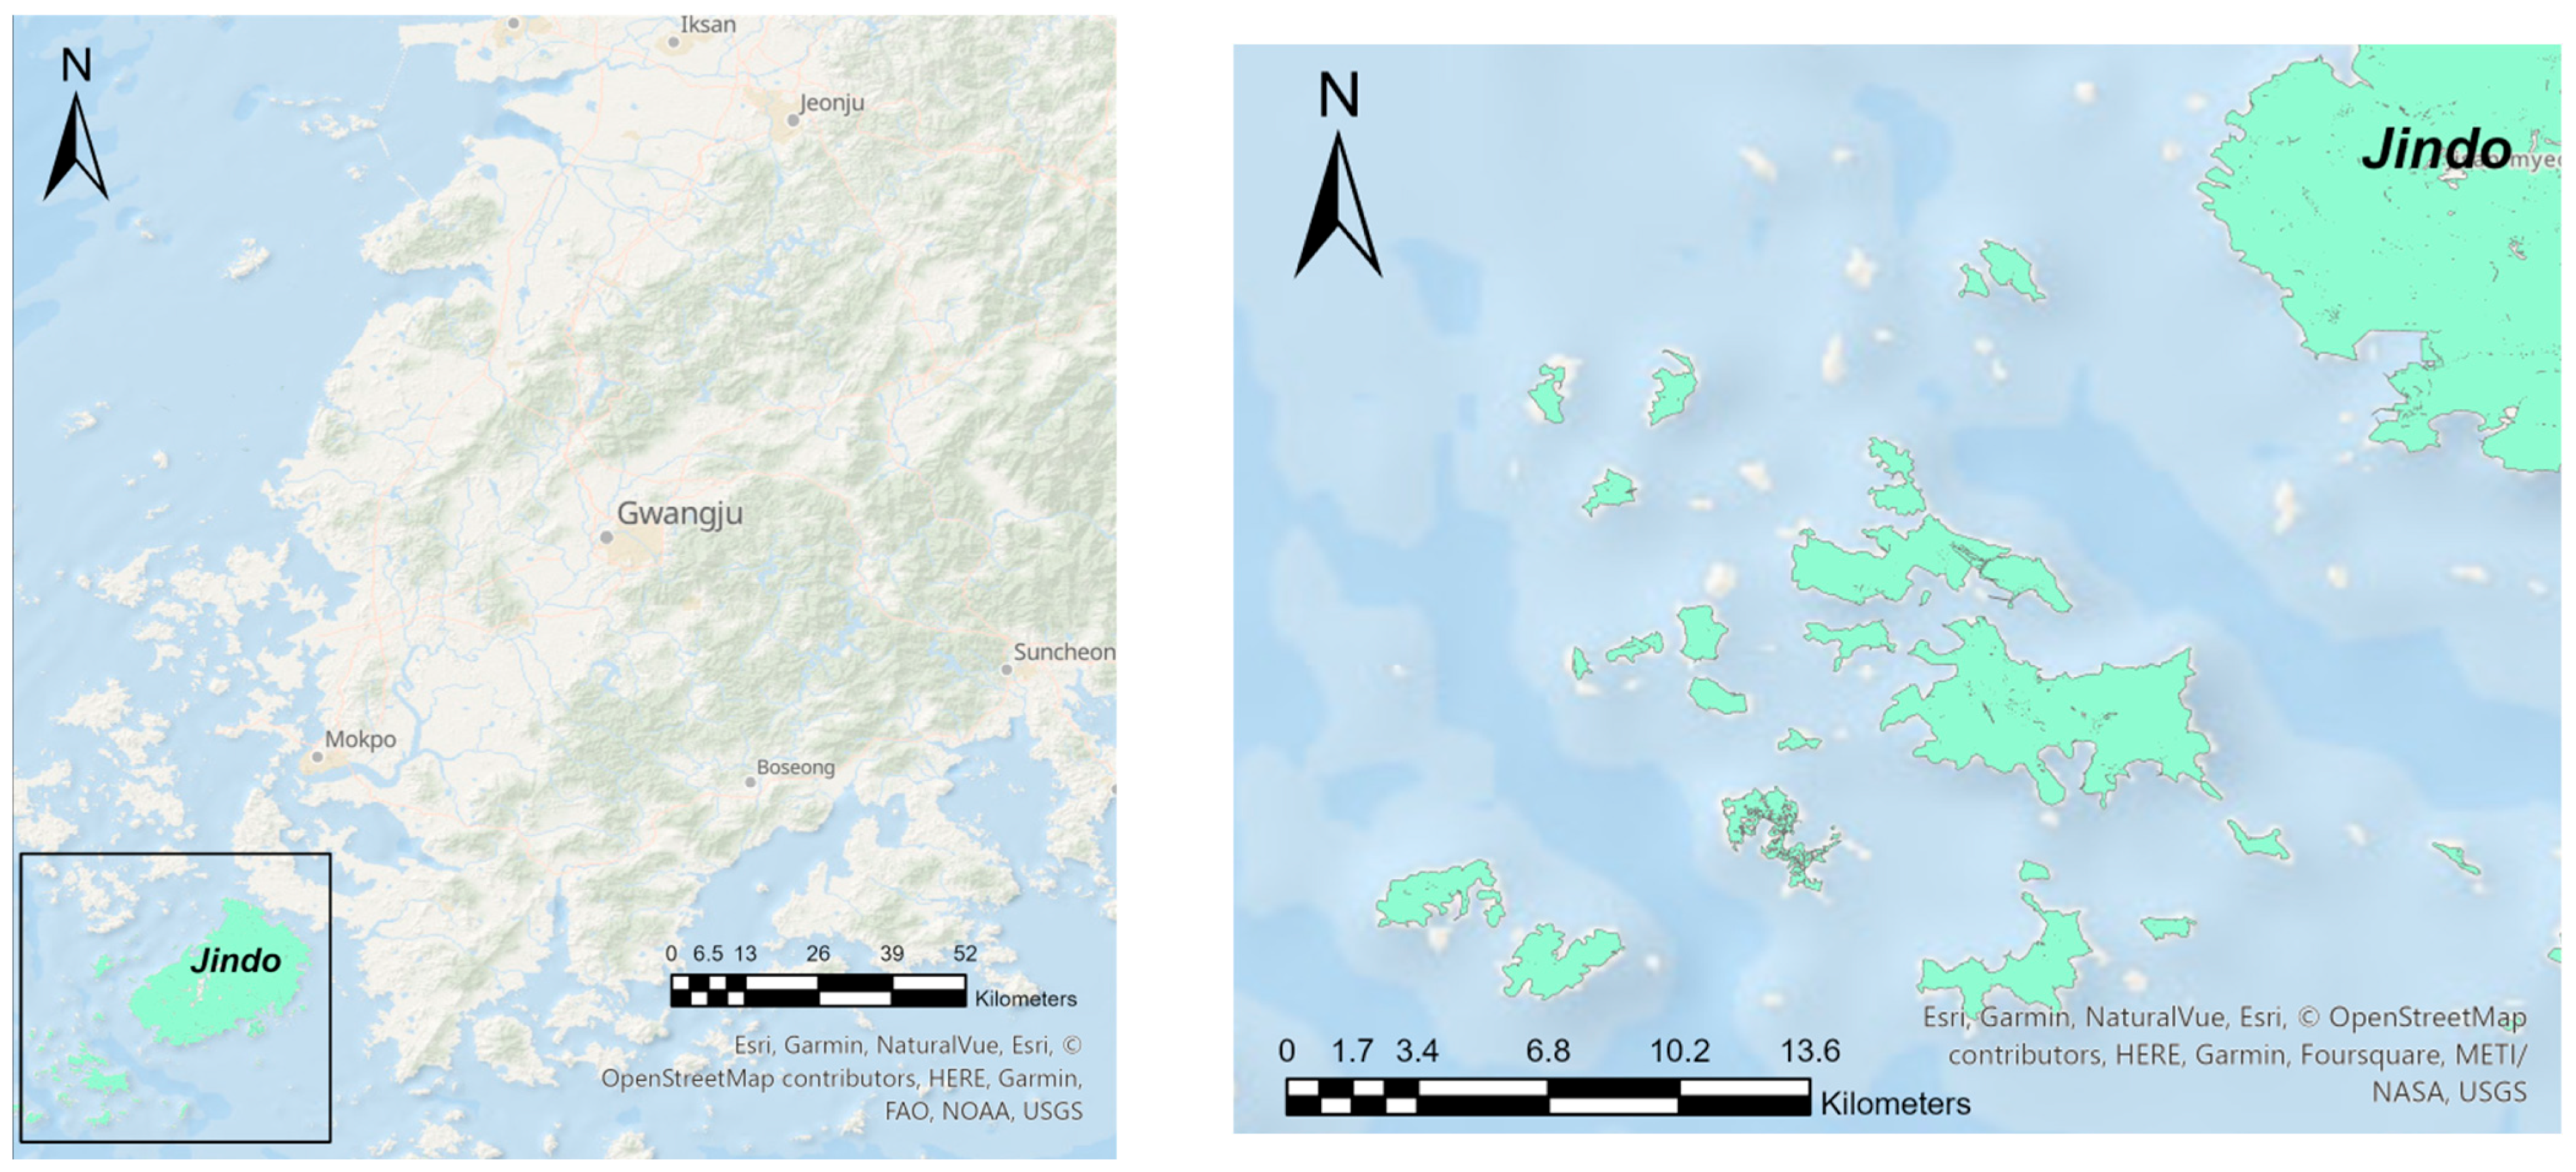
2.1. Study Areas

In this study, the stability of the water supply and the travel distance of ships were calculated to verify the applicability of shipboard desalination ships for small South Korean islands without water sources. The target areas were South Korean islands that receive water supply through water supply shipment, and the stability of water supply was obtained by predicting the storage tank water level of each island. The water supply shipment and sailing route of the shipboard desalination ship were operated via the optimal route determined using the geographic information system (GIS)-based network analysis. The route was established considering the tidal current and movement speed between islands. The daily water usage and road network of each island were established based on the actual circumstances. Shipboard desalination ships can easily supply drinking water to islands not connected by bridges to the land and islands where the self-supply of water is difficult; furthermore, they can be efficiently operated in areas where these two conditions are concentrated. South Korea has ~3300 islands, of which 470 have residents. In the southwestern region, which is a rias coast, residents live on many islands owing to active fishing activities. Jindo-gun in this region was selected as the target area in this study. As shown in Figure 1, Jindo-gun (X: 34.4565, Y: 126.2454) comprises ~230 islands, of which 45 have residents [9,10]. Among the 45 islands, those not connected to the land by bridges receive water through groundwater or small-scale seawater desalination facilities. However, 17 of these islands receive water supply intermittently through water supply ships and store water in 50-ton storage tanks. Table 1 lists the number of households and the water supply population. These islands, without their water supply, are vulnerable to periodic water supply management and stability because they depend on water supply shipment. Moreover, supplying water to many islands in a single day through water supply shipment is challenging because the water must first be loaded on land and then transported to the islands. In this study, a water supply model with a schedule was developed to sufficiently satisfy the daily water demands of the water supply population on selected islands using GoldSim (Goldsim Technology Group LLC, Washington, USA). The efficiency of ship transport was analyzed by comparing as-is and to-be models for the utilization of water supply shipment and the application of shipboard desalination ships.

2.2. Shipboard Seawater Desalination Project

The shipboard desalination ship is under development by the Desalination by Resilient, Energy-efficient & Advanced Mobile System (DREAMS) Research Group, launched in 2018 under the trust of the Korea Environmental Industry & Technology Institute under the Ministry of Environment of South Korea. This project focuses on the development of a next-generation seawater desalination technology that can secure alternative water resources by combining world-class seawater desalination and ship manufacturing technologies. Technology development is being researched to acquire water shortage solutions for islands and coastal areas affected by abnormal climate conditions. The shipboard seawater desalination plant will be manufactured with a capacity of 300 m3 d−1 through DREAMS. Before this, a site that is easy to utilize was searched, and its applicability was evaluated. The conceptual diagram and actual operation of the shipboard desalination plant are shown in Figure 2. The specifications of the shipment and RO system are summarized in Table 2.

2.3. GoldSim Simulation

GoldSim is a program that can visualize and dynamically simulate complex systems in the engineering and science fields. It has the advantage of graphically visualizing data and equations and is easy to use for observing and predicting the patterns of the implemented system as it changes over time [18]. The GoldSim program can simulate systems with complex relationships of many components, such as water resources, water supply, and hydrologic modeling [19,20,21]. Furthermore, it can visually show the integrated management problems of water resources because it can analyze uncertain parameters led by probabilistic variables (precipitation, evaporation, demand) [18,19,22].
The GoldSim model elements include input, function, storage, generation, delay, and result elements. Input elements are for inputting data, including simple values, time series, and probability distribution data. The model can also analyze recorded data and matrices for simulation. Function elements derive analysis results based on the input elements and function expressions of the user. In contrast, storage, event, and delay elements are unique function elements that simulate effects according to past simulation conditions where the results vary with time. Furthermore, storage elements include functions that can perform simple storage tank simulation and integration. Although models can be simulated and analyzed using tools from other programs or programming languages, GoldSim is advantageous because it is easy to apply to the correlations or equations of input variables; this makes sharing or applying models convenient because users can easily create new models and modify constructed models. Moreover, the details of the model, such as input values, can be conveniently viewed using a free viewer program provided by the GoldSim company [20,22,23].
The GoldSim simulator allows data input in unit times desired by the user; this unit was set to an hour in this study. For the elements used in the model, the water usage of residents was input as an hourly outflow in the storage element that expresses the storage tank. For the inflow, the water supply for 30 days was set in an hourly unit according to the shipment schedule by connecting with the input element. Furthermore, the on/off switch of the pump and overflow were manipulated by applying event elements to activate each element over time. The function elements were used to express the total amount of supplied water, amount of used water, and so on. The elements used in the model and their functions are summarized in Table 3. A flow of the simulation is illustrated in Figure 3.

2.4. Building the Network Dataset

In this study, network analysis was performed to identify the optimal sailing route and travel time between islands. Network analysis is a technique used for traffic planning and problem-solving by referring to basic geographic information, such as basic maps and road network data [17,24,25]. It is a tool that can easily analyze the shortest route, nearest point, and location assignment and change road settings, such as road restrictions. The information on actual roads (e.g., road classification, speed limit, intersections, and signals) is systematized worldwide and provides essential data. However, there are no established network data for small ship routes in the sea near land because there is no set road, and navigation is conducted under the supervision of a navigator. Therefore, in this study, a geodatabase that includes road information, through the building network process shown in Figure 4, was constructed [17,26,27,28,29].

2.4.1. Data Preparation

The basic map sea route data of the target area and average current speed data were gathered for data preparation. The moving speed of the ship was calculated by deriving the moving distance of the ship during unit time through the GPS system that stores the latitude and longitude of the real-time location. GPS were was accumulated by selecting a route of a representative case in the target area. Representative cases reflected are as follows:
(1)
A route that can be operated smoothly without obstacles in the movement route of the ship
(2)
Deceleration section due to fish farms and reefs
(3)
Slow movement between areas where farms are concentrated or between small islands
(4)
Berthing to port.
The GPS terminal (IoTPlex, 4 Guard, Busan, Republic of Korea) that can display and store the current location on the map at 10 s intervals was applied to this study due to its high precision and stability. Based on the data of the target area, feature lines that express the movement of ships were generated, with the included properties as input, as shown in Figure 4 [17,26]. The input also had basic properties, such as length (m), road connection type, and name of each road section, and actual operation data, such as distance traveled per unit time or time traveled per unit distance. Furthermore, because the sailing speed in both directions was different due to the influence of the current, the basic speeds of the TF_Minutes (forward) and FT_Minutes (backward) fields were set differently. As an additional function of network analysis for the road traffic data, a route that avoids roads that are congested or slower than the average speed could be selected by predicting the real-time traffic based on past traffic information. However, in this study, the default traffic information was used because it was a new route for which past traffic data could not be applied.

2.4.2. Network Dataset Creation

The primary data in ArcGIS 2.9 (Esri, Redlands, CA, USA) are managed in the “Geodatabase” format and include fundamental road and terrain information. Since the line feature class built in the Geodatabase is a layer containing the input field information, a process to build it into a road network is necessary. Every edge and junction expressed in road network generation was identified in this process, and the information included as a road (topology, U-turn points, and time required for left/right turn) was additionally set. Network analysis displayed various results by calculating the time and distance required by going through the road on the network dataset settings. Furthermore, accurate result values could be obtained by correcting the connections and errors of the built network based on the set properties and feature classes [29,30,31].

2.5. Network Analysis

Network analysis has various analytical tools, such as Route, which finds the most appropriate route in a network; Closest Facilities, which can find a location or facility closest to the optimal route in a network; and Service Area, which identifies a service area that can be reached within a certain time around the current location [26,27,32,33]. In this study, the Route tool was used to determine the movement distance according to the optimal route of the ship that sails between islands and the time required for the movement. The road network as lines of the target region selected and example of input data in this study are shown in Figure 5. The road network was created to imitate the actual ship sailing route of the region. The total travel distance of the optimal route derived based on the road network was calculated as the sum of all routes selected between the starting point and the destination. In addition, the obstacle constant k value was applied because the navigation speed of the selected route differs depending on the obstacles on the maritime road. The range of the constant k was classified into 4 types according to the characteristics of each road (Table 4), and the k value was entered as a schema value in the network dataset. The total travel time is calculated using Equation (1), where Vmax is the maximum travel speed of the ship and D is the length of each road.
T o t a l   t r a v e l   t i m e = n = 1 S e l e c t e d k n × V m a x × D

3. Results

3.1. Existing Model Using Water Supply Shipment (As-Is)

3.1.1. Verification of the Stability of Water Supply

The GoldSim model was simulated to calculate the operation cost according to the existing operation method of water supply shipment, as shown in Figure 6. A storage element was used to verify the storage tank capacity of the island, an input element was used to set the water supply, a functional element was used to calculate the cost, and an event element was added to make the model more efficient. For the water supply shipment model, the monthly supply frequency was set in such a way that the water supply to the island residents would be smooth and the storage tank capacity of each island (50~60 tons) would not be exceeded. The storage tank capacity of the islands was maintained above 0 tons. The storage tank capacity over time of each island is shown in Figure 7. The water usage and storage tank capacity were set the same as the actual operating values, and the same settings were used in the calculation of the optimal distance through network analysis.

3.1.2. Existing Operation Route and Distance Calculation of Water Supply Shipment

The existing operation method in the target area is to load water in a water supply shipment tank on land before departing to an island to supply the water. Furthermore, each island requests water supply from a government agency when the storage tank level is low. As a result, these requests are not planned, and the water supply may be delayed. In this study, the supply frequency per month was determined based on the average water usage of residents, and the monthly travel distance of water supply shipment was calculated accordingly. The optimal sailing route between the island and land for the water supply shipment using network analysis is shown in Figure 8. The travel distance and time of each route are summarized in Table 5. The starting point of the water supply shipment was based on the land port closest to the target island. The supply frequency per month, between 1 and 9 per month depending on the island, was determined as the minimum count where the water supply stability was verified in the GoldSim simulation. The total monthly travel distance for a stable water supply was approximately 2153 km, and the travel time was approximately 250 h.

3.2. Application of the Shipboard Desalination Ship (To-Be)

3.2.1. Verification of the Stability of Water Supply

The shipboard desalination ship that produces freshwater while traveling between islands can supply water to many islands in one day, thus shortening the travel distance; it does not need to refill water by returning to land. In this study, the monthly operation schedule was established for 18 islands for a stable and systematic water supply. The monthly water supply schedule was planned with 11 groups according to the water supply cycle and the locations of the islands, as summarized in Table 6. The monthly GoldSim model of the ship according to the monthly schedule is shown in Figure 9. The storage tank capacity of the representative island by the group was stably maintained between 0 and 60 t (Figure 10).

3.2.2. Calculation of the Travel Route and Distance of the Shipboard Desalination Ship

The travel route and distance were calculated to verify the applicability of shipboard desalination ships for efficient water supply overcoming the shortcomings of the existing method. Figure 11 shows the optimal daily routes according to the operation schedule. Network analysis determined the optimal operation sequence and route by specifying the start and end points and setting the target island for water supply. The travel times and daily travel distances are listed in Table 7. A different optimal route was determined for each group on a monthly schedule, and a daily travel distance in the range of 30–73 km was necessary. The monthly total travel distance was approximately 968 km, which decreased by approximately 55% or more compared with the monthly travel distance of 2153 km of the water supply shipment. The travel time decreased by approximately 52%, from 250 to 117 h.

3.2.3. Verification of Route Results through Actual Travel

The islands were grouped according to monthly schedules, and the optimal navigation route for each group was derived. To verify the derived route results, a representative route was selected and travel time was confirmed by sailing an actual shipment. A GPS terminal (IoTplex, 4 Guard, Busan, Republic of Korea) was placed on the ship, and the current location was transmitted every unit of time (minutes) and displayed on the map. Route 6, which was selected as the representative, starts from HajoDo and supplies water to five islands (NaebyeongDo, OibyeongDo, NulokDo, GalmogDo, JinmokDo). As a result of network analysis, it was calculated that the travel distance was about 30 km. The verification was operated similarly to the actually designed travel route. It took about 300 min, including berthing time. This showed a similar travel time to the GIS Software result (280 min). Figure 12a is Route 6 marked with a thick purple line applied to verification, and Figure 12b is a display of measured GPS data for actual sailing by GPS terminal.

4. Conclusions

In this study, the applicability of shipboard desalination ships as a means of water supply to islands where only shipment from the land is possible and which cannot receive local water supply, village water supply, or groundwater was analyzed. The results confirmed the applicability of shipboard desalination ships in terms of water supply stability and travel time in island areas. The conclusions of this study can be summarized as follows.
  • The existing water supply method using land island round trips has many unstable factors and high costs depending on the climate and water supply shipment operation.
  • An operation schedule was established, and a shipboard desalination ship model was applied to the GoldSim simulation program to address these shortcomings, which indicated a stable water supply.
  • Furthermore, the optimal route, travel distance, and time determined using network analysis were compared with those of the existing water supply shipment.
  • The total monthly travel distance decreased by more than 55% from 2153 km during water supply shipment to 968 km using DREAMS and was directly related to the water supply operation cost.
  • Therefore, using the shipboard desalination ship is expected to considerably reduce the operation cost.

Author Contributions

Conceptualization, T.-M.H.; methodology, Y.S. and T.-M.H.; software, S.-H.N.; investigation, J.K. and E.K.; validation, T.-M.H. and J.K.; formal analysis, Y.S. and J.L.; resources, T.-M.H.; data curation, T.-M.H. and S.-H.N.; writing—original draft preparation Y.S.; writing—review and editing, J.K.; visualization, E.K. and J.L; supervision, T.-M.H.; project administration, T.-M.H.; funding acquisition, T.-M.H. All authors have read and agreed to the published version of the manuscript.

Funding

This research was funded by the Korea Environment Industry & Technology Institute (KEITI) grant number [code 146840] and the APC was funded by KEITI.

Institutional Review Board Statement

Not applicable.

Informed Consent Statement

Not applicable.

Data Availability Statement

Not applicable.

Conflicts of Interest

The authors declare no conflict of interest.

References

  1. Ahmed, S.; Ibrahim, R.F. GIS-based network analysis for the roads network of the greater Cairo Area. In Proceedings of the International Conference on Applied Research in Computer Science and Engineering 2017, Beirut, Lebanon, 22–23 June 2017. [Google Scholar]
  2. Athira, G.; Bahurudeen, A.; Vishnu, V.S. Availability and Accessibility of Sugarcane Bagasse Ash for its Utilization in Indian Cement Plants: A GIS-Based Network Analysis. Sugar Tech 2020, 22, 1038–1056. [Google Scholar] [CrossRef]
  3. Bae, S.; Lee, S.-H.; Yoo, S.-H.; Kim, T. Analysis of Drought Intensity and Trends Using the Modified SPEI in South Korea from 1981 to 2010. Water 2018, 10, 327. [Google Scholar] [CrossRef]
  4. Bae, Y.J.; Lee, H.J.; Jung, B.W. Korean Climate Change Assessment Report 2020; Minister of Environment: Seoul, Republic of Korea, 2020.
  5. Boeing, G. Urban street network analysis in a computational notebook. arXiv 2020, arXiv:2001.06505. [Google Scholar] [CrossRef]
  6. Chu, K.H.; Oh, B.G.; Kook, S.H.; Hwang, M.H. Operational strategies for brackish water desalination plants in island regions of South Korea. J. Clean. Prod. 2021, 278, 123540. [Google Scholar] [CrossRef]
  7. Das, D.; Ojha, A.K.; Kramsapi, H. Road network analysis of Guwahati city using GIS. SN Appl. Sci. 2019, 1, 906. [Google Scholar] [CrossRef]
  8. Dias, T.W.K.I.M.; Wijeweera, K.P. Assessing the walk-score of walking paths in Kandy City area for better walking experience for the tourists. J. Inst. Eng. 2021, 54, 27–38. [Google Scholar] [CrossRef]
  9. Gibson, J.; Deng, X.; Boe-Gibson, G.; Rozelle, S.; Huang, J. Which households are most distant from health centers in rural China? Evidence from a GIS network analysis. Geo J. 2011, 76, 245–255. [Google Scholar] [CrossRef]
  10. Gnawali, K.; Han, K.H.; Geem, Z.W.; Jun, K.S.; Yum, K.T. Economic Dispatch Optimization of Multi-Water Resources: A Case Study of an Island in South Korea. Sustainability 2019, 11, 5964. [Google Scholar] [CrossRef]
  11. GoldSim Technology Group. Strategic Planning Applications Using GoldSim. White Paper. 2017. Available online: https://www.goldsim.com/Web/Applications/WhitePapers/ (accessed on 6 November 2020).
  12. Hepler, K.C. Characterization of Pressurized Wash for Decontamination of Porous Building Materials and a Goldsim Model for Recycling Contaminated Wash. Master’s Thesis, University of Illinois at Urbana-Champaign, Champaign, IL, USA, 2017. Available online: http://hdl.handle.net/2142/98301 (accessed on 12 December 2020).
  13. Hou, S.; Li, H.; Zhang, H. An open air–vapor compression refrigeration system for air-conditioning and desalination on ship. Desalination 2008, 222, 646–655. [Google Scholar] [CrossRef]
  14. Xu, Y.; Zhu, B.-K.; Xu, Y.-Y. Pilot test of vacuum membrane distillation for seawater desalination on a ship. Desalination 2006, 189, 165–169. [Google Scholar] [CrossRef]
  15. Zhao, Y.; Duan, L.; Slawomir, W. Hermanowicz, Influence of water transport characteristics on membrane internal conductive structure in forward osmosis microbial fuel cell. J. Mol. Liq. 2023, 380, 121704. [Google Scholar] [CrossRef]
  16. Gao, Q.; Duan, L.; Zhao, Y. Evaluation and optimization of reverse osmosis pretreatment technology using the modified intermediate blocking model. J. Clean. Prod. 2023, 417, 138029. [Google Scholar] [CrossRef]
  17. Hetamsaria, P.; Matori, A.N.B. Applications of network analysis features in GIS. J. Eng. 2019, 3, 46–54. Available online: https://myjms.mohe.gov.my/index.php/paje/article/view/6651 (accessed on 10 May 2021).
  18. Elhag, A.R.; Elhag, A.A.; Sideeg, S.E.K. Route network analysis in Khartoum City. JECS 2016, 17, 50–57. Available online: https://repository.sustech.edu/handle/123456789/16648 (accessed on 10 May 2021).
  19. Forkuo, E.K.; Quaye-Ballard, J.A. GIS based fire emergency response system. Int. J. Remote Sens. 2013, 2, 32–40. [Google Scholar]
  20. Jin, Y.K.; Lee, S.H.; Jeong, T.M.; Kang, S.U. Estimation of supplement-eeduction amounts of water supply in a reservoir system operation using a Monte Carlo Simulation. J. Korean Soc. Hazard Mitig. 2019, 7, 87–94. [Google Scholar] [CrossRef]
  21. Wohlwend, J.L.; Hamm, L.L. GoldSim E-Area Low-Level Waste Facility Aquifer Zone Model Calibration Methodology; U.S. Department of Energy: New Ellenton, SC, USA, 2020. [CrossRef]
  22. Kim, D.-W.; Byun, H.-R.; Choi, K.-S.; Oh, S.-B. A Spatiotemporal Analysis of Historical Droughts in Korea. J. Appl. Meteorol. Climatol. 2011, 50, 1895–1912. [Google Scholar] [CrossRef]
  23. Lee, Y.M.; Jeong, J.T. Understanding and their application of GoldSim transport pathways to mass Transport simulation. J. Nucl. Fuel Cycle Waste Technol. 2014, 12, 133–151. [Google Scholar] [CrossRef]
  24. Lee, Y.H.; Hong, W.H.; Lee, J.S. The vulnerability assessment of water supply through the analysis of emergency water shortage in cut off water supply-prone island area. J. Korea Plan. Assoc. 2014, 30, 253–260. [Google Scholar] [CrossRef]
  25. Lee, Y.M.; Hwang, Y.S. A GoldSim model for the safety assessment of an HLW repository. Prog. Nucl. Energy 2009, 51, 746–759. [Google Scholar] [CrossRef]
  26. Lee, J.H.; Park, S.Y.; Chen, J. Extreme drought hotspot analysis for adaptation to a changing climate: Assessment of applicability to the five major river basins of the Korean Peninsula. Int. J. Climatol. 2018, 38, 4025–4032. [Google Scholar] [CrossRef]
  27. Moon, Y.R.; Kang, Y.S.; Park, N.S. A Study of Water Supply and Use in Small Islands; Basic Research Report; Korea Environment Institute: Incheon, Republic of Korea, 2009; pp. 1–3. [Google Scholar]
  28. Moon, Y.R.; Lee, M.J.; Kim, J.G. Guideline for Environmentally Friendly Water Supply Plans in Small Islands; Research Report; Korea Environment Institute: Incheon, Republic of Korea, 2010; pp. 1–3. [Google Scholar]
  29. Chen, S.; Zhuang, D. Evolution and Evaluation of the Guangzhou Metro Network Topology Based on an Integration of Complex Network Analysis and GIS. Sustainability 2020, 12, 538. [Google Scholar] [CrossRef]
  30. Shim, I.T.; Hong, B.C.; Kim, E.J.; Hwang, T.M. Vulnerability assessment of drought of small island areas in Korea. J. Korean Soc. Water Wastewater 2019, 33, 341–351. [Google Scholar] [CrossRef]
  31. Trenggana, S. The accessibility level of Cigudeg Village as prospective capital city of West Bogor Regency. Int. J. Environ. Agric. Biotechnol. 2019, 4, 561–580. [Google Scholar] [CrossRef]
  32. Weththasinghe, W.A.S.S.; Bandar, J.M.S.J. Systems approach to develop high mobility road network plan for Sri Lanka. J. Inst. Eng. 2021, LIV, 61–67. [Google Scholar] [CrossRef]
  33. Won, J.E.; Choi, J.H.; Kim, S.D. Two ways to quantify Korean drought frequency: Partial duration series and bivariate exponential distribution, and application to climate change. Atmosphere 2020, 11, 476. [Google Scholar] [CrossRef]
Figure 1. Map of the study area (Jindo-gun of South Korea).
Sustainability 15 15746 g001
Figure 2. Conceptual diagram (a) and actual operation (b) of the shipboard desalination plant.
Sustainability 15 15746 g002
Figure 3. Flow diagram of Goldsim simulator.
Sustainability 15 15746 g003
Figure 4. Arrangement of the network dataset.
Sustainability 15 15746 g004
Figure 5. Road network (a) and example of input data (b) of the target region (Jindo-gun).
Sustainability 15 15746 g005
Figure 6. GoldSim model that simulates the existing operation method of water supply shipment.
Sustainability 15 15746 g006
Figure 7. Analysis result of the GoldSim model of the existing operation.
Sustainability 15 15746 g007
Figure 8. Route result of network analysis for water supply shipment.
Sustainability 15 15746 g008
Figure 9. GoldSim model using the shipboard seawater desalination plant.
Sustainability 15 15746 g009
Figure 10. Result of the GoldSim model using the shipboard seawater desalination plant.
Sustainability 15 15746 g010
Figure 11. Route result of network analysis for shipboard desalination ship.
Sustainability 15 15746 g011
Figure 12. Route 6 of network analysis result (a) and GPS log display of actual travel (b).
Sustainability 15 15746 g012
Table 1. Islands to which water is supplied via ships in the target area.
LatitudeLongitudeNumber of HouseholdsNumber of ResidentsAmount of Water Usage (t d−1)
Oibyeong do34.37228125.938616195.7
Naebyeong do34.37123125.967416278.1
Gwangdae do34.52888126.1069682.4
Song do34.51986126.0968120.6
Gasahyeol do34.51582126.08789175.1
Juji do34.48885126.0821230.9
Nulok do34.34891125.953213206
Jeo do34.50888126.165117195.7
Sosungnam do34.39667126.0373561.8
Juk do34.2235125.845913185.4
Gwak do34.19686125.8599164.8
Jinmok do34.31126125.957813175.1
Galmok do34.30801125.9446341.2
Seul do34.26292126.150412195.7
Sanghajuk do34.24848125.925213206
Dokgeo do34.25101126.1804254814.4
Tanhang do34.23873126.1761330.9
Table 2. Specification of shipboard desalination plant and RO system.
AttributeValue
ShipmentService speed7~9 knot
Gross Tonnage1800 ton
Number of staffs on board10
Size (Length * Width)70.9 m × 24.0 m
Draft4 m
RO SystemModelLG SW 400 GR
Effective area37.2 m2/module
Number of modules7 modules/vessel
Number of vessels5 vessels/rack
Number of racks1 rack
Operating flux39.5 LMH
Table 3. Elements of GoldSim and their functions.
ElementsIconFunctions
Storage elementsSustainability 15 15746 i001Elements for calculating changes in storage tank capacity over time based on the set inflow and outflow
Input elementsSustainability 15 15746 i002Elements for setting inflow. The input variables can be set according to time-series data and probability normal distribution.
Event elementsSustainability 15 15746 i003Functions for manipulating input elements and function elements based on set events (e.g., IF function and storage tank set capacity)
Function elementsSustainability 15 15746 i004Elements that include functions or equations that can be calculated by integrating the results between elements
Table 4. Range of k value by maritime road type.
ValuesTypeRange of Value
k 1 Wide road, no obstruction1
k 2 A few fish farms, submerged rocks0.7~0.9
k 3 A lot of fish farms, narrow road0.4~0.6
k 4 Berthing0.1~0.2
Table 5. Travel distance and time according to water supply shipment.
DestinationTravel Distance (m)Travel Time (min)Supply Frequency per Month
Dokgeohyeol do39,9902632
Dokgeo do32,5341739
Galmok do41,8713121
Gasahyeol do20,5352414
Gwak do69,4944693
Gwangdae do16,1631822
Jeo do4292524
Jinmok do38,7052744
Juji do20,2092101
Juk do69,8354764
Naebyeong do35,7792395
Nulok do40,2992764
Oibyeong do40,9902884
Sanghajuk do54,8313664
Seul do30,9871864
Soseongnam do21,0071462
Song do18,7472171
Tanhang do35,7942121
Total2,153,02114,92359
Table 6. Monthly schedule of shipboard desalination ship according to water supply group.
MondayTuesdayWednesdayThursdayFriday
1st 2nd3rd4th5th
Group 1Group 2Group 6-Group 9
8th9th10th11th12th
Group 10Group 11Group 2Group 3-
15th16th17th18th19th
Group 10Group 11Group 4Group 3Group 2
22nd23rd24th25th26th
Group 10Group 11-Group 3Group 2
29th30th31st
Group 5Group 7Group 8
Table 7. Travel distance and time according to water supply shipment.
DestinationTravel Distance (m)Travel Time (min)Repeat Times per Month
Route 137,6303331
Route 260,8194264
Route 334,7472123
Route 436,9793161
Route 539,9902631
Route 630,5192801
Route 743,7633131
Route 873,2015081
Route 938,0062461
Route 1056,5593753
Route 1150,4014393
Total968,486704120
Disclaimer/Publisher’s Note: The statements, opinions and data contained in all publications are solely those of the individual author(s) and contributor(s) and not of MDPI and/or the editor(s). MDPI and/or the editor(s) disclaim responsibility for any injury to people or property resulting from any ideas, methods, instructions or products referred to in the content.

