Article

A Multi-Agent Integrated Energy Trading Strategy Based on Carbon Emission/Green Certificate Equivalence Interaction

1
Department of Information Science and Engineering, Northeastern University, Shenyang 110819, China
2
State Grid Qingdao Power Supply Company, Qingdao 266400, China
*
Author to whom correspondence should be addressed.
Sustainability 2023, 15(22), 15766; https://doi.org/10.3390/su152215766
Submission received: 8 October 2023 / Revised: 28 October 2023 / Accepted: 5 November 2023 / Published: 9 November 2023

Abstract

:
To meet the demand for constructing a market mechanism that adapts to the integrated energy system and promotes market-oriented reforms in the energy sector, in-depth research on integrated energy trading strategies is required. This study focused on the integrated energy trading problem and clarify the relationships among participants in the integrated energy market. A regional integrated energy system model was established that enables trading of electricity, gas, heat, and cold, and propose a integrated energy trading strategy based on the carbon emissions/green certificate equivalence interaction. Firstly, the trading process of carbon emissions and green certificates, the underlying representation of green attributes, and market transaction prices are analyzed. Combining with a tiered carbon trading system that includes rewards and penalties, a carbon emissions/green certificate equivalence interaction mechanism is constructed. Secondly, the paper utilized the flexible characteristics of loads within the industrial park to establish a integrated energy demand response model for electricity, heat, and cold. Finally, with the objective of minimizing regional operating costs, a integrated energy trading model considering the carbon emissions/green certificate equivalence interaction mechanism was developed. In the simulation, the operating cost of the system is reduced by 4%, and the carbon emission is reduced by 11.4%, which verifies the effectiveness of the model.

1. Introduction

With the increasing global energy demand driven by industrial production and residential consumption, energy has become a focal point of academic research in recent years [1]. The diversity of sources is increasing, load-side energy demand is becoming more complex, energy storage [2,3,4] is becoming more flexible, and innovation in energy devices is promoting different types of energy. Concepts such as the Energy Internet [5,6] and Integrated Energy Systems (IES) [7] have emerged, sparking a new wave of energy reform. By optimizing the scheduling [8,9] and flexible trading of integrated energy systems, it is possible to strengthen the interconnection and orderly integration of different levels of markets.
IES combines multiple energy sources with different energy conversion technologies in an organic manner [10], creating a coordinated and highly efficient system. IES is an important direction for the future energy system [11,12], as it can accommodate advanced technologies and models such as the Energy Internet and peer-to-peer (P2P) systems. Through the form of intermediaries, IES can organically coordinate and optimize energy supply and demand response. Consequently, IES has emerged as a new choice for the energy revolution. IES realizes the integration of modern technologies such as artificial intelligence, big data, and the Internet of Things (IoT) [13,14]. Through the research on the transaction of IES, it can improve the efficiency of energy resource utilization, promote energy transformation and carbon emission reduction, optimize the security and reliability of energy supply [15,16], and promote the marketization of energy and the improvement of economic benefits.
The coordinated interaction between the medium-to-long-term market and the spot market, as well as the coordinated interaction between the single-energy market and the multi-energy coupled market, are the main aspects involved in the multi-energy coupled energy trading process. Various types of energy markets comprehensively evaluate network congestion levels [17] and market maturity, and based on supply demand conditions, develop a series of financial products derived from energy trading, such as financial transmission rights [18,19], green certificates [20], carbon credits [21], and other products. In terms of complementary solution for multi-energy coupling, Ashwani Kumar et al. [22] constructed an energy hub model, while Xu, Y et al. [23] developed a comprehensive energy system model, approaching the coupling relationship between energy sources from different perspectives and transforming them into quantitative mathematical models. Sheila Nolan et al. [24] introduced the concept of price-based comprehensive demand response, establishing information transmission channels among multiple comprehensive energy systems. By changing market price signals and formulating corresponding policies, load increase or decrease, or shifting energy demand, can be incentivized to enhance energy consumption and reduce energy loss. Lesia Mitridati et al. [25] described user decision-making behavior using utility functions, introduced the concept of constant elasticity of substitution (CES), and constructed mathematical models for users, electricity markets, and heat markets. Based on game theory framework, the energy pricing mechanism was analyzed, laying the foundation for the study of more complex multi-energy coupled transactions and energy markets involving multiple stakeholders.
Carbon emissions are one of the important issues to be addressed in environmental protection, and governments of various countries have developed corresponding carbon trading mechanisms based on existing research and their own circumstances. Hou, JY et al. [26] considered carbon trading as part of resource allocation and that it determines the capacity of wind and solar energy storage. A. Shabanpour-Haghighi et al. [27] proposed the integration of carbon trading mechanisms into microgrids with wind and photovoltaic power generation to improve the economic and clean results of system optimization and dispatch. The research results indicate that carbon trading mechanisms can alleviate environmental issues in grid operation, but these methods are only limited to traditional carbon trading mechanisms, and the guiding effect of green energy and the reduction of carbon emissions is limited.
G. Feng et al. [28] proposed an optimized scheduling model for the tiered carbon trading mechanism and studies the impact of different cost parameters on low-carbon optimization, and verifies the rationality of the tiered carbon trading mechanism. Y. Li et al. [29] introduced a tiered carbon trading mechanism, refined the two-stage operation process of power-to-gas conversion [30,31], and proposed an operational strategy for a low-carbon integrated energy system that includes adjustable heat-to-power ratio and hydrogen fuel cells. Few of the aforementioned studies simultaneously incorporate carbon trading and comprehensive demand response into the integrated energy system. While wind and solar power generation have the advantage of zero carbon emissions, their volatility increases the burden of rotating backup resources for thermal power generation.
António Coelho et al. [32] constructed a low-carbon scheduling model, considering both carbon trading costs and energy procurement costs. In order to further reduce the system’s carbon emissions, Dominic Davis et al. [33] considered load response capabilities and proposes an electricity-heat-gas demand response model that includes tiered carbon trading. Peng, Q et al. [34] proposed an optimization model for IES operation, considering the weight of renewable energy integration responsibility, and comprehensively considering factors such as green certificate trading and renewable energy integration capacity, effectively increasing the proportion of green electricity and system economy. Furthermore, Luo, Z et al. [35] combined carbon emissions trading (CET) and green certificate trading (GCT) mechanisms and proposes an optimization model for the operation of an IES that includes joint trading of carbon and green certificates.
In summary, the above research has focused on the low-carbon optimization of integrated energy systems from two aspects: the carbon market and the green certificate market. However, it is necessary to combine the two in order to adapt to the multi-agent interaction in the transaction of IES. This paper proposes a multi-agent integrated energy trading strategy based on an interactive mechanism between carbon emissions and green certificates. The strategy not only efficiently improves the absorption rate of new energy, but it also simplifies the process of carbon trading and green certificate trading without destroying the effects of energy interaction. The main contributions are as follows:
  • Based on the tiered incentive-based carbon trading mechanism, an interactive mechanism between carbon emissions and green certificates was proposed that establishes clear ownership of green rights. Furthermore, the paper utilize the flexible characteristics of loads within the industrial park to develop a demand response model for integrated electricity, heat, and cooling energy;
  • A demand response integrated energy trading model that considers the interactive mechanism between carbon emissions and green certificates is established, with the objective of minimizing the system’s operational costs;
  • Four different scenarios were compared in the simulation case study, the interactive mechanism between green certificates and carbon emissions, combined with demand response, can effectively increase the rate of renewable energy integration while saving operational costs in trading model.

2. IES Optimization Operation Model

In order to minimize the operating cost of the system, this paper adopts the method of mixed integer linear programming problem, and formulates the optimal output plan of each cogeneration from the perspective of both supply and demand. Through this approach, the integrated energy system can be operated more efficiently, improving energy utilization efficiency and providing an effective pathway towards achieving sustainable energy development goals. The objective function is shown as follows: f C E T , i n represents the incremental carbon trading cost and the detailed calculation is given by Equation (21)
min F = C g r i d + C n g + C e + C b + C d + f C E T , i n ,
where several different cost factors are considered, including the electricity purchase cost C g r i d , generation cost C n g , battery charge–discharge loss cost C e , operation cost C b , and equipment operation maintenance cost C d . These cost factors have significant impacts on the economics and reliability of the power system and need to be comprehensively considered.
C g r i d = i = 1 24 P g r i d t c r b t ,
C n g = i = 1 24 c g a s t P G T t L H V g a s ,
C e = i = 1 24 c e e s t U b t , c h r t + U b t , d i s t ,
C b = i = 1 24 c g a s t H G B t η G B ,
C d = i K i P i .
where, within the time period t, P g r i d t represents the purchased power of the Regional Integrated Energy System (RIES), and c r b t represents the unit purchase price of electricity. c g a s t represents the unit price of natural gas for purchase, and c e e s t represents the unit cost of battery losses. Here, L H V g a s denotes the lower heating value of natural gas, typically taken as 9.78 kWh/m 3 . The unit operation and maintenance cost of equipment i is denoted by K i , and P i represents the input power within the time period t.

2.1. Demand Response of Electrical Load

In order to achieve smooth transition of the electrical load, this study chooses to adopt a price-based demand response strategy. In price-based demand response models, a quantity–price elasticity matrix method is used, which calculates the relationship between the electrical load and the rate of change in electricity price based on the quantity–price elasticity index. The quantity–price elasticity index is used to calculate the relationship between the electrical load and the rate of change in electricity price. The calculation is as follows:
m = Δ L L Δ c p c p 1 ,
where the elasticity coefficient index m , the pre-demand response electricity consumption L, the electricity price c p , and the relative increments in electricity consumption and price Δ L and Δ c p play important roles. By calculating the ratio between Δ L and L, the quantity–price elasticity matrix η e can be constructed, representing the responsiveness of electricity consumption to changes in electricity price. Specifically, when the elasticity coefficient index m is larger, the changes in electricity price will have a greater impact on electricity consumption. Conversely, when the ratio between Δ L and L is smaller, it indicates a higher sensitivity of electricity consumption to changes in electricity price, meaning that electricity consumption is more likely to be influenced by electricity price. Therefore, the quantity–price elasticity matrix method allows for a better assessment of the demand response capability of the electrical load, thereby optimizing the operational efficiency of the integrated energy system.
η e = η 11 η 12 η 1 m η 21 η 22 η 2 m η n 1 η n 2 η n m ,
η i i = Δ L i L i Δ c p i c p i 1 ,
η i j = Δ L i L i Δ c p j c p j 1 ,
where η i i and η i j represent the own-elasticity coefficient and cross-elasticity coefficient, respectively. L i and Δ L i represent the responsive electricity consumption in period i and its relative increment. c p i , Δ c p i and c p j , Δ c p j represent the electricity price and its relative increment in periods i and j. User-side electrical load includes both fixed load and transferable load, which can be expressed as:
P t = P f e l t + P s e l t = L i + L i η e Δ c p i c p i ,
where the fixed load and transferable load are represented by P s e l t and P f e l t , respectively, which, respectively, denote the non-transferrable load and adjustable electrical load at time t. For the transferable load, users can autonomously adjust their electricity consumption based on price information, thereby achieving control over the power and timing of electricity usage. Both types of loads must adhere to certain constraints with the safety and stability of the system. The constraints that both loads need to satisfy are as follows:
0 P s e l t P s e l m a x ,
t = 1 T P sel t Δ t = W sel .
where P s e l m a x represents the upper limit of the transferable load within time period t, while T denotes the number of time periods included in the demand response. Specifically, the total amount of transferable load remains constant before and after the demand response. The time step, denoted as Δ t , is set to 1 h. Considering the significant magnitude of load variations, this study sets the transferable load to be 20% of the total load.

2.2. Demand Response of Heat/Cooling Load

In the demand response scheme for heat load, the essential attributes of thermal load lie in its perceptual fuzziness and time delay. Therefore, in order to achieve demand response control over thermal load, it is necessary to fully consider characteristics such as temperature change rate and time delay. During the comfort period, changing the water temperature has minimal impact on users, so the acceptable range of water temperature for users can be represented by θ h , m a x and θ h , m i n . Additionally, during the demand response control period, it is necessary to take a comprehensive view of the water usage habits and demands for different users and develop corresponding strategies and measures to maximize the satisfaction of users’ water needs, as shown below [35]:
H min t H t H max t H min t = γ ρ w V c t θ h , min θ h , i n Δ t H max t = γ ρ w V c t θ h , max θ h , in Δ t ,
where the thermal load power H t is an important parameter describing the thermal load, with upper and lower limits denoted as H max t and H min t , respectively. Taking into account the specific heat capacity γ and density ρ w of water, and disregarding the influence of water temperature variations, which are set as constants with parameters specified as 1.1667 × 10 3 kWh/kg· ° C and 1000 kg/m 3 , respectively.
The demand response principle for cooling load is similar to that for thermal load. Considering user sensitivity to cooling load, θ c , max and θ c , min are used to limit the range of room temperature. At the same time, the demand response control for cooling load should also be maintained within a specific interval.
Q min t Q t Q max t Q min t = θ out t θ c , min Δ t / R d Q max t = θ out t θ c , max Δ t / R d ,
where Q t denotes the cooling load power during time period t, while Q max t and Q min t represent the upper and lower limits of the cooling load power within time period t. θ out t represents the outdoor temperature. To describe the characteristics of the cooling load, a heat resistance R d is introduced, with a value of 18 ° C/kW, indicating the magnitude of indoor temperature change caused by a unit load variation.
The flexible heat/cooling load in this study can be expressed as:
H t = H fhl t + H shl t Q t = Q fhl t + Q shl t ,
where Q fhl t and H fhl t represent the uncontrollable heat and cooling loads, while Q shl t and H shl t represent the transferable heat and cooling load. In addition to considering power balance, these two variables need to satisfy the following constraints:
0 H shl t H shl m a x 0 Q shl t Q shl m a x ,
t = 1 T H shl t Δ t = W h , s h l t = 1 T Q shl t Δ t = W q , s h l ,
where H shl m a x and Q shl m a x represent the upper limits of the transferable thermal and cooling load during time period t, while W h , s h l and W q , s h l represent the total amount of transferable thermal and cooling load over T time periods. This means that the total amount of transferable load remains constant before and after demand response. Considering the high reliability requirements for thermal/cooling load operation, the transferable load is set to be 10% of the total load.
The proposed demand response model in this section can optimize and adjust the electrical, cooling, and heating loads. By utilizing energy conversion devices in integrated energy systems, coupling and complementarity between electrical, cooling, and heating loads can be achieved, improving the operational efficiency of the system. Furthermore, it also contributes to the achievement of sustainable energy development goals.

3. RIES Trading Strategy Based on Carbon Emission/Green Certificate Equivalent Interaction

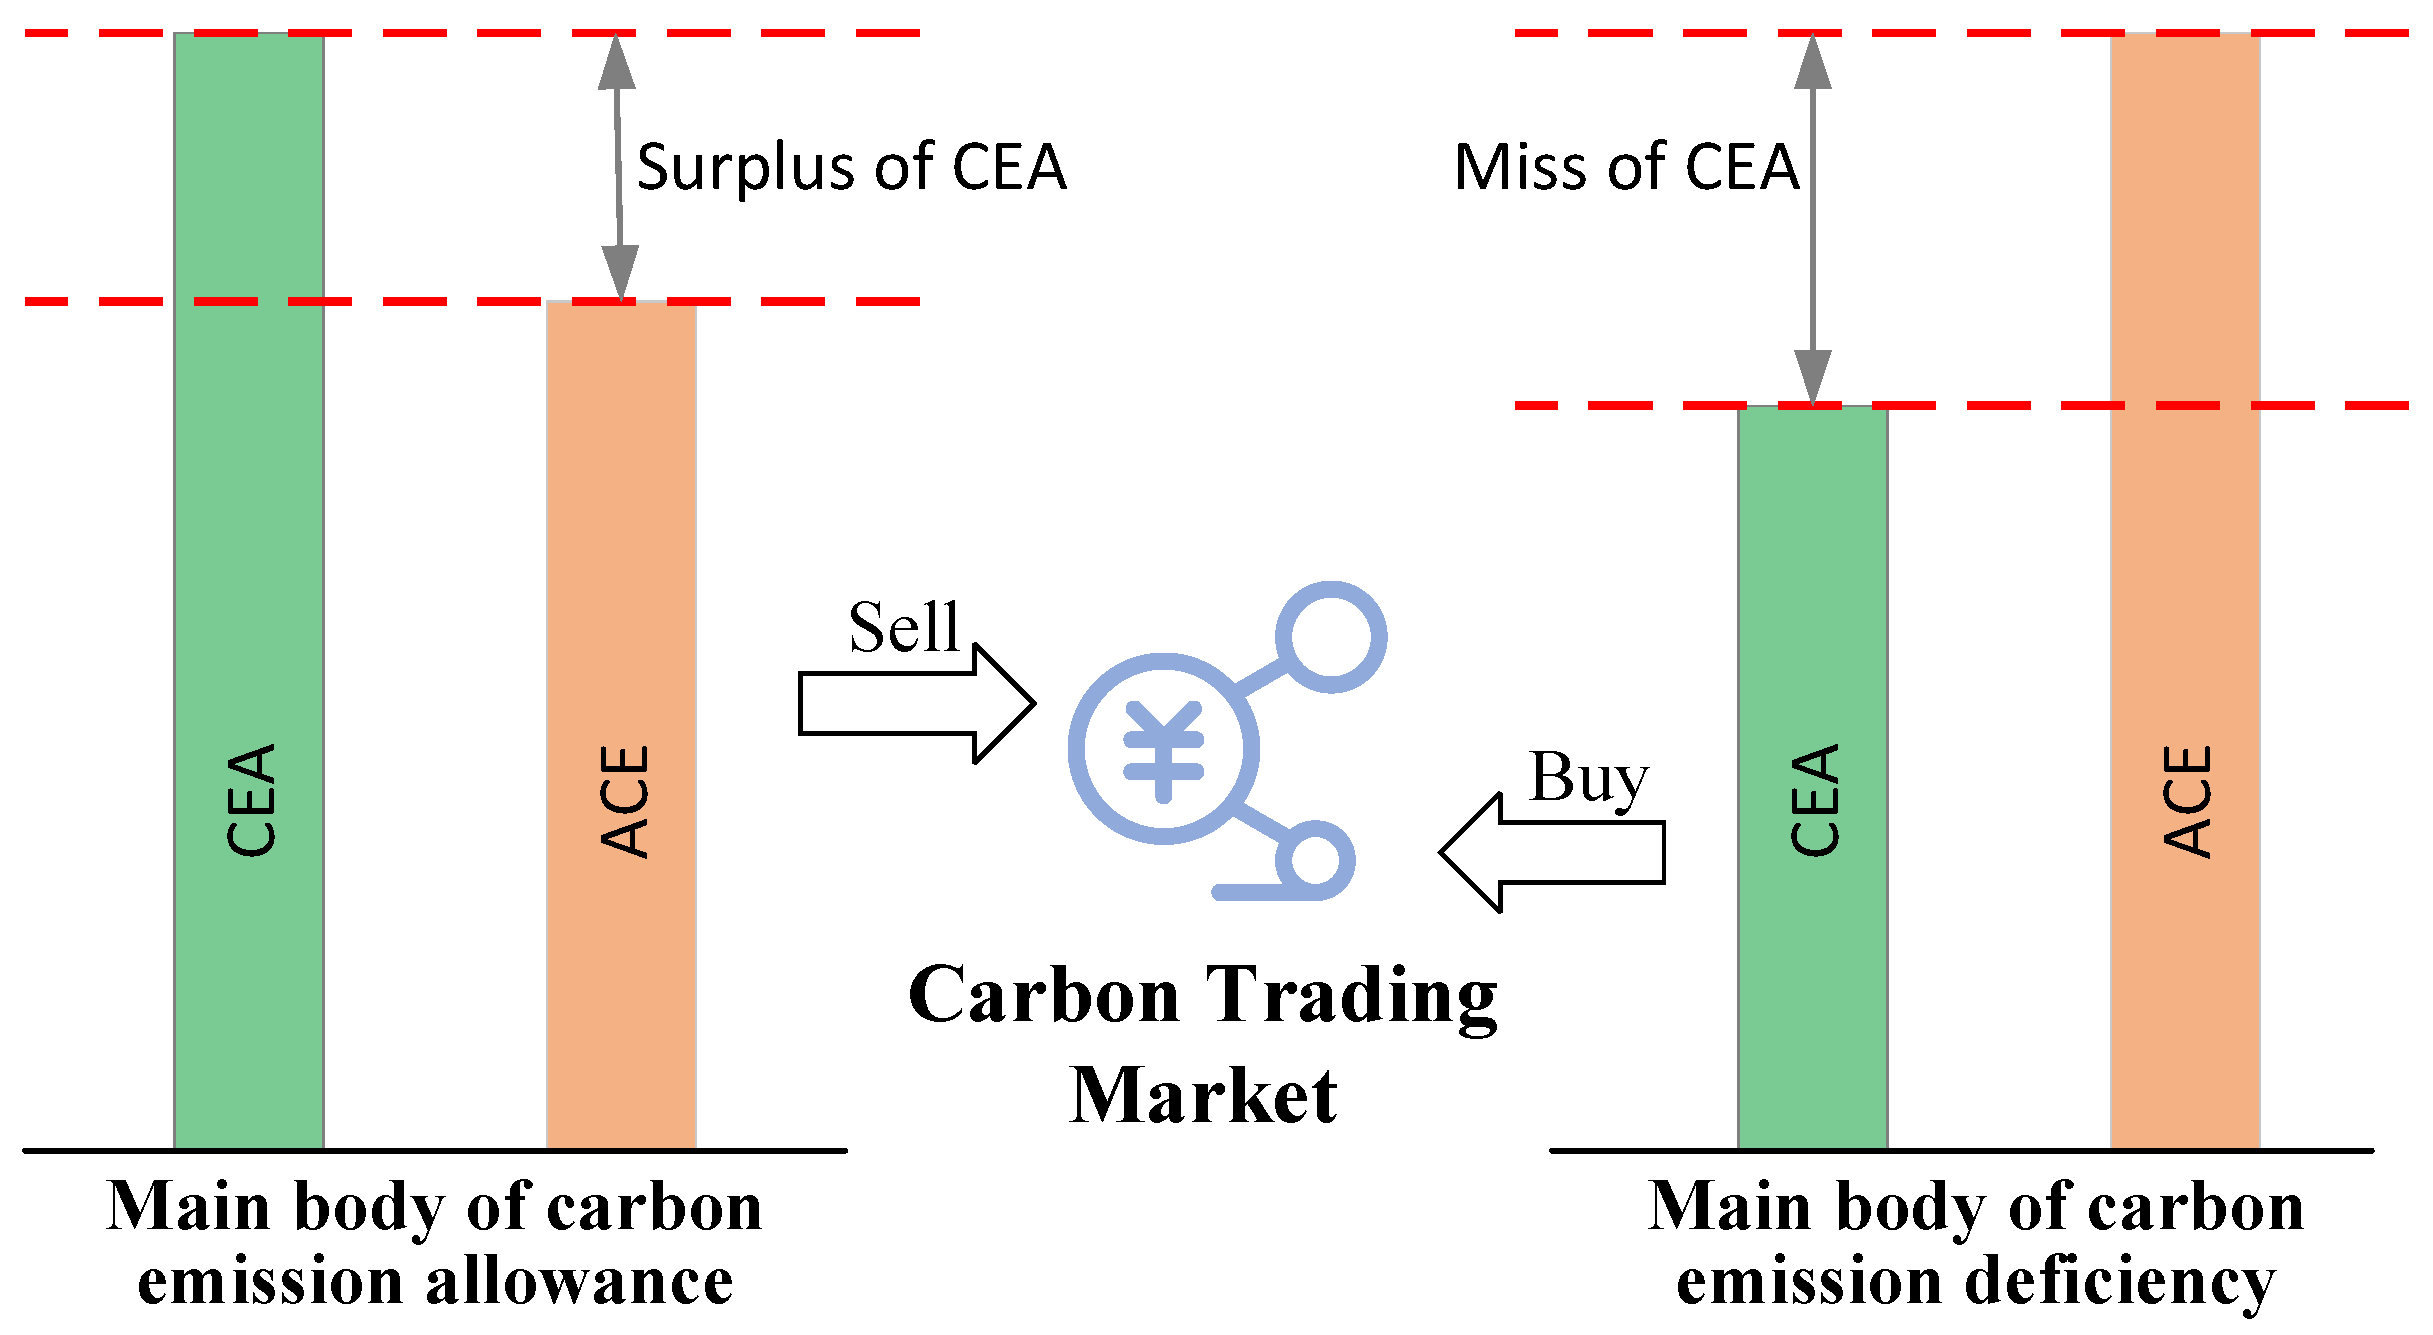
3.1. Tiered Incentive Carbon Trading Market Mechanism and Emission Operators

Carbon emissions trading is a derivative product in the energy trading market, where the fundamental idea is to define carbon emissions as commodities for trading. Similar to the energy market, the trading activities in the carbon emissions trading market are regulated by government authorities or relevant institutions. The regulatory bodies formulate carbon trading rules and allocate carbon emission quotas to the system operators based on the characteristics of local energy trading. The operation of the carbon emissions trading market incentivizes the assessed entities to reduce carbon emissions by constructing and trading carbon emission rights. The working principle of the carbon trading market is illustrated in Figure 1. ACE and CEA represent actual carbon emissions and carbon emissions allocated, respectively.
Carbon emissions traders act as assessed entities in the market, calculating the carbon emissions within the system and comparing them to the allocated carbon emission quotas. If the system’s carbon emissions are below the quota, traders can sell carbon emission rights to generate revenue. Conversely, if the carbon emissions exceed the quota, traders are required to purchase carbon emission rights or pay fines.
In this study, we adopt the mechanisms of traditional carbon trading markets and introduce a tiered incentive-based carbon trading model. The specific formula is represented as follows:
E C O 2 = c c ( 1 + 2 μ ) E c h E p , E p E c h c c ( 1 + 2 μ ) h c c ( 1 + μ ) E c E p , E c h E p E c c c E p E c , E c < E p E c + h c c h + c c ( 1 + λ ) E p E c h , E c + h E p E c + 2 h c c ( 2 + λ ) h + c c ( 1 + 2 λ ) E p E c 2 h , E c + 2 h E p E c + 3 h c c ( 3 + 3 λ ) h + c c ( 1 + 3 λ ) E p E c 3 h , E c + 4 h E p .
where carbon emissions are divided into multiple intervals and different incentive coefficients μ and λ are applied to each interval, aiming to incentivize energy companies to reduce their carbon emissions. In the model, c c represents the carbon emissions trading price, E c represents the actual carbon emissions of IES, and h represents the length of intervals for different carbon emission values. Within a specific time period, when the actual carbon emissions are lower than the allocated carbon emission quota, and E C O 2 is negative, energy companies are allowed to sell their surplus carbon emission quotas for economic subsidies. On the other hand, if E C O 2 is positive, this requires energy companies to purchase carbon emission quotas or face penalties to compel them to reduce the total emissions. The introduction of this model helps strengthen the regulation and management of the carbon emissions trading market, while encouraging energy companies to actively respond to energy conservation and emission reduction initiatives, reduce carbon emissions, and promote sustainable development.

3.2. Carbon Emission/Green Certificate Equivalent Interaction Mechanism

The operator of the green certificate is responsible for processing all the information related to the integration of new energy into the power grid, as depicted in Figure 2. Both green certificates and carbon emission rights are derivative products in the energy market, and their respective operators receive and process information on regional energy interactions, transforming it into trading information for energy market derivatives. By examining Figure 1 and Figure 2, it can be observed that green certificate trading and carbon emission trading have similar commodity attributes, trading mechanisms, and transaction prices. However, the trading processes are organized by different institutions and conducted on different platforms, which increases organizational costs and complicates transaction completion.
Based on the background described above, this study establishes an equivalent interaction mechanism between carbon emission rights and green certificates. This mechanism transforms green certificates from mere certificates that align with environmental principles into valuable trading commodities. It provides system operators with more choices to participate in the market and enables them to operate integrated energy systems more flexibly. Under this mechanism, a comparative analysis of carbon emissions from different power generation methods can be conducted to analyze the carbon reduction behind the green certificates.
This interaction mechanism simplifies the process of energy market derivative trading and makes the green implications represented by trading certificates or carbon emission rights clearer. Specifically, the steps involved in this interaction are as follows:
(1)
To compare and analyze the carbon emissions of different power generation methods, carbon footprint, or carbon emission flow, methods are employed to calculate the carbon emissions.
(2)
An analysis is conducted to assess the carbon reduction potential embedded in green certificates. The carbon emissions from renewable energy generation and fossil fuel-based power generation are compared to determine the respective carbon reduction implied by different types of green certificates. The calculations are as follows:
E g c , j = D a l l , t D a l l , j ,
where E g c , j represents the carbon reduction potential reflected by the j-th type of green certificate. Meanwhile, D a l l , t and D a l l , j represent the carbon dioxide equivalent emissions associated with coal-powered energy supply and renewable energy supply, respectively, throughout their respective industry value chains.
(3)
The operation of the certificate trading platform requires the determination of ownership of green attributes. Once the seller sells green certificates on the certificate subscription platform, the environmental attributes represented by the certificates will be transferred to the buyer. However, when calculating the seller’s carbon emissions and the proportion of green electricity, the corresponding information embedded in the sold green certificates needs to be deducted to avoid duplicate calculations of information. Similarly, when assessing the buyer, appropriate adjustments need to be made. The value of green certificates is only valid during their assessment period. At this time, new energy enterprises do not directly participate in carbon trading. Instead, the buyers of green certificates participate in carbon trading by purchasing green certificates.
(4)
Participating in market transactions. Within the same system, renewable energy can offset a portion of carbon emissions, thereby integrating green certificate trading and carbon trading into one process. The carbon cost of the system is as follows:
f C E T , i n = α C E T i Ω G D i i Ω G Q i D I D I = j = 1 n E g c , j N G C , n e .
where f C E T , i n represents the incremental carbon trading cost when considering the interaction; D i and Q i represent the actual carbon emissions and carbon quota of unit i, respectively, while D I represents the carbon offset from green certificates. The IES trading framework with carbon trading and green certificate trading is illustrated in Figure 3.
Users, new energy suppliers, and traditional energy suppliers all trade energy through regional integrated energy service providers as participants in the integrated energy system trading. While meeting user demand for energy, energy suppliers must also fulfill the carbon quota and new energy consumption responsibility weight assessment through carbon trading and green certificate trading. At this point, users’ energy consumption costs are ideal, and system operation costs are negligible. In addition to electricity trading, new energy suppliers participate directly in green certificate trading and indirectly in the carbon trading market via green certificate traders, resulting in a win–win situation for environmental protection and the economy.

4. Simulation Analysis

4.1. Example Data

In order to verify the effectiveness of the trading model proposed in this paper in terms of reducing operating costs, using the winter electricity usage statistics of a town in northern China as an example. MATLAB 2020b was used to simulate the computer on a host with Intel(R) Core(TM) i5-8500 CPU @ 3.00 GHz (six CPUs), 3.0 GHz, and 16 G memory. The model coefficients of the IES are shown in Table 1, and the power parameters are shown in Table 2 [35,36,37].

4.2. Analysis of the Influence of Different Scheduling Models on Simulation Results

The purpose of this paper is to explore the feasibility and advantages of the comprehensive energy trading model under the carbon emission/green certificate equivalent interaction. In order to verify the validity of this model, the following four trading schemes are compared.
Scheme 1. Considering the integrated demand response of electricity, heat, cooling multi-energy coupling energy trading, did not consider carbon trading and green certificate trading.
Scheme 2. Considering the fixed price carbon emission/green certificate equivalent trading and comprehensive demand response of electricity, heat, and cooling multi-energy coupling energy trading.
Scheme 3. Consider tiered carbon trading, green certificate trading and comprehensive demand response of electricity, heat, and cooling multi-energy coupling energy trading.
Scheme 4. A multi-energy complementary optimization model of electricity, heat, and cooling based on carbon emission/green certificates equivalent trading and integrated demand response model considering the reward and punishment tiered price.
The operating costs of the four schemes are shown in Table 3.
The trading results of Scheme 1 are shown in Figure 4, Figure 5 and Figure 6. In Scheme 1, there is a deviation in the actual output of renewable energy compared to the forecast values, as shown in Figure 7. Scheme 1 adjusts the system’s comprehensive demand response based on the deviation in renewable energy output shown in Figure 8. The energy trading results are presented in Figure 4, Figure 5 and Figure 6. The demand response results are illustrated in Figure 4. Scheme 1 takes into account the comprehensive demand response on the load side, allowing users to adjust their electricity, heat, and cooling demand based on energy price information to reduce energy costs. From 0:00 to 8:00, the electricity demand decreases due to the increase in electricity price caused by the lower actual output of renewable energy compared to the forecast values. However, due to the presence of transferable load in the system, the electricity load is shifted from 0:00 to 8:00 to the period from 8:00 to 22:00 when the electricity price is relatively low. Similarly, the heat and cooling loads adjust their energy demand based on energy prices, but further details are not elaborated here.
The energy trading results of Scheme 2 are presented in Figure 9, Figure 10 and Figure 11. Compared to Scheme 1, Scheme 2 incorporates a conventional carbon emissions and green certificates equivalent trading mechanism, which does not involve a tiered rewards and penalties system, into the energy trading model. Since gas turbines and gas boilers have lower carbon emissions, increasing their output is equivalent to saving costs in carbon trading and improving the economic efficiency of system operations. Based on this consideration, the output of units with lower carbon emissions, such as gas turbines and gas boilers, is increased. It can be observed that by introducing the interaction mechanism of carbon emissions and green certificates with equivalent values into the framework of integrated energy trading, the carbon emissions of the system can be reduced from a cost perspective, resulting in cost savings in the operation of the comprehensive energy system.
The energy trading results of Scheme 3 are shown in Figure 12, Figure 13 and Figure 14. Compared to Scheme 2, Scheme 3 improves the conventional carbon trading mechanism by introducing a tiered carbon trading mechanism with punitive measures, aiming to further incentivize decisions that favor lower carbon emissions. By comparing the cost composition and carbon emissions shown in Table 3, it is found that the introduction of a carbon trading mechanism can reduce the system’s transaction costs. This is because clean energy generation has green attributes, can obtain green certification, and does not consume carbon emission quotas. Even if the price of clean energy generation is slightly higher than that of conventional electricity, the system will prioritize the use of clean energy, thereby reducing the proportion of non-green electricity consumption.
The energy trading results of Scheme 4 are illustrated in Figure 15, Figure 16 and Figure 17. Comparing Scheme 2 and Scheme 4 from an environmental perspective, the tiered carbon emissions and green certificates equivalent trading mechanism with rewards and penalties can further reduce carbon emissions and promote the integration of renewable energy. By comparing Scheme 3 and Scheme 4, it can be observed that the impact of the tiered rewards and penalties carbon emissions and green certificates equivalent trading mechanism on the energy trading results is minimal and can be almost negligible. Under this premise, the tiered rewards and penalties carbon emissions and green certificates equivalent trading mechanism capitalizes on the similarity of carbon emission quotas and green certificates properties and trading processes. It simplifies the trading institutions, streamlines the trading process, clarifies the green attributes implied by energy market derivatives, and, in conjunction with the tiered rewards and penalties system, further incentivizes the use of green electricity and reduces carbon emissions from a cost perspective. Therefore, compared to other scenarios, Scheme 4 offers the most advantages.
In conclusion, the introduction of a carbon trading mechanism can achieve the purpose of high efficiency of clean energy and the loss of carbon emissions. The tiered rewards and penalties carbon trading mechanism, in combination with green certificate trading through equivalent interactions, and can further incentivize decisions that favor lower carbon emissions in the integrated energy trading process. The carbon emissions and green certificates equivalent mechanism has minimal impact on the energy trading results but can streamline the trading process, reduce data processing, and clarify the environmental attributes behind energy, providing a new reference for trading energy market derivatives.

5. Conclusions

In this study, a carbon trading mechanism based on tiered rewards and penalties is proposed, which establishes an interactive mechanism for carbon emissions and green certificates with equivalent values to clarify the ownership of green rights. A comprehensive energy demand response model is developed by utilizing the flexible characteristics of loads in the industrial park, including electricity, heat, and cooling demands. Finally, a demand response integrated energy trading model considering the interaction mechanism of carbon emissions and green certificates with equivalent values is established, aiming to minimize the system operating costs. Four scenarios are compared, including the joint equivalent interaction of carbon emissions and green certificates, as well as separate trading of the two. The simulation results demonstrate a 4% reduction in operating costs and an 11.4% decrease in carbon emissions, thus confirming the efficacy the model. The findings indicate that the tiered rewards and penalties mechanism for the interaction of green certificates and carbon emissions can simplify the trading process of energy market derivatives while ensuring minimal changes in the results of comprehensive energy trading, thereby clarifying the attribution of green value. Due to the short time scale of energy trading and the long time scale of carbon trading and green certificate trading, the mixed time scale trading model of the three coupling needs to be further studied.

Author Contributions

J.T. conceived the idea for the manuscript and B.H. (Bonan Huang), Q.W., P.D., Y.Z. and B.H. (Bangpeng He) wrote the manuscript. All authors have read and agreed to the published version of the manuscript.

Funding

National Natural Science Foundation of China under Grants (52377079); Liaoning Revitalization Talents Program under Grant (XLYC2007181).

Data Availability Statement

Data are contained within the article.

Conflicts of Interest

The authors declare no conflict of interest.

References

  1. Hussain, H.M.; Narayanan, A.; Nardelli, P.H.J.; Yang, Y. What is Energy Internet? Concepts, Technologies, and Future Directions. IEEE Access 2020, 8, 183127–183145. [Google Scholar] [CrossRef]
  2. Wang, Y.; Liang, B.; Li, D.; Zheng, H.; Lei, Y.; Teng, H.; Altaf, A.R. A Comprehensive Assessment of Clean Coal Fuels for Residential Use to Replace Bituminous Raw Coal. Energies 2023, 16, 1910. [Google Scholar] [CrossRef]
  3. Rehman, A.U.; Zhao, T.; Muhammad, I.; Rasheed, S.; Shah, R.; Altaf, A.R.; Zhang, F.; Yun, S. MgCl2-MXene based nanohybrid composite for efficient thermochemical heat storage application. J. Energy Storage 2023, 59, 106509. [Google Scholar] [CrossRef]
  4. Khan, A.R.; Wang, W.; Altaf, A.R.; Shaukat, S.; Zhang, H.J.; Rehman, A.U.; Jun, Z.; Peng, L. Facial Synthesis, Stability, and Interaction of Ti3C2Tx@PC Composites for High-Performance Biocathode Microbial Electrosynthesis Systems. ACS Omega 2023, 8, 29949–29958. [Google Scholar] [CrossRef]
  5. Hussain, S.M.S.; Nadeem, F.; Aftab, M.A.; Ali, I.; Ustun, T.S. The Emerging Energy Internet: Architecture, Benefits, Challenges, and Future Prospects. Electronics 2019, 8, 1037. [Google Scholar] [CrossRef]
  6. Li, Y.; Gao, D.W.; Gao, W.; Zhang, H.; Zhou, J. A Distributed Double-Newton Descent Algorithm for Cooperative Energy Management of Multiple Energy Bodies in Energy Internet. IEEE Trans. Ind. Inform. 2021, 17, 5993–6003. [Google Scholar] [CrossRef]
  7. Schick, C.; Klempp, N.; Hufendiek, K. Role and Impact of Prosumers in a Sector-Integrated Energy System with High Renewable Shares. IEEE Trans. Power Syst. 2022, 37, 3286–3298. [Google Scholar] [CrossRef]
  8. Li, Y.; Zhang, H.; Liang, X.; Huang, B. Event-Triggered-Based Distributed Cooperative Energy Management for Multienergy Systems. IEEE Trans. Ind. Inform 2019, 15, 2008–2022. [Google Scholar] [CrossRef]
  9. Ntomaris, A.V.; Bakirtzis, A.G. Stochastic Scheduling of Hybrid Power Stations in Insular Power Systems with High Wind Penetration. IEEE Trans. Power Syst. 2016, 31, 3424–3436. [Google Scholar] [CrossRef]
  10. Huang, B.; Li, Y.; Zhan, F.; Sun, Q.; Zhang, H. A Distributed Robust Economic Dispatch Strategy for Integrated Energy System Considering Cyber-Attacks. IEEE Trans. Ind. Inform. 2022, 18, 880–890. [Google Scholar] [CrossRef]
  11. Huang, B.; Liu, L.; Zhang, H.; Li, Y.; Sun, Q. Distributed Optimal Economic Dispatch for Microgrids Considering Communication Delays. IEEE Trans. Syst. Man Cybern. 2019, 49, 1634–1642. [Google Scholar] [CrossRef]
  12. Mohammadi, M.; Noorollahi, Y.; Mohammadi-ivatloo, B.; Hosseinzadeh, M.; Yousefi, H.; Khorasani, S.T. Optimal management of energy hubs and smart energy hubs-A review. IEEE Trans. Ind. Inform. 2018, 89, 33–50. [Google Scholar] [CrossRef]
  13. Li, Y.; Gao, D.W.; Gao, W.; Zhang, H.; Zhou, J. Double-Mode Energy Management for Multi-Energy System via Distributed Dynamic Event-Triggered Newton-Raphson Algorithm. IEEE Trans. Smart Grid 2020, 11, 5339–5356. [Google Scholar] [CrossRef]
  14. Li, Y.; Wang, J.; Wang, R.; Gao, D.W.; Sun, Q.; Zhang, H. A Switched Newton–Raphson-Based Distributed Energy Management Algorithm for Multienergy System Under Persistent DoS Attacks. IEEE Trans. Autom. 2022, 19, 2985–2997. [Google Scholar] [CrossRef]
  15. Li, Y.; Li, T.; Zhang, H.; Xie, X.; Sun, Q. Distributed Resilient Double-Gradient-Descent Based Energy Management Strategy for Multi-Energy System Under DoS Attacks. IEEE Trans. Netw. Sci. Eng. 2022, 9, 2301–2316. [Google Scholar] [CrossRef]
  16. Teng, F.; Zhang, Y.; Yang, T.; Li, T.; Xiao, Y.; Li, Y. Distributed Optimal Energy Management for We-Energy Considering Operation Security. IEEE Trans. Netw. Sci. Eng. 2023. [Google Scholar] [CrossRef]
  17. Ehjaz, M.; Iqbal, M.; Zaidi, S.S.H.; Khan, B.M. A Novel Scheme for P2P Energy Trading Considering Energy Congestion in Microgrid. IEEE Access 2021, 9, 147649–147664. [Google Scholar] [CrossRef]
  18. Apostolopoulou, D.; Gross, G.; Güler, T. Optimized FTR Portfolio Construction Based on the Identification of Congested Network Elements. IEEE Trans. Power Syst. 2013, 28, 4968–4978. [Google Scholar] [CrossRef]
  19. Bautista, G.; Quintana, V.H. Screening and mitigation of exacerbated market power due to financial transmission rights. IEEE Trans. Power Syst. 2005, 20, 213–222. [Google Scholar] [CrossRef]
  20. Goyat, R.; Kumar, G.; Conti, M.; Devgun, T.; Saha, R.; Thomas, R. BENIGREEN: Blockchain-Based Energy-Efficient Privacy-Preserving Scheme for Green IoT. IEEE Internet Things J. 2023, 10, 16480–16493. [Google Scholar] [CrossRef]
  21. Ashley, M.J.; Johnson, M.S. Establishing a Secure, Transparent, and Autonomous Blockchain of Custody for Renewable Energy Credits and Carbon Credits. IEEE Eng. Manag. Rev. 2018, 46, 100–102. [Google Scholar] [CrossRef]
  22. Kumar, A.; Srivastava, S.C.; Singh, S.N. Congestion management in competitive power market: A bibliographical survey. Electric. Power Syst. Res. 2005, 76, 153–164. [Google Scholar] [CrossRef]
  23. Xu, Y.; Liao, Q.; Liu, D.; Tian, Y.; Chen, Y.; Chen, W. A Two-Layer Integrated Energy Planning Method Considering Active Management Measures in Market Environment. Autom. Electr. Power Syst. 2018, 18, 114–122. [Google Scholar]
  24. Nolan, S.; O’Malley, M. Challenges and barriers to demand response deployment and evaluation. Appl. Energy 2015, 152, 1–10. [Google Scholar] [CrossRef]
  25. Mitridati, L.; Kazempour, J.; Pinson, P. Heat and electricity market coordination: A scalable complementarity approach. Eur. J. Oper. Res. 2020, 283, 1107–1123. [Google Scholar] [CrossRef]
  26. Hou, J.Y.; Yuan, Z.; Wang, W.Q.; He, S. Optimization method of wind power consumption based on thermal storage tanks against the background of stepped carbon trading. Front. Energy Res. 2023, 10, 1050641. [Google Scholar] [CrossRef]
  27. Shabanpour-Haghighi, A.; Seifi, A.R. An Integrated Steady-State Operation Assessment of Electrical, Natural Gas, and District Heating Networks. IEEE Trans. Power Syst. 2016, 31, 3636–3647. [Google Scholar] [CrossRef]
  28. Feng, G.; Ge, Y.; Han, L.; Li, Y.; Gao, W.; Zhou, T. Market mechanism involving Carbon Trading of Integrated Energy System based on Stackelberg game. In Proceedings of the 2023 IEEE 6th International Electrical and Energy Conference (CIEEC), Hefei, China, 12–14 May 2023; pp. 1190–1195. [Google Scholar]
  29. Li, Y.; Tang, W.; Wu, Q. Modified Carbon Trading Based Low-carbon Economic Dispatch Strategy for Integrated Energy System with CCHP. In Proceedings of the 2019 IEEE Milan PowerTech, Milan, Italy, 23–27 June 2019; pp. 1–6. [Google Scholar]
  30. Teng, H.; Altaf, A.R. Elemental mercury (Hg0) emission, hazards, and control: A brief review. J. Hazard. Mater. Adv. 2022, 5, 100049. [Google Scholar] [CrossRef]
  31. Altaf, A.R.; Teng, H.; Zheng, M.; Ashraf, I.; Arsalan, M.; Rehman, A.U.; Gang, L.; Pengjie, W.; Yongqiang, R.; Xiaoyu, L. One-step synthesis of renewable magnetic tea-biochar derived from waste tea leaves for the removal of Hg0 from coal-syngas. J. Environ. Chem. Eng. 2021, 9, 105313. [Google Scholar] [CrossRef]
  32. Coelho, A.; Iria, J.; Soares, F. Network-secure bidding optimization of aggregators of multi-energy systems in electricity gas and carbon markets. Appl. Energy 2021, 301, 117460. [Google Scholar] [CrossRef]
  33. Davis, D.; Brear, M.J. Decarbonising Australia’s National Electricity Market and the role of firm, low-carbon technologies. J. Clean. Prod. 2022, 373, 133757. [Google Scholar] [CrossRef]
  34. Peng, Q.; Zhou, X.; Yang, R. Design of Coordination and Balance Mechanism between National Green Power Certificate Trading Market and Provincial Day-ahead Power Market. Power Syst. Technol. 2020, 44, 2565–2571. [Google Scholar]
  35. Luo, Z.; Qin, J.H.; Liang, J.Y.; Shen, F.; Liu, H.Z.; Zhao, M.; Wang, J.H. Day-ahead Optimal Scheduling of Integrated Energy Systems with Carbon-Green Certificate Joint Trading Mechanism. Electr. Power Autom. Equip. 2021, 41, 248–255. [Google Scholar]
  36. Li, T.; Chen, L.; Jensen, C.S.; Pedersen, T.B.; Gao, Y.; Hu, J. Evolutionary Clustering of Moving Objects. In Proceedings of the 2022 IEEE 38th International Conference on Data Engineering (ICDE), Kuala Lumpur, Malaysia, 9–12 May 2022; pp. 2399–2411. [Google Scholar]
  37. Li, T.; Huang, R.; Chen, L.; Jensen, C.S.; Pedersen, T.B. Compression of Uncertain Trajectories in Road Networks. In Proceedings of the 46th International Conference on Very Large Data Bases, Online, 31 August–4 September 2020; Volume 13, pp. 1050–1063. [Google Scholar]
Figure 1. Schematic diagram of carbon trading principle.
Sustainability 15 15766 g001
Figure 2. Schematic diagram of green certificate trading principle.
Sustainability 15 15766 g002
Figure 3. Schematic diagram of regional integrated energy system dispatching framework.
Sustainability 15 15766 g003
Figure 4. Electricity, heat and cool balance scheduling results of Scheme 1. (a) Electric load. (b) Heat load. (c) Cooling load.
Sustainability 15 15766 g004
Figure 5. Battery SOC of Scheme 1.
Sustainability 15 15766 g005
Figure 6. Hot storage tanks surplus capacity percentage of Scheme 1.
Sustainability 15 15766 g006
Figure 7. Comparison of actual values and predictive values of WT and PV.
Sustainability 15 15766 g007
Figure 8. Customer energy use curve before and after demand response. (a) Electric load. (b) Heat load. (c) Cooling load.
Sustainability 15 15766 g008
Figure 9. Electricity, heat, and cool balance scheduling results of Scheme 2. (a) Electric load. (b) Heat load. (c) Cooling load.
Sustainability 15 15766 g009
Figure 10. Battery SOC of Scheme 2.
Sustainability 15 15766 g010
Figure 11. Hot storage tanks surplus capacity percentage of Scheme 2.
Sustainability 15 15766 g011
Figure 12. Electricity, heat and cool balance scheduling results of Scheme 3. (a) Electric load. (b) Heat load. (c) Cooling load.
Sustainability 15 15766 g012
Figure 13. Battery SOC of Scheme 3.
Sustainability 15 15766 g013
Figure 14. Hot storage tanks surplus capacity percentage of Scheme 3.
Sustainability 15 15766 g014
Figure 15. Electricity, heat and cool balance scheduling results of Scheme 4. (a) Electric load. (b) Heat load. (c) Cooling load.
Sustainability 15 15766 g015
Figure 16. Battery SOC of Scheme 4.
Sustainability 15 15766 g016
Figure 17. Hot storage tanks surplus capacity percentage of Scheme 4.
Sustainability 15 15766 g017
Table 1. Parameters of model.
ParameterValueParameterValue
a3.58b66.2
c100 η G B 0.9
η A C 4 η G T 0.85
η A R 1.2 γ h 0.02
η b t , c h r 0.95 η b t , d i s 0.95
η t s t , c h r 0.98 η t s t , d i s 0.98
γ r e 0.35--
Table 2. Parameters of load.
ParameterValue/kWParameterValue/kW
H s h l m a x 160 P G T m a x 800
H G R m a x 1000 P b G r i d m a x 500
P s G r i d m a x 500 P b t , c h r m i n 0
P b t , c h r m a x 350 P b t , d i s m i n 0
P b t , d i s m a x 0.95 P s e l m a x 220
Q s h l m a x 150--
Table 3. Composition of operation cost in different scheme.
SchemeTotal Cost/RMBOperating Cost/RMBInteraction Cost/RMBCarbon Trading Cost/RMBCarbon Emission/Kg
118,996.7317,338.481658.25-13,959.40
218,647.6817,289.831357.85−289.5713,638.36
318,168.5617,076.541092.02−556.5313,151.44
417,638.1916,652.01986.18−535.3412,341.99
Disclaimer/Publisher’s Note: The statements, opinions and data contained in all publications are solely those of the individual author(s) and contributor(s) and not of MDPI and/or the editor(s). MDPI and/or the editor(s) disclaim responsibility for any injury to people or property resulting from any ideas, methods, instructions or products referred to in the content.

