Abstract
When urban rail transit is affected by interference, the fluctuation pattern of passenger flow undergoes mutation, which is not conducive to its operational safety and sustainable development. The more intense the mutation in the passenger flow, the greater the impact on the network and operations. Therefore, it is necessary to measure and evaluate the mutation degree of the urban rail transit passenger flow. In this study, we clarify the definition of the mutation degree of urban rail transit passenger flow and construct an evaluation index system for the mutation degree of passenger flow from two dimensions: horizontal mutation amplitude and vertical mutation amplitude. Based on the catastrophe theory, an evaluation model of the mutation degree was constructed. Using this evaluation method, abbreviated as CDCT, the level division of the mutation degree at different time intervals under different interference scenarios can be obtained, achieving a dynamic evaluation of the mutation degree of passenger flow. Finally, taking the passenger flow data of the Suzhou rail transit as an example, the mutational fluctuation of passenger flow affected by interference is analyzed, and the evaluation results of the mutation degree of passenger flow are obtained. The analysis results show that the CDCT evaluation method can better reflect the dynamic changes in the mutation degree throughout the process under the influence of the mutational passenger flow.
1. Introduction
Urban rail transit has become one of the main modes of transportation for the residents of many large cities. In March 2023, the passenger volume of urban rail transit in China reached 2.54 billion, an increase of 360 million or 16.6% compared to the previous month, and a month-on-month increase of 940 million or 58.9% [1]. The high demand for urban rail transit has led to higher requirements for the safety and stability of urban rail transit operations.
The passenger flow in urban rail transit is easily affected by interference, including sudden changes in the rail network itself, such as new rail line access or sudden operational interruptions, as well as the impact of the external environment on urban rail transit, such as seasons, working days, weather, etc. [2]. These factors can lead to fluctuations in the passenger flow, some of which are regular and continuous, whereas others are sudden and discontinuous. Mutational passenger flow refers to sudden and discontinuous fluctuations in passenger flow, and the mutation degree refers to the degree of difference in the numerical value and fluctuation amplitude between mutational passenger flow and normal passenger flow. The greater the mutation degree in the passenger flow, the greater the harm it poses to urban rail networks and operations [3]. Interference events that may cause mutational passenger flow mainly include sudden operational interruptions, extreme weather, sudden social events, new line access, and sudden events that are difficult to predict or control [4]. On 16 September 2013, the station signal of Beijing Subway Line 4 failed, and some transfer stations in the network were closed, resulting in a degraded operation mode of the entire network, affecting the operation for 2 h. On 4 March 2014, passengers at Xicun Station of Guangzhou Metro panicked because dangerous goods were brought to the metro, leading to a stampede accident, in which many people were injured and 21 trains were delayed. In 2018, due to signal equipment failure, Shanghai Metro Line 2 ran at a limited speed from the Science and Technology Museum to Guanglan Road, and the section from Longyang Road to Chuangxin Road was shut down, affecting operation for 5 h. On 20 July 2021, Zhengzhou Metro Line 5 was flooded after a rainstorm due to the poor emergency response of the subway company, resulting in 14 deaths, and the whole subway network was shut down for more than a month. In October 2021, more than half of the trains in Washington, DC, USA, were shut down due to train derailments multiple times. On 15 February 2023, three subway lines in Montreal, Canada, were suspended due to pepper spraying. In networked operations, passenger flow fluctuations caused by unexpected events may spread from affected points along the line to the entire network. If measures are not taken in a timely manner to effectively control the spread of abnormal passenger flow fluctuations, large-scale or even network-level outages may occur.
The passenger flow in the urban rail network constantly changes with the location of the station and time. For urban rail transit operators and managers, understanding the dynamics of passenger flow fluctuations and grasping the mutation degree of passenger flow can help them obtain the occurrence of interference events more accurately, determine the accurate degree of interference to the operational network, achieve more accurate coordination and arrangement, and reduce resource waste. Accurately assessing changes in passenger flow during emergencies can help reduce resource waste and ensure safe and efficient travel for passengers, thereby promoting the sustainability of joint development between people and the environment.
The remainder of this paper is organized as follows. Section 2 reviews the literature on passenger flow fluctuations, indicators of passenger flow fluctuation, and indicators of mutational passenger flow. Section 3 introduces the definition of the mutation degree of the passenger flow and constructs the evaluation indicators of the mutation degree. Section 4 presents an evaluation method for the mutation degree of the passenger flow based on catastrophe theory. Section 5 presents the collected data and analyzes the common rhythms of normal passenger flow and the characteristics of mutational passenger flow. Section 6 discusses the evaluation method of CDCT to obtain the evaluation results of the dynamic mutation degree of the urban rail network, and also discusses the evaluation results. Section 7 summarizes the conclusions and suggests future areas of study.
2. Literature Review
2.1. Studies on Passenger Flow Fluctuations
Passenger flow is constantly changing, and we refer to these changes as passenger flow fluctuations. Fluctuations in passenger flow bring more uncertainty to the operational organization of urban rail transit, and the operation companies need to continuously adjust the train operation management to adapt to these changes in passenger flow demand. If the passenger flow fluctuations exceed the threshold and the operational organization fails to adjust in a timely manner, there is a high possibility of safety incidents, such as overcrowding and stampede, passenger trip obstruction, etc. In addition to potentially affecting the safety and efficiency of passenger trips, it may also lead to passenger flow loss or resource waste for operation companies, affecting the economic benefits.
To obtain the fluctuation of passenger flow in a timely manner, researchers forecasted passenger flow based on the fluctuation patterns of historical data. Chen et al. [5] proposed an empirical mode decomposition (EMD) based on long short-term memory (LSTM) neural network model to predict short-term metro inbound passenger flow. Gallo et al. [6] proposed the use of Artificial Neural Networks (ANNs) to forecast metro passenger flow [7,8].
Some scholars have realized that compared with normal passenger flow, abnormal passenger flow fluctuations require more attention for the operation of urban rail transit [9,10]. To predict holiday passenger flow accurately, Liu et al. proposed an approach based on the modified LSSVM, in which an improved particle swarm optimization (IPSO) algorithm was developed to optimize the parameters [11]. Yuan et al. [12] combined the artificial fish swarm and improved particle swarm optimization (AFSA-PSO) algorithms, which not only predict the normal passenger flow accurately but also effectively identify and predict sudden large passenger flow. These scholars believe that different prediction models are suitable for different scenarios [13].
Mutational passenger flow is a special type of abnormal passenger flow that changes suddenly and irregularly and exceeds the safety threshold, posing greater harm to the security of urban rail transit [14]. Several scholars have recognized the importance of mutational passenger flow detection for safe operation in urban rail transit [15,16]. Xie et al. [17] proposed an optimized model for predicting mutational passenger flow caused by emergencies to prevent the risk caused by sudden overcrowding. Jing and Yin [4] proposed a method for tracking and predicting sudden changes in the passenger flow caused by emergencies. Feng et al. [18] developed a random coefficient model to predict the short-term passenger flow of urban rail transit that can cope with sudden increases in inflow. Wang et al. [19,20] developed a framework to detect and predict burst passenger flow, which can send warning signals ahead of time of the burst passenger inflow.
In addition to detecting and predicting burst passenger flow, some scholars have attempted to describe the fluctuation characteristics of the passenger flow. Sun et al. [21] obtained the spatial distribution of trips over the network, the temporal distribution of passenger entries at the line level, and station inflow/outflow imbalances by analyzing the AFC data of urban rail transit. Li et al. [22] established a fractal quantification method for measuring the fractal characteristics of passenger flow in a rail transit network.
2.2. Indicators of Catastrophe Passenger Flow
Although some studies have recognized that abnormal passenger flow fluctuations and mutational passenger flow exceeding the threshold have a significant impact on the safe operation of urban rail transit, few studies have evaluated the degree of the impact of mutational passenger flow [17,18,20]. Although there are many indicators to describe the fluctuation of passenger flow, they all describe the space–time distribution feature of passenger flow and lack a description of the mutation degree of passenger flow. Considering the significant impact of mutational passenger flow on the security of urban rail transit, Zhang believed that, in addition to predicting mutational passenger flow, it is also important to determine whether the status of passenger flow is anomalous [23]. Several studies attempted to describe the degree of damage caused by various events in urban rail networks. Guo et al. [24] proposed a method based on a combination of weight and cloud models to objectively evaluate the damage degree of urban rail transit. Xing et al. [25] realized that exceeding the threshold of passenger flow after social events would cause harm to urban rail transit; the authors further described the impact of mass passenger flow on urban rail transit and graded the impact of mass passenger flow. Su [26] identified the mutational passenger flow, analyzed its causes, and calculated the evaluation indicators of the coefficient of variation from four levels.
At present, there is a lack of systematic research on mutational passenger flow, and only a certain type of event is analyzed, such as mass passenger flow or sudden operation interruption. These events are essentially valued because they can cause anomalous fluctuations in passenger flow; however, in addition to these common events, there are also some hidden events and their harm to the safety of urban rail transit that have been ignored. Therefore, it is necessary to classify and study the events that cause anomalous fluctuations in passenger flow, thereby affecting the safety of urban rail transit. This study defines such passenger flow with anomalous fluctuations as mutational passenger flow.
The evaluation of mutational passenger flow in existing research still remains at the micro level and can only determine the impact and evaluate the risk level of mutational passenger flow at the station. At the macro level, evaluating mutational passenger flow can not only determine the mutation degree at a single station but also help to compare the mutation degree between stations, providing a reference for operation companies to prioritize scheduling arrangements in emergency situations.
To fill these knowledge gaps, this study was conducted to explore the characteristics of mutational passenger flow and to construct an evaluation method for the mutation degree of passenger flow. To describe the mutation degree of passenger flow accurately and comprehensively, we constructed evaluation indicators for the mutation degree of passenger flow based on the common rhythm of normal passenger flow. To achieve a dynamic evaluation of the mutation degree of passenger flow, we constructed an evaluation method for the mutation degree of passenger flow based on catastrophe theory, which is abbreviated as CDCT. We used the Suzhou Rail Transit (Urban Rail Transit in Suzhou, China) (SZRT) as an example to verify the applicability of the evaluation method of CDCT under actual interference events and proved that the evaluation method of CDCT could accurately describe the dynamic changes in the mutation degree when passenger flow was disturbed.
3. Definition of Mutation Degree of Passenger Flow and Construction of Evaluation Indicators
3.1. Definition of Mutation Degree of Passenger Flow
A mutation refers to the phenomenon of a system changing from one stable state to another state under the influence of external changing forces. A mutation is a phenomenon that differs from continuous or gradual changes. There are a large number of mutation phenomena in nature, such as cell division, biological variation, earthquakes, bridge collapses, etc.
When studying the passenger flow data of urban rail transit, we found that the evolution and fluctuation of passenger flow are continuous and gradual in most cases, but discontinuous and non-gradual mutation phenomena occur in some special situations, such as new rail line access, sudden operation interruptions, and sudden social incidents. Mutational passenger flow refers to passenger flows that exhibit discontinuous and non-gradual fluctuations. In the case of mutational passenger flow, the changing regularity of passenger flow is different from the usual, including the following: (1) suddenness: the sudden occurrence of changes without any intermediate stages; (2) multidirectional: changes reflected in multiple aspects and angles; and (3) stability: after a sudden change, the passenger flow tends to a certain stable state.
3.2. Construction of Evaluation Indicators
To evaluate the mutation degree of passenger flow on the study day, the fluctuation in passenger flow on the study day was compared with the fluctuation in passenger flow on the reference day, as shown in Figure 1. Assuming that the start time of the interference on the study day was and the end time of the interference was, after the interference event was eliminated, it took some time for the passenger flow to recover to a stable state, and the end time of the interference effect was Then:
where is the time range of the mutational passenger flow; is the duration of the interference occurrence; is the duration of the mutational passenger flow.
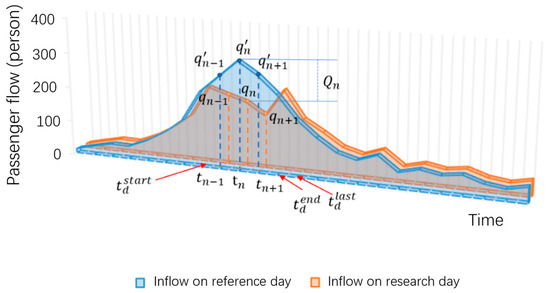
Figure 1.
Schematic diagram of mutational passenger flow.
Assuming time the evaluation index for the mutation degree of the passenger flow at time was constructed from two dimensions: vertical mutation amplitude and horizontal mutation amplitude.
- Indicators of Vertical Mutation Amplitude
The indicators of the vertical mutation amplitude refer to the degree of fluctuation in passenger flow on the research date compared to the reference date.
- Vertical Deviation of Passenger Flow
The vertical deviation of passenger flow is the offset value between the passenger flow on the research date in a certain period of time and the passenger flow on the reference date in the corresponding period of time. Considering that a decrease in passenger flow causes less impact and harm to the network than an increase in passenger flow during a continuous period, the difference in passenger flow for a decrease in passenger flow is multiplied by a correction factor to represent its offset value. The vertical deviation of the passenger flow is expressed as follows:
where is the passenger flow during period on the research date; is the passenger flow during period on the reference date; is the correction factor, .
- b.
- Vertical Deviation Rate of Passenger Flow
The vertical deviation rate of passenger flow is the ratio of the vertical deviation of passenger flow of a certain period to the passenger flow of the corresponding period on the reference date, which is expressed as follows:
- c.
- Cumulative Vertical Deviation
The cumulative vertical deviation refers to the cumulative value of the vertical deviation of the passenger flow from the start time of the interference to the research period . Considering that there may be a decrease in the cumulative value of the vertical deviation of the passenger flow, the cumulative value of this situation is multiplied by a correction factor. The cumulative vertical deviation is expressed as follows:
- d.
- Cumulated Vertical Deviation Rate
The cumulative vertical deviation rate refers to the time between the start time of the interference and the research period. is the ratio of the cumulative vertical deviation of passenger flow to the cumulative passenger flow on the reference date, which is the cumulative value of the vertical deviation rate of passenger flow and is expressed as follows:
- 2.
- Indicators of Horizontal mutation Amplitude
The indicators of the horizontal mutation amplitude refer to the amplitude of the change in passenger flow during a certain period of time compared to the previous period.
- Horizontal Change Rate of Passenger Flow
The horizontal change rate of the passenger flow refers to the rate of change in the passenger flow from the period to . Considering that the decrease in passenger flow has a smaller impact on the network security than the increase in passenger flow, the rate of change in passenger flow in the case of reduced passenger flow is multiplied by a correction factor. The horizontal change rate of the passenger flow is expressed as follows:
- b.
- Horizontal Deviation Rate of Passenger Flow
The horizontal deviation rate of the passenger flow refers to the difference in the horizontal change rate of the passenger flow between the study and reference days. When the horizontal change rate of passenger flow on the research day is smaller than the horizontal change rate of passenger flow on the reference day, there is a situation in which the increase in passenger flow is smaller than that on the reference date or a decrease in passenger flow, and the difference in horizontal change rate in this situation is multiplied by a correction factor to correct the phenomenon where the actual impact is smaller than the impact represented by the data. The horizontal deviation rate of the passenger flow is expressed as follows:
where is the difference in passenger flow on the study day between periods and ; is the difference in passenger flow on reference day between periods and .
- c.
- Cumulative Horizontal Deviation Rate
The cumulative horizontal deviation rate refers to the cumulative value of the horizontal deviation rate from the start time of interference to the research period and is expressed as follows:
4. Methodology
4.1. Catastrophe Theory
Many continuous and gradual changes in nature can be explained using calculus. However, many intermittent and sudden phenomena cannot be explained by classical calculus, such as volcano eruptions and house collapses caused by earthquakes. Catastrophe theory has been rapidly developed based on this. Catastrophe theory, proposed by the French mathematician René Thom, combines topology, singularity theory, and structural stability theory to represent a theoretical model for analyzing sudden and discontinuous phenomena in the development of dynamic systems [27]. Catastrophe theory is widely applied in various fields of emergency research, safety, and performance evaluations, such as control of biological populations [28], evaluations of utilization of water resources [29,30], environmental risk assessments of engineering [31,32,33], evaluation of economic competitiveness [34], and research on material performance [35,36]. In addition, catastrophe theory has also been applied to safety evaluations in the field of transportation [37,38].
Catastrophe theory studies the mutation phenomenon using the potential function as the study object, where refers to the state variables of the system and represents the external control variables. State variables and external control variables where represents the number of state variables and represents the number of control variables. When the state variables and external control variables change within their feasible range, they form the state space and control space of the system. The intersection set was obtained using the simultaneous equilibrium surface equation and its derivative is the set of critical points of the equilibrium state of the system.
According to René Thom’s catastrophe theory, when there are no more than four control variables, seven types of models are used for the occurrence of sudden changes in the system, namely fold catastrophe, cusp catastrophe, swallowtail catastrophe, butterfly catastrophe, hyperbolic umbilical point, elliptic umbilical point, and parabolic umbilical point [39,40]. Explanations of the models are listed in Table 1.

Table 1.
The catastrophe models and potential functions.
When catastrophe theory is applied to evaluation, if an indicator in the evaluation indicator system is decomposed into two sub-indicators, the system can be regarded as a cusp catastrophe system; if an indicator is decomposed into three sub-indicators, the system can be regarded as a swallowtail catastrophe system; and if an indicator is decomposed into four sub-indicators, the system can be considered as a butterfly catastrophe system. Three main types of catastrophe models are used in this paper: cusp catastrophe, swallowtail catastrophe, and butterfly catastrophe. The structural schematic of the models used for evaluation is shown in Figure 2.
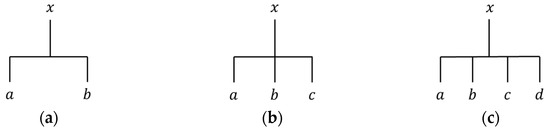
Figure 2.
Structural schematic of the catastrophe models used for evaluation: (a) Cusp catastrophe; (b) swallowtail catastrophe; (c) butterfly catastrophe.
The bifurcation set and normalization formulas of the catastrophe models of cusp catastrophe, swallowtail catastrophe, and butterfly catastrophe are shown in Table 2.
Table 2.
Bifurcation set and normalization formulas of the catastrophe models.
4.2. Evaluation Method for Mutation Degree of Passenger Flow
The construction of the evaluation model (CDCT) for the mutation degree of passenger flow of urban rail stations is based on catastrophe theory, with the specific process as follows:
- Constructing an evaluation indexes system of mutation degree
The construction method of the evaluation indexes of the mutation degree of passenger flow is provided in the previous section. The analytic hierarchy process is used to construct the evaluation index system of the mutation degree of passenger flow, which consists of the target layer, criterion layer, and indicator layer from top to bottom. The corresponding catastrophe models for each layer and the system are shown in Figure 3.
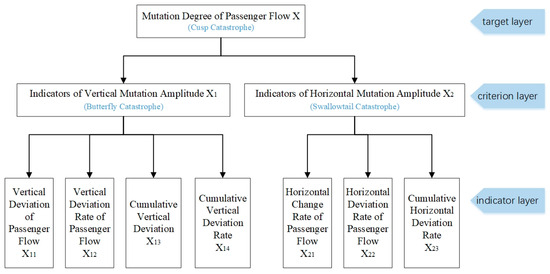
Figure 3.
Evaluation indexes system of mutation degree of passenger flow.
- 2.
- Standardizing the evaluation indexes
The indicators in the indicator layer are standardized to make the data dimensionless and to facilitate the subsequent comparative analysis of the indicators. Considering that all the indicators of the larger type are better, the standardization formula is as follows:
where is the variable standardization value, is the original variable value, is the maximum variable value, and is the minimum variable value.
- 3.
- Calculating the membership function values
The membership function values of each indicator is calculated using the normalization formula in Table 2, comprehensive quantitative recursive operations are performed, and then the membership function values of the evaluation system are obtained. The operation of membership function values can be divided into ‘complementary principle’ and ‘non-complementary principle’:
- Complementary principle: When the influence of the control variables on state variables can be mutually compensated, the final value is the average value of these control variables, i.e., .
- Non-complementary principle: When the influence of the control variables of the system on the state variables cannot be replaced with each other, that is, they cannot compensate for each other’s shortcomings, the final value is determined based on the minimum principle, i.e., .
The above steps are repeated to obtain the membership function values of each layer, and then the membership function values of the upper-level indicators are further calculated until the comprehensive evaluation result of the target layer is obtained, which is the evaluation result of the mutation degree of passenger flow required in this study. This study divides the mutation degree of passenger flow into five levels, as shown in Table 3.
Table 3.
Gradation of mutation degree of passenger flow.
5. Data Collection and Analysis
Mutational passenger flow is a type of abnormal passenger flow compared to normal passenger flow, and research and analysis of mutational passenger flow are based on the fluctuation rhythms of normal passenger flow. This section describes the common fluctuation rhythm of passenger flow by analyzing normal passenger flow and further analyzes the characteristics of mutational passenger flow.
5.1. Data Collection
The data used in this study were the AFC data of the Suzhou Rail Transit, which was provided by Suzhou Rail Transit Group Co., Ltd. The original data were sorted into the in-and-out passenger flow data of urban rail transit stations for this study, and the weekly distribution of passenger flow at the stations in the network was observed. The time range was 5:01–23:46, and the data time granularity was 15 min.
- Normal passenger flow data: To study the common fluctuation rhythm of passenger flow in urban rail transit, data from a time period without the influence of factors, such as new line access and the epidemic, were selected for comparative analysis. The first week of June 2021, from 1 June to 7 June, was the study period. The weeks before and after the study date, 25 May to 31 May 2021, 8 June to 14 June, and 2 June to 8 June 2020, were used as the reference dates. The corresponding periods for each date are presented in Table 4. Among them, the Dragon Boat Festival was from 12 June to 14 June 2021.
Table 4. Comparison table of study date and reference date period.
- Mutational passenger flow data: To analyze the relationship between mutational passenger flow and normal passenger flow and obtain the mutation degree of mutational passenger flow, the in-and-out passenger flows of SZRT on 6 September 2019 were selected as the analysis data. At 8:25–8:50 on 6 September, the operation of SZRT Line 2 was suddenly interrupted. It was a Friday on 6 September, with the latest Friday being 30 August, and no special events affecting normal operations occurred on that day. Therefore, the passenger flow on 30 August 2019 was selected for comparison.
5.2. Analysis of the Fluctuation Characteristics of Normal Passenger Flow
The functions and land use of the stations were different, and there were significant differences in the characteristics of their passenger flow. Taking SZRT as an example, stations with different passenger flow characteristics were selected for the analysis, as shown in Figure 4. Mudu station had an obvious morning inflow peak and evening outflow peak on weekdays, but no obvious morning and evening peaks on weekends or holidays. The Lindun Road station had an obvious morning outflow peak on weekdays and an obvious evening outflow peak on weekends. There was no obvious morning or evening peak at Shantang Street station on weekdays, and there were slightly more passengers entering the station on weekdays. There was a clear inflow and outflow peak in the evening on weekends, and there were more passengers on weekends than on weekdays. There were obvious morning and evening peaks at the Xinghai-Square station on weekdays, and no obvious morning and evening peaks on weekends. On weekdays, the evening inflow peak and morning outflow peak were obvious. The in-and-out passenger flow during the Dragon Boat Festival at each station was similar to that during weekends, with some stations experiencing slightly higher passenger flow during the Dragon Boat Festival than during weekends.
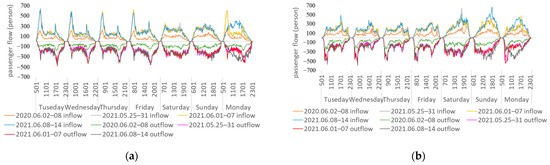
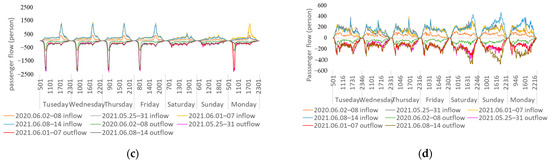
Figure 4.
Weekly distribution figure of station passenger flow: (a) Mudu Station; (b) Lindun Road Station; (c) Xinghai-Square Station; (d) Shangtang-Streeet Station.
In summary, the passenger flow characteristics of the different stations varied and presented different waveforms. On different days of the same data period, the passenger flow characteristics at the same station were different. For example, there were significant differences in the values and characteristics between the Friday passenger flow and Thursday (the previous day) passenger flow at Lindun Station. The evening outflow peak on Friday was more pronounced than that on the other days. At the same time, in similar but different time periods, the same station had a high degree of similarity in passenger flow. For example, the study date of 1 June 2021 and the reference dates of 25 May 2021 and 8 June 2021 were both Tuesdays, which were the same time in similar but different time periods. The stations in Figure 4 have similar passenger flow values and high similarity in waveform characteristics during these days.
5.3. Analysis of the Characteristics of Catastrophe Passenger Flow
At 8:26–8:51 on 6 September 2019, SRZT Line 2 broke down, leading to the interruption of Line 2 operation, and the operation of Line 1, Line 4, and Line 4-branch remained normal. A comparison between the fluctuation in passenger flow on Line 2 on that day and 30 August is shown in Figure 5, where the red arrow indicates the passenger flow affected by operational interruption. According to the common fluctuation rhythm of the passenger flow, assuming that there was no operational interruption, 6 September was still relatively high compared with 30 August, which were Fridays with similar time periods, and the passenger flow of these two days followed the rhythm of similar passenger flow values and similar characteristics of passenger flow fluctuations. By analyzing the actual passenger flow data, it was found that the fluctuation rhythms of in-and-out passenger flow throughout the day on 6 September and 30 August were basically consistent. However, there was a sudden drop in outflow from 8:16 to 8:30 on 6 September, and an interference event was considered to have occurred during this period. Due to the continuous impact of the interference event, the outflow from 8:31 to 8:45 continued to decrease. From 8:46 to 9:00, the outflow rebounded, considering the elimination of interference events during this period, and the passenger flow gradually returned to normal. The outflow fluctuated steadily from 9:01 to 9:30 and was still relatively high compared to 30 August, indicating that passenger flow needs some time to return to normal, which will be delayed compared to the time when the interference is resolved. The fluctuation situation and value of in-and-out passenger flow after 9:31 were basically consistent with the data on 30 August, indicating that at this time, the passenger flow of Line 2 is completely eliminated due to the interference event. From the waveform of the in-and-out passenger flows, the abnormal fluctuation of passenger flow from 8:16 to 9:30 was consistent with the characteristics of a mutational passenger flow, which was a discontinuous and non-gradual fluctuation of passenger flow. The start time of the mutational passenger flow was generally the start time of the interference event, whereas the end time of the mutational passenger flow lagged behind the end time of the interference.
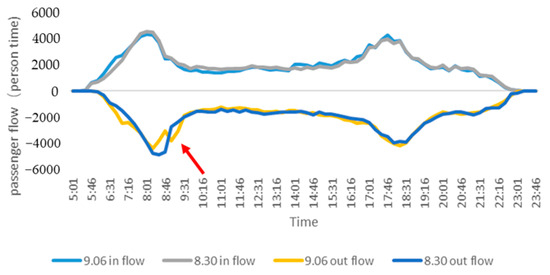
Figure 5.
Comparison diagram of in-and-out passenger flow of SZRT Line 2 under operation interruption and normal operation.
6. Results and Discussion
The operation of the SZRT Line 2 was suddenly interrupted on 6 September 2019 (Friday). According to an announcement issued by the Suzhou Rail Transit Group, the start time of the operation interruption on Line 2 was 8:26, and the time for interruption resolution was 8:51. During this period, Line 1, Line 4, and Line 4-branch were operating normally. According to the analysis of the characteristics of mutational passenger flow, the time range of mutational passenger flow was from the start time of the interruption to 9:30. Because the time granularity of the in-and-out passenger flow was 15 min, we selected the 8:16 to 9:30 time period affected by interference as the research period.
To verify the CDCT evaluation method, the calculation of the mutation degree of outflow at Shantang Street Station from 9:01 to 9:15 was taken as an example. The first step was to calculate the values of each evaluation indicator based on the CDCT evaluation method and to adjust the correction factor to α = 0.5. The calculation results of the evaluation indicators were standardized to obtain the initial evaluation values: . The initial evaluation values were processed according to the normalization formulas in Table 2 to obtain the membership function values for the indicators. The evaluation indicator includes four indicator layers: and . Using the normalization formula corresponding to the model of butterfly catastrophe, the membership function values were obtained. The calculation process is as follows: .
The four indicators and are complementary, so the membership function value of the criterion layer is obtained as (0.06 + 0.20 + 0.39 + 0.54)/4 = 0.30. Criterion layer X2 included three indicators: and . The normalization formula corresponding to the model of the swallowtail catastrophe is applied to obtain the membership function values for each indicator, as shown in Table 5. and are non-complementary, so the minimum principle is used to determine the membership function value of the criterion layer . The target layer contains two indicators, and so the normalization formula corresponding to the cusp catastrophe model is applied to calculate the membership function value . The next step is to determine the principle between the criteria layer indicators and , which is complementary, and to calculate the comprehensive evaluation value for the target layer. The values obtained from the calculation process are listed in Table 5.
Table 5.
The calculation process of membership function values for each layer of Shantang Street Station during the interruption of Line 2.
Combined with Table 3, it can be assessed that the CDCT evaluation value of the mutation degree of outflow at Shantang Street station during the period from 9:01 to 9:15 on 6 September 2019 when the line was interrupted is the gradation of the mutation degree of passenger flow is divided into IV, and the description of mutation degree is low. From 9:01 to 9:15 on 6 September 2019, the mutation degrees of in-and-out passenger flows at other stations of the SZRT network were evaluated, and some results are shown in Table 6.
Table 6.
Evaluation results of mutation degree of passenger flow of SZRT stations from 9:01 to 9:15 on 6 September 2019.
The mutational passenger flow of the SZRT network during the interruption event was continuously evaluated, and the dynamic change in the mutation degree during the research period from 8:16 to 9:30 was obtained, as shown in Figure 6. Figure 6a shows a schematic diagram of the Suzhou rail network, with different colors representing different lines. Figure 6b–f show the evaluation results of the mutation degree every 15 min from 8:16 to 9:30. The redder the color and the larger the size of the node, the higher the mutation degree of the passenger flow at the corresponding station. The greener the color and the smaller the size of the node, the lower the mutation degree of the passenger flow at the corresponding station. Figure 6f shows the evaluation results of the normal passenger flow during 9:31–9:45. During 8:16–8:30, when SZRT Line 2 was interrupted, the mutation degree of passenger flow of the whole network was higher than that in other periods. With the passage of time, the mutation degree of the passenger flow of the entire network decreased, especially after Line 2 resumed operation, and the mutation degree of the passenger flow of the entire network decreased significantly. During 8:16–8:30, the mutation degrees of the stations of Line 1 and Line 2 were relatively high. The station with the highest mutation degree was the Yueliangwan station on Line 2, which is an employment-dominant station. The outflow peak at Yueliangwan station during the morning rush hour was significant, so in the case of interference events during the morning rush hour, the mutation degree of the outflow was extremely high. As time went by, the stations with high mutation degrees during 8:31–8:45 were concentrated on Line 2, and the mutation degree of stations on Line 1 gradually decreased. We speculate that lines other than Line 2 had alleviated the impact of interruption events of Line 2 through transfers and other means. During 8:46–9:00, Line 2 resumed operation, and the mutation degree of the stations on Line 2 began to decrease. During 9:01–9:15, the mutation degree of the stations on Line 2 continued to decrease. During 9:16–9:30, other lines were affected by the recovery of Line 2 and experienced a brief rebound in the mutation degree, especially for stations with high outbound demand during the morning rush hour, such as employment-dominant and commercial-dominant stations. During 9:31–9:45, there were no stations with high mutation degrees in the network, which means that the network is no longer affected by operational interruptions and passenger flow returned to normal.
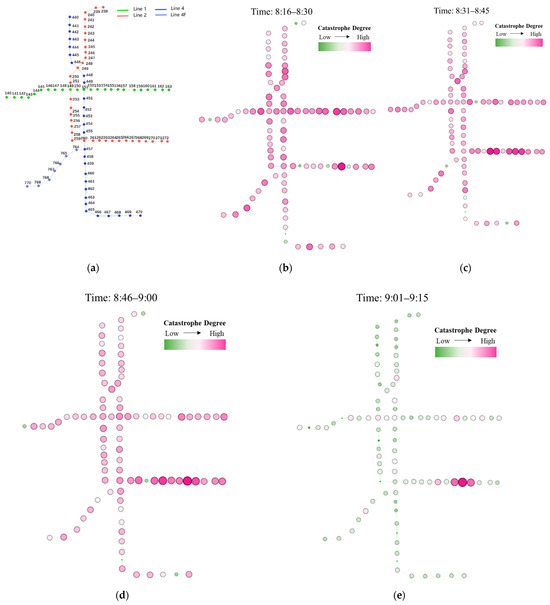
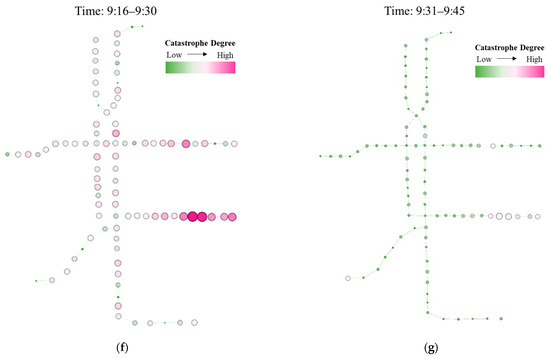
Figure 6.
Dynamic evaluation diagram of mutation degree of passenger flow of SZRT network: (a) network structure; (b) mutation degree during 8:16–8:30; (c) mutation degree during 8:31–8:45; (d) mutation degree during 8:46–9:00; (e) mutation degree during 9:01–9:15; (f) mutation degree during 9:16–9:30; (g) normal passenger flow during 9:31–9:45.
7. Conclusions
This study provided the definition of the mutation degree of passenger flow and constructed evaluation indicators for the mutation degree of passenger flow, as well as an evaluation model (CDCT) for the mutation degree of passenger flow based on catastrophe theory. Using the analysis of normal passenger flow, the common fluctuation rhythm of passenger flow was obtained; that is, without interference, the passenger flows on the same day of adjacent weeks were consistent in values and fluctuation rhythms. Based on this premise, we analyzed the mutation degree of passenger flow on the study day using the same period of the adjacent week as the reference day. In this paper, the CDCT evaluation method was applied to the interruption event of SZRT, and the following conclusions were drawn:
- (1)
- The CDCT evaluation method can better reflect the dynamic change in the mutation degree in the whole process under the influence of mutational passenger flow.
- (2)
- When an interference occurs at a certain station or line, in addition to the interfered stations, the passenger flow at other stations in the network also experiences mutation due to the interference. When an interference occurs at a certain line, the station with a high mutation degree is the station with a high demand for inflow and outflow on that line. After the interference is resolved, the mutation degree of the stations directly affected by the interference decreases, whereas other stations may experience a temporary rebound in mutation degree. The degree of mutation of the station constantly changes and is related to the line on which it is located.
Interference can lead to mutational passenger flow throughout the entire network, and such mutational passenger flow is complicated in space and time, so it is necessary to evaluate the dynamic change in passenger flow mutation degree from the network level. Future research can further analyze the relationship between the sudden change in the degree of passenger flow and the route of the station. Other characteristics of the station can also be considered, such as the land use of the area surrounding the stations and the accessibility of the stations, and the factors affecting the mutation degree of the passenger flow at the stations can be further explored. At the same time, the characteristics of the mutation of in-and-out passenger flows also need to be further explored.
Author Contributions
Conceptualization, T.C., J.M. and X.G.; methodology, T.C.; software, T.C.; validation, T.C.; investigation, S.L.; resources, X.G.; data curation, S.L.; writing—original draft preparation, T.C.; writing—review and editing, J.M. and Z.Z.; funding acquisition, Z.Z. All authors have read and agreed to the published version of the manuscript.
Funding
This research was funded by the Scientific Research Foundation for Advanced Talents of Nanjing Forestry University, grant number: No. 163106041; the General Project of Philosophy and Social Science Foundation of the Jiangsu Higher Education Institutions of China, funding number: 2020SJA0125.
Institutional Review Board Statement
Not applicable.
Informed Consent Statement
Not applicable.
Data Availability Statement
All data and materials generated by or supporting the findings of this study are available upon request by contacting the corresponding author.
Acknowledgments
We acknowledge the Suzhou Rail Transit Group for providing the data. We would like to acknowledge the anonymous reviewers for their constructive comments.
Conflicts of Interest
The authors declare no conflict of interest.
References
- China Transportation News Network. The Passenger Volume of Urban Rail Transit in China Increased by 58.9% in March. Available online: https://www.zgjtb.com/2023-04/07/content_347840.html (accessed on 12 April 2023).
- Guo, Y.; Wang, X.; Xu, Q.; Liu, S.; Liu, S.; Han, J. Weather Impact on Passenger Flow of Rail Transit Lines. Civ. Eng. J. 2020, 6, 276–284. [Google Scholar] [CrossRef]
- Zuo, R.; Yang, Y. Urban Rail Train Operation Scheduling Under Emergency Conditions. In Proceedings of the International Conference on Electromechanical Control Technology and Transportation, Guilin, China, 26–28 April 2019; IEEE: New York, NY, USA, 2019; pp. 198–201. [Google Scholar] [CrossRef]
- Jing, Z.; Yin, X. Neural Network-Based Prediction Model for Passenger Flow in a Large Passenger Station: An Exploratory Study. IEEE Access 2020, 8, 36876–36884. [Google Scholar] [CrossRef]
- Chen, Q.; Wen, D.; Li, X.; Chen, D.; Lv, H.; Zhang, J.; Gao, P. Empirical mode decomposition based long short-term memory neural network forecasting model for the short-term metro passenger flow. PLoS ONE 2019, 14, e0231199. [Google Scholar] [CrossRef] [PubMed]
- Gallo, M.; De Luca, G.; D’Acierno, L.; Botte, M. Artificial Neural Networks for Forecasting Passenger Flows on Metro Lines. Sensors 2019, 19, 3424. [Google Scholar] [CrossRef] [PubMed]
- Li, P.; Ma, C.; Ning, J.; Wang, Y.; Zhu, C. Analysis of Prediction Accuracy under the Selection of Optimum Time Granularity in Different Metro Stations. Sustainability 2019, 11, 5281. [Google Scholar] [CrossRef]
- Zhou, W.; Wang, W.; Zhao, D. Passenger Flow Forecasting in Metro Transfer Station Based on the Combination of Singular Spectrum Analysis and AdaBoost-Weighted Extreme Learning Machine. Sensors 2020, 20, 3555. [Google Scholar] [CrossRef] [PubMed]
- Wu, J.; Xie, Z.; Qin, Y.; Jia, L.; Guan, L. Bi-directional passenger flow tracking and statistics analysis in station passageways based on an improved Deep-Sort algorithm. Meas. Control 2023, 00202940231187922. [Google Scholar] [CrossRef]
- Cao, Y.; Li, X. Multi-Model Attention Fusion Multilayer Perceptron Prediction Method for Subway OD Passenger Flow under COVID-19. Sustainability 2022, 14, 14420. [Google Scholar] [CrossRef]
- Liu, S.; Yao, E. Holiday Passenger Flow Forecasting Based on the Modified Least-Square Support Vector Machine for the Metro System. J. Transp. Eng. Part A Syst. 2017, 143, 04016005. [Google Scholar] [CrossRef]
- Yuan, Y.; Shao, C.F.; Cao, Z.C.; Chen, W.X.; Yin, A.T.; Yue, H.; Xie, B.L. Urban Rail Transit Passenger Flow Forecasting Method Based on the Coupling of Artificial Fish Swarm and Improved Particle Swarm Optimization Algorithms. Sustainability 2019, 11, 7230. [Google Scholar] [CrossRef]
- Zhou, G.; Tang, J. Forecast of Urban Rail Transit Passenger Flow in Holidays Based on Support Vector Machine Model. In Proceedings of the International Conference on Electromechanical Control Technology and Transportation, Electer Network, Nanchang, China, 15–17 May 2020; IEEE: Los Alamitos, CA, USA, 2020; pp. 585–589. [Google Scholar] [CrossRef]
- Gu, J.J.; Jiang, Z.B.; Fan, W.; Wu, J.M.; Chen, J.J. Real-Time Passenger Flow Anomaly Detection Considering Typical Time Series Clustered Characteristics at Metro Stations. J. Transp. Eng. Part A Syst. 2020, 146, 04020015. [Google Scholar] [CrossRef]
- Chen, X.X.; Yang, C.; Xu, X.Y.; Gong, Y.B. Anomaly Detection in Metro Passenger Flow Based on Random Matrix Theory. In Proceedings of the IEEE International Conference on Intelligent Transportation Systems, Auckland, New Zealand, 27–30 October 2019; IEEE: New York, NY, USA, 2019; pp. 625–630. [Google Scholar] [CrossRef]
- Thandassery, S.; Mulerikkal, J. Operational pattern forecast improvement with outlier detection in metro rail transport system. Multimed. Tools Appl. 2023, 1–17. [Google Scholar] [CrossRef]
- Xie, C.; Li, X.; Chen, B.; Lin, F.; Lin, Y.; Huang, H.; Osaba, E. Subway Sudden Passenger Flow Prediction Method Based on Two Factors: Case Study of the Dongsishitiao Station in Beijing. J. Adv. Transp. 2021, 2021, 5577179. [Google Scholar] [CrossRef]
- Feng, X.; Zhang, H.; Gan, T.; Sun, Q.; Ma, F.; Sun, X. Random Coefficient Modeling Research on Short-Term Forecast of Passenger Flow into an Urban Rail Transit Station. Transport 2016, 31, 94–99. [Google Scholar] [CrossRef]
- Wang, H.; Li, L.; Pan, P.; Wang, Y.; Jin, Y. Early warning of burst passenger flow in public transportation system. Transp. Res. C-Emerg. 2019, 105, 580–598. [Google Scholar] [CrossRef]
- Wang, H.; Li, L.; Pan, P.; Wang, Y.; Jin, Y. Online detection of abnormal passenger out-flow in urban metro system. Neurocomputing 2019, 359, 327–340. [Google Scholar] [CrossRef]
- Sun, Y.; Shi, J.; Schonfeld, P.M. Identifying passenger flow characteristics and evaluating travel time reliability by visualizing AFC data: A case study of Shanghai Metro. Public Transp. 2016, 8, 341–363. [Google Scholar] [CrossRef]
- Li, X.; Chen, P.; Chen, F.; Wang, Z. Passenger flow analysis of Beijing urban rail transit network using fractal approach. Mod. Phys. Lett. B 2018, 32, 1850001. [Google Scholar] [CrossRef]
- Zhang, W. Graph Based Approach to Real-Time Metro Passenger Flow Anomaly Detection. In Proceedings of the IEEE International Conference on Data Engineering, Electer Network, Chania, Greece, 19–22 April 2021; IEEE: Los Alamitos, CA, USA, 2021; pp. 2744–2749. [Google Scholar] [CrossRef]
- Guo, R.; Hou, T.; Niu, H.; Fan, D.; Destech Publications Inc. Application of Cloud Model in Operational Risk Assessment of Urban Rail Transit. In Proceedings of the International Conference on Information Technology and Industrial Automation, Guangzhou, China, 24–25 June 2017; Destech Publications: Lancaster, CA, USA, 2017; pp. 235–239. [Google Scholar] [CrossRef]
- Xing, Y.; Liu, S.; Wang, H.W. Anylogic Simulation-based Research on Emergency Organization of Mass Passenger Flow in Subway Station after Events. In Proceedings of the International Conference on Modelling, Simulation and Applied Mathematics, Shanghai, China, 22–23 July 2018; Atlantis Press: Paris, France, 2018; pp. 48–53. [Google Scholar] [CrossRef]
- Su, M. The evaluation index of subway passenger flow is constructed based on AFC data. In Proceedings of the International Conference on Electromechanical Control Technology and Transportation, Chongqing, China, 14–16 May 2022; Spie-Int Soc Optical Engineering: Bellingham, WA, USA, 2022; p. 12081. [Google Scholar] [CrossRef]
- Mostafa, M.M. Five decades of catastrophe theory research: Geographical atlas, knowledge structure and historical roots. Chaos Solitons Fractals 2022, 159, 112078. [Google Scholar] [CrossRef]
- Zhao, L.C.; Liu, J.N.; Liu, B.; Li, Y.; Zhao, H.Y. Catastrophe control of aphid populations model. Math. Biosci. Eng. 2022, 19, 7122–7137. [Google Scholar] [CrossRef]
- Zhang, H.; Yu, J.; Du, C.; Xia, J.; Wang, X. Assessing Risks from Groundwater Exploitation and Utilization: Case Study of the Shanghai Megacity, China. Water 2019, 11, 1775. [Google Scholar] [CrossRef]
- Wu, M.; Ge, W.; Wu, Z.; Li, Z. Comprehensive evaluation of water resources utilization benefits based on catastrophe theory. Desalin. Water Treat. 2020, 181, 273–277. [Google Scholar] [CrossRef]
- Zhai, W.; Li, J.; Zhou, Y. Application of catastrophe theory to fracability evaluation of deep shale reservoir. Arab. J. Geosci. 2019, 12, 161. [Google Scholar] [CrossRef]
- Zhu, J.-q.; Li, T.-z. Catastrophe theory-based risk evaluation model for water and mud inrush and its application in karst tunnels. J. Cent. South Univ. 2020, 27, 1587–1598. [Google Scholar] [CrossRef]
- Wei, X.J.; Wang, X.; Chen, T.T.; Ding, Z.; Wu, X. Comparison of the Fold and Cusp Catastrophe Models for Tensile Cracking and Sliding Rockburst. Math. Probl. Eng. 2021, 2021, 6682999. [Google Scholar] [CrossRef]
- Karman, A.; Pawlowski, M. Circular economy competitiveness evaluation model based on the catastrophe progression method. J. Environ. Manag. 2022, 303, 114223. [Google Scholar] [CrossRef] [PubMed]
- Xu, J.; Zhou, Q.; Tao, J.; Sun, X.; Zhao, Q.; Fu, S.; Yang, N.; Guo, W.; Zhang, L. Research on crack propagation law of rotating bending fatigue cropping process based on cusp catastrophe theory. Theor. Appl. Fract. Mech. 2022, 118, 103235. [Google Scholar] [CrossRef]
- Zhao, K.; Wu, J.; Yan, Y.; Yang, J.; Tian, X.; Ji, Y.; Xiao, W. The cusp catastrophe warning model for easily weathered granite considering energy accumulation and dissipation. Environ. Sci. Pollut. Res. Int. 2023, 30, 45888–45898. [Google Scholar] [CrossRef] [PubMed]
- Lin, C.; Yu, Y.; Wu, D.; Gong, B. Traffic Flow Catastrophe Border Identification for Urban High-Density Area Based on Cusp Catastrophe Theory: A Case Study under Sudden Fire Disaster. Appl. Sci. 2020, 10, 3197. [Google Scholar] [CrossRef]
- Xu, Y.; Zhang, D.J.; Zhang, X.; Lai, K.K.; Su, B.; Macioszek, E. Research on the Traffic Flow Control of Urban Occasional Congestion Based on Catastrophe Theory. J. Adv. Transp. 2021, 2021, 1341729. [Google Scholar] [CrossRef]
- Huang, X.; Qiu, L. Decision of Comprehensive Development Level of Reclaimed Water Based on Improved Catastrophe Theory: A Case Study in Yunnan Province, China. Front. Environ. Sci. 2022, 10, 862087. [Google Scholar] [CrossRef]
- Singh, L.K.; Jha, M.K.; Chowdary, V.M. Application of catastrophe theory to spatial analysis of groundwater potential in a sub-humid tropical region: A hybrid approach. Geocarto Int. 2020, 37, 700–719. [Google Scholar] [CrossRef]


Disclaimer/Publisher’s Note: The statements, opinions and data contained in all publications are solely those of the individual author(s) and contributor(s) and not of MDPI and/or the editor(s). MDPI and/or the editor(s) disclaim responsibility for any injury to people or property resulting from any ideas, methods, instructions or products referred to in the content. |
© 2023 by the authors. Licensee MDPI, Basel, Switzerland. This article is an open access article distributed under the terms and conditions of the Creative Commons Attribution (CC BY) license (https://creativecommons.org/licenses/by/4.0/).