Article

A Case Study on Smart Grid Technologies with Renewable Energy for Central Parts of Hamburg

1
Institute of Information Systems, University of Hamburg, 20148 Hamburg, Germany
2
Institute of Transport Research, German Aerospace Center (DLR), 12489 Berlin, Germany
*
Author to whom correspondence should be addressed.
Sustainability 2023, 15(22), 15834; https://doi.org/10.3390/su152215834
Submission received: 30 May 2023 / Revised: 9 September 2023 / Accepted: 29 September 2023 / Published: 10 November 2023
(This article belongs to the Section Energy Sustainability)

Abstract

:
Globally, efforts are made to balance energy demands and supplies while reducing CO 2 emissions. Germany, in its transition to renewable energies, faces challenges in regulating its energy supply. This study investigates the impact of various technologies, including energy storage solutions, peak shaving, and virtual buffers in a smart energy grid on a large scale. Real-time energy supply and demand data are collected from the Port of Hamburg and HafenCity in Germany to analyze the characteristics of different technologies such as load shifting of reefer containers and private electric vehicles’ energy, as well as pumped hydro storage. Through simulations, we assess the usability of renewable energies in a smart grid with versatile energy demands and determine the effects of peak shaving, storage solutions, and virtual buffers on uncertain energy supply. Our case study reveals that integrating smart grid technologies can reduce the overproduction of renewable energies needed to prevent blackouts from 95% to 65% at the HafenCity and the Port of Hamburg. Notably, large, reliable, and predictable energy consumers like the Port of Hamburg play a vital role in managing the uncontrollable nature of renewables, resulting in up to 31% cost savings for new infrastructure.

1. Introduction

The European Union released several guidelines for climate protection in 2019 to be climate neutral in 2050 [1]. Committed to this goal, Germany has enacted laws aiming to achieve climate neutrality by 2045 [2]. An important aspect of this transition is the transformation of the energy supply sector, which contributes significantly to CO 2 emissions. In this context, there is a growing research interest in smart energy grids, which offer the potential to make energy supply more sustainable. These energy grids are characterized by their intelligence and flexibility. They have an additional communication layer that allows for a higher efficiency through balancing the energy network [3]. This communication facilitates collaboration between the energy grid and energy-consuming technologies such as electric vehicles (EVs) and industrial units. Through technology and mechanisms such as virtual buffers or peak shaving, these technologies are essential for the optimal functioning of smart energy grids.
This paper presents a systematic literature review aimed at examining the current research on technology concepts to improve the efficiency of smart energy grids. Notably, the review reveals a research gap in the under-utilization of existing infrastructure as virtual buffers in large-scale smart energy grids. In addition, the literature review highlights the lack of novel concepts and research related to reducing CO 2 emissions using virtual buffers, peak shaving, or demand-shifting technology. Furthermore, a scarcity of research on smart energy grids with a high share of renewable energy sources was detected. To address these gaps, a real-life simulation model for parts of Hamburg, Germany, was developed, to assess the effects of multiple storage and peak shaving technologies, both in isolation and in synergistic combinations. This process provides valuable insights into how different technologies and solutions interact within the smart grid context. This paper aims to provide a holistic understanding of their performance and potential. Moreover, this paper suggests that there exist opportunities for cross-disciplinary research and integration of various technologies into smart grids.
The key research contribution of this paper lies in the simulation model which is developed in this paper. This simulation sets out to answer the question of how existing infrastructure, used as virtual buffers can influence large-scale smart energy grids in urban areas. This paper pursues a novel approach, focusing on virtual buffers in seaports. Interconnecting these virtual buffers with virtual buffers in an urban area, this simulation model shows new synergistic effects and a large potential for reducing energy demand. This aligns with the paper from Shi et al. [4] and underscores the importance of integrating smart city concepts into the development of resilient and balanced urban energy grids. Through a comprehensive evaluation of different scenarios, the paper provides insights into the advantages, cost-effectiveness, and enhanced resilience of leveraging existing infrastructure as virtual buffers in tandem with other smart grid technologies. This paper seeks to fill a gap in the current research landscape by investigating the implications and potential advantages of linking multiple virtual buffers within a smart energy grid. This exploration is facilitated through the use of an advanced simulation model. The analysis further highlights the central role of smart grids and virtual buffers in Germany’s path to gradually eliminate nuclear and coal-fired power stations [5,6]. This transition emphasizes the reliance on renewable energy sources like solar and wind, which are inherently less predictable [7]. Therefore, this paper contributes to the discourse by evaluating the efficacy and implications of smart energy grid technologies.
Through the data-driven simulation centered around Hamburg’s HafenCity and the Port of Hamburg’s container terminals, the paper utilizes real-time energy demand and renewable energy supply data for an extended period of 1.4 years (see Section 4.2). By doing so, a virtual representation of a smart grid enriched with energy storage, peak-shaving, and virtual buffers is created. The simulation operates with a high temporal resolution, employing 15-min data intervals to ensure accuracy in modeling the dynamic energy landscape. The selection of smart grid technologies for investigation was done by examining their availability in the HafenCity and the Port of Hamburg. This includes established energy storage solutions like pumped hydro storage systems. Hereby, the hydro pump station near the city of Hamburg [8] is used to provide realistic data. Furthermore, this paper simulates virtual buffers that can be found in the HafenCity and the Port of Hamburg. These virtual buffers are presented in Section 4.3 after the energy demand and supply data used for the simulation are presented and analyzed. In the end, an economic perspective is given. In this cost analysis, the effects of the virtual buffers are computed in relation to the additionally needed capacity of battery systems and the surplus renewable energy generated. This analysis provides insights into the economic feasibility of integrating various smart grid technologies within an urban energy framework. The implementation of this cost analysis shows that these technologies can lead to a 30% reduction in costs associated with newly built infrastructure.
This paper is organized as follows. It starts with a systematic literature review on virtual buffers and smart grids in Section 2, to analyze research gaps. Afterwards, the accumulation of real-world data for the simulation model starts in Section 3 with the analysis of historical energy supply data to understand the difference between an energy grid with controllable energy sources and an energy grid that only uses renewable energy sources. In Section 4, the demand side is analyzed, and a data set consisting of real-time data is built to accurately simulate the storage solutions and virtual buffers. After that, Section 5 presents the forecasting and simulation model. This section also includes a brief analysis of the existing infrastructure used as virtual buffers and storage systems and continues with their algorithms. After introducing all components used in the simulation, the results are expounded in Section 5.2. In the final part of this section (Section 5.2.6), the cost analysis is conducted, showing the most cost-efficient combination of technologies. Section 6 reviews the results of the previous sections and combines them with additional beneficial concepts and technologies. Finally, Section 7 draws some conclusions and provides ideas for future research.

2. Systematic Literature Review

To manage energy supply, energy demand, storage solutions, and virtual buffers effectively, an intelligent energy grid can be used. Hereby, the grid needs to be able to collect and process a lot of different data from advanced sensors and meters while establishing two-way communication. The following literature review analyzes the state of research on large-scale smart energy grids and the effects of the technology used to improve the smart energy grids’ performance. It also shows this paper’s novelty in the research field of smart energy grids.
Inclusion criterion: For this systematic literature review, only studies and papers that provide research on the effects and capabilities of smart energy grids and their technologies, as well as research on methods for using smart energy grids to help balance regenerative energy sources are included. Thereby, handling and acquiring of sensor data, software architecture, load forecasting, or pricing are not included in this literature research.
Literature identification: The initial step involved identifying relevant keywords for the search. The keywords chosen for this review were “smart energy grid” and “smart renewable energy grid”. The differentiation and the separate investigation of smart energy grids and smart renewable energy grids are used for a more comprehensive analysis of the existing literature.
Database search: First, Google Scholar was used. For each research paper, the preliminary relevance was determined by the title, resulting in 49 papers from the first 20 pages in Google Scholar for the term “smart energy grid”. The term “smart renewable energy grid” is resulting in 63 research papers from the first 20 pages in Google Scholar. By combining these two search results and eliminating duplicates, 108 papers were found. Next, the database ScienceDirect was searched to retrieve relevant research articles.
Search Strategy: The search was performed using a combination of keywords and Boolean operators (e.g., AND, OR) to refine the search results. Thereby, the search included every subject area. The search query was “(“smart energy grid”) AND renewable” and resulted in 266 papers.
Screening and Selection: The search results from ScienceDirect were screened based on titles to identify potentially relevant articles. Hereby, 45 papers were extracted, resulting in a total of 152 papers and one duplicate. Further selections were made by assessing the abstracts to conduct the relevance of the effects of renewable energy grids. After reading the abstracts, 48 papers were left. For these, the full-text articles were obtained to further assess their relevance to the research topic.
Inclusion and Exclusion Criteria: The articles were included in the literature review if they met two or more of the following criteria: (a) focused on smart grid technologies and renewable energy systems, (b) presented a case study related to large-scale smart grid implementation, (c) discussion of the effects of virtual buffers or energy storage solution in a reasonably scaled smart energy grid. The reasons for excluding papers were: Not accessible, the scale of the smart energy grid is too small, cyber security as a topic, frameworks to use (smart) metering tools, pricing paradigms (without effects on the energy consumption behavior), and lack of quality or relevance.
Data Extraction: Relevant information from the selected articles, including the source, topic, authors, and main findings, was extracted and organized into Table 1 for easy reference and synthesis.
In this literature research, a lack of novel concepts to reduce CO 2 with virtual buffers, peak shaving, or demand-shifting technology was found. A particularly scarce topic is research on smart energy grids with a high share of renewable energy. The primary technology to improve the smart energy grid’s effect is EVs. However, especially innovative concepts like Siemona et al.’s [19] collaborative factories can have a large impact on future energy grids. For this reason, this paper includes several technologies from a seaport into the smart grid concept. In addition, this paper does not only focus on one smart grid technology but combines multiple technologies, found in an urban city. Thus, synergistic and antagonistic effects can be reviewed in a large-scale energy grid.

3. Energy Supply

As a prerequisite to building a sustainable and climate-neutral energy grid, there are two main sides that need to be evaluated: The energy supply and the energy demand. This section analyzes the current state and future renewable energy supply in Hamburg. Furthermore, the problem and characteristics of renewable energy sources as the predominant energy supply in the case of the district Hamburg Mitte are disclosed. Therefore, real-time data of Hamburg’s energy demand and supply is used for an in-depth analysis. We use the results of this section in Section 5 to simulate the renewable energy supply.

3.1. Problem Description

In 2021, Hamburg consumed on average 1273 MW per hour. Due to the high density of the industry and the seaport, the district Hamburg Mitte used 44.8% [22] of Hamburg’s energy, only covering 15.9% of Hamburg’s population [23]. With this significant energy consumption, Hamburg Mitte is a good starting point to investigate the energy supply of a predominantly industrial district. It includes the Port of Hamburg, the business and residential areas at the HafenCity, and the industry at the hinterland of the seaport. Therefore, this mixture of different energy consumers is well suited for a smart energy grid [24].
To build a database for the energy supply in Hamburg Mitte, real-time data from Hamburg’s energy grid operator [22] is used for the simulation in Section 5. In addition, data from the transparency platform “Entso-E”, responsible for the “central collection and publication of electricity generation, transportation and consumption data and information for the pan-European market” [25] is used for a better understanding of the characteristics of an energy grid only fed by renewable energy sources. It provides detailed data on the energy supply, sorted by country and split up into different product types. In Germany, energy supply types like biomass, nuclear power, and fossil coal are steady energy sources, while solar and wind energy fluctuate immensely. These fluctuations are analyzed and listed with their average and standard deviation in Table 2. The analysis shows the problem of the technologies this paper is looking into: Generally, renewable energies fluctuate a lot more than energy generated by fossil fuels. When Germany stops using coal and nuclear energy in the near future, the shortages in the energy supply will become more severe and profound. The critical requirement is to overcome those minima in the future without energy blackouts. At the same time, it would be a waste of energy to just raise the energy supply’s minimum, e.g., by building more infrastructure, to a level where there will always be enough energy supplied.
To counteract this excessive overproduction of energy, a smart grid needs to manage energy demand, supply, storage, and virtual buffers. To start, the next section analyzes the differences between energy supply and demand. The two different characteristics of demand and supply are shown in Figure 1. Note that the total renewable energy supply was scaled to fit the total energy demand of Hamburg Mitte in early 2020. The used data shows several essential factors that need to be considered when designing a future-proof energy concept. The most critical aspect shown in Figure 1 is that the demand does not fit the supply. As a result, the minimum in this ten-day interval deviates 51.6% from the average demand of 617 MW in Hamburg Mitte. On the fourth of January, for instance, the maximum deviates 78.7% from the average demand. At the same time, the standard deviation of this data is 28.7% or 177.8 MW.
Especially the periods in which the demand (red line) is higher than the supply are critical because there would be insufficient energy in the grid, which would result in power shortages. To improve this scenario and eliminate power shortages without any buffer, the power supply would need to be upgraded to produce an average of 672.5 MW more energy, which is 109% more energy than the energy demand requires, just to prevent energy shortages in the context that no buffer is integrated into the energy grid [22,25].

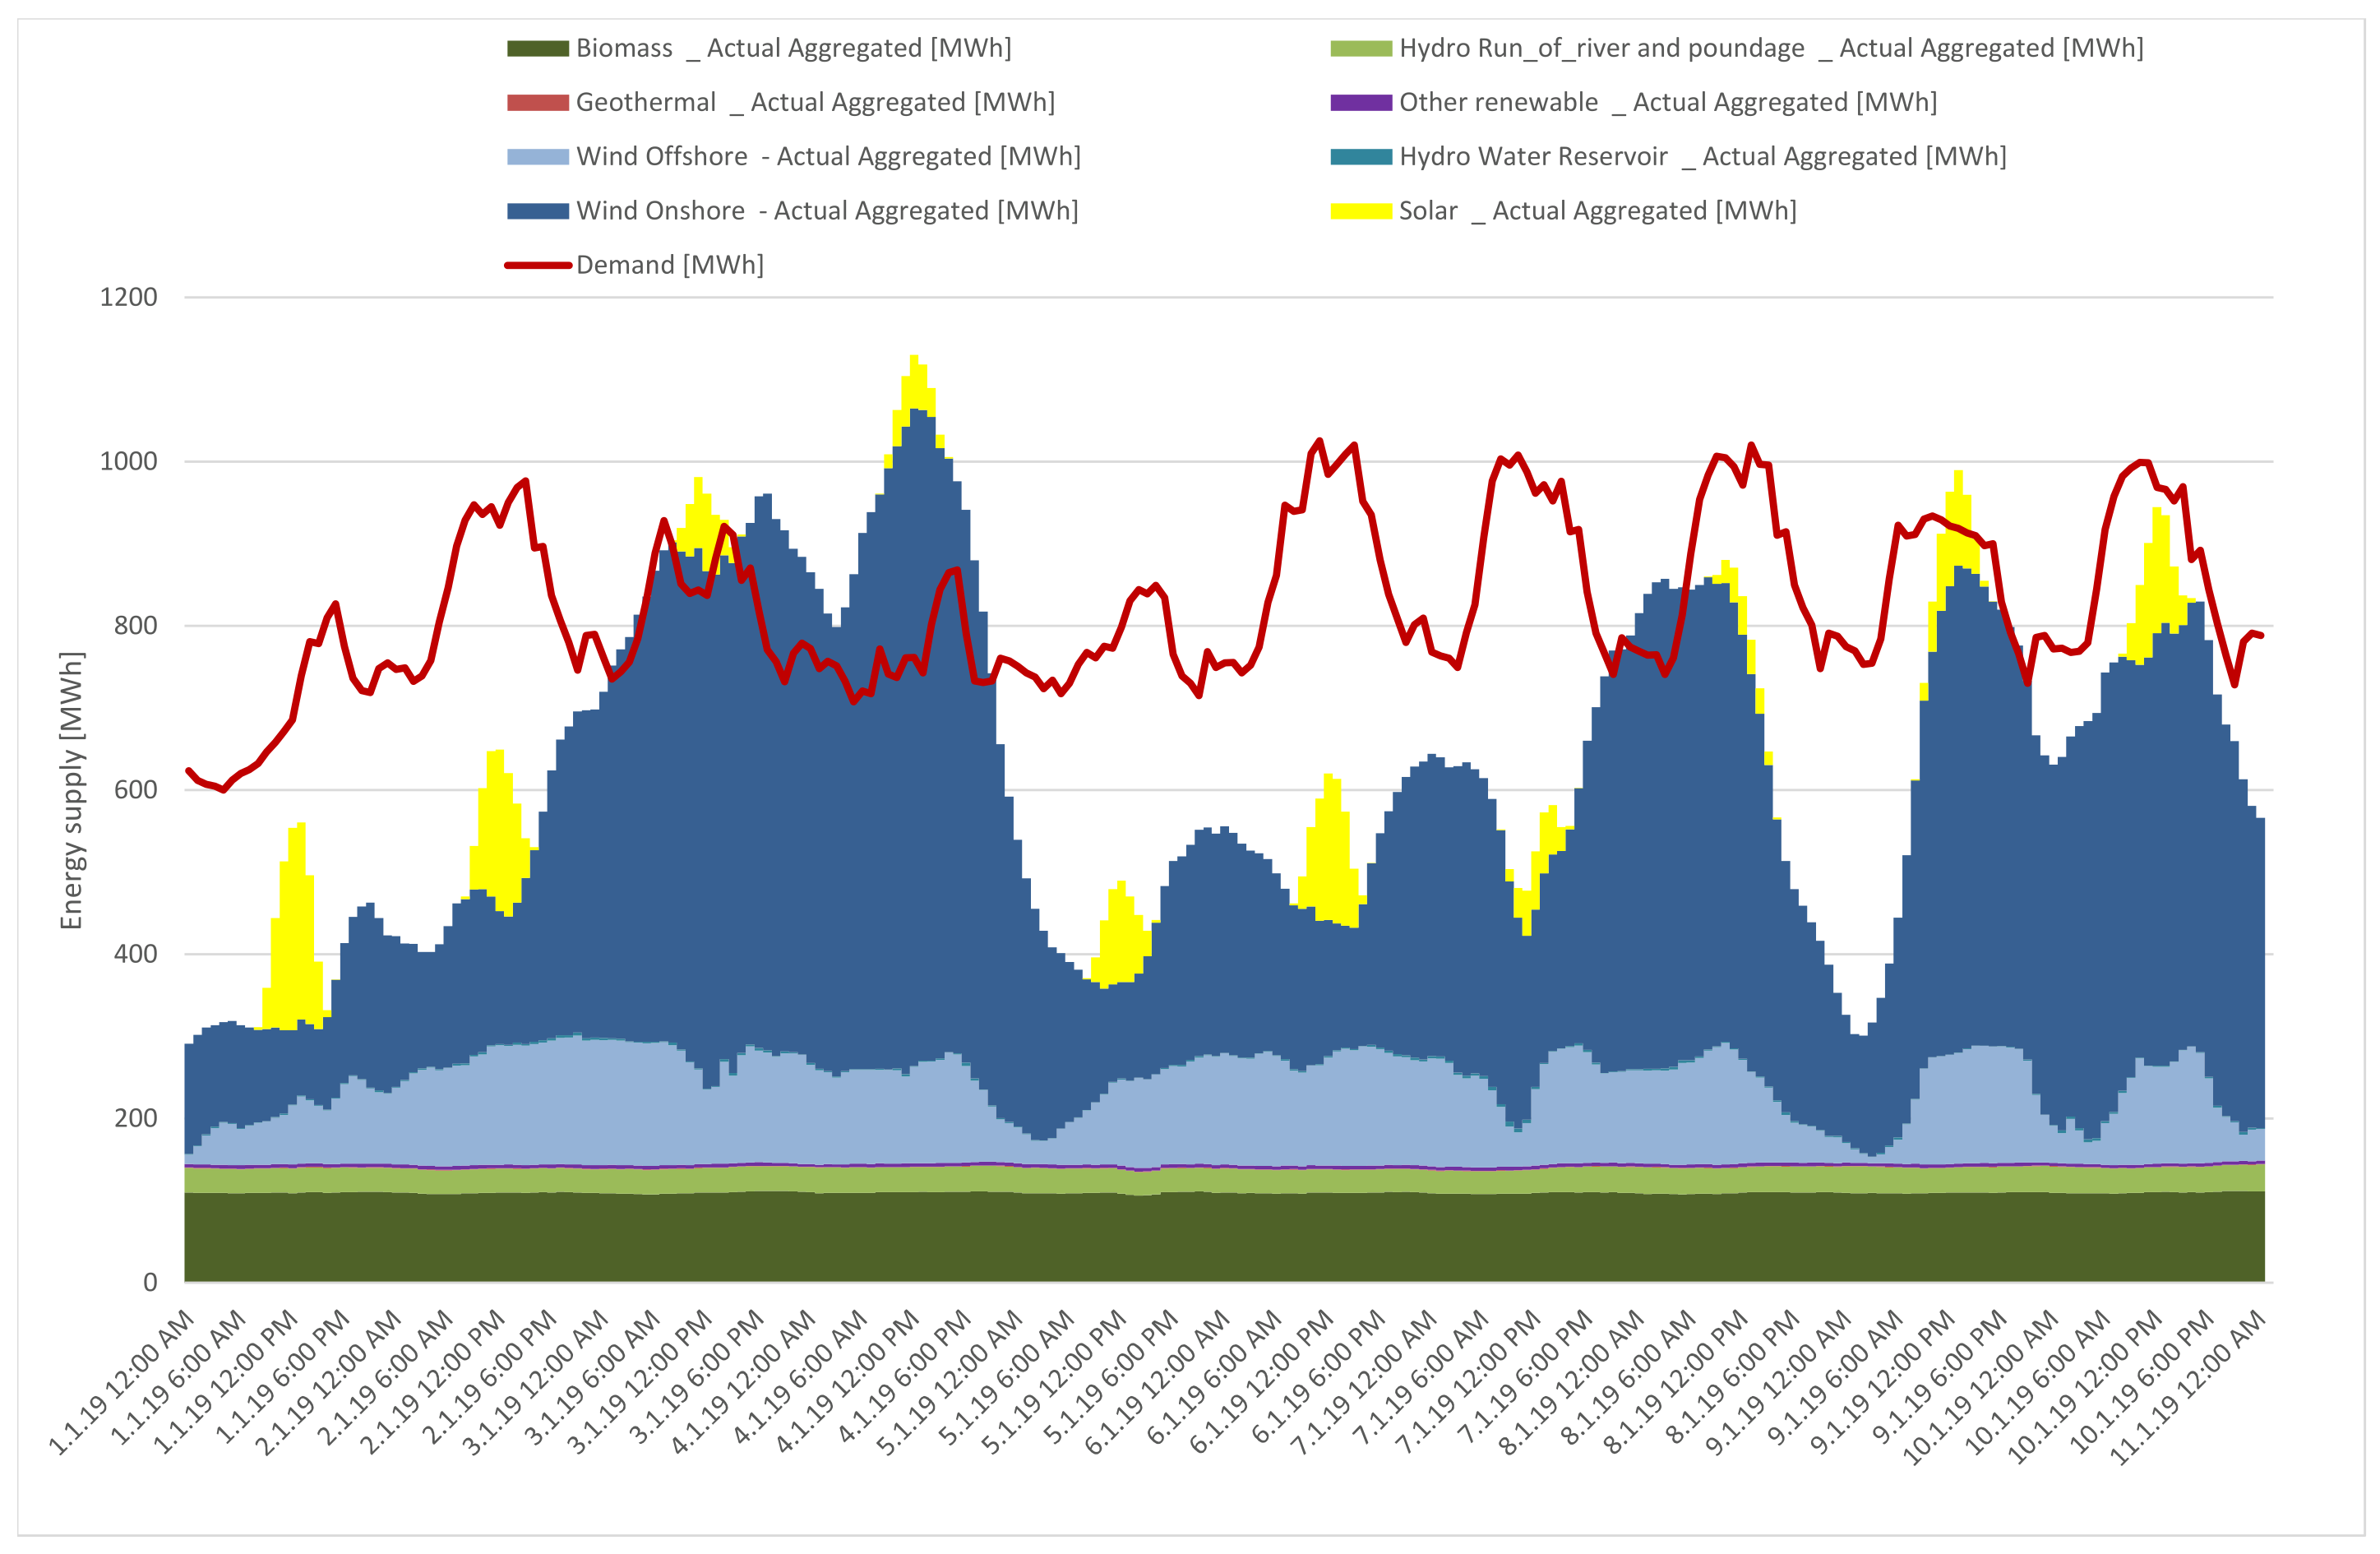
3.2. Analysis of the Renewable Energy Sources’ Behavior and Characteristics

Onshore wind energy produces the most renewable energy in Germany. However, this energy source also has the highest standard deviation, as analyzed in Table 2. An advantage of wind energy is its good predictability. Knowing the amount of energy generated in the future is a crucial factor in shaping the energy demand side. If the system does not have any information on the future energy supply, virtual buffers of storage solutions cannot be used efficiently.
Biomass and hydropower are energy suppliers that are able to steadily produce energy. However, these energy suppliers cannot be easily scaled up or downsized to fit the demand. Nevertheless, they serve as a good base because the energy level will never fall under the supply of those energy producers. Thus, critical infrastructure like hospitals, police, or fire departments will always have energy, no matter what the other energy sources produce. For this reason, this paper is not simulating biomass or hydropower as controllable energy sources. The energy generated by solar power is especially interesting in the context of Hamburg Mitte. Usually, the maximal energy consumption is between 8 am and 3 pm. The maximum energy supplied by solar energy is generally between 11 am and 1 pm [22,25]. Thus, solar energy helps to supply energy at the maximum of the demand and, based on that, helps immensely to supply power at the right time. Additionally, many possibilities already exist for weather forecasting and, therefore, a detailed prediction for the energy harvested by solar power. An expansion of solar-powered energy supply would help to create a reliable power grid. The last category declared as an energy source is pumped hydro storage, which is a promising approach for overcoming minima and possible power shortages in the future (see Section 4.1.2). They store energy that cannot be used and release it when needed. With the Elbe river as a water source in the city of Hamburg, this technology is especially interesting in the context of this paper. Overall, the day and night fluctuations in the energy demand are asynchronous to the deviations of most renewable energies, as seen in Figure 1. Therefore, they are leading to either power shortages or overproduction of energy. Already existing technology like hydro pumps can compensate for some deviations despite being not advanced enough or too small to buffer all the deviations as seen in the next section. The individual and combined impact of those technologies with respect to buffering the power demand according to the upcoming supply are further investigated in Section 5.2.

4. Energy Demand

With today’s technology, we cannot dynamically shape the renewable energy supply to fit the demand. As seen in Section 3, most of the renewable energy sources in Germany depend on nature, especially wind and sun. Thus, the demand side needs to become flexible and able to adapt to the energy supply. In this paper, the demand is split into three groups. The first group consists of the conventional energy demand, the second is the energy storage and the third is defined as energy buffer. In 2021, the conventional energy demand has the most significant share on the demand side. However, if all energy demand is immediate and rigid, and only renewable energy sources are used, the needed energy overproduction would be immense. To solve this problem, a smart energy grid needs to be implemented. As mentioned in Section 2, smart grids make using peak shaving and energy storage possible. To understand the effects of smart grid technology better, in the following subsections, we are analyzing the characteristics of lithium-ion battery systems and pumped hydro stations. Afterwards, the conventional energy demand and its real-time data are analyzed for later use in Section 5.

4.1. Energy Storage

The most common way to change the energy needed without changing the actual demand is energy storage solutions. Hereby, the stored energy can be fed into the grid when the supply drops below the demand and can be stored when the supply is higher than the demand. Such a technology can potentially bring supply and demand to the same level and prevent blackouts in cities like Hamburg. Therefore, this section analyzes the behavior of two storage solutions in Hamburg Mitte. A large-scale battery and the hydro pump station Geesthacht, which is already in use by the city of Hamburg, are analyzed. With the help of data on the energy consumption and supply between 1 January 2019 and 5 April 2021 [22,25], it is examined that the standard deviation of the demand is 12.3% or 76.13 MW, whereas the supply’s standard deviation is 30.2% or 186.4 MW and thus is more than two times larger. On the other side, only 31.4% of the continuous over- or underproduction periods are shorter than six hours. These periods only cover 3% of the overall time. Thus, the storage solutions need to be able to store a lot of energy over extended periods of time.

4.1.1. Battery Systems

Melhem [26] states that on the scale of several independent residential units one combined storage system is 27% more cost-efficient and needs 33% less energy than several independent storage systems. For this reason, the following simulations are only using one large battery solution for the district of Hamburg Mitte.
To help understand the scale of this problem, an infinitely large battery is simulated. Hereby, the battery system starts empty and has a minimum capacity of zero Watt-hours. The first thing to notice is the large amount of battery storage needed for Hamburg Mitte. A battery solution with over 501 GWh would be needed to store all the access energy for this scenario. When using one of the leading battery solutions like the Megapacks from Tesla, each kWh costs roughly $300 with electronics [27]. Therefore, besides the spatial constraints of Hamburg Mitte, such a solution would cost more than $150 billion. In addition, the battery system in this scenario is not able to prevent all blackouts over the 2.4 years.

4.1.2. Hydro Pump Station Geesthacht

To supportively extend the battery system, the hydro pump station in Geesthacht is added to the simulation run. This hydro pump station has three pumps to force water from the Elbe river into an elevated reservoir. The water gains potential energy while traveling up three pipes to the elevated reservoir. By draining the lake, reservoir turbines generate electricity. Thus, the hydro pump station can be used similarly to a battery, thus smoothing the deviation between energy supply and demand. The hydro pump station in Geesthacht can store up to 534 MWh. While generating a maximum output of 120 MW, the system can run on 100% performance for almost 4.5 h until the reservoir is empty. Filling the elevated lake reservoir back up with water from the Elbe river takes around 5.6 h while using three 32 MW pumps [8].

4.1.3. Simulation of a Combination of a Battery System and the Hydro Pump Station Geesthacht

To analyze the effects of the storage solutions in this context, Algorithm 1 (see below) is used. It simulates the combination of a battery system and the hydro pump station of Geesthacht with real-time data. The average of the supply is again scaled to the average of the demand over 2.4 years. In addition, the storage capacity of the hydro pump station is adjusted to 239 MWh, the output to 53.76 MW, and the input to 43 MW according to the ratio of Hamburg’s and Hamburg Mitte’s energy demand. The battery system used is simplified and consists of a 120 MWh battery that can be charged and fed energy into the energy grid with a C / 4 (C = Storage capacity) rate [28]. As additional constraints, the real-life data for the supply S ( t ) and the demand D ( t ) is used in intervals of Δ t = 15 min starting on 1 January 2019 at 12:00 am and ending on 05 April 2021 at 10:15 pm. Hereby, the aim is not to smoothen demand peaks in an optimal way; rather, it is to gain information on the effects of storage systems at a large scale like a district in Hamburg. Feeley et al. [29] and Chandio et al. [28] have performed investigations on the most efficient strategies when using storage systems. The aim is to use energy storage to decrease the peaks on the demand side with the help of advanced algorithms. Their GridPeaks algorithm reduced the peaks on the demand side by 23% and the generation of costs by up to 14%.
Algorithm 1: Storage status, deviation, and new demand after hydro storage pumps and battery solution.
Sustainability 15 15834 i001

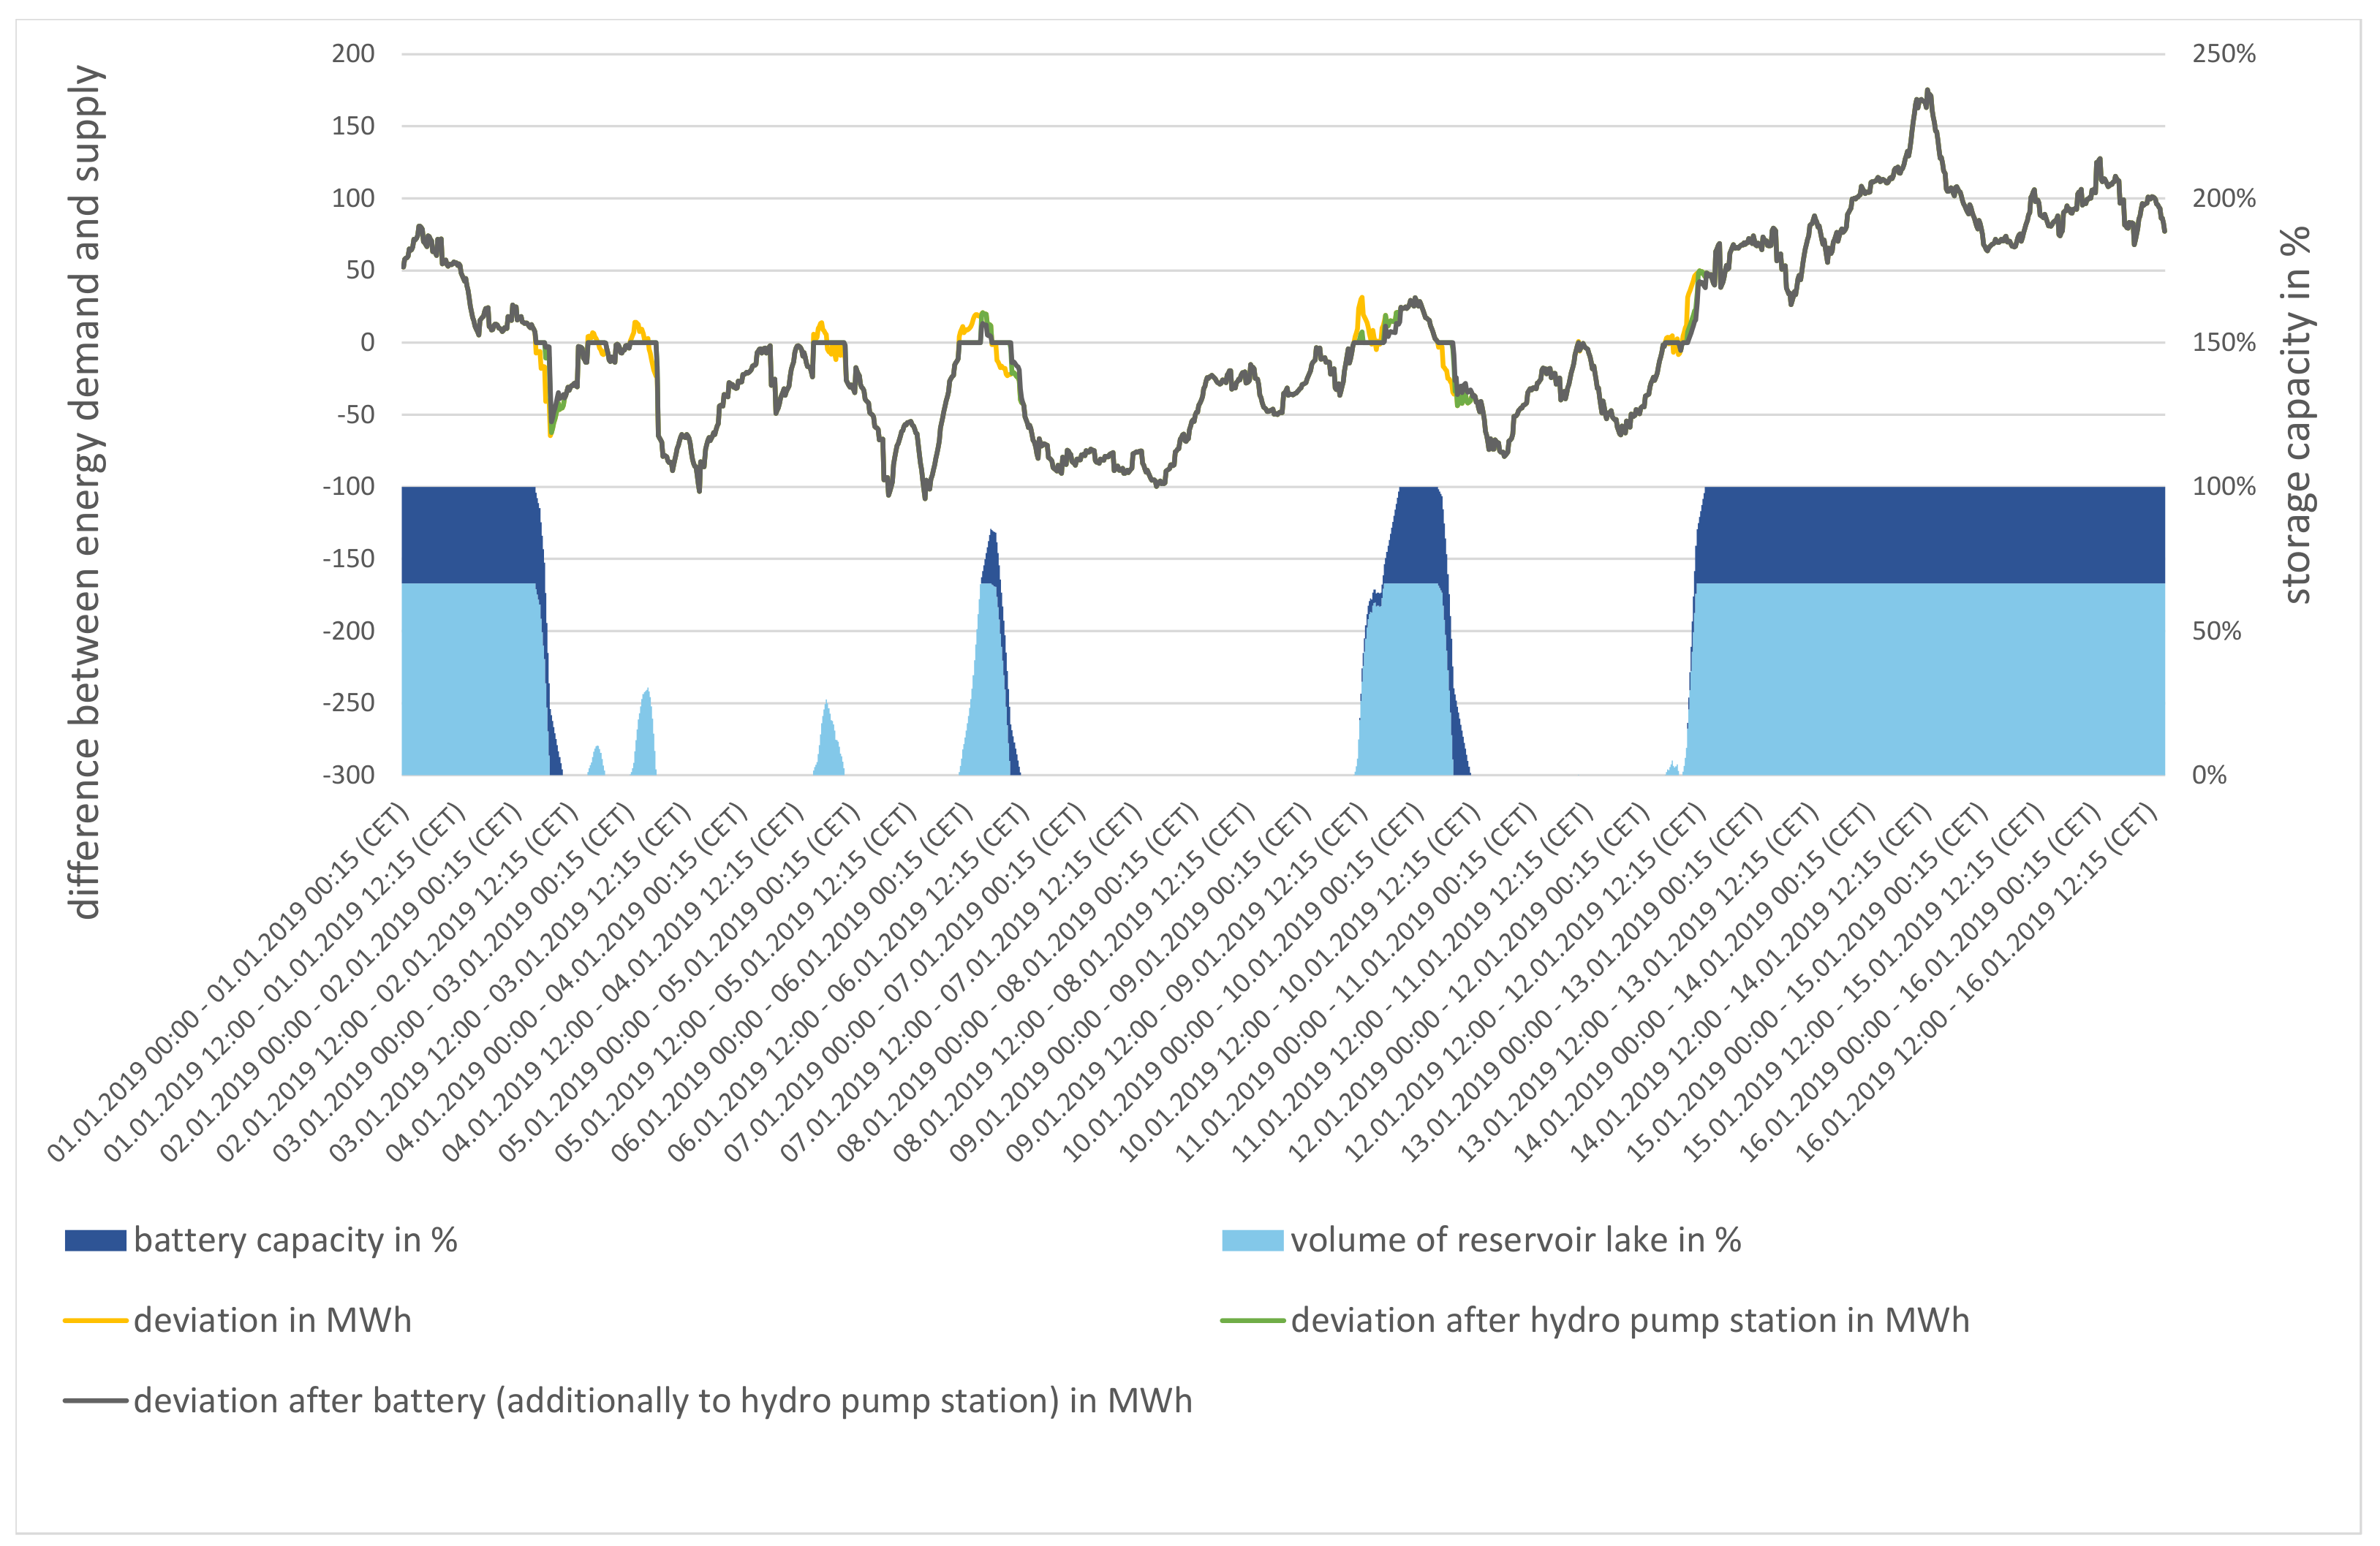
4.1.4. Results of the Simulation

The results of the simulation show that the scalability of storage systems to the size where they can handle the divergence between the demand of Hamburg Mitte and the supplied renewable energy without any waste of energy is not feasible with the current technology. Figure 2 showcases the simulated results of a hydro energy and a battery system working in combination with real-world data. It visualizes the sobering effects of conventional storage systems on a large scale. Most notable are the long periods with a constant over- or underproduction. If these can be broken up to have more frequent changes between the signs of deviation, it would help the storage systems provide a more uniform output. Secondly, it is crucial to notice that it is not about smoothing peaks (see Figure 1); instead, it is about leveling the deviation to zero. The demand must not be smoothed, it rather needs to be fitted to the supply even if that means increasing the energy consumption with storage or buffers at the peak of the energy demand. This is not feasible with today’s storage technology, as shown in Section 4.1.1. However, in this case study the storage systems reduce the overall positive deviation between demand and supply by 7.15%. The underproduction is also reduced by 7.13%. Therefore, the storage systems affect the overall deviation in Hamburg Mitte. However, this improvement is not enough to sustainably use renewable energies in the future. Thus, the next section analyzes the different participants and their behavior in energy demand in the HafenCity and the Port of Hamburg. Additionally, a thorough examination is conducted on virtual buffers to propose how to use buffer and storage systems to smooth the deviations between energy demand and the supply of renewable energy in the Port of Hamburg and the HafenCity district.

4.2. Conventional Energy Demand

To understand the effects of virtual buffers and energy storage on a large scale, real-time data of the energy demand is needed. Hereby, it is essential to differentiate between the energy consumers with their specific needs and behavior. Therefore, the spatial constraints of the previous section are reduced to the HafenCity district and the Port of Hamburg, and real-time data is collected, cleansed, and aggregated to build a data pool for the following simulations.
To build the data set, shown in Figure 3, several different data sources needed to be used. For the overall energy consumption of the households in the HafenCity, the data from the HafenCity Hamburg GmbH [30] and a combination of three online statistical sources [31,32,33] is used. The resulting energy consumption of 9353 MWh a year gets further used to scale the real-time data of several German households’ energy consumption from “Open Power System Data” [34].
Next, the commercial buildings’ energy demand is calculated by analyzing the HafenCity’s building complexes from [35] to get accurate data when pairing it with the “Commercial and Residential Hourly Load Profiles for all TMY3 Locations in the United States” from “Open Energy Data Initiative (OEDI)” [36]. Hereby, the data of Washington state is used due to a similar climate to Hamburg [37,38].
The third section of the energy demand is transportation. Hereby, this paper differentiates between electric cars, public transportation, and cruise ships connected to shore-based energy in the HafenCity. Private and car-sharing electric vehicles have distinctive cyclic charging patterns as seen in data from “ACN Research Portal” [39]. They show that on average each EV only charges 7.63 kWh of its battery (on average 60 kWh) a day [40] and the peak energy demand is five to six pm. For the calculation of the energy demand, the 238 user patterns from the “ACN Research Portal” are scaled up to fit the 4,046 loading stations planned for the HafenCity. For the energy demand of public transportation, only the subway’s energy demand is added to the data pool because there are no public plans to implement a charging hub for electric buses in the HafenCity. Other areas within Hamburg, like the Alsterdorf depot, have implemented such hubs; see, e.g., [41]. This also relates to the general issue of defining strategies for charging schedules in public transport, as envisaged, e.g., in Dreier et al. [42]. (Note that the HEAT project with public transport usage in the HafenCity utilized a restricted test environment that had been ended in 2021; see, e.g., [43].)
For the subway, two perspectives of energy demands are taken into account. The first perspective is the energy demand of the subway itself. Therefore, the length of the subway tracks in the HafenCity of 3.1 km [44,45] is combined with their timetables [46] and the average energy consumption of a comparable subway line in Valencia of 7.29 kWh per km per subway [47]. The second perspective is the energy consumption of the train stations and a paper from Casals et al. [48] is used. The energy demand from this paper is scaled accordingly to the estimated gross floor space of the three train stations of 10,150 m 2 [49,50] and added to the data pool seen in Figure 3. Finally, the real-time data of the energy demand from the shore-side energy of cruise ships is calculated using the plans for the near future of the HafenCity’s cruise ship terminals and the shore-side energy [51,52,53]. For the real-time data, hourly data of the arrival and departure of cruise ships in Hamburg, provided by Josten [54] is incorporated. Finally, an energy demand of 7–11 MW per vessel is randomly assigned [55].
The last section in the viewed area is the Port of Hamburg. It is especially interesting, because of its irregular energy demand, as seen in Figure 3. Due to missing publicly available real-time data, different data sources are used to build a realistic model of the container terminals’ energy demand. The major terminal operator HHLA published their aggregated energy consumption of 2019 in their “Sustainability Report 2019” [56]. It states that the three terminals of the HHLA consumed 123.2 million kWh in 2019. This is then used to estimate the energy demand of the Eurogate terminal at 50.6 million kWh. Next, data from Gao et al. [57] is used to analyze the port’s real-time energy demand. Hereby, the energy demands of the energy-demanding gear on the terminals are scaled to fit Hamburg’s four container terminals. Note that this also relates to the efficient use of shore-side electricity and even possible time-of-use windows and pricing as indicated, e.g., in [58].
Reefers, for example, demand a lot of the port’s energy demand. These cooling containers need the energy to cool their freight and have big potential as virtual buffers (see Section 4.3). Thus, the energy demand of reefers is separately calculated. For this purpose, data from the Port of Rotterdam is used [59]. At this port, the reefers are stored for three to four days on average. This paper uses three days and the list of sailings to simulate the changing number of containers at the port, with a maximum of 5272 reefers over three months. The average energy consumption per reefer is 3 kW; however, it can reach up to 10–15 kW [60]. Lastly, the list of sailings [61] is used to implement shore-side energy for container vessels. Even though shore-side energy is not implemented at the container terminals as of 2021, it is considered to be implemented till 2030 [62] and thus, including it in this paper ensures more future-proof results. (See also Yu et al. [63] for the formulation of an optimization problem to determine how to utilize a given budget for advising shore-side electricity at the various terminals of the Port of Hamburg.) For simplicity, we define container vessels with a length of up to 140 m as feeders needing 0.17 MW, and container vessels bigger than 140 m as seagoing vessels that demand 1.2 MW [64]. This results in peak demands exceeding 30 MW, along with downturns dropping below 4 MW.

4.3. Virtual Buffer

After analyzing the different energy demands in the HafenCity and the harbor area, this section briefly describes the virtual buffers before their characteristics are defined in Section 5.1.1. The first two virtual buffers can be found in the residential units. Here, appliances like washing machines and dishwashers can possibly delay their demand to a later point in time. In addition, private electric vehicles that are parked in garages in the HafenCity can be used as a virtual buffer by delaying their loading cycle. However, their lithium-ion battery can also be used as energy storage when connected to the grid. The next virtual buffers are the AGVs (Automated Guided Vehicles) at the Port of Hamburg. These battery-powered container transporters can be used in a similar way to private electric vehicles. The second opportunity at the Port of Hamburg is reefer containers (reefers). The large energy consumption of these cooling containers provides a significant possibility to change the port’s energy demand drastically.

5. Forecasting Models

To evaluate the effects and benefits of the virtual buffers, energy storage systems, and the technology currently in use, this section combines the results of the previous two sections. Additionally, several algorithms are developed to simulate the single and combined characteristics of smart grid technologies. For the renewable energy demand, data from Section 3 is used. This data is scaled to match the energy demand’s average (see Figure 3). Thus, mathematically, the energy produced by renewable energy sources matches the demand and does not result in over- or underproduction of energy. To visualize the impact of the different energy storage systems and virtual buffers, the following algorithms calculate the overproduction of renewable energy needed at different lithium-ion battery capacity levels. Thus the effects of several different technologies can be analyzed on different levels of overproduction.

5.1. The Simulation Model

The primary requirement for the subsequent simulation is as follows. Find a solution in which there is no power outage in the smart grid while reducing the need to build new battery storage systems and the need for energy overproduction by renewable energy sources. To analyze the different effects of the existing storage systems and virtual buffers, Algorithm 2 iterates over 20 different energy overproduction cycles and 20 different additional storage capacities.
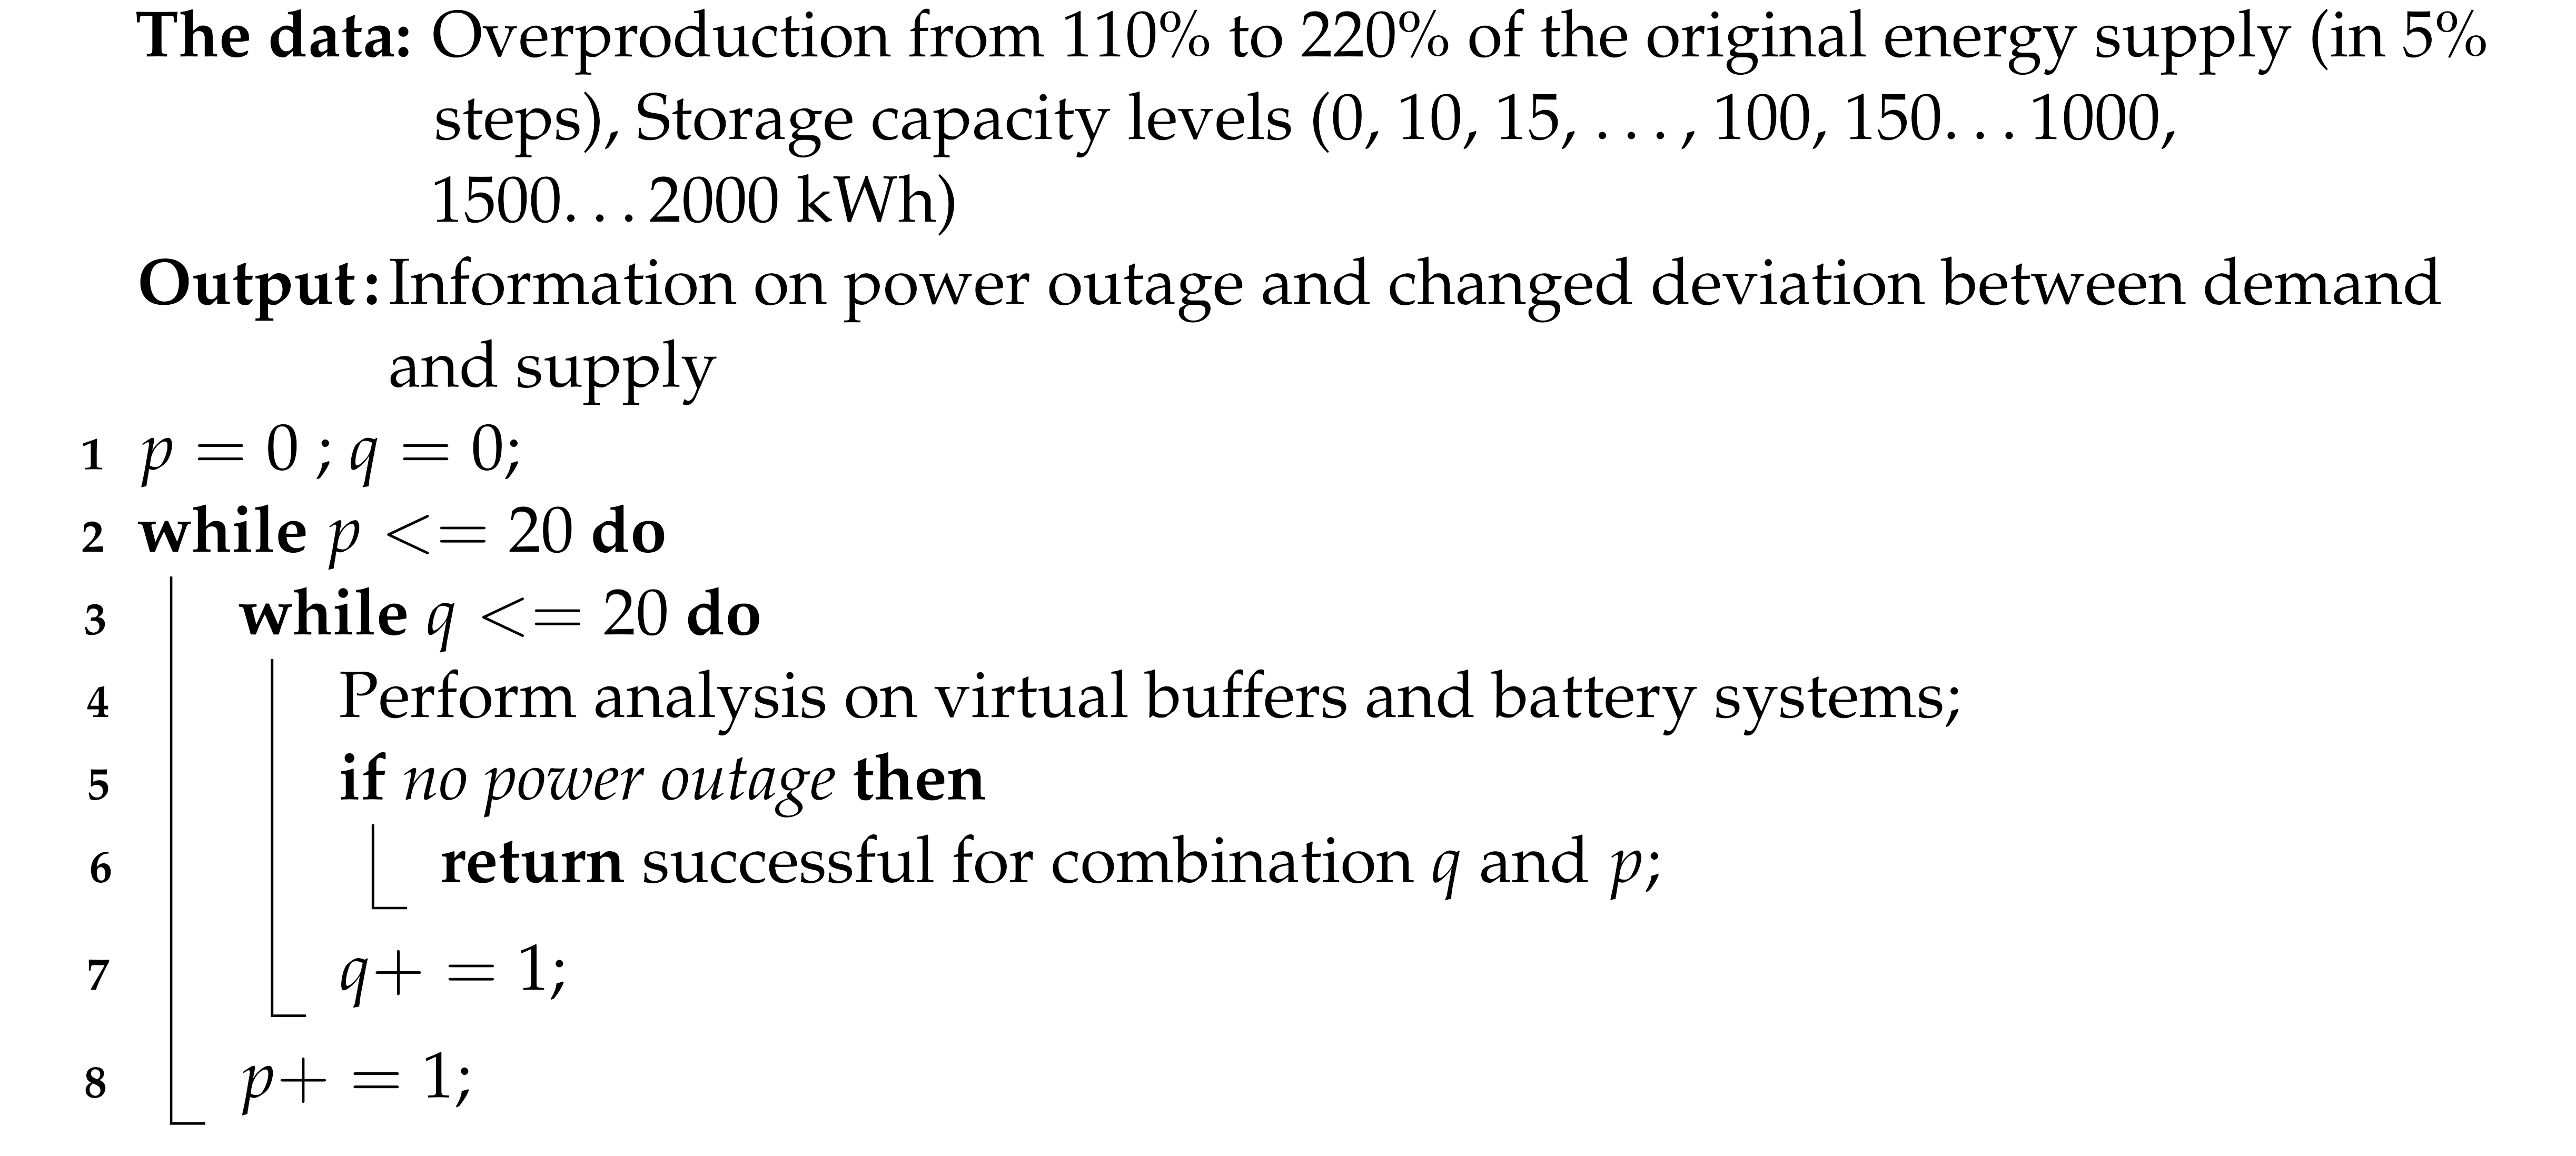
Algorithm 2: Iteration over energy overproduction and different energy storage capacities
Sustainability 15 15834 i002
Hereby, Algorithm 2 is deployed as an outer shell for the algorithms calculating the effects of, for example, EVs in combination with the hydro pump station and increasing battery capacities. First, the individual effects of EVs, household items, AGVs, and reefers on the energy grid are analyzed. Afterwards, they are jointly simulated to visualize the final results. The hydro pump station in Geesthacht and a battery system are always simulated with the individual virtual buffer to evaluate their effects for different scenarios. Thus, Hamburg’s already existing infrastructure is always in use. Algorithm 1 shapes the energy demand with the hydro pump station and the battery system, while the battery system’s capacity is scaled up incrementally. The capacity, charging, and feeding back rate used in this simulation are the same as in Section 4.1.3. As seen in Algorithm 1, the hydro pump station is used before the battery system. However, this does not affect the results of the algorithm. For a better understanding, a snapshot is analyzed at 65% overproduction and 400 MWh battery capacity. Hereby, the results often depend on small changes and extreme peaks because the following simulation, with an additional 50 MWh battery capacity, runs without any blackouts. Thereby, the −11.4 MWh from the run before is compensated by the battery system. However, using already existing infrastructure and information management, these results can be improved.

5.1.1. Virtual Buffer and Storage Solutions

In this section, the different algorithms and input data for the virtual buffers and storage solutions are presented. In addition, characteristics of the virtual buffers and storage solutions, that were necessary to develop the following algorithms are also shown in the subsequent paragraphs. Thereby, this section starts with EVs, continues with AGVs, and reefers, and ends with household items. Hereby, the following algorithms are placed beside Algorithm 2 in the two while loops.
EVs can be used in two different ways to reduce energy overproduction. For the first option, the users’ behaviors are essential. As already described in Section 4.2, EVs get charged in a cyclic pattern. Most of the time, the EV gets charged after the user gets home after work. However, at this time, several other, non-changeable energy demand sources need energy. The benefit of EVs is their advanced technology inside them and their charging station. The majority of people living in the HafenCity sleep at night. In addition, most office buildings have a low energy demand during the night. Thus Algorithm 3 checks if the energy demand for charging the EVs at the HafenCity can be delayed.
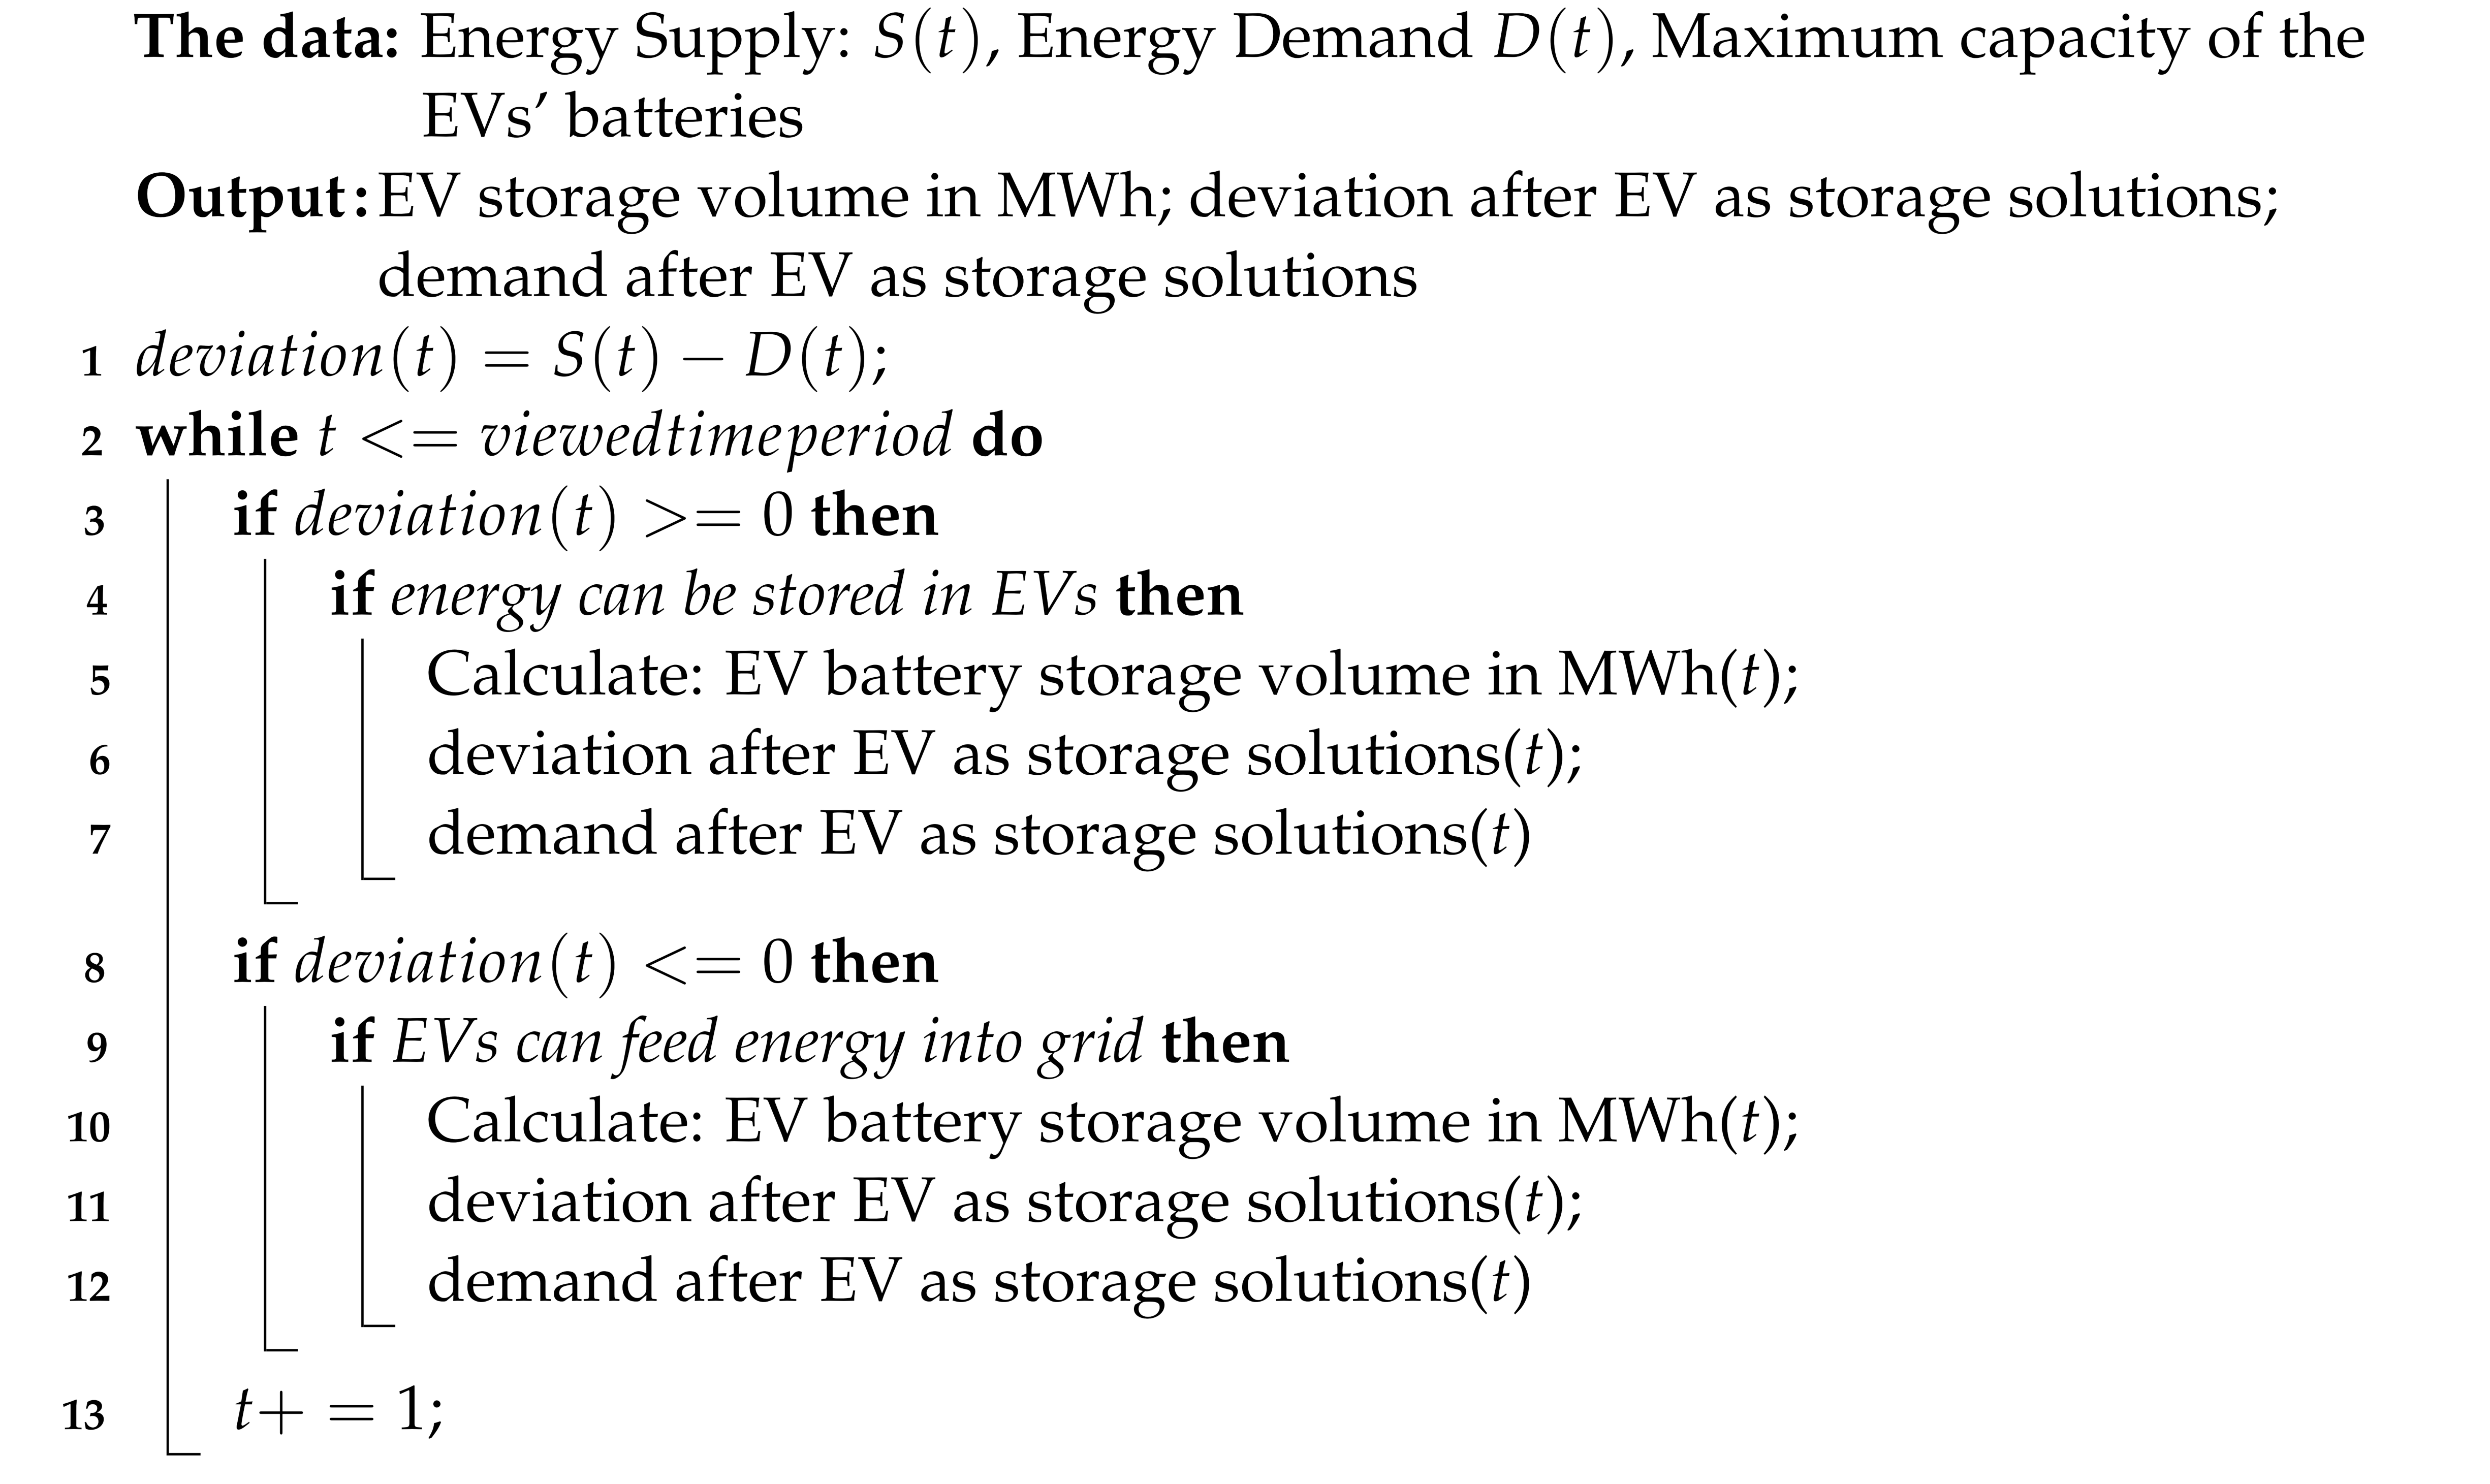
Algorithm 3: Electric vehicles as virtual buffer
Sustainability 15 15834 i003
In Algorithm 3 the procedure for delaying the energy demand of EVs at the HafenCity is described. In there, the script first decides if there is a need to use the EVs as virtual buffers by checking for negative deviations in the ratio of energy demand and supply between 5 pm and 7 pm. In case of an energy deficit, the energy demand of the EVs during this period is determined and is set as changeable energy demand for load shifting. Finally, the algorithm checks, whether there is any period of energy overproduction between 7 pm and 5 am and shifts the load to the new charging period. This procedure of using the EVs as virtual buffers does not disturb the owners’ normal use, because the car is always charged the next day. Thus, this paper shows the effects of EVs as virtual buffers in a more realistic and critical way. As already shown in Section 4.2, most EVs only use 7.63 kWh or 12.7% of their 60 kWh battery. For this reason, the next step utilizes the unused battery capacity left in the vehicles as a storage system. In the HafenCity, there are many private parking lots for EVs, yet this does not mean that all EVs will be constantly plugged in. However, to evaluate the potential and to showcase investment possibilities in the future, this paper calculates two results. The first result is calculated by only using Algorithm 3 and Algorithm 1 in Algorithm 2 and showcases the potential of using EVs for peak shaving. The second simulation run analyses the effect of additional storage capacity by EVs combined with the peak shaving characteristics. Therefore, 80% of all EVs’ energy capacity is used as a battery storage system. Hereby, Algorithm 1 is slightly adjusted to calculate the new difference between energy demand and supply, as shown in Algorithm 4.
To calculate the additional battery capacity, 80% of the EV’s battery capacity of 60 kWh is multiplied by 4046, the number of charging stations. Hereby, the total capacity is 194,208 kWh. Afterwards, the EVs’ batteries are simulated with Algorithm 4 which behaves in a similar way as the algorithm for the large-scale battery. The order in the simulation is as follows: The simulation starts with the peak shaving algorithm (Algorithm 3), continues with the battery and storage solutions described in Algorithm 1, and ends with Algorithm 4 when the EVs’ batteries are applied.
Next, the AGVs at the Port of Hamburg are discussed. To clear the containers, or move the containers around the port, a lot of energy is needed. In the CTA (Container Terminal Altenwerder), even the transport of the container over the ground is done by EVs (AGV) [65]. These vehicles are powered by 275 kWh lithium-ion batteries [66] and thus have similar characteristics as the private EVs that transport humans [67]. On the one hand, they can delay their demand. On the other hand, they can be used as power banks in the smart energy grid when they are not in use. Hereby, the HHLA [68] states that up to 4 MW can be fed back into the energy grid. Additionally, they do not have the same cyclic loading pattern as private EVs and thus can help reduce peak energy consumption.
Algorithm 4: Electric vehicles as battery
Sustainability 15 15834 i004
For this paper, the occupancy of the AGVs is determined by the arriving vessels, thus also by the tide, weather, and loading cycles, as stated by the HHLA [68]. However, for further analysis, the occupancy of the AGVs is determined by the list of sailings [61], which shows the number of vessels arriving at the port. Additional information used is the length of a charging cycle, which takes around 1.5 h to fully charge [69]. Thereby, the battery capacity of the lithium-ion batteries built into the ”Konecranes Gottwald automated guided vehicles” used by the HHLA at the CTA is 275 kWh [66]. With 18 charging stations, it takes 9 h to fully charge every AGV when 18 vehicles are charged in parallel, and there is no gap between loading the first and second batch of vehicles. Thereby, the loading stations consume 3300 kW per hour. Two functions are defined to describe the loading behavior to calculate hourly data of AGV’s energy demand. These functions describe only the CTA; however, in the discussion, the effect of four terminals equipped with battery-powered AGVs is analyzed. First, Equation (1) describes the time between each loading cycle according to the number of vessels moored (x). Hereby, the shortest cycle is used by 30 parallel moored vessels and results in 18 h of run time with 1.5 h of charging time [61].
f ( x ) = 0.9 x + 46.5
This function can be extended to describe the energy demand of the AGVs. Qiu and Hsu et al. [70] or Singh et al. [71] have described and developed state-of-the-art scheduling algorithms, where the latter also included a critical battery constraint. However, this paper concentrates on energy demand management with the help of a smart grid. Thus a simple mathematical function to describe the average hourly energy demand is sufficient. When the AGVs’ usage rate is 100%, a cycle takes 19.5 h to be fully charged. Then, on average, 8.39 charging stations are in use constantly. For Equation (2), x is the number of vessels, while x > = 1 . For x < 1 the energy demand is 0W. The result is the average hourly energy demand in kW.
f ( x ) = 30.62 x + 619.38
As with the EVs, the AGV effects are calculated by two separate algorithms. First, the AGVs are used as a virtual buffer in Algorithm 5. Hereby, only the periods are analyzed in which less than 80% of the maximal vessel capacity at the container terminals is used. In this case, 19 vessels is the maximal number of vessels that are moored in parallel at the port. Thus, the periods with less than 15.2 vessels in the list of sailings per 15-min interval are analyzed. The reason is that there would not be any possibility to delay the energy demand of the AGVs when there are too many ships moored, and thus many containers need to get transported and every AGV is needed immediately. Besides the regular energy demand described in Equation (2), the energy demand also can be delayed [67]. In addition, with the CTA’s infrastructure, it is theoretically possible to feed 4 MW back into the energy grid. Thus, each loading station can unload the AGV’s batteries completely with 222 kW, which takes 1 h and 37 min. At this time, the other 82 AGVs can work normally.
Algorithm 5: AGVs as virtual buffer
Sustainability 15 15834 i005
Secondly, the AGVs can be used as an energy source, calculated by the HHLA. 4 MW could be fed back into the energy grid under full load. Unfortunately, data on the kWh for this scenario is not published. With a total capacity of 27.5 MWh with all AGVs, the capacity used in this paper is reduced to 10 MWh. However, the AGVs are only used as a battery system when less than twelve vessels are moored at the port. This prevents the terminal from having not enough AGVs to clear the vessels. In addition, only 50% of the charging stations’ unloading rate is used to reduce the effect of the AGVs as battery systems. After that, slight changes are made to Algorithm 5 to calculate the new energy demand. Besides the changed charging rate and capacity of the batteries provided by the AGVs, an if clause is added directly after “while t <= viewed time period do”. It checks if less than twelve vessels are moored at the port before going to the next line of the algorithm.
Reefers are virtual buffers that can delay their demand. With this, they behave very similarly to battery systems. The standard energy demand per reefer is 3 kW. This demand can be turned off for 24 h. Then the temperature rises at a rate of 0.0625 °C per hour [60]. To cool the reefer back down to −26 °C, the energy demand is added to the regular energy demand if possible. It is not important when the reefer gets cooled again because everything below −21 °C does not harm the goods inside the containers [60]. As a result, the temperature of the reefers is equivalent to the capacity of the battery systems. For simulating the effects of the reefer, Algorithm 4 is slightly adapted. Instead of the battery capacity, the limitations of the virtual buffer are calculated with the temperature. In addition, the demand after the reefer is turned off is calculated by subtracting the “maximum of the energy demand by the reefers” (calculated with the list of sailings) and the “difference between energy demand and supply * ( 1 ) ” from the energy demand for every 15 min. Cooling the reefer back down during energy overproduction periods works the other way around. It is assumed that the reefers’ energy demand can be turned on or off in 15-min intervals. The temperature in this algorithm is the average temperature of all reefers. Thus, even small under-productions of energy can be balanced. Therefore, only the number of reefers needed to compensate for the underproduction is turned off, and the temperature changes in proportion to the number of reefers not needing energy. This helped to balance the difference between energy demand and supply at 0 W.
A dishwasher and washing machines also worked as a virtual buffer. For the data of the washing machine, a publication of the “Oko-Institut e.V.-Institute of Applied Ecology“ [72] is used. On average, a washing machine is used 164 times a year while consuming 0.25 to 1.6 kWh depending on the washing temperature. Thereby, on average, 140 kWh a year is going to be consumed by each washing machine. Therefore, with 3797 residential units, 5.31 MWh a year is consumed by residents in the HafenCity. The data for the dishwasher is provided by a combination of websites stating that the number of rinsing cycles per year is 280 with an energy demand between 0.9–1.6 kWh [73,74].
Their behavior can be represented with a slightly changed Algorithm 5. With this, the algorithm searches for points in time where the energy demand can be delayed for 1.5 h. The problem with household items like washing machines and dishwasher is their volume level. In particular, washing machines can be very loud during spinning cycles. Thus, the energy demand for these items cannot be delayed, for example, to 3 am without disturbing the neighbors. To calculate the energy consumption that can be delayed, the average energy demand of the washing machines and dishwashers in the HafenCity per 1.5 h is calculated. In addition, it is assumed that the average rinsing cycle needs 1.5 h to finish. The values from Section 4.2 are used to calculate the amount of energy, which resulted in 247.7 kWh every 1.5 h. In addition, the if clause of Algorithm 5 is obsolete and is not used for household items as virtual buffers.

5.2. Results

This subsection presents the outcomes of the forecast model to be used in Section 6 to evaluate the effectiveness of diverse buffer and storage solutions in managing overproduction concerns. To analyze the effects of the different virtual buffers and battery solutions, Algorithms 2 and 1 use the data from the previous sections over a period of three months. The first run only utilizes the hydro pump station and the battery system and is used as a reference and shows the impact of different levels of energy overproduction and increased storage capacities. In orange, Figure 4, Figure 5, Figure 6 and Figure 7 show the minimum battery capacity per 5% overproduction steps needed to prevent blackouts. It visualizes the first run without any additional buffer or storage system and enables a direct comparison.
y = 24105 e 0.627 x
The exponential function (3) describes the results without the additional technology. It originates from systematic trend analysis, searching for the best model and fits the simulation results with a coefficient of determination of R 2 = 0.9726 . It indicates the goodness of fit for the exponential function. y describes the battery storage capacity. x represents the overproduction of renewable energies in %*100. The function originates from a systematic trend analysis, searching for the best model.
Every impact analysis consists of several simulation runs. It always starts from 120% overproduction of renewable and no additional storage capacity and incrementally lowers this value by 5%. As seen in SubSection 5.1, the determination of the minimum required battery capacity for blackout prevention per overproduction point is computed.
No battery capacity is needed to level out the energy demand and supply until the overproduction reaches 60%. Notice, that the hydro pump station is always included in the simulation. At this point, 80 MWh of battery storage is needed to compensate for the missing renewable energy overproduction. On the other end a battery capacity of 9.5 GWh, is able to stabilize an overproduction of only 30%. Due to the substantial surge in required battery capacity, the reference simulation was halted at a 30% overproduction threshold.
In the following subsections, the outcomes of the distinct technologies will be presented. Afterwards, a cost analysis is performed in SubSection 5.2.6 to provide insight into the economic feasibility of integrating various smart grid technologies within an urban energy framework.

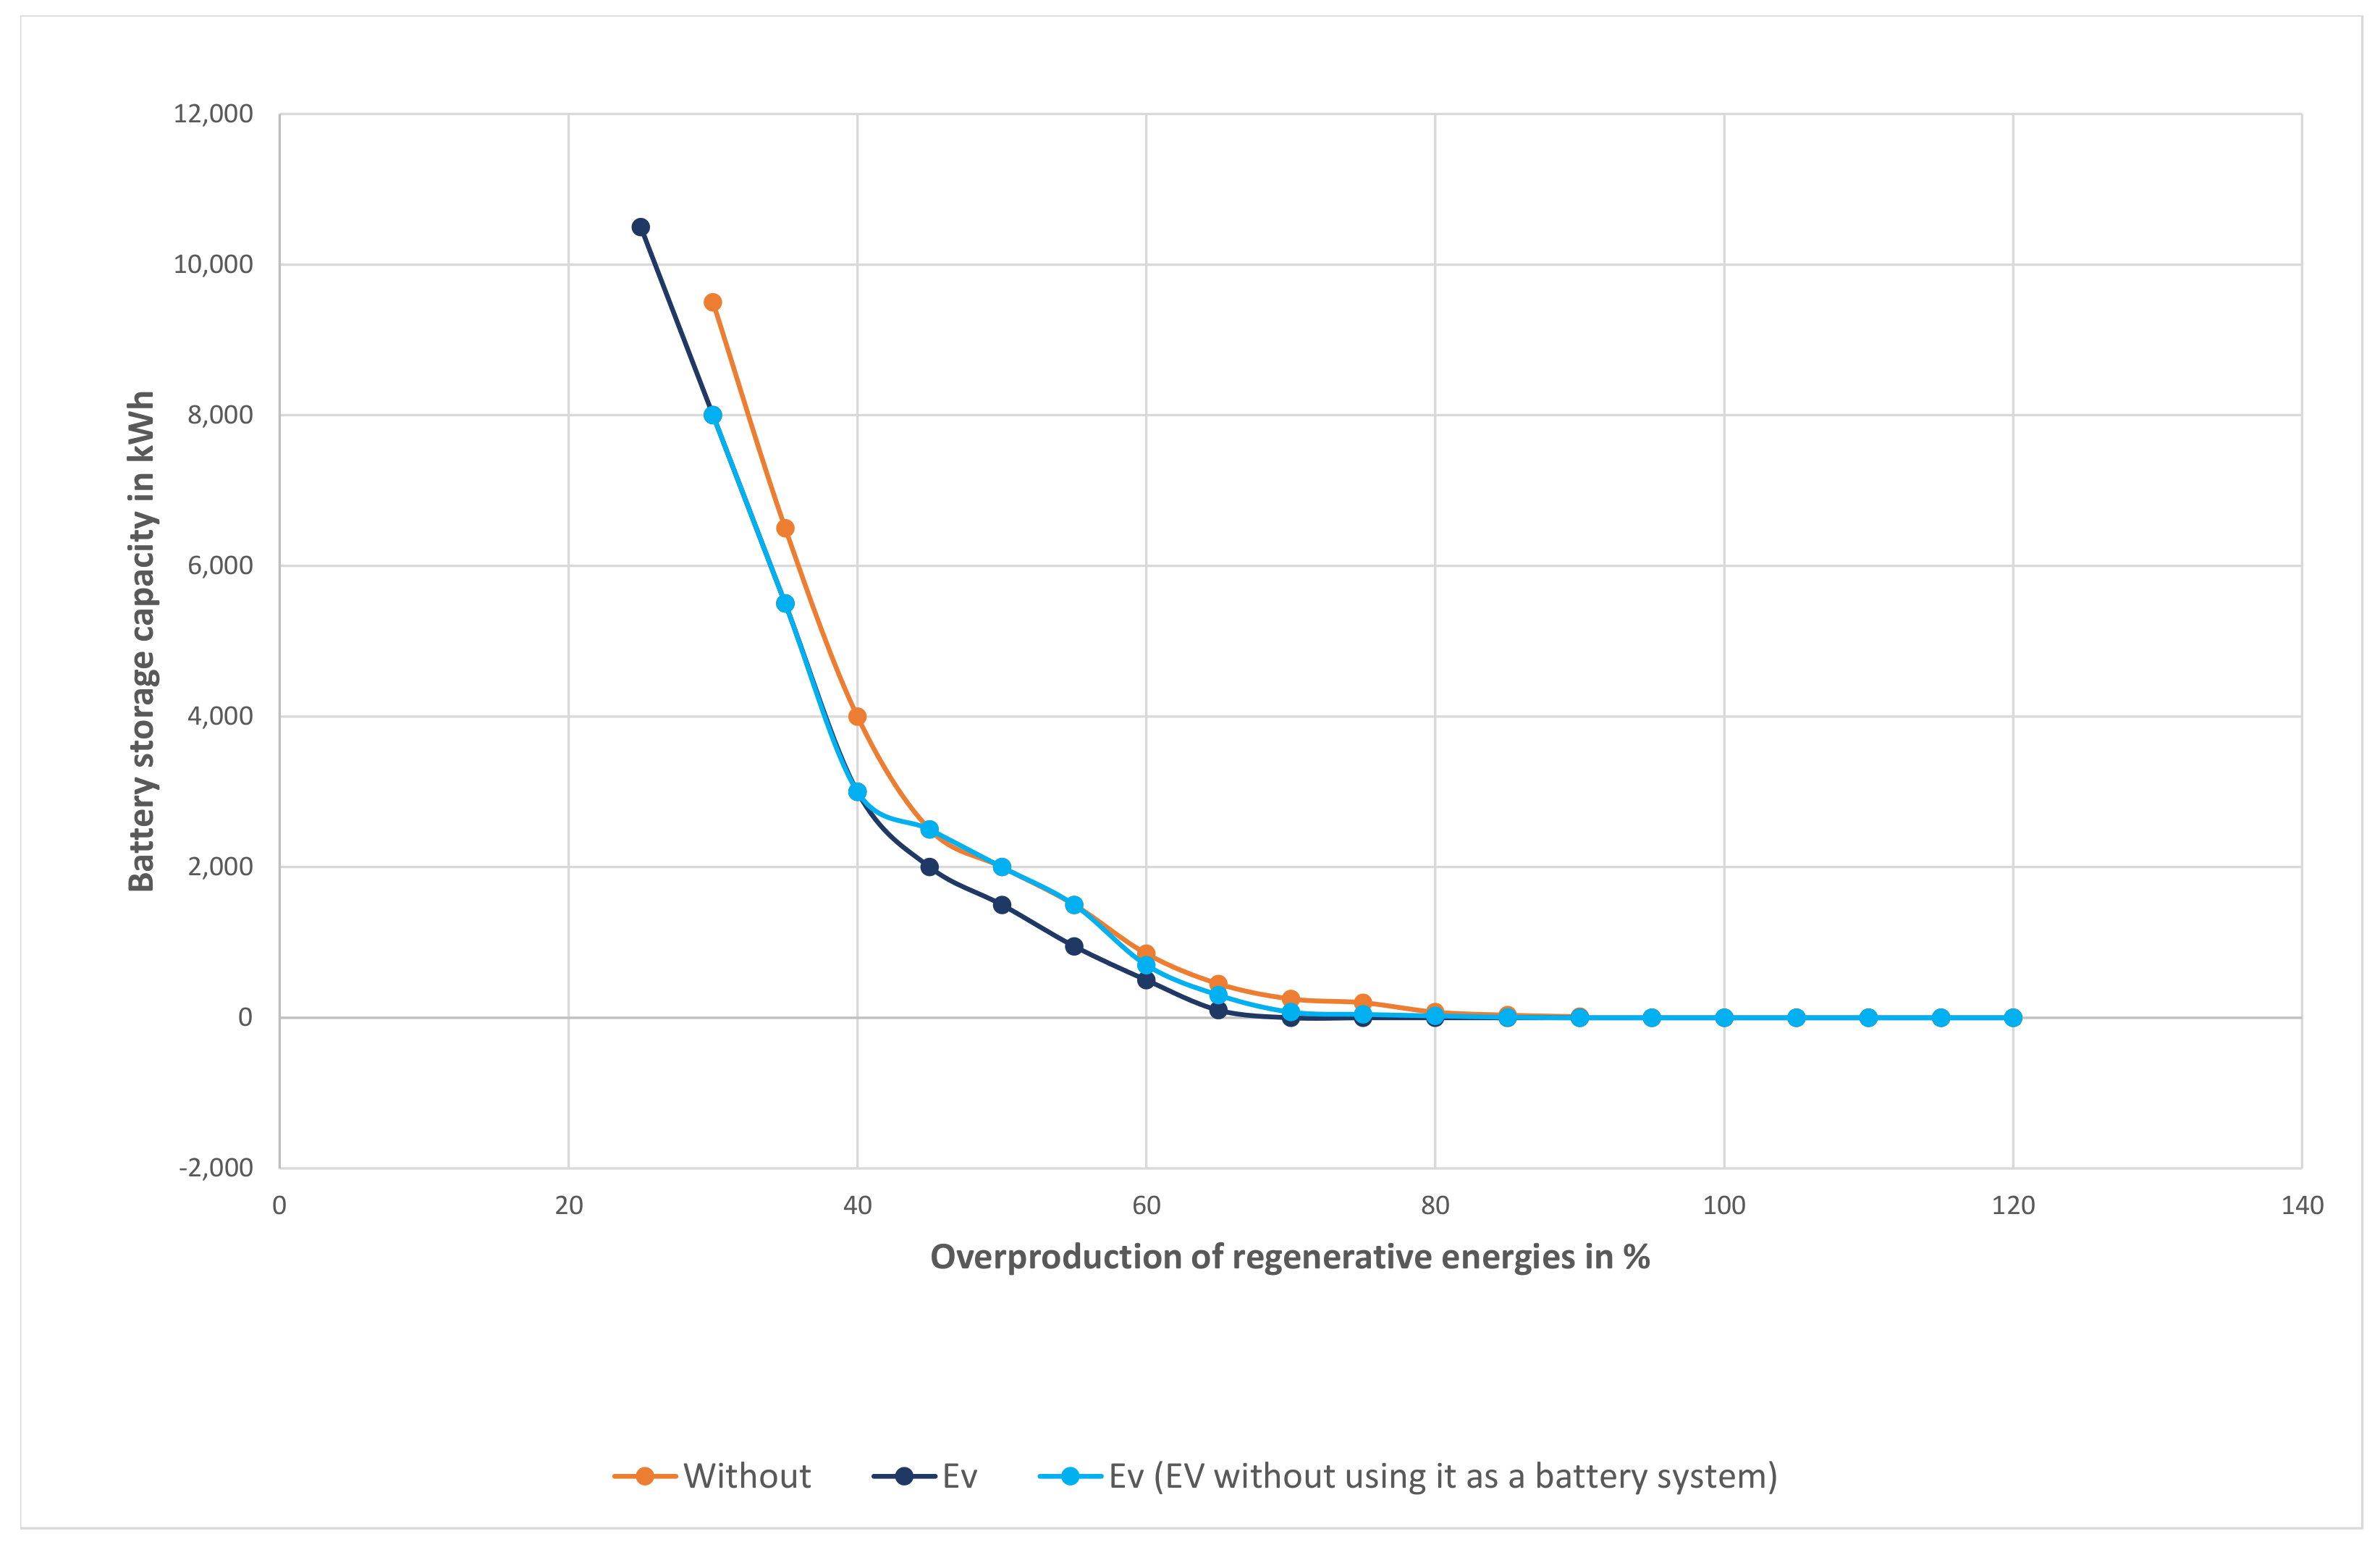
5.2.1. Impact of Electric Vehicles

As already mentioned in Section 5.1.1, two different effects are simulated. First, EVs are only used as virtual buffers without using their battery capacity. Thus, the energy demand for EVs, which is the highest between 5 pm and 7 pm, is delayed in case of an energy underproduction at this time.
Hereby, the effect of the virtual buffer gets visible at 85% overproduction and reduces the need for battery capacity to 7 MWh. Figure 4 shows that the EVs’ effect reduces the need for battery storage between 90% and 60% overproduction by up to 150 MWh. At a lower overproduction, this effect is amplified and can save up to 1500 MWh of battery capacity at 30% overproduction.
The second function shown in Figure 4 describes the effect of the EVs as virtual buffers combined with the 80% battery storage capacity of the EVs to support the extensive battery system. As a result, the additional stored energy has a more significant impact than the utilization of the EVs as virtual buffers, especially combined with the high overproduction. Hereby, EVs can lower energy overproduction without using additional storage capacity. With a 70% overproduction, the system does not need any additional battery storage at all. Hereby, 250 MW per hour less energy overproduction is needed for the port area and the HafenCity. However, the difference between the two EV scenarios becomes smaller when the overproduction decreases. To summarize, EVs significantly impact the ratio between the overproduction of renewable energy and the needed battery capacity. Between 40% and 55% overproduction, the system needs up to 1000 MWh less energy storage capacity than the system without integrating the EVs.

5.2.2. Effects of Reefers

Next, the effects of reefers as virtual buffers are analyzed. Hereby, Figure 5 shows the original and the data points of the combination of reefers as virtual buffers, the battery system, and the hydro pump station in Geesthacht. The combination with the reefers is the most effective one from 65% to 30% overproduction and, thus, reduces the overproduction in relation to the battery capacity more than the EVs. On the other hand, EVs and their combined storage capacity are more effective between 70% to 90%. However, as seen in Figure 5, the reefer is also very practical with a higher overproduction of energy. It reduces the additional need for storage down to 85% instead of 95% without the buffer. In addition, the needed battery capacity of 4 to 45 MWh between 80% and 70% while using the reefer is a significant improvement.

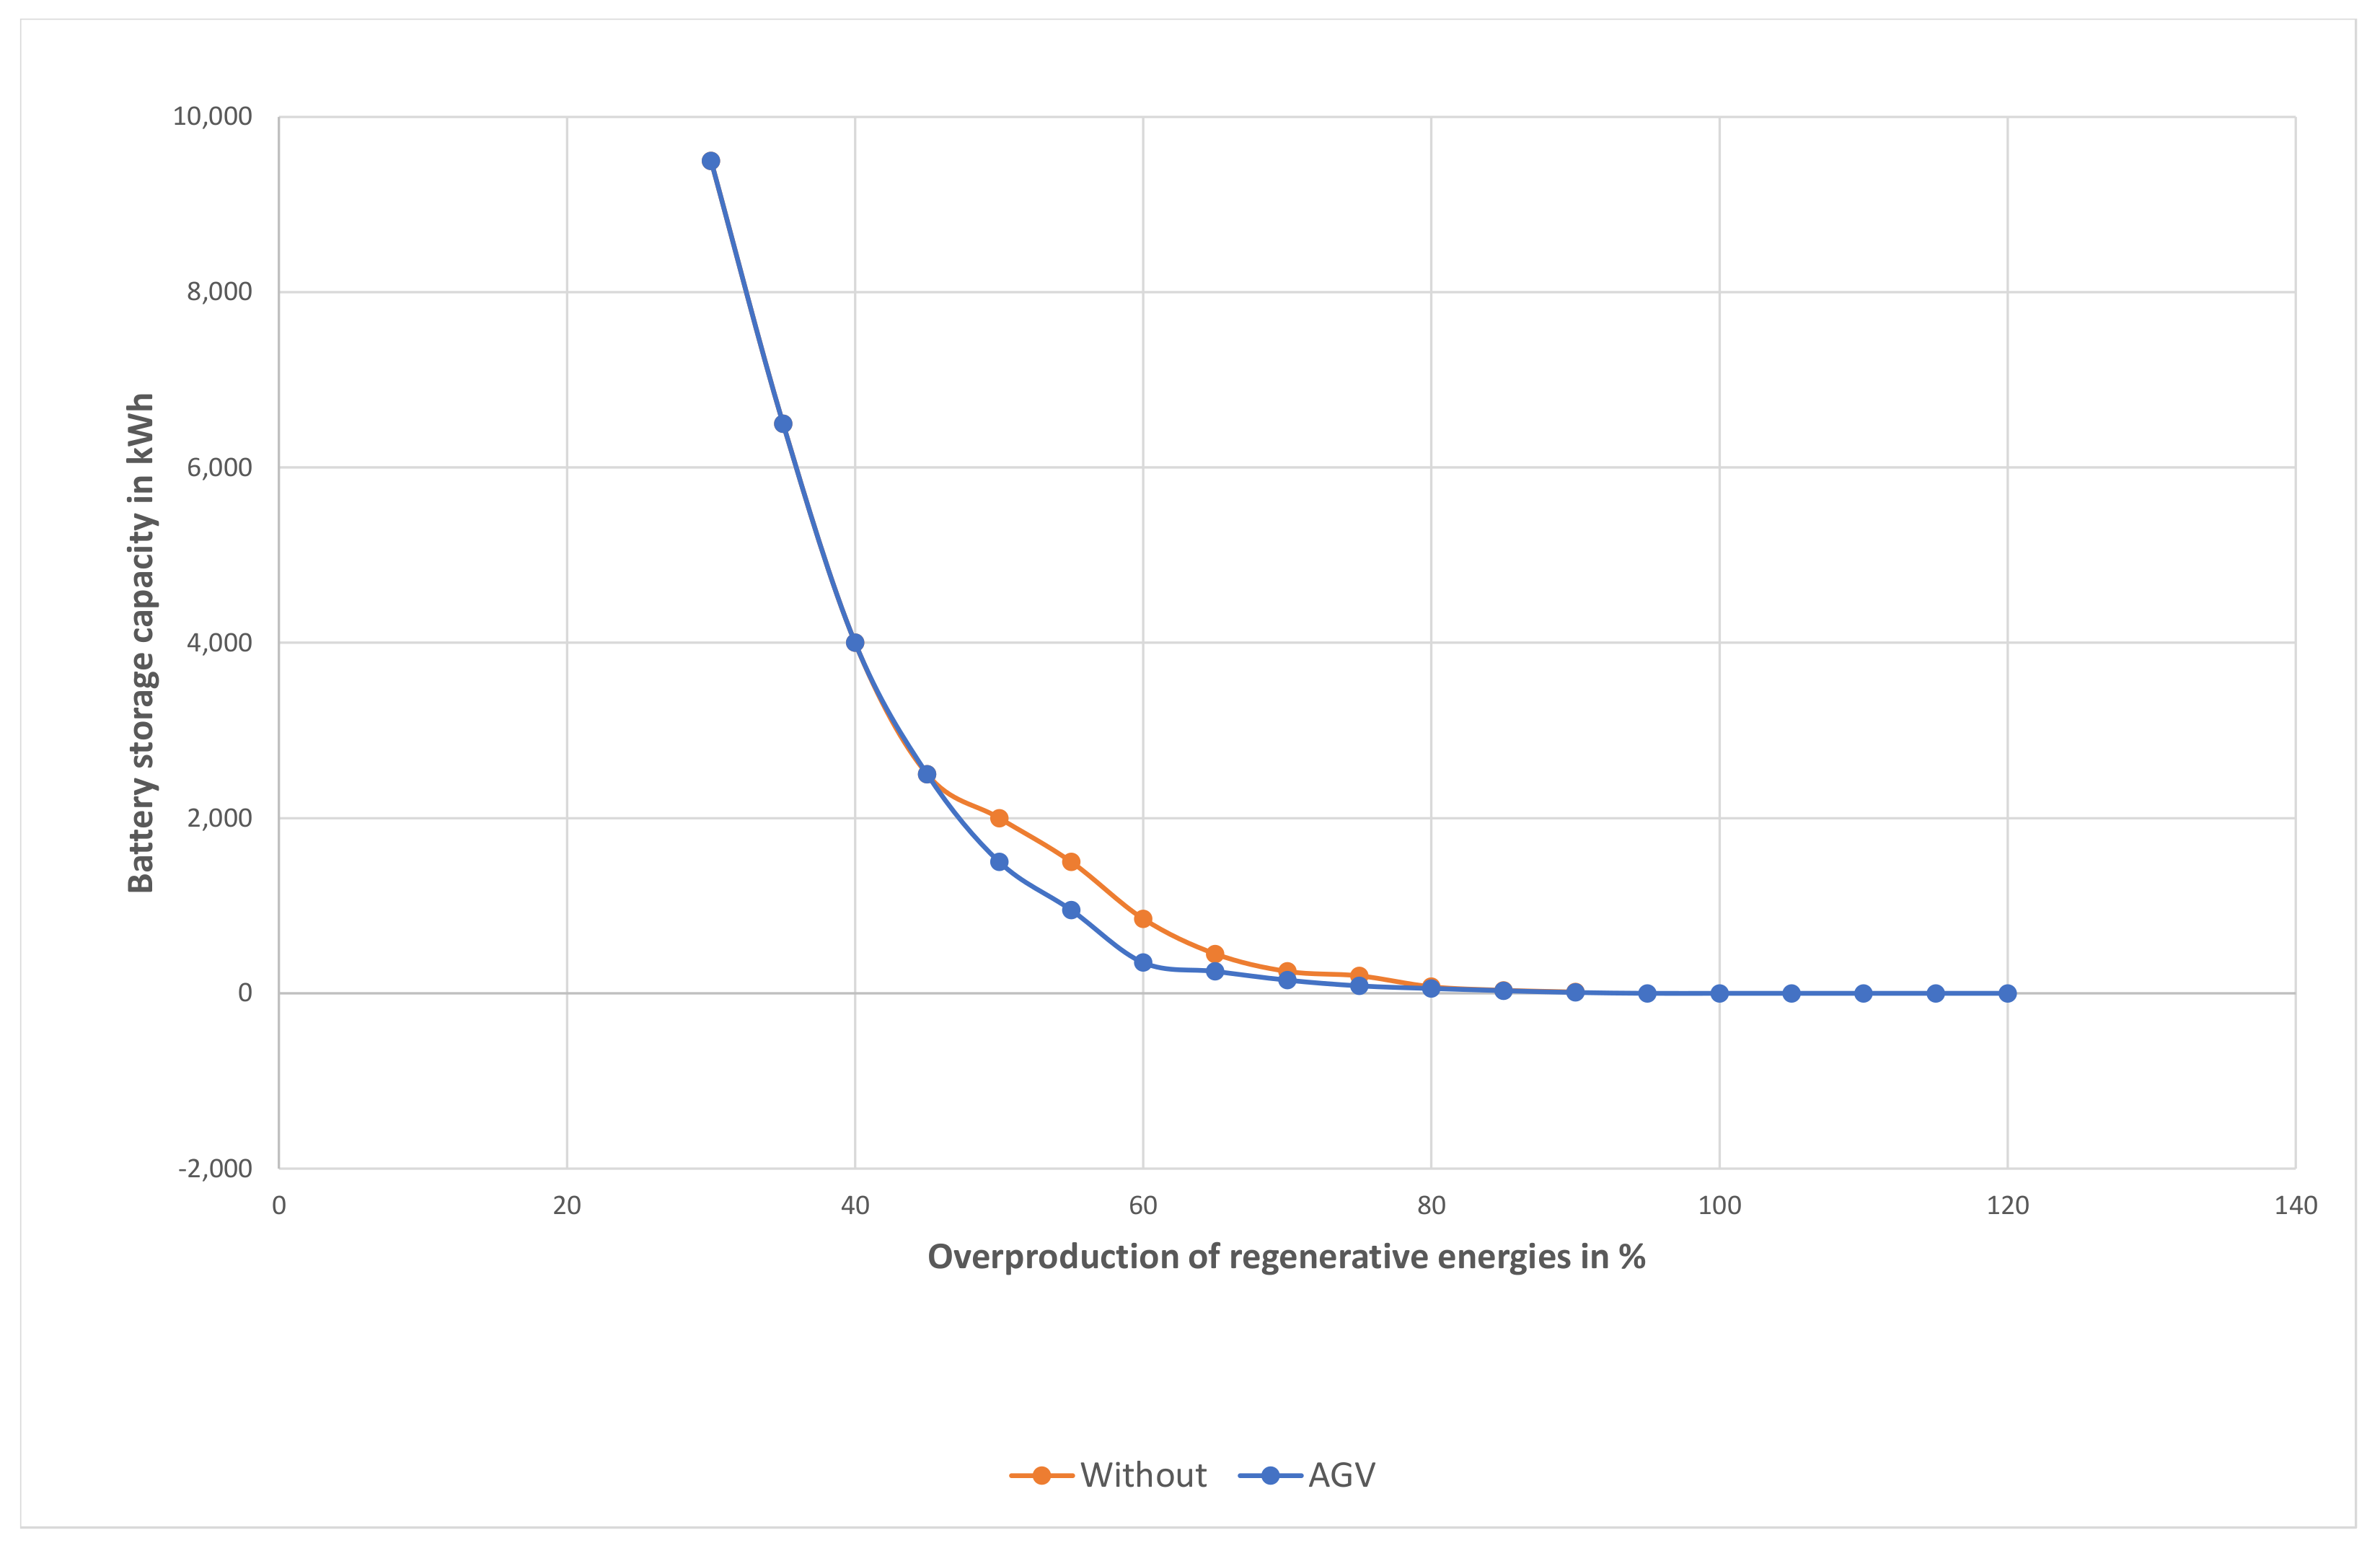
5.2.3. Effects of AGVs

The second virtual buffer and storage solution provided by the Port of Hamburg is the AGVs. Despite their high battery capacity per vehicle, the high usage rate of these vehicles results in them not being as good as EVs. However, between 65% and 50%, their result is better than the result of the EVs (as seen in Figure 7), when they are just being used as virtual buffers. Figure 6 visualizes the effects of the AGVs. Hereby, the AGVs only affect the outcomes of the simulation between 90% and 50%. In this interval, they save up to 550 MWh battery capacity; however, they do not reduce the overproduction when no battery system is used.

5.2.4. Effects of Household Items

The last virtual buffer tested at the scale of the HafenCity and the Port of Hamburg are the dishwashers and the washing machines. However, at the intervals of Algorithm 2, no changes are visible. At an overproduction of 65% and a battery capacity of 400 kWh, the algorithm had only 26 opportunities in over three months to delay its energy consumption. Then, only 247.7 MWh are delayed. On this scale, the household items’ effect is not significant enough to be measured.

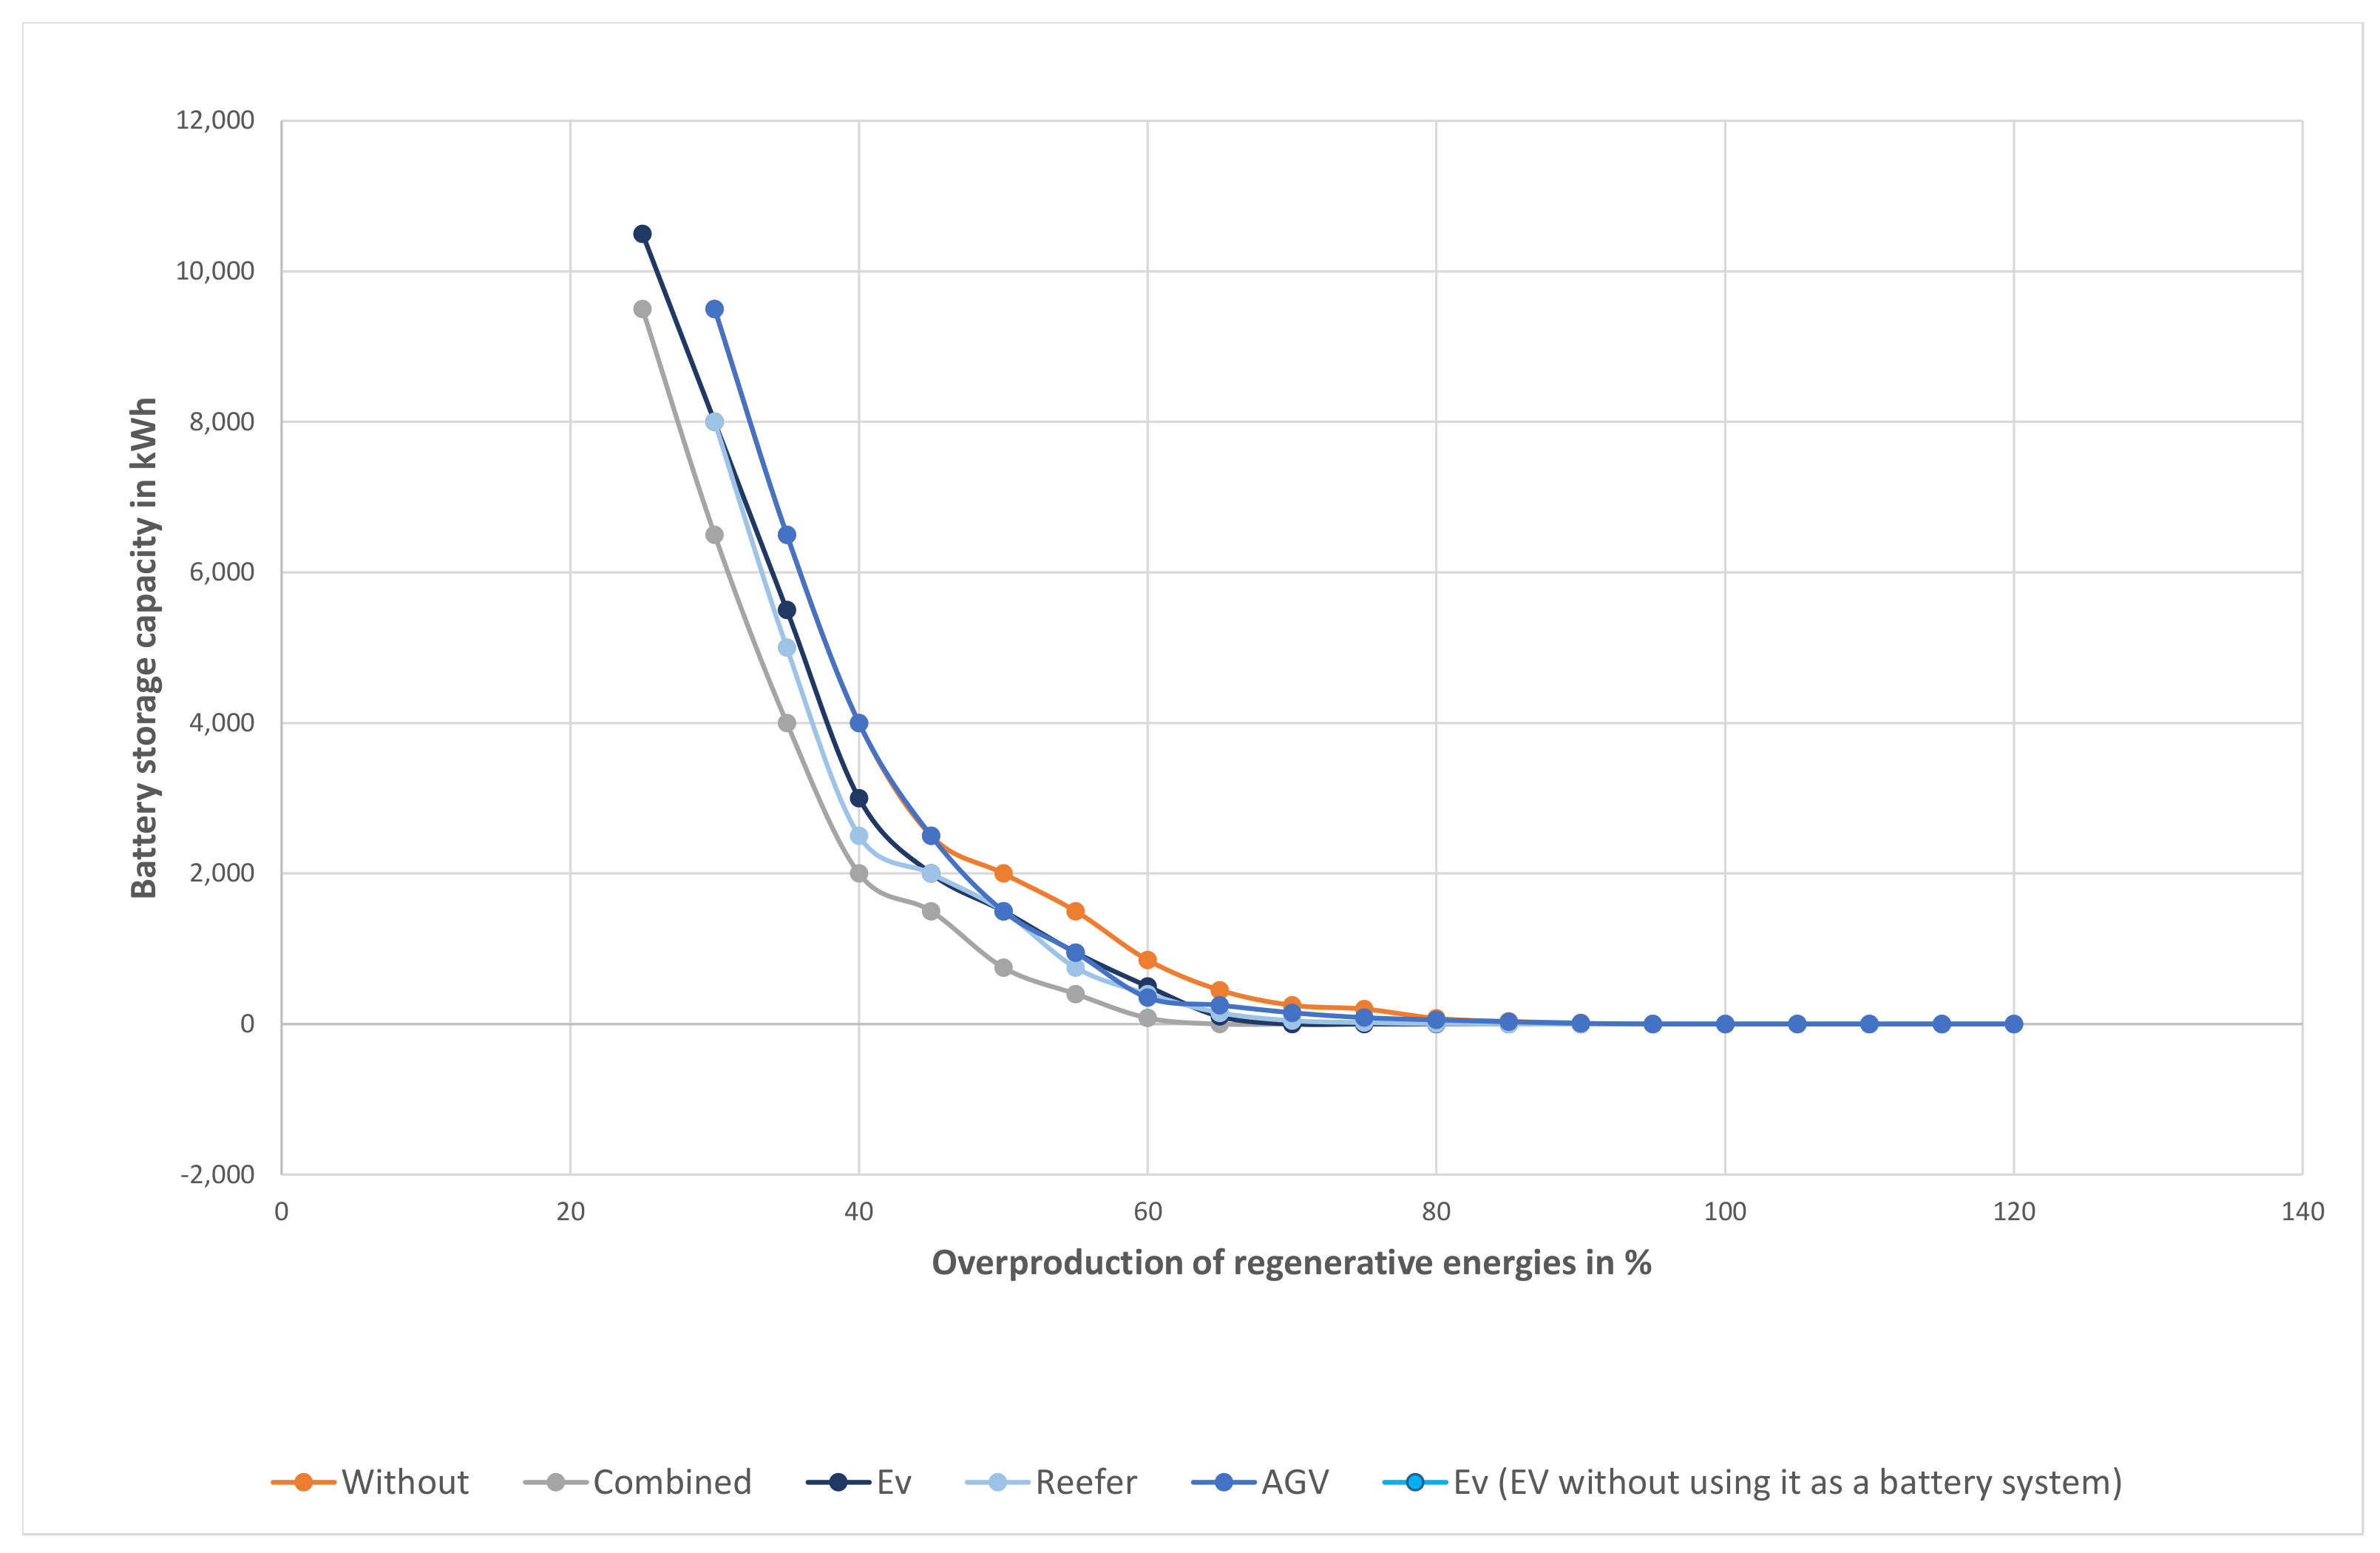
5.2.5. Combined Effects

Figure 7 shows all the results, including the result of the combined algorithms. The order of the algorithms for the combined algorithm is (1) dishwasher and washing machines, (2) EVs as virtual buffers, (3) AGV as virtual buffer, (4) reefer, (5) hydro pump station, (6) battery system, (7) EVs as a battery system, (8) AGV as a battery system. Hereby, the order of the systems used for additional battery capacity does not influence the results.
As seen in Figure 7, combining all the virtual buffer and battery systems already existing at the HafenCity has a beneficial effect on the relation between the overproduction of renewable energies and battery capacity. Mathematically, it is possible to reduce the overproduction of energy down to 25% additional energy supply. However, the battery system needs to have a capacity of 9.5 GWh. On the other end, the system can be used with 65% energy overproduction without needing additional battery capacity. At 60% overproduction, the system only needs an 80 MWh battery capacity. Besides one point where the reefer and the combined curve are the same, the combined curve always has better results. However, as seen, for example, at 40% overproduction, the combination of the virtual buffer and storage solutions is not as good as a function generated by combining the results after the simulation.

5.2.6. Cost Analysis

For further analysis, a cost function is implemented to calculate the spot with the lowest building costs. Hereby, the different lifetimes of the technology are not taken into account because only three months are analyzed. As mentioned in Section 4.1.1, the battery system costs $300 per kWh. On the other hand, large wind turbines cost around $850 per kW to build [75]. Therefore, building the system without using any buffers would cost $62.3 million. However, with only 30% overproduction and thus, 9500 MWh battery capacity, it would cost over $2.9 billion.
Table 3 and Table 4 show the results of the cost analysis with the different levels of overproduction and battery capacity. The costs of the cheapest combinations are highlighted in the tables. It can be seen that even though the difference between EVs and reefers is not significant, the difference between their minimum costs is large. With $45 million as minimal costs, the EVs reduce the cost by $16.4 million. The reefers, on the other hand, only reduce the costs by $8.65 million. This is caused by the high prices per kWh battery capacity and the large battery capacity needed. Thus, from a cost perspective, it is more important to reduce the battery capacity than the overproduction of renewable energies. Even though the reefers are more efficient than the EVs at, for example, 60% overproduction, the battery capacity needed at this point is too high to affect the minimum building costs. This can also be seen at the others’ minimum. Here, all the minimum costs are at under 10 MWh battery capacity. The same applies to the minimum costs of the combined results. Combining all the virtual buffers and battery systems can reduce the costs by 31.6% or $19.7 million to only $42.66 million. Interesting is that no additional battery capacity is needed. It is more cost-efficient solely to use the overproduction of renewable energies, the virtual buffers, and the existing battery systems rather than building new ones.

6. Main Findings

Combining several technologies to build a smart grid and thus improve energy consumption is essential when using renewable energies as the only energy source and if the overproduction of energy needs to be reduced. This section evaluates the results of the simulations for a better understanding. The reefer and the EVs, for example, both have excellent results for themselves. Even if their result after the combination in the algorithm is not as good as if their results were added up after each is simulated separately, it indicates an increase in resilience. When planning the energy demand in a smart grid, factors like personal preferences can change the loading behavior of EVs as virtual buffers or batteries. For example, events like holidays can lead to many people simultaneously charging their vehicles to 100% battery capacity and then unplugging them so they can start driving with their cars to their holiday destinations. In this case, EVs as virtual buffers or batteries would be missing in the system. Reefer or other virtual buffers, on the other hand, can compensate for this absence. In addition, reefers are always plugged in at the port, which must not always be the case with EVs. With the help of contracts between the grid operators and the port, the stabilizing effects of, for example, reefers can be ensured. This layer of security is crucial to preventing blackouts. In addition, connecting the Port of Hamburg with the HafenCity has additional beneficial effects. First, the different virtual buffer and storage systems behave differently. Thus they can intervene at different points in time and thus provide benefit to the smart grid in different ways. In addition, the strong deviations of the HafenCity’s energy demand are dampened by the demand of the Port of Hamburg. Thus, connecting more districts of Hamburg or even other cities in Germany or the European Union can have similar effects.
In the near future (2025), it cannot be ensured that every EV always starts from a charging station and is plugged in immediately after the voyage due to the scarcity of EV loading stations. On the one side, the second EV analysis, without using the EVs’ battery capacities, shows that they also have a significant impact without using their batteries. This is because of the large number of EVs and EV charging ports planned at the HafenCity. Thus connecting more charging stations to a smart grid on the scale of a district in a densely populated city has a significant impact. On the other side, the analysis of the EV as a battery system shows immense potential and thus encourages to rethink about the single-use charging stations, which only charge EVs. Instead, these stations should be considered as docking points on which individuals or car-sharing companies can provide not-used battery storage to balance the smart energy grid. Thus, building more charging stations at homes and especially at workplaces benefits the smart grid and efficiently shapes the energy demand.
When small automated buses get more and more included in the portfolio of the HVV (Hamburger Verkehrsverbund), they can also provide considerable potential for the smart grid. As a combination of the EVs and the AGVs, it is assumed that the small buses have an above-average sized battery storage system. In addition, the HVV can use the information on the usage of the buses to calculate rush hours. In the time between, for example, 9 am to 5 pm working hours or at night, when not all buses are needed, the others can be used as battery systems to overcome the energy demand peaks at the HafenCity. The main advantage is the centralized timetable management. Thus, the grid operators do not need to rely on individuals as with the EVs; instead, they can rely on a storage possibility between the rush hours, provided that these buses have enough capacity when the rush hour starts again.

7. Conclusions

This paper sets out to investigate the effects of a smart energy grid integrated with existing infrastructure as virtual buffers and battery systems on a large-scale framework. This paper specifically focuses on the impact of port infrastructure on smart energy grids. With a complete transition to 100% renewable energy sources, this study establishes a forward-looking framework that ensures resilience in the shift from conventional fossil fuel-dependent energy systems to sustainable and renewable alternatives. The primary research objective was the evaluation of the effectiveness of utilizing virtual buffers to mitigate the challenges posed by fluctuating renewable energy sources.
The results of the simulation model show the potential benefits of a smart grid solution, that includes several different virtual buffers used in one network. The incorporated virtual buffers, even on an individual basis, showed a positive impact on the stability and costs of the smart energy grid. With a peak reduction of 26% of the costs of one technology and a more resilient framework with a 32% decrease in costs with all technologies combined, this paper shows the need for further research in virtual buffers on a large-scale smart energy grid. The findings of this paper further emphasize the significance of private electric vehicles and large industrial units like the container port of Hamburg to enhance the resilience of energy grids.
This paper identifies a research gap and the absence of significant research for utilizing existing infrastructure in a large-scale smart grid to use as virtual buffers, for peak shaving, or demand-shifting. Research that encompasses multiple technologies in one large-scale smart energy grid, including virtual buffers to mitigate the challenges posed by the substantial influence of renewable energy, is notably lacking. To fill this research gap and contribute to the existing literature, this paper presents a new simulation model. This simulation aims to explore how existing infrastructure, used as virtual buffers, can impact large-scale urban smart energy grids. This paper takes a novel approach by focusing on virtual buffers in seaports and effects while being interconnected with urban virtual buffers, revealing synergistic effects and significant potential for energy demand reduction. With the help of this precise real-world simulation of Hamburg’s HafenCity and its seaport, significant data is computed. By evaluating various scenarios involving virtual buffers and energy storage systems, this work provides insights into the cost-efficiency and resilience of several rarely used smart grid technologies. Thus, this paper provides a holistic understanding of how different technologies and solutions interact within the smart grid context, offering valuable insights into their performance and potential. This research resonates with global efforts to transition towards renewable energy sources (see Adebayo et al. [76]) and contributes to the discourse by evaluating the efficacy and implications of smart energy grid technologies.
This paper seeks to contribute to the existing body of knowledge by building a foundation for upcoming research and to stimulate further investigations on virtual buffers to close the existing research gap. Firstly, the interplay between different industry sectors and residential areas in a smart energy grid needs further investigation. Secondly, the challenge of efficiently handling the overproduced regenerative energy requires further research. Hereby, the focus should be on hydrogen and synthetic fuels, which are currently limited due to their enormous energy consumption during production. A somewhat different approach for future work could be the linkage of theoretical work on supply/demand graphs (see, e.g., Jovanovic et al. [77]) with our research, possibly including time-dependent considerations and buffer capacities.

Author Contributions

Conceptualization, P.B. and L.H.; Methodology, P.B.; Validation, S.V., L.H. and X.S.; Formal analysis, P.B.; Investigation, P.B.; Data curation, P.B.; Writing—original draft, P.B.; Writing—review & editing, P.B.; Visualization, P.B.; Supervision, S.V. and X.S.; Project administration, X.S. All authors have read and agreed to the published version of the manuscript.

Funding

This research received no external funding.

Data Availability Statement

Not applicable.

Conflicts of Interest

The authors declare no conflict of interest.
Abbreviations  
ACN Research PortalAdaptive Charging Network Research Portal
AGVAutomated guided vehicle
Cstorage capacity
CTAContainer Terminal Altenwerder
D(t)Energy demand in t
EVelectric vehicle
GWhGiga Watt hours
HHLAHamburger Hafen und Logistik AG
HVVHamburger Verkehrsbund
kw(h)Kilo Watt (hours)
MW(h)Mega Watt (hours)
OEDIOpen Energy Data Initiative
Coefficient of determination
RERegenerative energy
reeferReefer container
RESRegenerative energy source
S(t)Energy supply in t
ttime (period)
V2GVehicle to Grid

References

  1. Bundesministerium für Umwelt, Naturschutz und Nukleare Sicherheit. Klima—und Energiepolitik der Europäischen Union. 2021. Available online: https://www.bmu.de/themen/klima-energie/klimaschutz/eu-klimapolitik/ (accessed on 3 May 2021).
  2. Die Bundesregierung. Klimaschutzgesetz 2021—Generationenvertrag für das Klima. Available online: https://www.bundesregierung.de/breg-de/themen/klimaschutz/klimaschutzgesetz-2021-1913672 (accessed on 10 February 2021).
  3. Melhem, F.Y.; Moubayed, N.; Grunder, O. Residential energy management in smart grid considering renewable energy sources and vehicle-to-grid integration. Electr. Power Energy Conf. 2016, 1–6. [Google Scholar] [CrossRef]
  4. Shi, X.; Sun, W.; Voß, S.; Jin, J. Smart City: A Perspective of Emergency and Resilience at a Community Level in Shanghai. In ICCL 2020: Computational Logistics; Springer: Cham, Switzerland, 2020; Volume 12433, pp. 522–536. [Google Scholar] [CrossRef]
  5. Bundesregierung Deutschland. Ausstieg aus der Kernkraft. Available online: https://www.bundesregierung.de/breg-de/themen/energiewende/energie-erzeugen/ausstieg-aus-der-kernkraft-394280 (accessed on 15 May 2021).
  6. Bundesministerium für Umwelt, N.u.n.S. Fragen und Antworten zum Kohleausstieg in Deutschland. 2020. Available online: https://www.bmu.de/themen/klima-energie/klimaschutz/nationale-klimapolitik/fragen-und-antworten-zum-kohleausstieg-in-deutschland/ (accessed on 15 May 2021).
  7. Lamp, S.; Samano, M. Large-scale battery storage, short-term market outcomes, and arbitrage. Energy Econ. 2022, 107, 105786. [Google Scholar] [CrossRef]
  8. Vattenfall. Pumpspeicherkraftwerk Geesthacht Infotafel. Available online: https://de.wikipedia.org/wiki/Pumpspeicherkraftwerk_Geesthacht#/media/Datei:Pumpspeicherwerk_Geesthacht_Schautafel.jpg (accessed on 10 September 2023).
  9. Liu, J.; Zhang, W.; Zhou, R.; Zhong, J. Impacts of distributed renewable energy generations on smart grid operation and dispatch. IEEE Power Energy Soc. General Meet. 2012, 1–5. [Google Scholar] [CrossRef]
  10. Lund, P.; Mikkola, J.; Ypyä, J. Smart energy system design for large clean power schemes in urban areas. J. Clean. Prod. 2015, 103, 437–445. [Google Scholar] [CrossRef]
  11. Shen, J.; Jiang, C.; Li, B. Controllable Load Management Approaches in Smart Grids. Energies 2015, 8, 11187–11202. [Google Scholar] [CrossRef]
  12. Van Leeuwen, R.P.; de Wit, J.; Smit, G.J.M.; Smit, G.J.M. Review of urban energy transition in the Netherlands and the role of smart energy management. Energy Convers. Manag. 2017, 150, 941–948. [Google Scholar] [CrossRef]
  13. Yesilbudak, M.; Colak, A. Integration Challenges and Solutions for Renewable Energy Sources, Electric Vehicles and Demand-Side Initiatives in Smart Grids. IEEE Int. Conf. Renew. Energy Res. Appl. 2018, 7, 1407–1412. [Google Scholar] [CrossRef]
  14. Osorio, G.J.; Shafie-khah, M.; Lotfi, M.; Ferreira-Silva, B.J.M.; Catalao, J.P.S. Demand-Side Management of Smart Distribution Grids Incorporating Renewable Energy Sources. Energies 2019, 12, 143. [Google Scholar] [CrossRef]
  15. Cui, S.; Wang, Y.W.; Xiao, J.W. Peer-to-Peer Energy Sharing Among Smart Energy Buildings by Distributed Transaction. IEEE Trans. Smart Grid 2019, 10, 6491–6501. [Google Scholar] [CrossRef]
  16. O’Dwyer, E.; Pan, I.; Acha, S.; Shah, N. Smart energy systems for sustainable smart cities: Current developments, trends and future directions. App. Energy 2019, 237, 581–597. [Google Scholar] [CrossRef]
  17. Xu, Z.; Gao, Y.; Hussain, M.; Hussain, M.; Cheng, P. Demand Side Management for Smart Grid Based on Smart Home Appliances with Renewable Energy Sources and an Energy Storage System. Math. Probl. Eng. 2020, 2020. [Google Scholar] [CrossRef]
  18. De São José, D.; Faria, P.; Vale, Z. Smart energy community: A systematic review with metanalysis. Energy Strategy Rev. 2021, 100678. [Google Scholar] [CrossRef]
  19. Siemon, L.; Blume, C.; Mennenga, M.; Herrmann, C. Multi-scale Simulation for Energy Flexible Factories and Factory Networks: A System of Systems Perspective. Procedia CIRP. 2022, 105, 404–409. [Google Scholar] [CrossRef]
  20. Dehaghani, E.S.; Cipcigan, L.; Williamson, S.S. The Role of Electric Vehicles in Smart Grids. Lect. Notes Electr. Eng. 2022, 826, 123–151. [Google Scholar] [CrossRef]
  21. Bashiri khouzestani, L.; Sheikh-el-eslami, M.; Hosein Salemi, A.; Gerami moghadam, I. Virtual Smart Energy Hub: A Powerful Tool for Integrated Multi Energy Systems Operation. Soc. Sci. Res. Netw. 2022. [CrossRef]
  22. Stromnetz Hamburg. Energieportal Hamburg). 2020/2021. Available online: https://www.energieportal-hamburg.de/ (accessed on 18 May 2021).
  23. Statista. Einwohnerzahl der Bezirke in Hamburg im Jahr 2019). Available online: https://de.statista.com/statistik/daten/studie/1081561/umfrage/einwohnerzahl-in-hamburg-nach-bezirken/#professional (accessed on 18 May 2021).
  24. Copenhagen Cleantech Cluster. Denmark: A European smart grid hub: Asset mapping of smart grid competencies in Denmark. Available online: https://cdn.copcap.com/hubfs/Downloads/Dokumenter/Denmark_A_European_Smart_Grid_Hub_2011.pdf (accessed on 10 September 2023).
  25. ENTSO-E - Transparency Platform. Actual Generation per Production Type (Data of Germany, 2019-05.05.2021). Available online: https://transparency.entsoe.eu/dashboard/show (accessed on 17 May 2023).
  26. Melhem, F.Y.; Optimization Methods and Energy Management in “Smart Grids”. Electric Power. 2018, pp. 108–131. Available online: https://tel.archives-ouvertes.fr/tel-01876732/document (accessed on 10 September 2023).
  27. Shahan, Z. Tesla Megapack, Powerpack, & Powerwall Battery Storage Prices Per KWh — Exclusive. Available online: https://cleantechnica.com/2020/10/05/tesla-megapack-powerpack-powerwall-battery-storage-prices/ (accessed on 10 September 2023).
  28. Chandio, Y.; Mishra, A.; Seetharam, A. GridPeaks: Employing Distributed Energy Storage for Grid Peak Reduction. In Proceedings of the 2019 Tenth International Green and Sustainable Computing Conference (IGSC), Alexandria, VA, USA, 21–24 October 2019. [Google Scholar] [CrossRef]
  29. Feeley, C.; Bryans, A.G.; Nyamdash, B.; Denny, E.; O’Malley, M. The viability of balancing wind generation with storage. In Proceedings of the Power and Energy Society General Meeting - Conversion and Delivery of Electrical Energy in the 21st Century, Pittsburgh, PA, USA, 20–24 July 2008. [Google Scholar] [CrossRef]
  30. HafenCity Hamburg GmbH. HafenCity Smart Mobility Digital: Innovationsprojekt Carsharing und Elektromobilität für die Quartiere Baakenhafen und Elbbrücken, 2020. Available online: https://www.hafencity.com/_Resources/Persistent/8/f/2/7/8f277983d03f258c0e6e9729d27fc58d79c5faf7/200714%20HC%20Smart%20Mobility%20Digital.pdf (accessed on 9 October 2023).
  31. WEMAG AG. Stromverbrauch im 1, 2, 3 und 4 Personen Haushalt. 2020. Available online: https://www.wemag.com/energiesparberatung/stromverbrauch-single-2-3-4-personen-haushalt (accessed on 9 October 2023).
  32. CHECK24. Stromverbrauch: Durchschnittsverbrauch Strom. 2019. Available online: https://www.check24.de/strom/stromverbrauch/ (accessed on 8 October 2023).
  33. Wagener, L.; Weißbach, A. Stromverbrauch im Haushalt. Available online: https://www.co2online.de/energie-sparen/strom-sparen/strom-sparen-stromspartipps/stromverbrauch-im-haushalt/ (accessed on 9 October 2023).
  34. Minde, A. Household data. Available online: https://data.open-power-system-data.org/household_data/ (accessed on 9 October 2023).
  35. HafenCity Hamburg GmbH. Gebäude in der HafenCity. 2019. Available online: https://www.hafencity.com/_Resources/Persistent/e/1/a/b/e1abbff118d63750cfe3e9fe5122a2756b579bb3/190912%20HC%20Bauherrenbooklet_FREI.pdf (accessed on 23 August 2021).
  36. Wilson, E. Commercial and Residential Hourly Load Profiles for all TMY3 Locations in the United States. 2014. Available online: https://data.openei.org/submissions/153 (accessed on 9 October 2023).
  37. Nolzen, H. Handbuch des Geographieunterrichts. Bd. 12/2, Geozonen; Aulis Verlag in Friedrich Verlag GmbH: Hannover, Germany, 1996; ISBN 978-3-7614-1619-8. [Google Scholar]
  38. Fuchs, Bergmüller. Die Klimazonen der Erde. Available online: https://www.arcgis.com/apps/MapJournal/index.html?appid=e6dd27d56ba5478da908fa86feed2ab6 (accessed on 23 August 2023).
  39. Association for Computing Machinery. e-Energy ’19: Proceedings of the Tenth ACM International Conference on Future Energy Systems. 2019. Available online: https://dl.acm.org/doi/proceedings/10.1145/3307772 (accessed on 10 September 2023).
  40. Electric Vehicle Database. Useable Battery Capacity of Full Electric Vehicles. Available online: https://ev-database.org/cheatsheet/useable-battery-capacity-electric-car (accessed on 10 September 2023).
  41. Jahic, A.; Eskander, M.; Schulz, D. Charging Schedule for Load Peak Minimization on Large-Scale Electric Bus Depots. Appl. Sci. 2019, 9, 1748. [Google Scholar] [CrossRef]
  42. Dreier, D.; Rudin, B.; Howells, M. Comparison of management strategies for the charging schedule and all-electric operation of a plug-in hybrid-electric bi-articulated bus fleet. Public Transp. 2020, 12, 363–404. [Google Scholar] [CrossRef]
  43. Materne, P.; Hartwig, C.; Peters, U. HEAT as an example for efficient environmental perception for autonomous shuttle systems. In Automatisiertes Fahren 2021: Vom Assistierten Zum Autonomen Fahren 7; Springer Fachmedien Wiesbaden: Wiesbaden, Germany, 2021; pp. 1–16. [Google Scholar]
  44. hamburg.de. U4 – Elbbrücken Hamburgs neueste U-Bahn-Linie. Available online: https://www.hamburg.de/u4-hamburg/ (accessed on 30 August 2021).
  45. GoogleMaps. Hamburger Hochbahn—Plan der Linie U4. Available online: https://www.google.de/maps/@53.5405089,10.0067025,14.79z (accessed on 10 September 2021).
  46. HVV. Abfahrten. Available online: https://www.hvv.de/de/fahrplaene/abfahrten (accessed on 31 August 2021).
  47. Pineda-Jaramillo, J.D.; Salvador-Zuriaga, P.; Insa-Franco, R. Comparing energy consumption for rail transit routes through Symmetric Vertical Sinusoid Alignments (SVSA), and applying artificial neural networks. A case study of Metro Valencia (Spain). DYNA 2017, 84, 17–23. [Google Scholar] [CrossRef]
  48. Casals, M.; Gangolells, M.; Forcada, N.; Macarulla, M.; Giretti, A. A breakdown of energy consumption in an underground station. Energy Build. 2014, 78, 89–97. [Google Scholar] [CrossRef]
  49. gmp International GmbH. S- und U-Bahnstation Elbbrücken. 2019. Available online: https://www.gmp.de/de/projekte/3233/s-und-u-bahnstation-elbbrucken (accessed on 10 September 2021).
  50. Waterkant Touren. Eine Höhle der Moderne. Available online: https://www.waterkant-touren.com/eine-hoehle-der-moderne-u-bahn-hafencityuniversitaet/ (accessed on 10 September 2021).
  51. Cruise Gate Hamburg. Cruise Center HafenCity. Available online: https://www.cruisegate-hamburg.de/terminals/cruise-center-hafencity/ (accessed on 10 September 2021).
  52. Cruise Gate Hamburg. Terminals. Available online: https://www.cruisegate-hamburg.de/terminals/ (accessed on 10 September 2021).
  53. WorldWideWave. Landstrom in Hamburg Pflicht. Available online: https://worldwidewave.de/landstrom-wird-in-hamburg-pflicht (accessed on 10 September 2021).
  54. Josten, I. Anläufe—2019. Available online: https://www.schiffe-in-hamburg.de/de/_calls_2019.htm (accessed on 4 September 2021).
  55. Niss, M.K. GP-CMP-Shoreside-Report. 2015. Available online: https://www.danskehavne.dk/wp-content/uploads/2015/12/GP-CMP-Shoreside-Report.pdf (accessed on 10 September 2021).
  56. Hamburger Hafen und Logistik Aktiengesellschaft. HHLA Sustainability Report. 2019. Available online: https://hhla.de/fileadmin/download/nachhaltigkeit/HHLA_AR19_Sustainability-report.pdf (accessed on 10 September 2021).
  57. Guo, H.; Tao, L.; Moser, J.; Mueller, H. Smart Grids für zukünftige Häfen – Herausforderungen und Potenziale; VDE Verl. 2014. Available online: https://www.vde-verlag.de/proceedings-de/453641040.html (accessed on 10 September 2021).
  58. Yu, J.; Voß, S.; Song, X. Multi-objective optimization of daily use of shore side electricity integrated with quayside operation. J. Clean. Prod. 2022, 351, 131406. [Google Scholar] [CrossRef]
  59. Dutch daily news. Rotterdam is cool. Available online: https://www.dutchdailynews.com/rotterdam-is-cool/?__cf_chl_managed_tk__=pmd_otjBxxB.1NYZOrjXvToqL36l_0XPkec2lBpv9lZ58kc-1631786464-0-gqNtZGzNArujcnBszRLl (accessed on 16 September 2021).
  60. Verbeeck, J.; Kuijper, F. Application of Smart Energy Networks—Part I: Summary results of the individual company demand response audits in the Port of Antwerp. Available online: http://archive.northsearegion.eu/files/repository/20130409120201_WP3.5ApplicationofSmartEnergyNetworks-partI-Final-1.pdf (accessed on 6 September 2021).
  61. Hamburger Hafen und Logistik Aktiengesellschaft. Report Schiffsabfertigung: Segelliste. Available online: https://coast.hhla.de/report?id=Standard-Report-Segelliste (accessed on 7 September 2021).
  62. Hamburg Port Authority. Besserer Luft Landstrom im Hamburger Hafen. Available online: https://www.hamburg-port-authority.de/en/hpa-360/smartport/landstrom (accessed on 10 September 2023).
  63. Yu, J.; Cammin, P.; Voß, S. Allocation of Shore Side Electricity: The Case of the Port of Hamburg. In Lecture Notes in Computer Science; Springer: Cham, Switzerland, 2023. [Google Scholar] [CrossRef]
  64. Sáenz, J.G. Energy analysis and costs estimation of an On-shore Power Supply system in the Port of Gävle. Available online: https://www.diva-portal.org/smash/get/diva2:1333376/FULLTEXT01.pdf (accessed on 10 September 2023).
  65. Hamburger Hafen und Logistik Aktiengesellschaft. Weitere Stromtankstellen und Batterie-AGV am CTA. Available online: https://hhla.de/medien/pressemitteilungen/detailansicht/weitere-stromtankstellen-und-batterie-agv-am-cta (accessed on 10 September 2023).
  66. Husmann, O.; LI-ION powered AGV with automated quick charger. Konecranes, Tulsa, OK, USA. Personal Communication, 2021.
  67. Grundmeier, N. Simulationsbasierte Energiebedarfsprognose in Seehafen Containerterminals. 2016. Available online: https://uol.de/f/2/dept/informatik/grusim16.pdf (accessed on 10 September 2023).
  68. Hamburger Hafen und Logistik Aktiengesellschaft. HHLA leistet spürbaren Beitrag zur Energiewende. 2019. Available online: https://hhla.de/medien/pressemitteilungen/detailansicht/hhla-leistet-spuerbaren-beitrag-zur-energiewende (accessed on 10 September 2023).
  69. Louppova, J. HHLA to Use Green Energy for its AGVs. 2018. Available online: https://port.today/hhla-use-green-energy-agv/ (accessed on 10 September 2023).
  70. Ling, Q.; Hsu, W.J. Scheduling and Routing Algorithms for AGVs: A Survey. 1999. Available online: https://www.researchgate.net/publication/228891789_Scheduling_and_Routing_Algorithms_for_AGVs_a_Survey (accessed on 10 September 2023).
  71. Singh, N.; Dang, Q.V.; Akcay, A.; Adan, I.; Martagan, T. A matheuristic for AGV scheduling with battery constraints. Eur. J. Oper. Res. 2021, 298, 855–873. [Google Scholar] [CrossRef]
  72. Rüdenauer, I.; Eberle, U.; Grießhammer, R. Ökobilanz und Lebenszykluskostenrechnung Wäschewaschen; Technical report. 2006. Available online: https://www.oeko.de//oekodoc/289/2006-008-de.pdf (accessed on 10 September 2023).
  73. Stromauskunft. Stromverbrauch von Geschirrspülern. Available online: https://www.stromauskunft.de/stromverbrauch/stromverbrauch-von-geschirrspuelern/ (accessed on 17 August 2023).
  74. Kannengießer, C. Der Stromverbrauch einer Spülmaschine. 2020. Available online: https://www.net4energy.com/de-de/smart-living/stromverbrauch-spuelmaschine (accessed on 17 August 2021).
  75. Erneuerbare-Energien Verbraucherportal. Kosten von Windanlagen. Available online: http://www.solar-und-windenergie.de/windenergie/kosten-und-bau-windkraftanlagen.html (accessed on 10 September 2023).
  76. Adebayo, T.S.; Awosusi, A.A.; Oladipupo, S.D.; Agyekum, E.B.; Jayakumar, A.; Kumar, N.M. Dominance of Fossil Fuels in Japan’s National Energy Mix and Implications for Environmental Sustainability. Int. J. Environ. Res. Public Health 2021, 18, 7347. [Google Scholar] [CrossRef] [PubMed]
  77. Jovanovic, R.; Bousselham, A.; Voß, S. Partitioning of supply/demand graphs with capacity limitations: An ant colony approach. J. Comb. Optim. 2018, 35, 224–249. [Google Scholar] [CrossRef]
Figure 1. Regenerative energy supply and Hamburg’s energy demand (10-day periods starting January 2020) [22,25].
Sustainability 15 15834 g001
Figure 2. Deviation of the difference of demand and supply in the simulation. The second axis shows the hydro pump station and a battery system’s capacity in percent.
Sustainability 15 15834 g002
Figure 3. The energy demand of the HafenCity and the Port of Hamburg and the renewable energy supply.
Sustainability 15 15834 g003
Figure 4. Impact of electric vehicles on overproduction and battery capacity.
Sustainability 15 15834 g004
Figure 5. Impact of reefers on overproduction and battery capacity.
Sustainability 15 15834 g005
Figure 6. Impact of AGVs on overproduction and battery capacity.
Sustainability 15 15834 g006
Figure 7. Illustrating the correlation between overproduction and battery storage strategies to establish a blackout-resilient power grid. Portraying the relative ratios for each employed technology.
Sustainability 15 15834 g007
Table 1. Literate review for effects of technology in large-scale smart energy grids.
TitleAuthorsYearSummary
Impacts of distributed
renewable energy
generations on smart
grid operation and dispatch [9]
Jianing Liu,
Weiqi Zhang,
Rui Zhou,
Jin Zhong
2012The paper analyses the influence of distributed generations on power system dispatch,
focusing on Guangdong’s power grid in China. Controllable distributed generations
minimally affect dispatch, but high-penetration uncontrollable renewable energy
generations can reshape modes and load forecasts. Frequency regulation and
quick-response energy storage like pump storage are essential when extensively
using distributed renewable energy.
Smart energy system design
for large clean power schemes
in urban areas [10]
Peter D. Lund,
Jani Mikkola,
Jenni Ypyä
2014This paper explores urban renewable electricity integration in Delhi, Shanghai,
and Helsinki. Findings suggest up to 20% yearly regenerative energy share without
major adjustments, while advanced strategies like short-term storage could raise
RE to 50–70% in Shanghai, 40–60% in Delhi, and 25–35% in Helsinki. As a second
strategy, thermal conversion in Helsinki was proposed and could achieve 64%
wind power use and 30% heat demand coverage.
Controllable load
management approaches
in smart grids [11]
Jingshuang Shen,
Chuanwen Jiang,
Bosong Li
2015In this paper, several controllable load approaches and management strategies are reviewed
in regard to renewable energy sources. It highlights the flexibility of broad controllable
load management in smart grids.
Residential energy
management in smart
grid considering
renewable energy
sources and
vehicle-to-grid integration [3]
Fady Y. Melhem,
Nazih Moubayed,
Olivier Grunder
2016The paper proposes integrating renewable energy and electric vehicles into a smart grid.
By using mixed integer linear programming, they show the benefits and importance of
integrating EVs into a smart energy grid.
Review of urban energy
transition in the Netherlands
and the role of smart energy
management [12]
Richard P. van Leeuwen,
Jan B. de Wit,
Gerald J.M. Smit
2017This paper examines the Netherlands’ energy system. Highlighting the shift to renewable
integration, it explores policies and complex energy balance. It shows the role of
decreasing renewable costs, balanced policies, and growing sustainable investments
in future smart energy grids.
Integration challenges
and solutions for renewable
energy sources,
electric vehicles
and demand-side
initiatives in smart grids [13]
Mehmet Yesilbudak,
Ayse Colak
2018This literature review offers a compact overview of smart grids, their challenges,
and solutions while integrating renewable energy sources, electric vehicles,
and demand-side initiatives. The study identifies key research areas for further research,
including energy distribution, stability analysis, battery tech, and demand response
enhancements for effective integration in modern smart grids.
Demand-side management
of smart distribution grids
incorporating renewable
energy sources [14]
Gerardo J. Osório,
Miadreza Shafie-khah,
Mohamed Lotfi,
Bernardo J. M.
Ferreira-Silva,
João P. S. Catalão
2019The paper introduces a two-stage stochastic model integrating renewable energy sources
and demand-side management in distribution grids while reviewing several demand
response aggregation strategies with the aim to minimize operating costs. This resulted in
reduced peak demand and improved system reliability and efficiency. Therefore, load
curtailment contracts and improved load shaping with load shaping contracts were used.
Peer-to-peer energy
sharing among smart
energy buildings by
distributed transaction [15]
Shichang Cui,
Yan-Wu Wang,
Jiang-Wen Xiao
2019This paper presents a distributed energy-sharing strategy for a smart energy-building
cluster with renewable energies. It minimizes social energy costs through a two-stage
strategy including minimizing the total social costs and a clearing game. An optimization
model gets introduced to handle real-time uncertainties. The simulations result in more
energy-efficient building clusters fostering sustainability.
Smart energy systems for
sustainable smart cities:
current developments,
trends and future directions [16]
Edward O’Dwyer,
Indranil Pan,
Salvador Acha,
Nilay Shah
2019This paper surveys smart energy systems for Smart Cities. It highlights the role of
computational intelligence in managing diverse energy technologies. It shows the
challenges of a real-time framework and emphasizes the use of machine
learning algorithms and computational intelligence.
Demand side management
for smart grid based on
smart home appliances
with renewable energy
sources and an
energy storage system [17]
Zhihong Xu,
Yan Gao,
Muhammad Hussain,
Panhong Cheng
2020The paper addresses energy shortage and pollution issues, in traditional grids by
proposing a demand-side management model for optimizing household appliance usage
in smart grids. It proposes a demand-side model optimizing appliance schedules while
considering renewable energy sources and energy storage systems to improve the total
energy consumption.
Smart energy community:
A systematic review with
metanalysis [18]
Débora de São José,
Pedro Faria,
Zita Vale
2021This literature review analyzes different energy community concepts. Therefore,
synergistic enhancements in multi-purpose energy communities and energy islands for
adaptable solutions are proposed. Benefits include CO 2 reduction, efficiency gain, and
higher self-sufficiency.
Multi-scale simulation for
energy flexible factories
and factory networks: A
system of systems
perspective [19]
Lukas Siemona,
Christine Blume,
Mark Mennenga,
Christoph Herrmann
2022This paper evaluates collaborative factory networks as systems of systems, by using a
multi-scale simulation approach. It reveals a positive emergent behavior that benefits
participating factories monetary and environmentally through on-site RE.
The role of electric
vehicles in smart grids [20]
Ebrahim Saeidi
Dehaghani,
Liana Cipcigan,
Sheldon S. Williamson
2022The paper examines EVs’ potential for emissions reduction and efficiency gains.
It discusses smart charging, V2G technology, and the need to address energy conversion
inefficiencies for practical implementation. A virtual power plant is proposed for
efficient EV charging, focusing on the shifting of the energy demand times of EVs.
Virtual smart energy hub:
A powerful tool for
integrated multi energy
systems operation [21]
Leyla Bashiri
Khouzestania,
Mohammad Kazem
Sheikh-El-Eslami,
Amir Hosein Salemia
Iman Gerami
Moghaddam
2022The paper presents a virtual smart energy hub, which combines smart energy grids,
smart energy hubs, and virtual power plants to optimize profitability in energy markets.
Using a risk-based model and the conditional value-at-risk index, it effectively manages
uncertainties reduces risk costs, and enhances profits for a coalition of smart energy hubs.
Table 2. Distribution of different supply types in Germany. [25].
Production TypeAverage Supply
per 15 min in MW
Standard Deviation
in MW
Standard Deviation
Proportional to the
Average Supply
Biomass46422110.048
Fossil Brown Coal10,70337660.352
Fossil Gas665526240.39
Fossil Hard Coal479534260.71
Fossil Oil441800.18
Geothermal2240.18
Hydro Pump
Storage
112213951.24
Hydro Pump
Storage Consumption
128014621.14
Hydro run-of-river
and poundage
16062590.16
Hydro water reservoir136990.73
Nuclear Power752912110.16
Other3141080.34
Other renewable157490.31
Solar490276181.55
Waste4521580.35
Wind Offshore294319050.65
Wind Onshore11,65090450.78
Table 3. Results of the cost function for the virtual buffers and storage solutions (1/2).
WithoutEVEV Without
Using Batteries
Overpro-
duction
in kW
Overpro-
duction
in %
Battery
capacity
in MWh
Costs
in $
Battery
capacity
in MWh
Costs
in $
Battery
capacity
in MWh
Costs
in $
19,305.0193125--10,5003,166,409,226.4--
23,166.023173095002,869,691,12080002,419,691,12080002,419,691,120
27,027.027033565001,972,972,97355001,672,972,97355001,672,972,973
30,888.030894040001,226,254,8263000926,254,8263000926,254,826
34,749.03475452500779,536,6802000629,536,6802500779,536,680
38,610.03861502000632,818,5331500482,818,5332000632,818,533
42,471.04247551500486,100,386950321,100,3861500486,100,386
46,332.0463360850294,382,239500189,382,239700249,382,239
50,193.0501965450177,664,09310072,664,093300132,664,093
54,054.0540570250120,945,946045,945,945.97568,445,945.9
57,915.0579275200109,227,799049,227,799.24562,727,799.2
61,776.06178807575,009,652.5052,509,652.54064,509,652.5
65,637.06564853566,291,505.8055,791,505.82563,291,505.8
69,498.0695901563,573,359.1059,073,359.1761,173,359.1
73,359.0733695062,355,212.4062,355,212.4062,355,212.4
77,220.07722100065,637,065.6065,637,065.6065,637,065.6
81,081.08108105068,918,918.9068,918,918.9068,918,918.9
84,942.08494110072,200,772.2072,200,772.2072,200,772.2
88,803.0888115075,482,625.5075,482,625.5075,4826,25.5
92,664.09266120078,764,478.8078,764,478.8078,764,478.8
Table 4. Results of the cost function for the virtual buffers and storage solutions (2/2).
ReeferAGVHouseholdCombined
Overpro-
duction in %
Battery
capacity
in MWh
Costs
in $
Battery
capacity
in MWh
Costs
in $
Battery
capacity
in MWh
Costs
in $
Battery
capacity
in MWh
Costs
in $
25.00------9,50002,866,409,266.4
30.0080002,419,691,119.795002,869,691,119.795002,869,691,119.765001,969,691,119.7
35.0050001,522,972,973.065001,972,972,973.065001,972,972,973.040001,222,972,973.0
40.002500776,254,826.240001,226,254,826.340001,226,254,826.32000626,254,826.3
45.002000629,536,679.52500779,536,679.52500779,536,679.51500479,536,679.5
50.001500482,818,532.81500482,818,532.82000632,818,532.8750257,818,532.8
55.00750261,100,386.1950321,100,386.11500486,100,386.1400156,100,386.1
60.00400159,382,239.4350144,382,239.4850294,382,239.48063,382,239.4
65.0015087,664,092.7250117,664,092.7450177,664,092.7042,664,092.7
70.004559,445,946.015090,945,946.0250120,945,946.0045,945,946.0
75.002055,227,799.28574,727,799.2200109,227,799.2049,227,799.2
80.00453,709,652.55569,009,652.57575,009,652.5052,509,652.5
85.00055,791,505.83064,791,505.83566,291,505.8055,791,505.8
90.00059,073,359.19.561,923,359.11563,573,359.1059,073,359.1
95.00062,355,212.4062,355,212.4062,355,212.4062,355,212.4
100.00065,637,065.6065,637,065.6065,637,065.6065,637,065.6
105.00068,918,918.9068,918,918.9068,918,918.9068,918,918.9
110.00072,200,772.2072,200,772.2072,200,772.2072,200,772.2
115.00075,482,625.5075,482,625.5075,482,625.5075,482,625.5
120.00078,764,478.8078,764,478.8078,764,478.8078,764,478.8
Disclaimer/Publisher’s Note: The statements, opinions and data contained in all publications are solely those of the individual author(s) and contributor(s) and not of MDPI and/or the editor(s). MDPI and/or the editor(s) disclaim responsibility for any injury to people or property resulting from any ideas, methods, instructions or products referred to in the content.

