Abstract
In order to accurately judge the tendency of rock burst disaster and effectively guide the prevention and control of rock burst disaster, a rock burst intensity-grade prediction model based on the comprehensive weighting of prediction indicators and Bayesian optimization algorithm–improved-support vector machine (BOA-SVM) is proposed for the first time. According to the main factors affecting the occurrence and intensity of rock burst, the rock stress coefficient (σθ/σc), brittleness coefficient (σc/σt) and elastic energy index (Wet) are selected to construct the rock burst prediction indicator system. On the basis of the research of other scholars, according to the main performance and characteristics of rock burst, rock burst is divided into four intensity levels. The collected and sorted 120 sets of rock burst case data at home and abroad are taken as learning samples, and the T-SNE algorithm is used to perform dimensionality-reduction visualization processing on the sample data, visually display the distribution of samples of different grades, evaluate the representativeness of the sample data and prejudge the feasibility of the machine learning algorithm to distinguish different rock burst intensity levels. The combined improved analytic hierarchy process (IAHP) and Delphi method determine the subjective weight of the indicators; the combined entropy weight method and CRITIC method determine the objective weight of the indicator, and use the harmonic mean criterion of information theory to synthesize the subjective weight and objective weight of the indicator to obtain the comprehensive weight of the indicators. After weighted prediction indicators, a rock burst intensity-grade prediction model is constructed based on the support vector machine, and the hyperparameters of three types of support vector machines are improved by using the Bayesian optimization algorithm. Then, the prediction accuracy of different models is calculated by the random cross-validation method, and the feasibility and effectiveness of the rock burst intensity-grade prediction model is verified. In order to evaluate the generalization and engineering applicability of the proposed model, 20 groups of rock burst case data from the Maluping mine and Daxiangling tunnel are introduced to predict the rock burst intensity grade. The results show that the accuracy of the rock burst intensity-grade prediction model based on comprehensive weighting and BOA-SVM is as high as 93.30%, which is of higher accuracy and better effect than the ordinary model, and can provide warning information with a higher fault tolerance rate, which provides a new way of thinking for rock burst intensity-grade prediction.
1. Introduction
Rock burst is a disaster phenomenon caused by disturbance of surrounding rock, such as rock fragmentation, rock ejection and rock stripping [1]. At present, underground engineering construction projects are developing into the deep, which will inevitably lead to high-risk engineering disaster accidents with strong damage and great influence. Rock burst often occurs in underground engineering construction in mining, civil engineering, water conservancy and other industries. Once it occurs, it will cause damage to construction personnel and equipment [2], and it has a strong restriction ability on the feasibility, safety and economy of construction projects. Accurate prediction of the rock burst intensity level is helpful to prevent and control rock burst disaster and promote the sustainable development of the engineering industry. Therefore, it is of great significance to construct a prediction model of rock burst intensity grade with a good performance.
Many scholars have established a rock burst intensity-grade prediction model based on a weighting method and mathematical evaluation theory, such as: the cloud model [3], fuzzy comprehensive evaluation [4], the catastrophe progression method [5], matter–element extension theory [6], TOPSIS theory [7], etc. For the above theories and methods, the main problems are the weighting of indicator factors and the classification of prediction results. Therefore, there are some obvious defects and deficiencies in using the above methods to solve the problem of rock burst intensity-grade prediction, such as the fact that the subjective weighting method will inevitably interfere with the subjective consciousness of decision makers, and the subjectivity and randomness of artificially determined weights are very strong. In addition, the emphasis and engineering experience of each expert are quite different, resulting in a large difference in the evaluation results of the indicators’ weight, and the credibility will also be reduced. However, the objective weighting method cannot reflect the evaluators’ emphasis on different attribute indicators, and cannot reflect the importance of indicators in the mechanism of rock burst occurrence. Moreover, the objective weighting method has high requirements regarding the quantity and quality of sample data. If the number of sample data is small or the dispersion is large, the weight determined by the objective weighting method will be very different from the actual importance of the indicators, and the reliability will also be reduced.
The machine learning algorithm has outstanding advantages in solving complex nonlinear problems, so it has developed rapidly in recent years, and has been widely used in many fields and achieved good results. It is also suitable for solving the problem of rock burst intensity-grade prediction in the field of underground engineering, for example, the artificial neural network [8], support vector machine [9], extreme learning machine [10], random forest [11], decision tree [12], XGBoost [13], AdaBoost [14], k-nearest neighbors [15], etc. At present, the machine learning algorithm has been widely used in rock burst prediction, but there are some shortcomings, the main problems being the collection of sample data and the setting of model hyperparameters. For example, XGBoost and AdaBoost require a large number of sample data for training, resulting in slow algorithm convergence and long iteration time; it is also very difficult to collect a large number of data samples, and the operability is correspondingly reduced. The setting of hyperparameters in the machine learning algorithm will directly affect the prediction accuracy and overall performance of the algorithm. If the setting of hyperparameters is unreasonable, the machine learning algorithm will not be able to mine the rule of sample data, which will greatly reduce the feasibility and effectiveness of the prediction model.
Some scholars have built a rock burst intensity-grade prediction model based on index weighting and the machine learning algorithm. For example, Zhang Meichang et al. [8] used the PSO algorithm to improve the connection weight of the BP neural network, and then used this model to predict rock burst, which increased the accuracy rate by 15.00%, compared with the standard BP model. Wen Tingxin et al. [10] adopted the HDO algorithm to improve the data set structure, and optimized the weight of the input layer of the extreme learning machine and the threshold value of the hidden layer using the AHDPSO algorithm; they built a rock burst intensity-grade prediction model, and achieved good results. Ullah et al. [13] coupled t-SNE, k-means clustering and XGBoost algorithms to predict rock burst intensity grade, providing a new means of solving the problem of rock burst prediction and playing a certain role in improving the safety of mining and geotechnical engineering. Xie Xuebin et al. [16] applied the CRITIC method to carry out weighted processing of predictive indicator samples, then introduced the XGBoost algorithm to train and learn the samples, and finally established the CRITIC-XGB model for rock burst intensity-grade prediction. Compared with the single XGBoost model, the convergence performance has been significantly improved. Wen Yanxin et al. [17] applied the analytic hierarchy process (AHP) and entropy weight method to carry out combination-weighted processing of indicator samples, and then introduced a mixed particle swarm optimization algorithm to optimize the support vector machine model to predict rock burst samples; they verified the feasibility and applicability of the constructed model combined with the data of other rock burst engineering examples. However, the above prediction models also have some defects, such as the following: the prediction model built by Xie Xuebin et al. [16] only carries out a single weight on the indicator samples, has poor reliability, and does not carry out hyperparameter optimization of the XGBoost algorithm. In addition, although Wen Tingxin et al. [17] carried out the combination weighting process for the indicator samples, the combination weighting method was relatively simple and the fault tolerance rate was low. At the same time, the two scholars selected 50 groups of rock burst samples for training and testing, and the data numbers were too small and the generalization was not high.
In order to solve the above problems, 120 groups of typical engineering rock burst data are selected as prediction samples. Combined with an improved analytic hierarchy process (IAHP) and Delphi method, the subjective weight of the prediction indicators was determined. Combining the entropy weight method and the CRITIC method, the objective weight of the prediction index is determined. By using the harmonic mean criterion of information theory, the subjective weight and objective weight of the prediction indicators are synthesized, and the comprehensive weight of the prediction indicators is obtained. The support vector machine (SVM) algorithm is a classical model often used to solve classification problems. It has the advantages of fast training speed, simple logic, strong generalization performance and small-sample data. At the same time, the Bayesian optimization algorithm can find the optimal hyperparameter combination for the support vector machine model. In view of this, this paper constructs a rock burst intensity-grade prediction model based on the Bayesian optimization algorithm–improved-support vector machine. Then, combined with the method of random cross-validation, the performance of the rock burst intensity-grade prediction model is evaluated. In addition, the T-SNE algorithm is introduced to visualize the sample data in dimensionality reduction to determine whether the sample data have significant clustering phenomenon and representativeness. At the same time, it can prejudge whether the prediction model constructed in this paper can distinguish rock burst samples of different intensity levels. The aim is to improve the accuracy and feasibility of the rock burst intensity-grade prediction model. In this paper, four weighting methods are coupled together, and a new comprehensive weighting method is proposed to preprocess the prediction indicator data. The support vector machine is improved by using the Bayesian optimization algorithm and successfully applied to rock burst intensity-grade prediction, which provides a new way to solve the related rock burst prediction problem.
2. Indicators and Data
2.1. Prediction Indicators
Due to the different consideration of the main influencing factors of rock burst, many scholars choose different rock burst prediction indicators. The author summarizes the prediction index system constructed by some scholars in Table 1.

Table 1.
Summary table of feature indicators for rock burst intensity prediction.
In combination with Table 1 and other scholars’ selection of rock burst prediction evaluation indicators, it can be found that σθ/σc, σc/σt and Wet are the most commonly used characteristic indicators in many scholars’ evaluation systems, and that they can accurately and quantitatively describe rock burst information. After considering the independence, accuracy and universality of the evaluation indicators, this paper selects σθ/σc, σc/σt and Wet to construct the prediction indicator system of rock burst intensity grade [18,20,21,22].
2.2. Classification Standard
In this paper, based on the rock burst criteria proposed by Xu Linsheng [25] and Li Tianbin [26], the rock burst intensity grade is divided into I~IV grades, and the specific determination characteristics are shown in Table 2.
Table 2.
Classification of rock burst intensity.
2.3. Sample Data
2.3.1. Sample Data Selection
The three characteristic indicators selected in this paper are common indexes for evaluating the occurrence and intensity of rock burst, and are easy to obtain in the process of data collection. Therefore, this paper collected the case samples required by the rock burst intensity-grade prediction model from the domestic and foreign literature [23,24,27,28], eliminated repeated samples and singular samples, and obtained 120 sets of rock burst case data after sorting. Some of the data are shown in Table 3.
Table 3.
Part of rock burst sample data.
2.3.2. Sample Data Analysis
The distribution of four rock burst intensity levels in the sample data is shown in Figure 1.
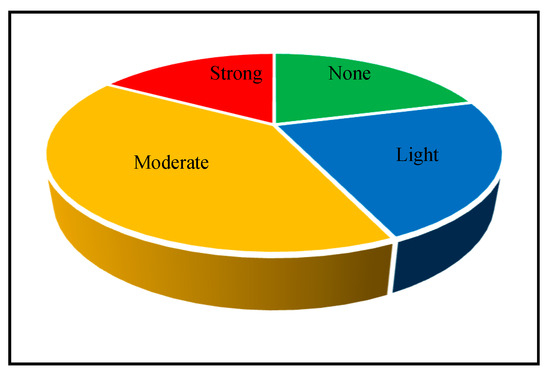
Figure 1.
The sample data distribution.
As can be seen from figure, among the sample instances of rock burst, the proportion of level III rock burst is the largest, accounting for 41%, with a total of 50 groups of medium-rock-burst sample data. The proportion of Ⅳ rock burst is the smallest, at 16%, and there are 20 groups of strong-rock-burst sample data. The sample sizes of level I rock burst and level II rock burst are similar, with 21% and 22%,respectively; there are 25 groups of no-rock-burst sample data, and 27 groups of minor-rock-burst sample data.
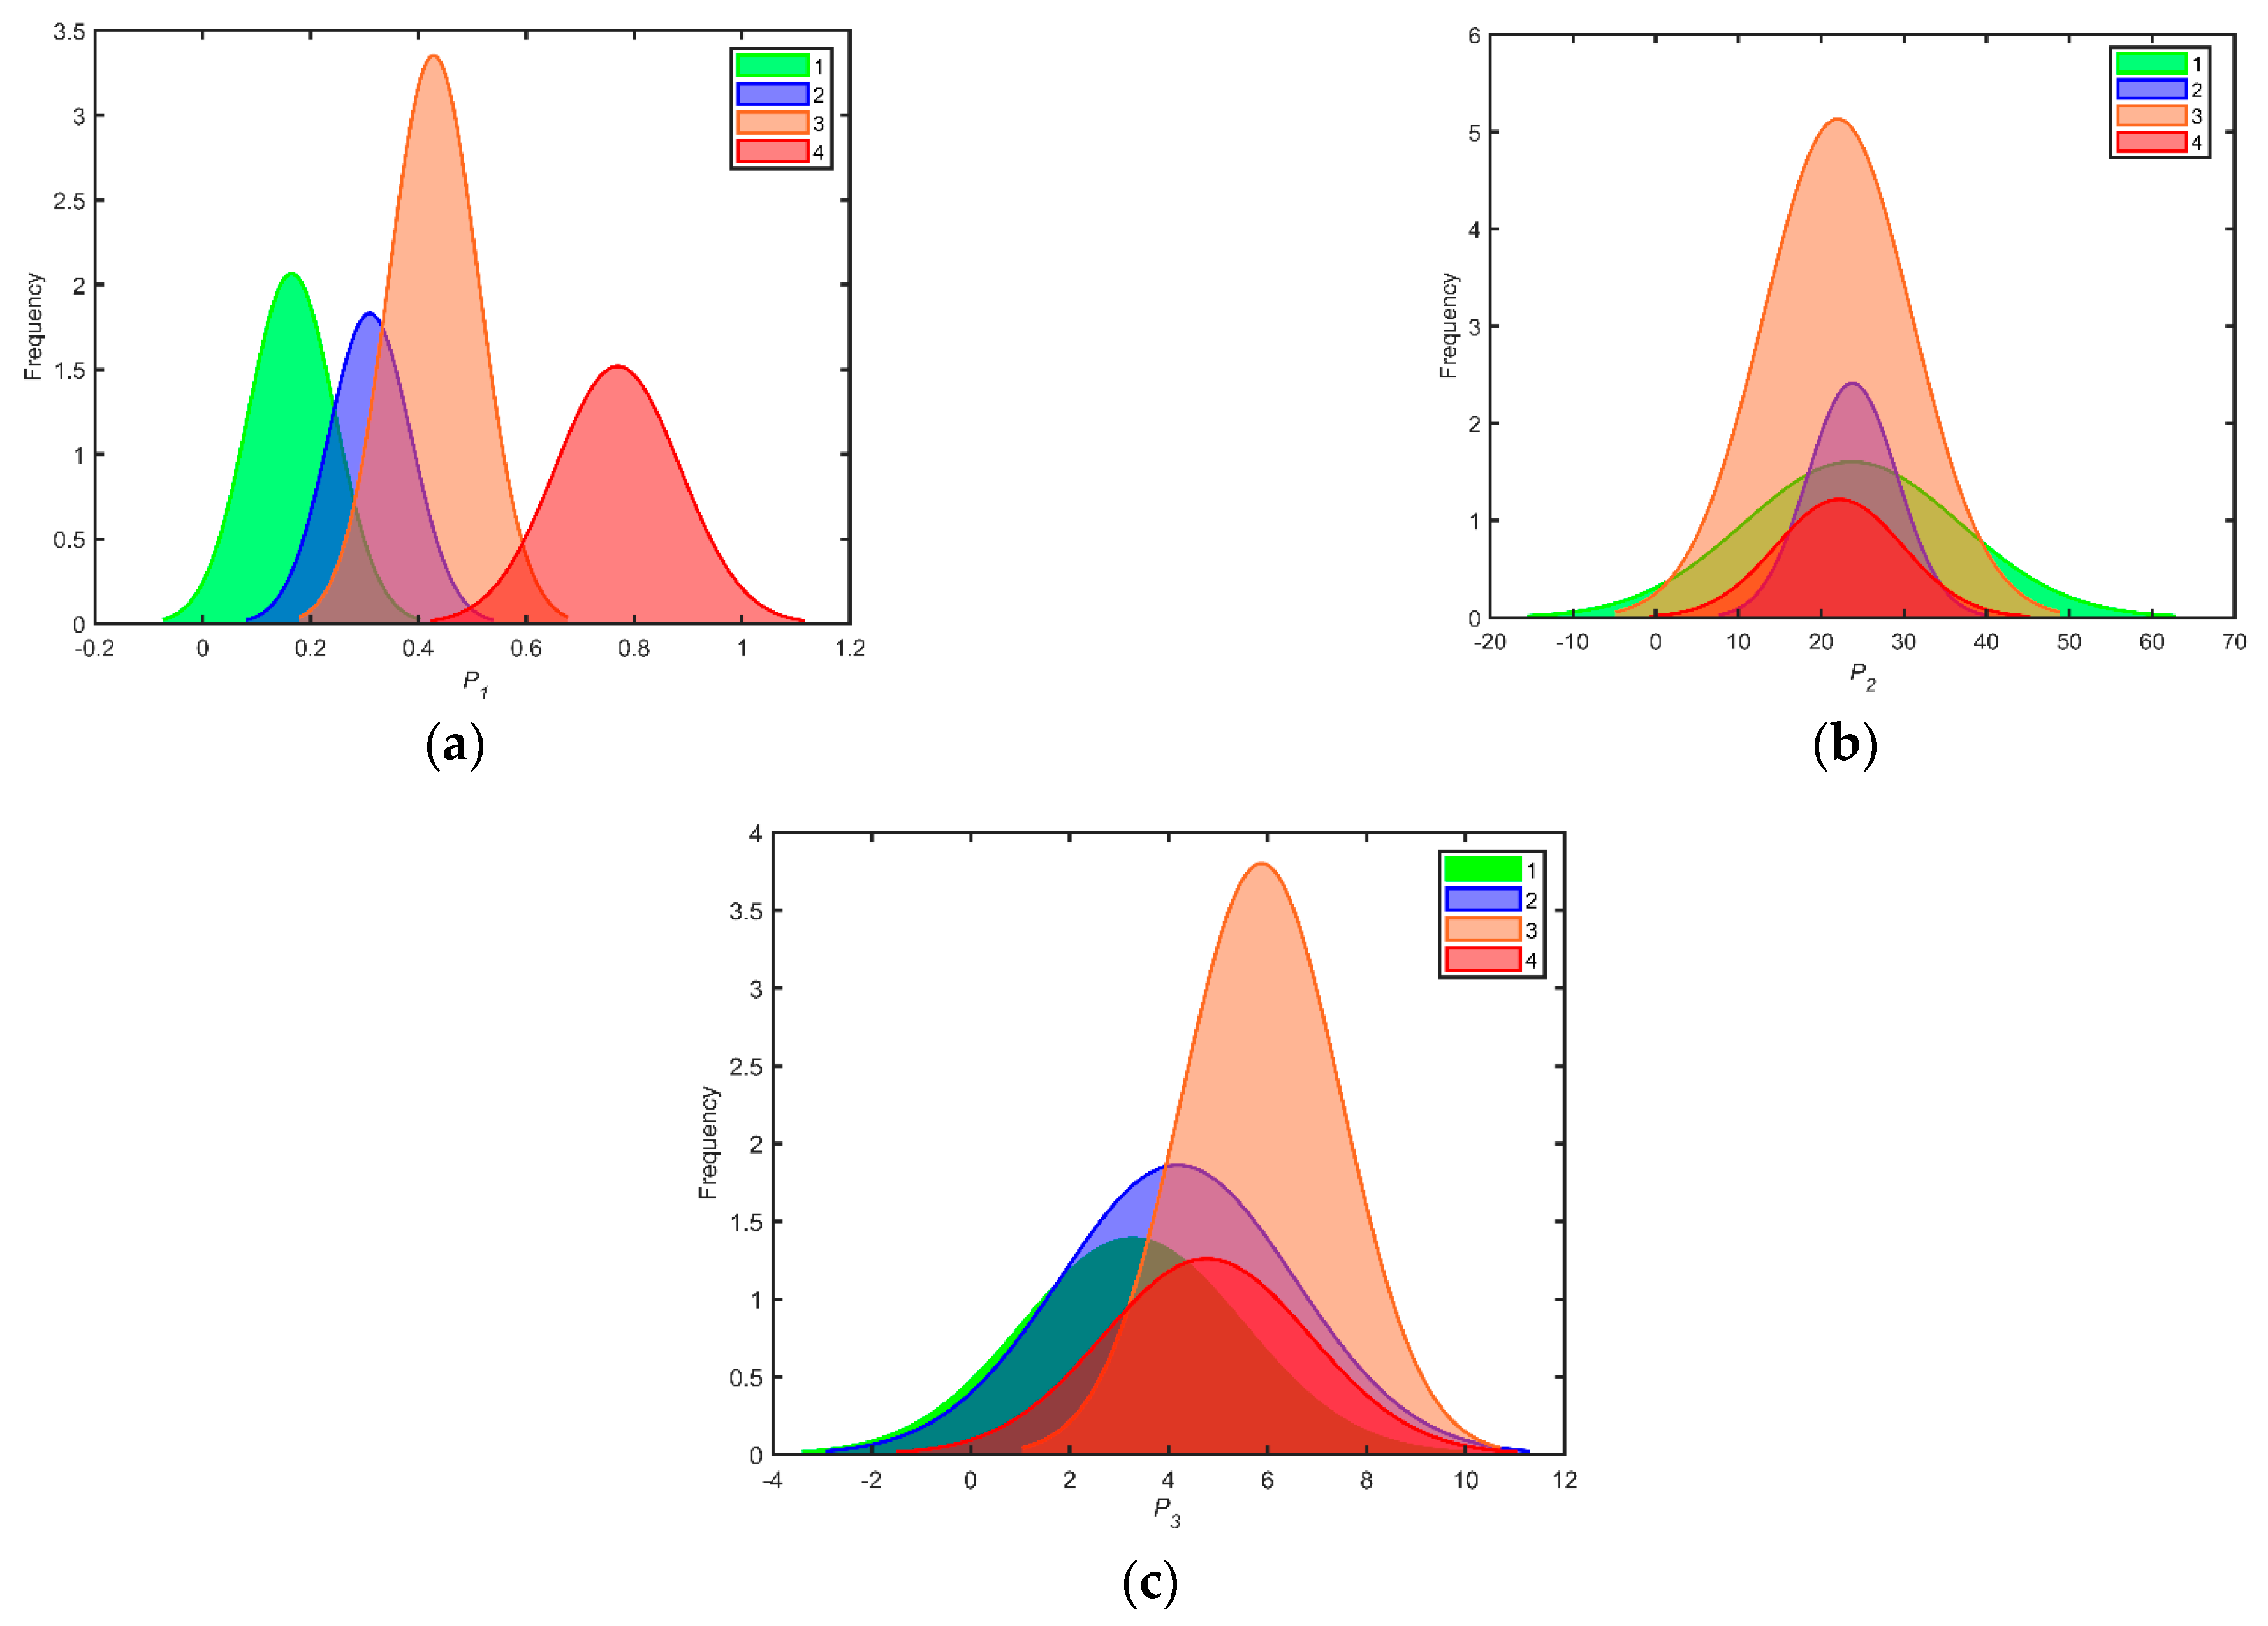
Figure 2 shows the distribution of the three indicators under different intensity levels after normal fitting. It can be roughly judged from the figure that rock stress coefficient is positively correlated with rock burst intensity grade, rock brittleness coefficient is negatively correlated with rock burst intensity grade, and elastic energy index is positively correlated with rock burst intensity grade. Among them, the effect of grade 1, 2, and 4 changing with the increase in indicator value is more obvious, because the samples of these three grades are relatively uniform. The relationship of grade 3 with the change of indicator value is fuzzy, which is caused by the large sample size of grade 3, with a wide boundary and complex information.
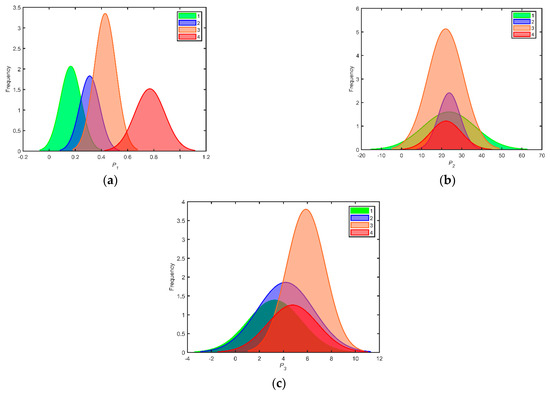
Figure 2.
Distribution of three indicators under different intensity levels. (a) Stress coefficient. (b) Brittleness coefficient. (c) Elastic energy index.
2.3.3. Dimensionality Reduction
- (1)
- Method and principle
(a) Standardization
The standardized processing of the original data can improve the solving speed of the algorithm. The calculation formula is shown in (1):
In the formula: is the th indicator value of the th sample; and are the maximum and minimum values of the th indicator, respectively; and is the normalized result.
(b) T-SNE algorithm
t-distributed stochastic neighbor embedding(T-SNE) is a commonly used dimensionality reduction method [29,30], The nonlinear feature of the algorithm is suitable for processing rock burst data, and it is also conducive to reducing the multi-dimensional data to two dimensions for visualization purposes.
The T-SNE algorithm is used to calculate the similarity probability between data points and then map the similarity probability of the high-dimensional space to the low-dimensional space, so that the high-dimensional space and the low-dimensional space maintain a similar probability distribution. T-SNE converts the Euclidean distance relationship between two data points and in high-dimensional space into conditional probability to represent the correlation. The calculation formula is as follows:
is the Gaussian variance corresponding to the sample point , and so the joint probability distribution between two points in n-dimensional space is:
In the low-dimensional space, the Gaussian distribution in the traditional SNE algorithm is replaced by T distribution. Mapping and to and , the probability distribution function is:
The T-SNE algorithm, like the traditional SNE algorithm, combines the KL distance formula and gradient descent method as loss function. However, compared with the traditional SNE algorithm, the T-SNE algorithm uses Formula (3) to simplify the loss function. In addition, T-SNE algorithm replaces Gaussian distribution with T distribution in Formula (2), which can better distinguish sample categories and enhance dimension reduction and visualization effect.
- (2)
- Specific analysis
(a) Data standardization
The original data are standardized according to Formula (1); the processed variables are all in the range of [0, 1], and the distribution is unchanged. This method can effectively improve the convergence speed of the algorithm, and some of the samples after processing are shown in Table 4.
Table 4.
Sample data of some rock burst cases after standardized processing.
(b) Dimensionality reduction visualization
The sample contains four kinds of information, three prediction indicators (influencing factors), and one prediction target (intensity level), which comprises 4-dimensional sample data. As shown in Figure 3, three-dimensional coordinate values are used to represent the indicators, and four colors represent different intensity levels to depict the sample distribution in three-dimensional space. It can be seen that it is difficult to visually see the distribution of samples and the difference between different rock burst grades in three-dimensional space. Therefore, reducing the three dimensions to two dimensions can more intuitively and clearly show the differences and distribution of samples.
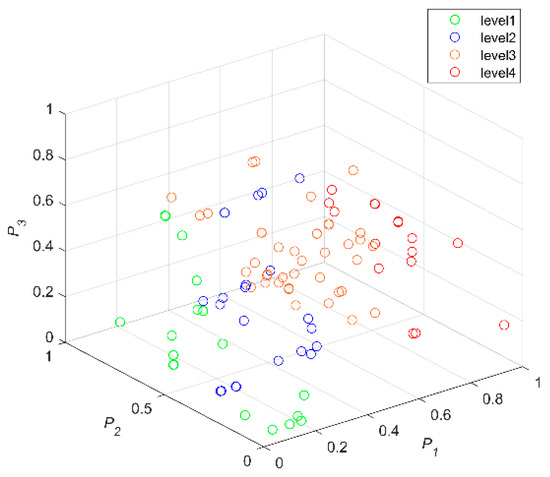
Figure 3.
Distribution of sample data in 3-dimensional space.
The relationship between the dependent variable and the two independent variables after dimensionality reduction of the sample data using T-SNE algorithm is shown in Figure 4. Dimensionality reduction results show that there is a relatively obvious boundary between the four types of samples, and similar sample points are basically clustered together. Therefore, it can be seen that the sample data have little discreteness, no influence of singular values, and have a certain representativeness. Moreover, it can be pre-judged that the machine learning algorithm in this paper can effectively find the boundaries of various samples and correctly distinguish different rock burst intensity levels.
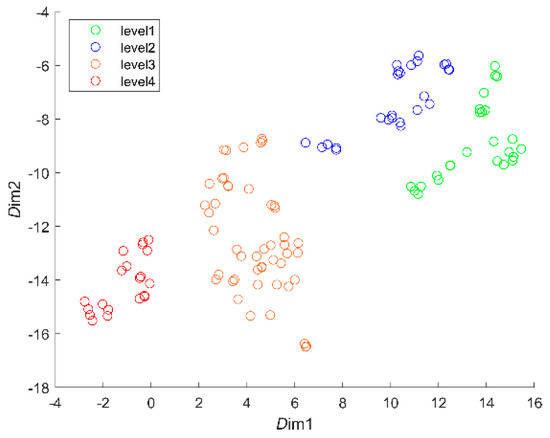
Figure 4.
Distribution of sample data after dimensionality reduction.
3. Model Construction
3.1. Principle of Comprehensive Weighting
3.1.1. Subjective Weighting Method
(1) Delphi method
The Delphi method [31,32] can collect different expert opinions to obtain the weight of the prediction indicators. The calculation method is as follows:
In the formula, is the mean of weights assigned to the jth prediction indicators by different experts; is the weight assigned by the pth expert to the jth prediction indicators; q is the total number of experts; m is the number of indicators; and is the variance, which reflects the dispersion of different expert opinions.
(2) Improved analytic hierarchy process
The analytic hierarchy process [33,34] is a widely used subjective empowerment method. In this paper, the 3-scale method is adopted to establish the judgment matrix [22], thus improving the traditional analytic hierarchy process. This simplifies the calculation and avoids consistency checking. The implementation is as follows:
In the formula, is the comparison matrix obtained after evaluating the importance of indicators; is a judgment matrix transformed by comparison matrix; is the sum of the elements in each row of the comparison matrix; is the weight corresponding to the JTH index in the judgment matrix; and is the final weight obtained after the normalization of the judgment matrix.
3.1.2. Objective Weighting Method
(1) Entropy weight method
The entropy weight method [35] is one of the most commonly used objective weighting methods due to its relatively small calculation amount and clear process. Assuming that n samples are used to calculate the weight of m indicators, the original data matrix must first be converted into a judgment matrix , and the calculation method is as follows.
Among them, the calculation method of the larger and better indicator is consistent with Formula (1), and the smaller and better indicator is:
The entropy of the jth indicator is:
where , if , is defined according to the limit principle.
The weight of the jth indicator is:
(2) CRITIC method
The CRITIC method [36] determines the weight of indicators through the comparison intensity of samples and the conflict between indicators. The specific calculation steps are as follows:
Calculate the mean and standard deviation of the sample indicator:
Calculate the coefficient of variation:
The original matrix is normalized into a judgment matrix like the entropy weight method, and then the correlation coefficient is calculated:
Calculate the information contained in the jth indicator:
The weight of the jth indicator is:
3.1.3. Subjective and Objective Comprehensive Empowerment
After obtaining a single weight calculated based on different methods, the combined weight of the same attribute is calculated using the method of multiplication synthesis normalization. The calculation formula is as follows:
where: is the combined subjective weight of the jth index, and is the combined objective weight of the jth indicator.
Then the method of harmonic average coefficient in information theory is applied to comprehensively calculate the subjective weights and objective weights of different attributes. The formula is as follows:
where is the comprehensive weight calculated by the harmonic average of the combined subjective weight and the combined objective weight of indicator j; is the final comprehensive weight obtained after the comprehensive weight of indicator j is normalized.
3.2. Principle of BOA-SVM Model
3.2.1. Bayesian Optimization Algorithm
The Bayesian optimization algorithm [37] is a global optimization algorithm based on probability distribution theory. It can solve the problem of how to determine the hyperparameters reasonably in the prediction model; the optimal hyperparameter is output in the hyperparameter combination, and it is a commonly used optimization algorithm. Based on References [37,38], this paper briefly introduces the Bayesian optimization algorithm:
where, is the hyperparameter combination that needs to be optimized, and is the optimal hyperparameter to be output, which minimizes or maximizes the objective function.
The Bayesian optimization algorithm performs iterative calculation according to the famous Bayes theorem in the optimization process:
where represents the set of observation sample data; t represents the number of iterations; represents the unknown objective function; represents the likelihood probability distribution of the observed sample; represents the prior probability distribution of the objective function ; represents the prior probability of the observed value; and represents the probability of assuming to be true by the given observation sample data , which is also the posterior probability distribution of the objective function .
The prior function and the posterior function (sampling function) are two important components of the Bayesian optimization algorithm.
The Gaussian regression process can be expressed as:
represents the mean function of solving the sample data, and represents the covariance function of solving the sample data.
The collection function can be expressed as:
is the normal distribution accumulation function, and is a parameter.
The prior function maximizes the fit of the true objective function through an approximation function. According to the posterior probability distribution, the sampling function samples the region where the global optimal solution is most likely to appear and the region that has not been sampled, and selects the optimal sample points from the candidate set to minimize the value of the objective function. The Gaussian regression process and PI (Probability of Improvement) function are generally adopted as prior functions and sampling functions [38].
The essence of the Bayesian optimization algorithm is to generate a posterior function to select the next new information, through the prior information. It seeks the optimal value of the objective function through iterative calculation. In each iteration, the algorithm selects a new evaluation point as the input through the sampling function, and obtains a new output after calculation, so as to update the observed data set and the value of the objective function.
3.2.2. Support Vector Machine
The support vector machine [39] is a machine learning algorithm based on the structural risk minimization principle and statistical principle. It can map data to high-dimensional space through the kernel function, and find the optimal hyperplane in high-dimensional space to divide data categories. It has good generalization ability, and the solution has uniqueness and global optimality. This method is suitable for analyzing small samples and multi-dimensional data problems, and is often applied to classification and prediction problems. Based on References [39,40], this paper briefly introduces support vector machines:
The relationship between the input variable and the output variable is:
where represents the mapping function; represents the weight vector; and represents the threshold vector.
The objective function in this case is:
where is the penalty factor; is a loss function; and the specific meaning is shown in reference [40].
Then, relaxation variables and are constructed according to the error values between the mapped output variable and the real output variable, Lagrangian operators and are introduced to perform dual transformation of the objective function [40], and the predictive decision function of the support vector machine is obtained as follows:
where is the kernel function.
There are three main types of kernel functions:
Linear kernel function:
Polynomial kernel function:
Gaussian kernel function (radial basis function):
where l is the power of the polynomial and is the width parameter of the Gaussian kernel function.
4. Case Analysis
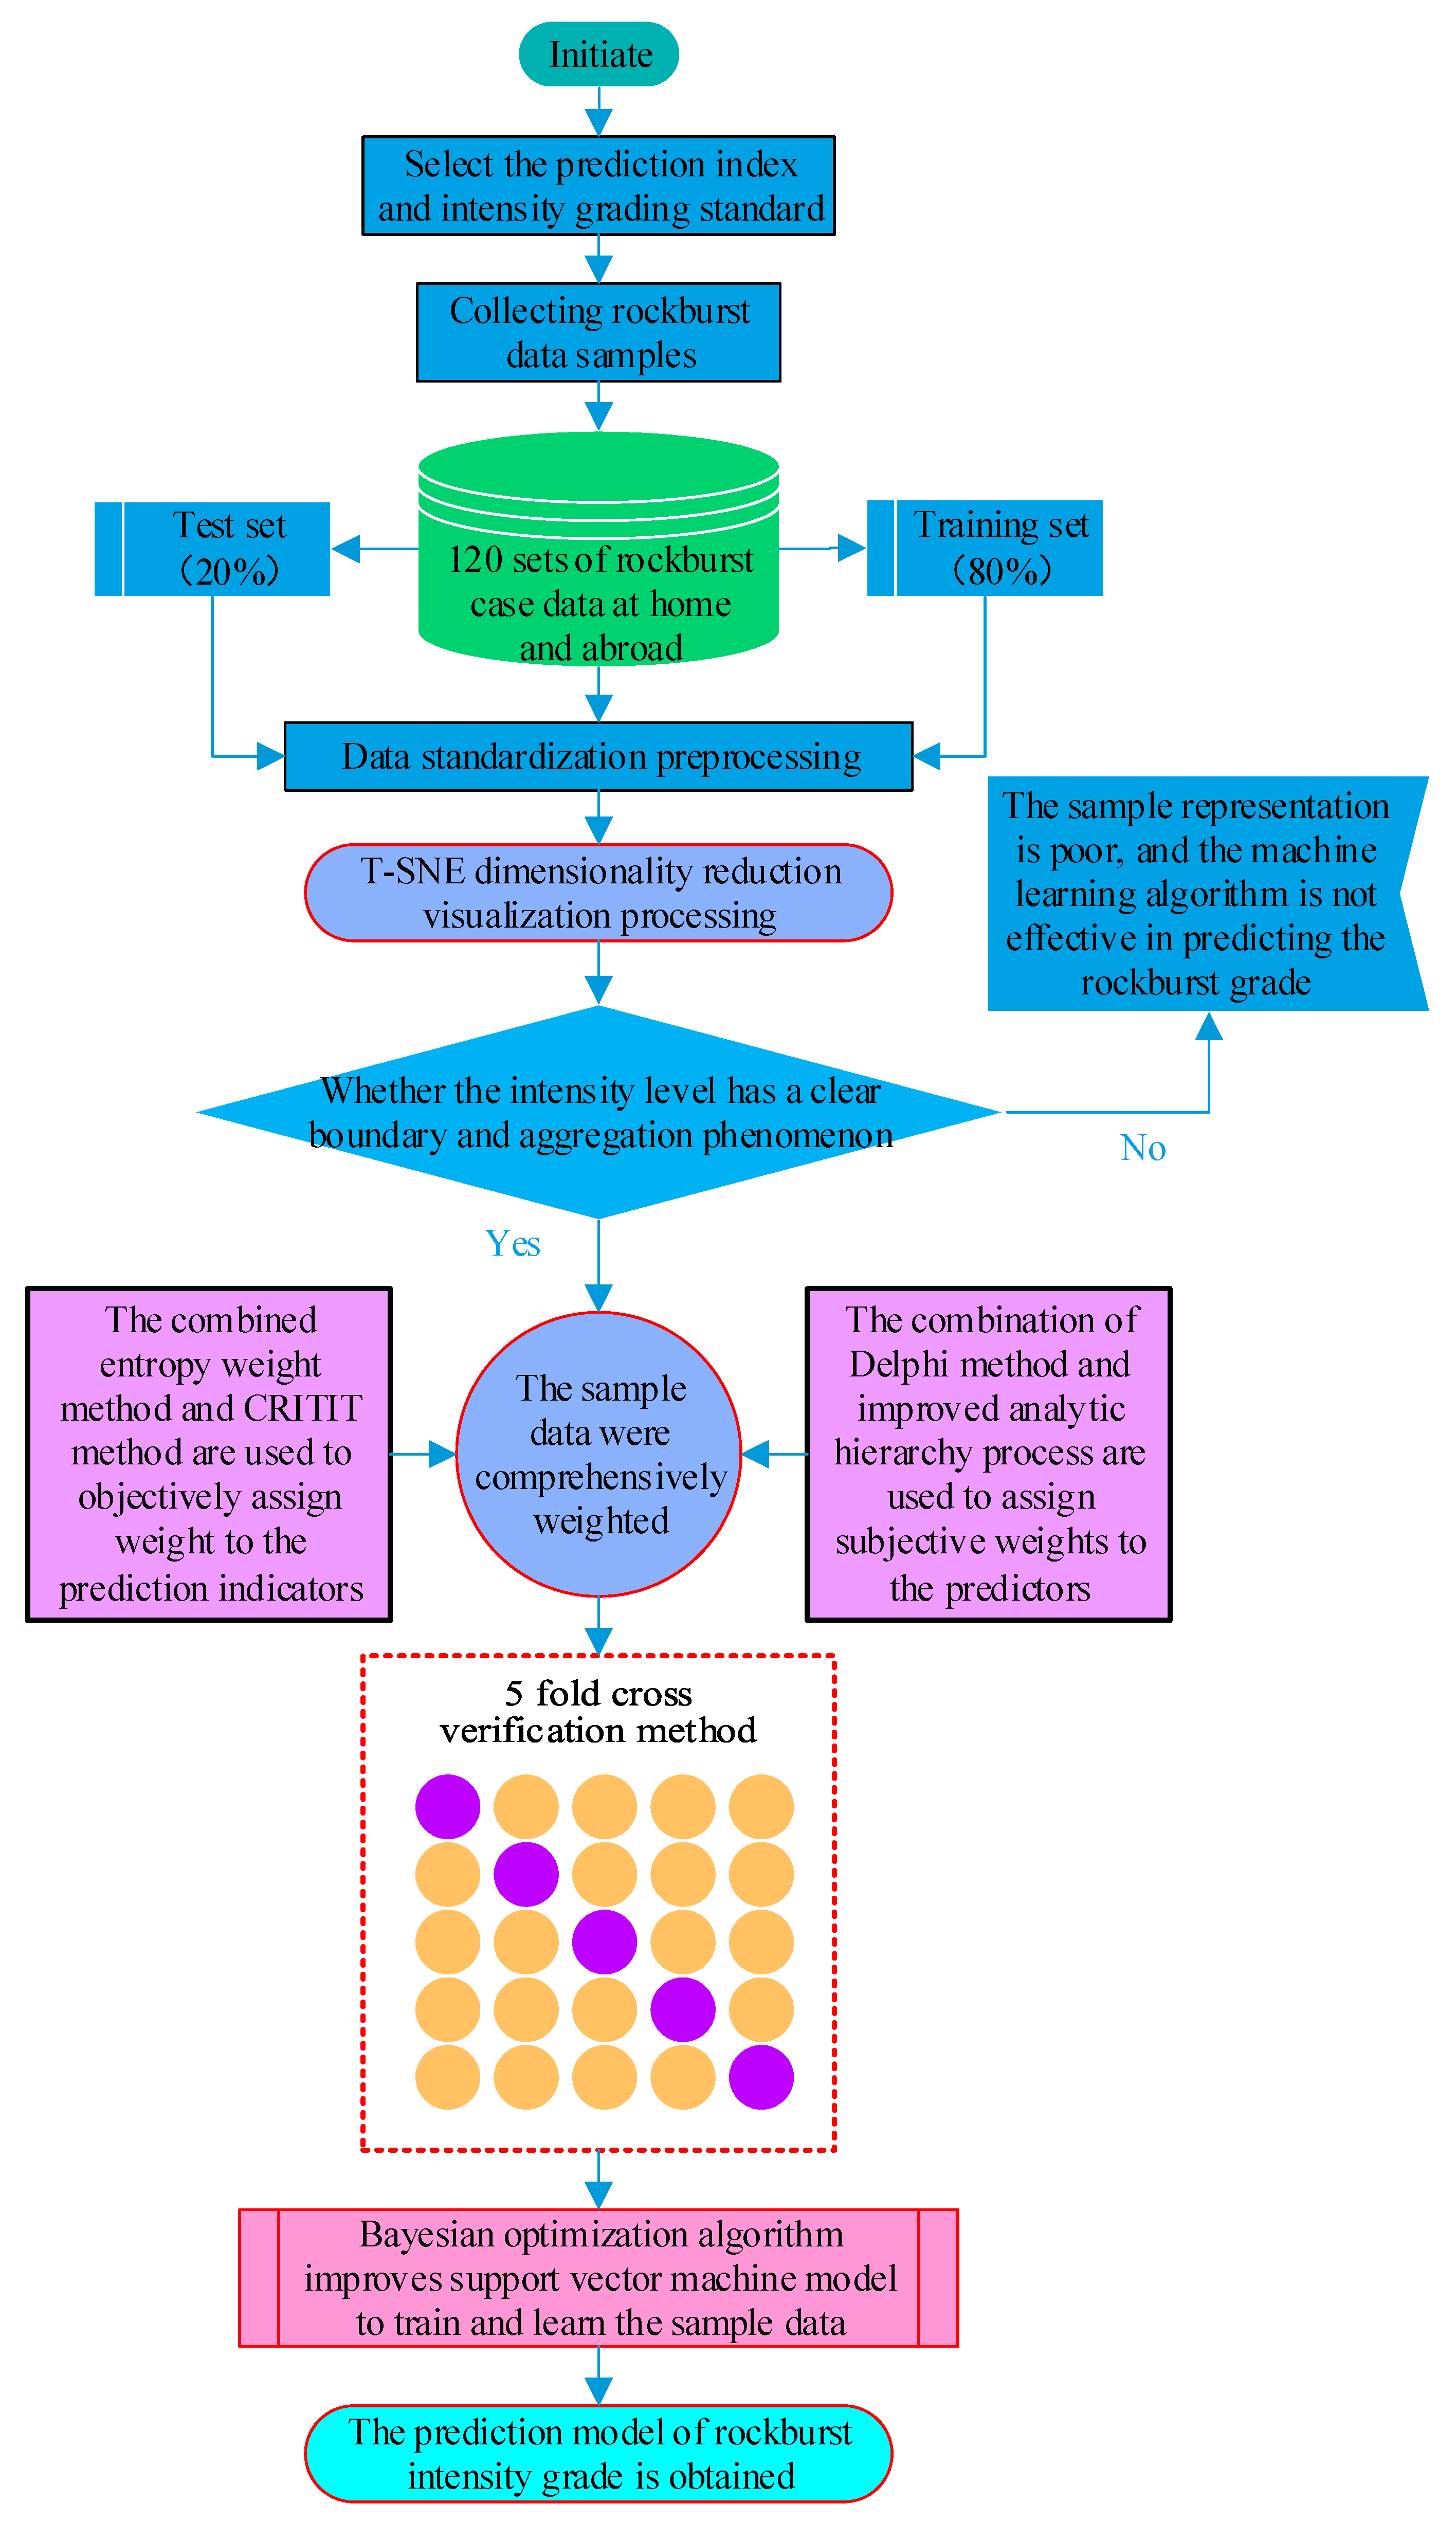
In Section 2.1 of this paper, σθ/σc, σc/σt and Wet are selected to construct the prediction indicators of rock burst intensity grade. In Section 2.2, the rock burst intensity grade is divided into classes I to IV; in Section 2.3, 120 groups of rock burst examples at home and abroad are selected as sample data for the prediction model; in Section 3.1, the prediction indicators are weighted by combining four weighting methods; finally, the Bayesian optimization algorithm was used to improve the support vector machine to train and learn the weighted index data, thereby building a rock burst intensity grade prediction model. The specific modeling process is shown in Figure 5.
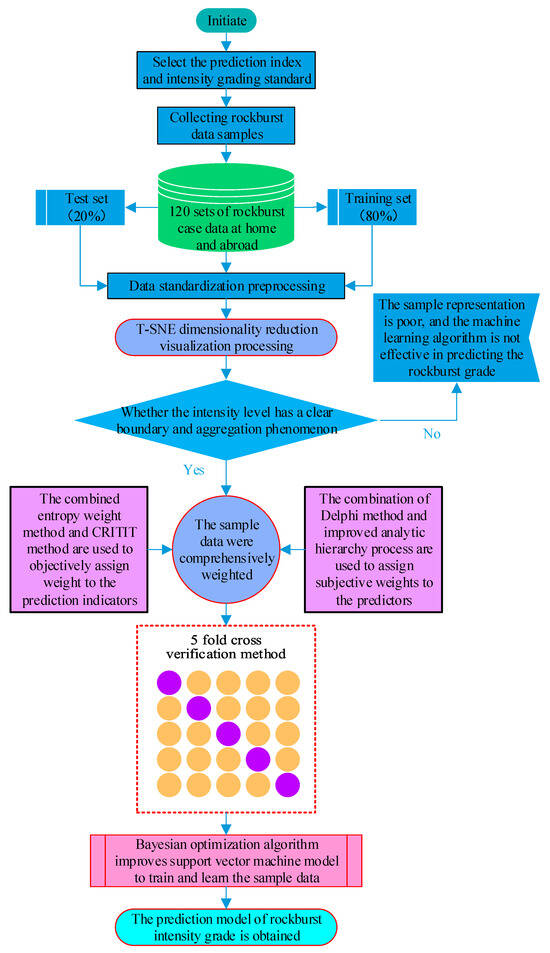
Figure 5.
Modeling flow chart.
The selection of prediction indicators, the classification of intensity levels, the collection of sample data and the visualization processing of the dimensionality reduction of the original data have been explained in the first section. The following describes the process of comprehensive weighted processing of prediction indicators and the process of improving the support vector machine using the Bayesian optimization algorithm.
4.1. The Process of Comprehensive Empowerment
4.1.1. Calculate the Subjective Weight
The Delphi method is the simplest and most intuitive weighting method among the four weighting methods selected in this paper. This method directly averages and normalizes the expert evaluation results as the final result, with clear logic and simple calculation. This paper cites the expert evaluation results of Zhou Yinghao et al. [31] and Li Shaohong et al. [32], and assigns weights to the three selected rock burst prediction indicators based on the Delphi method; the result is a = [0.4, 0.3, 0.3].
The traditional analytic hierarchy process (AHP) is based on the nine-scale method for building a comparison matrix, which is cumbersome and complicated in determining the scale value and matrix operation, and its practicability will be reduced when the number of data is large. In this paper, the analytic hierarchy process is improved, and the comparison matrix is constructed based on the three-scale method. The improved analytic hierarchy process is more logical, less computational, and more practical. In this paper, based on the evaluation results of the importance of the three prediction indicators by Li Mingliang [22] and Yang Ling et al. [18], the occurrence mechanism of “three highs and one disturbance” of rock burst, and the expert consultation results, the stress condition is higher than the energy condition, and the energy condition is higher than the surrounding rock condition.
According to Formula (8), the comparison matrix of the three indicators is as follows:
Then, according to Formulas (9) and (10), the judgment matrix of the three indicators is obtained as follows:
Finally, according to Formulas (11) and (12), the subjective weights of the three indicators based on the improved analytic hierarchy process are calculated, and the result is b = [0.571, 0.143, 0.286].
Comparing the weight results of the two subjective weighting methods, it can be seen that there is not a small difference between the two results, which also reflects the limitations of the single weighting method. In order to increase the fault tolerance and reliability of the final results, Equation (22) is used to balance the two calculation results, and the subjective weight of the combination of the two methods is obtained: [0.640, 0.120, 0.240].
4.1.2. Calculate the Objective Weight
The entropy weight method and the CRITIC method use the difference between the indicators in the original data to determine the objective weight, and the calculation process is more complicated than the subjective weight method. Therefore, the calculation process of the two methods will not be shown here. The author uses the MATLAB intelligent computing tool to calculate two objective weights of the three indicators, and the results are as follows: c = [0.452, 0.297, 0.251], d = [0.394, 0.319, 0.287].
Comparing the weight results of the two objective weighting methods, it can be seen that there is not a small difference between the two results, which further reflects the limitations of the single weighting method. Similarly, Equation (22) is used to balance the two calculation results, and the objective weight of the combination of the two methods is obtained: [0.516, 0.275, 0.209].
4.1.3. Calculate the Comprehensive Weight
Considering the subjective experience and cognition of decision makers and the objective information and law of the sample data, the subjective weight and objective weight of the three indicators are balanced, and Formula (23) is used for comprehensive calculation. The result is = [0.594, 0.174, 0.232]. Among these, the internal operation mechanism of Formula (23) makes each indicator have a higher comprehensive weight only when the subjective weight and objective weight are both higher, avoiding the contradiction caused by the large difference between subjective and objective weight values, and obtaining a more balanced and scientific indicator weight. In addition, the calculated results are normalized.
The specific calculation results of different weights are shown in Table 5.
Table 5.
Indicator weight calculation results.
4.2. Process of Improving Support Vector Machine by Bayesian Optimization Algorithm
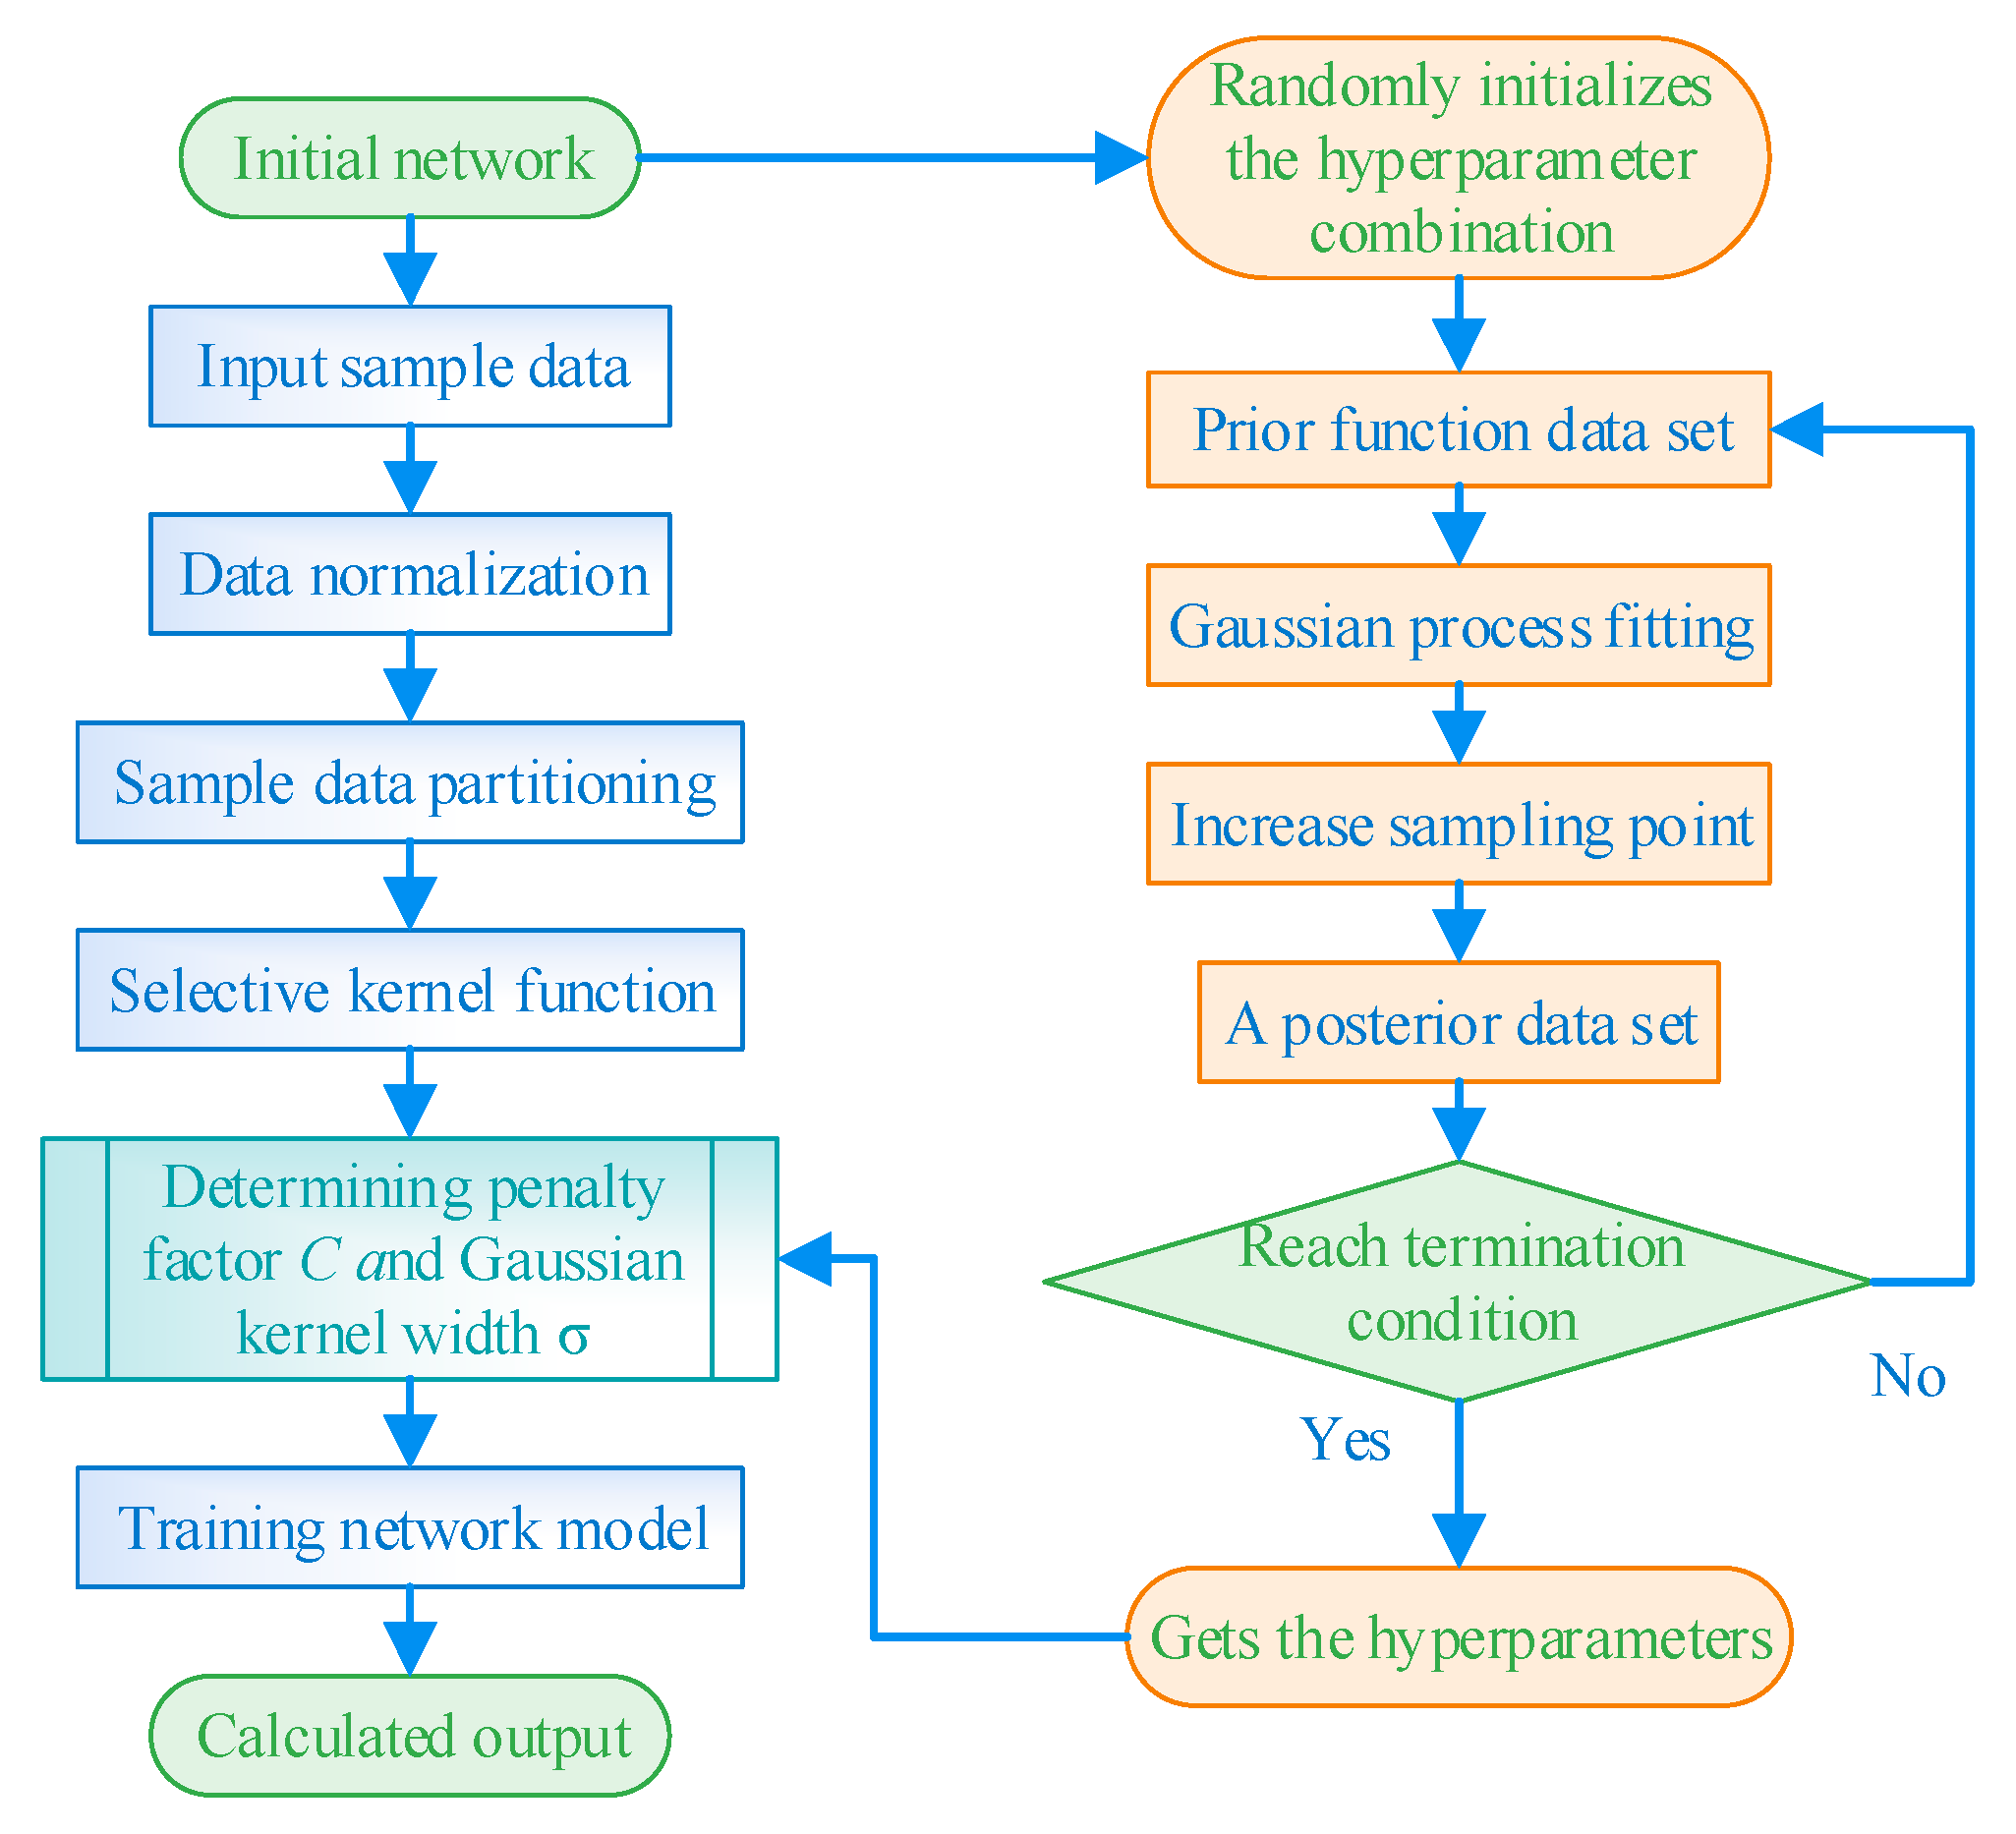
Using the Bayesian optimization algorithm to improve the support vector machine is mainly in order to select the best hyperparameters for the support vector machine by using the iterative optimization function of the Bayesian optimization algorithm. When SVM chooses a linear function and polynomial function as kernel function, the Bayes optimization algorithm only needs to optimize one hyperparameter: the penalty factor. When SVM selects the Gaussian function (also known as the radial basis function) as the kernel function, the Bayesian optimization algorithm needs to optimize both the penalty factor and the kernel width hyperparameters. The specific optimization process is shown in Figure 6. The iterative optimization process of the Bayes algorithm in the support vector machine is shown in Figure 7.
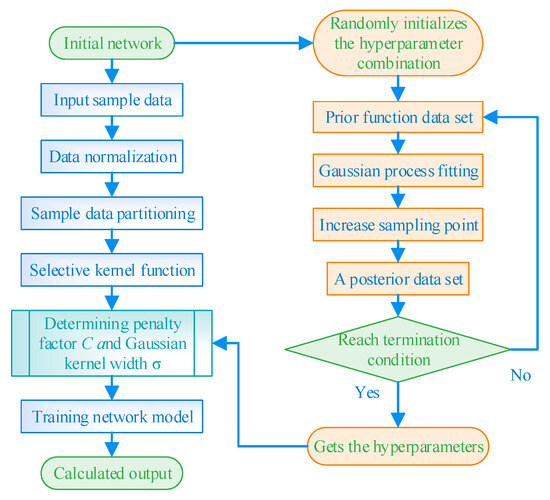
Figure 6.
Process of BOA improving SVM.
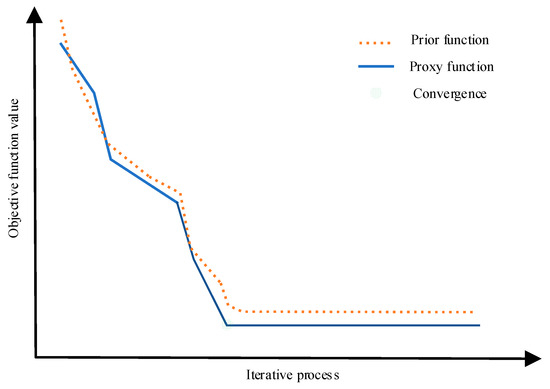
Figure 7.
Iterative optimization process of BOA.
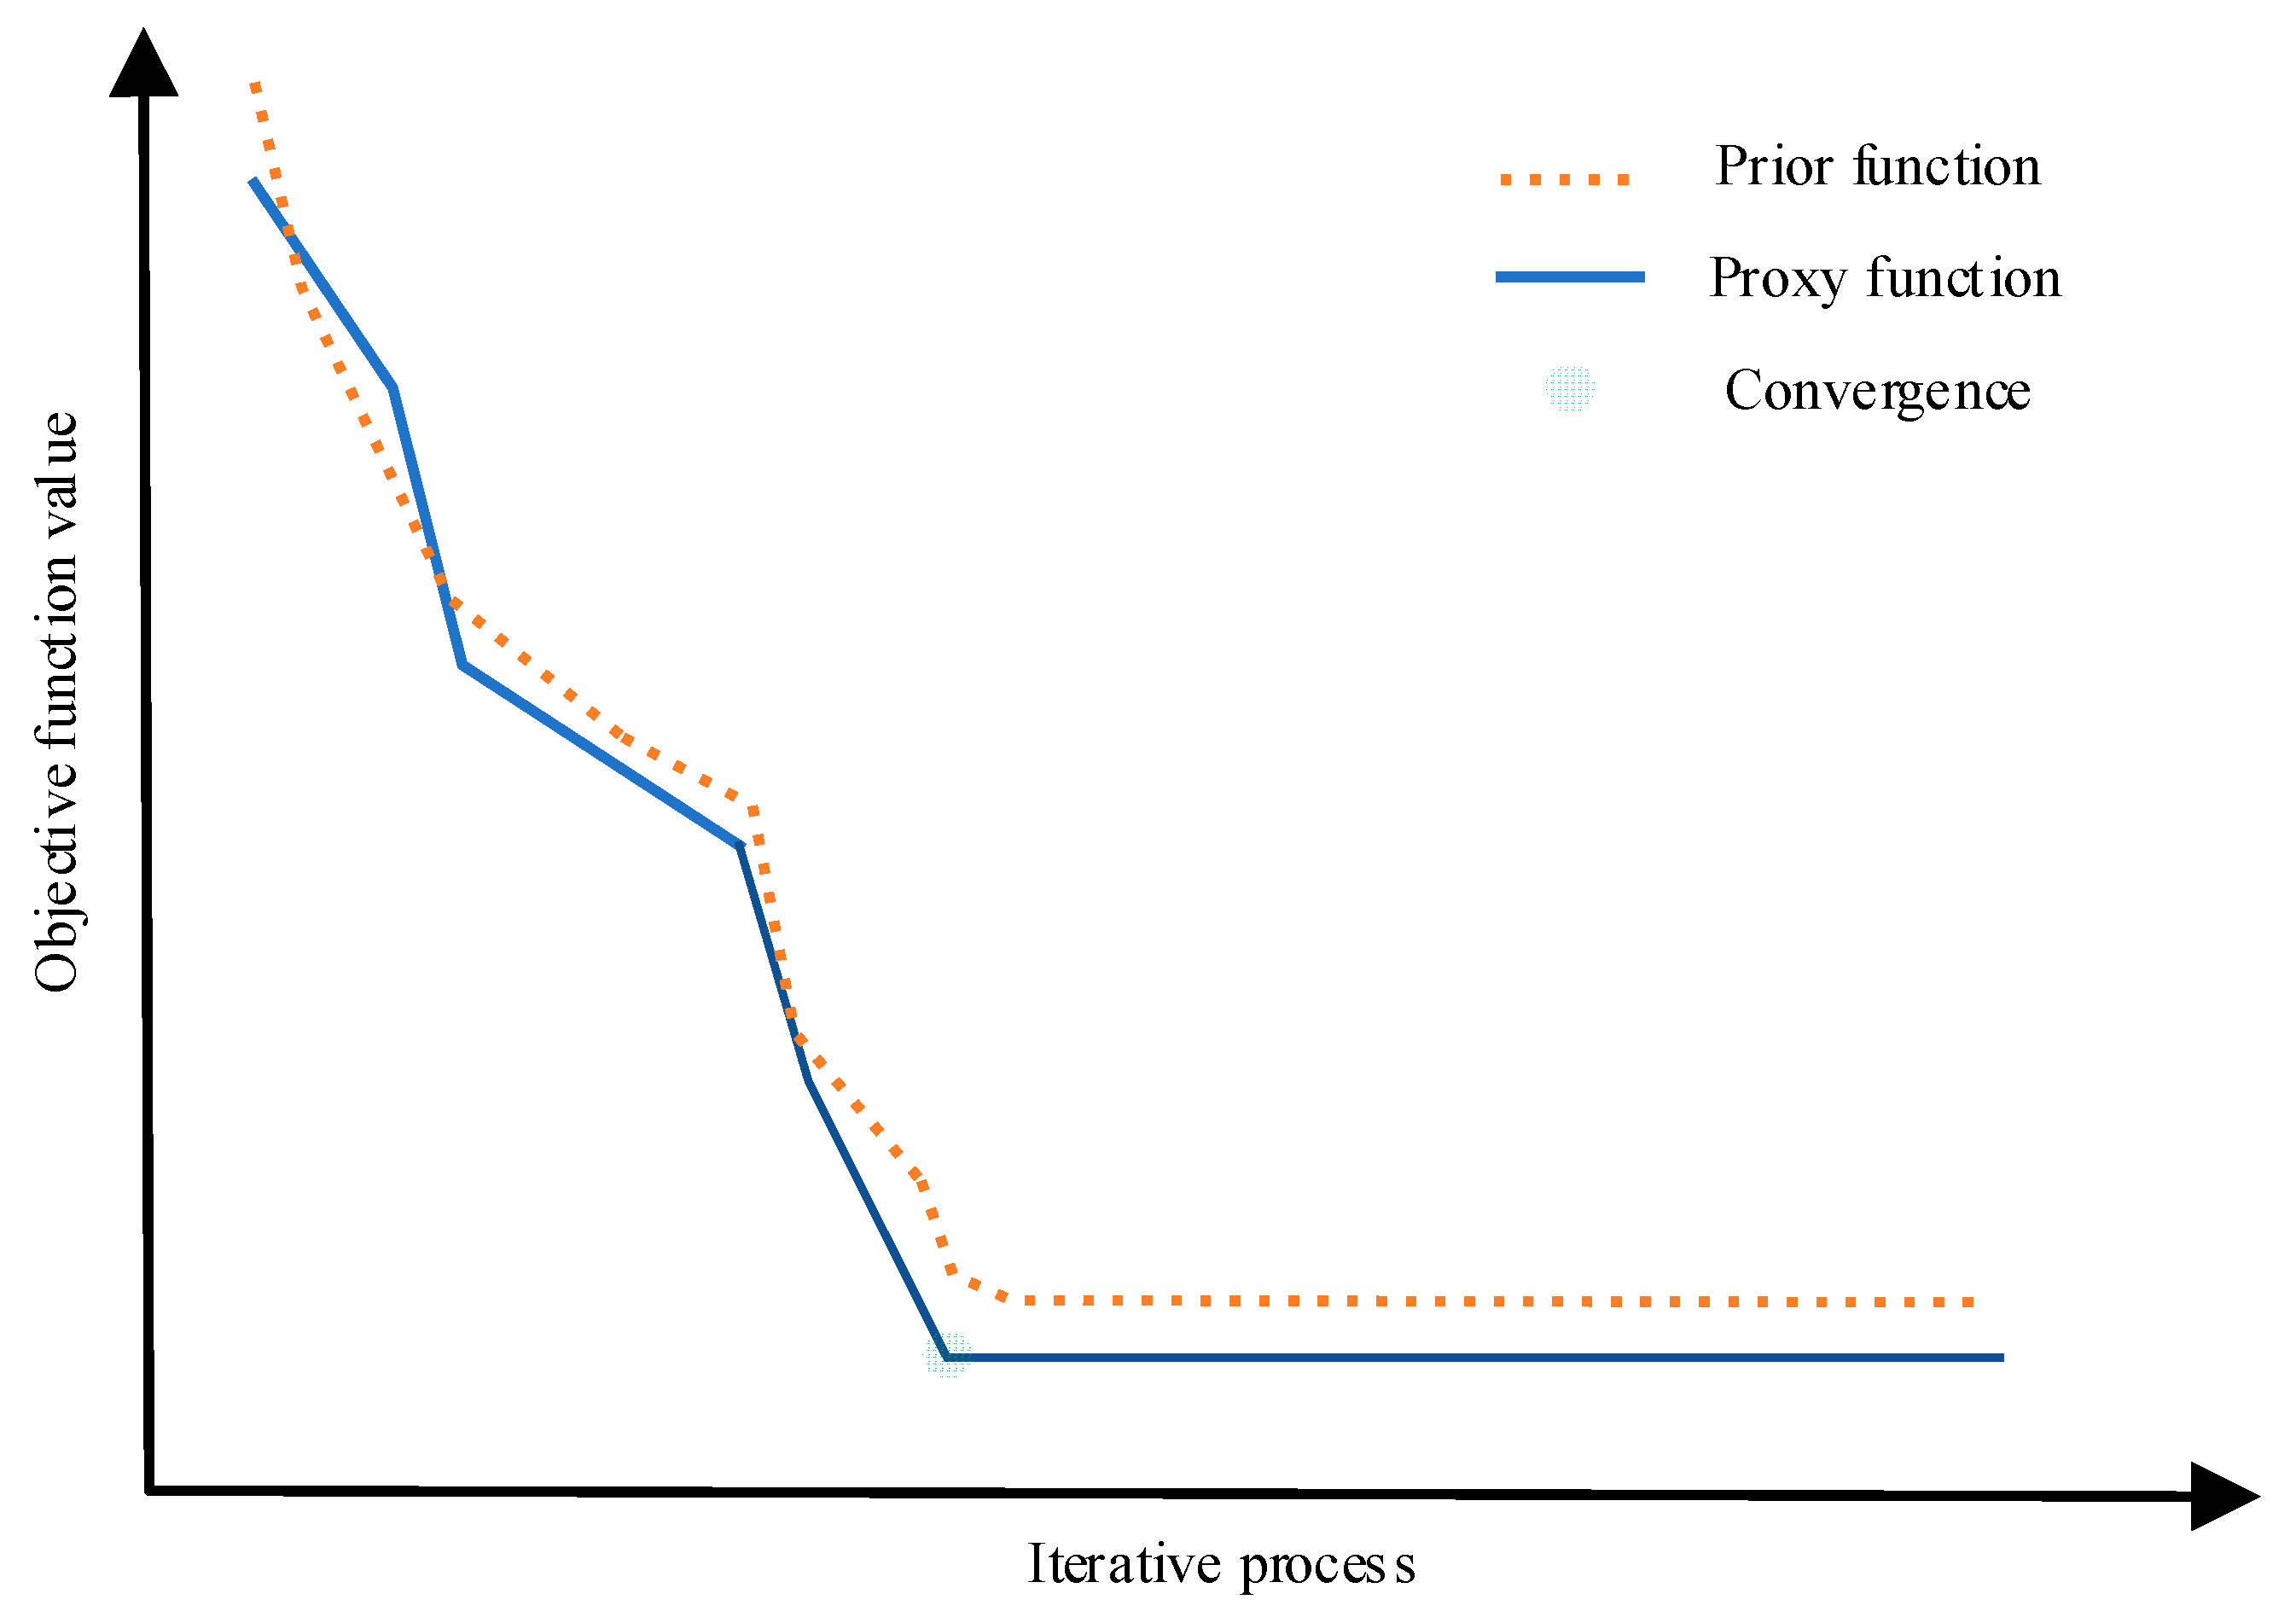
The Bayesian optimization algorithm first fits a prior function as a proxy model of the real objective function through the Gaussian regression process. The prior function can first sample several points to fit the objective function curve, as shown by the yellow dashed line in Figure 8. In the next iteration, the prior function can collect more points near the minimum point or in the new region, and then update the proxy function to carry out the next iteration, as shown in the blue solid line in Figure 8. As the number of iterations increases, the proxy function continuously approximates the real objective function, thus finding the minimum value of the objective function, as shown in the green solid point.

Figure 8.
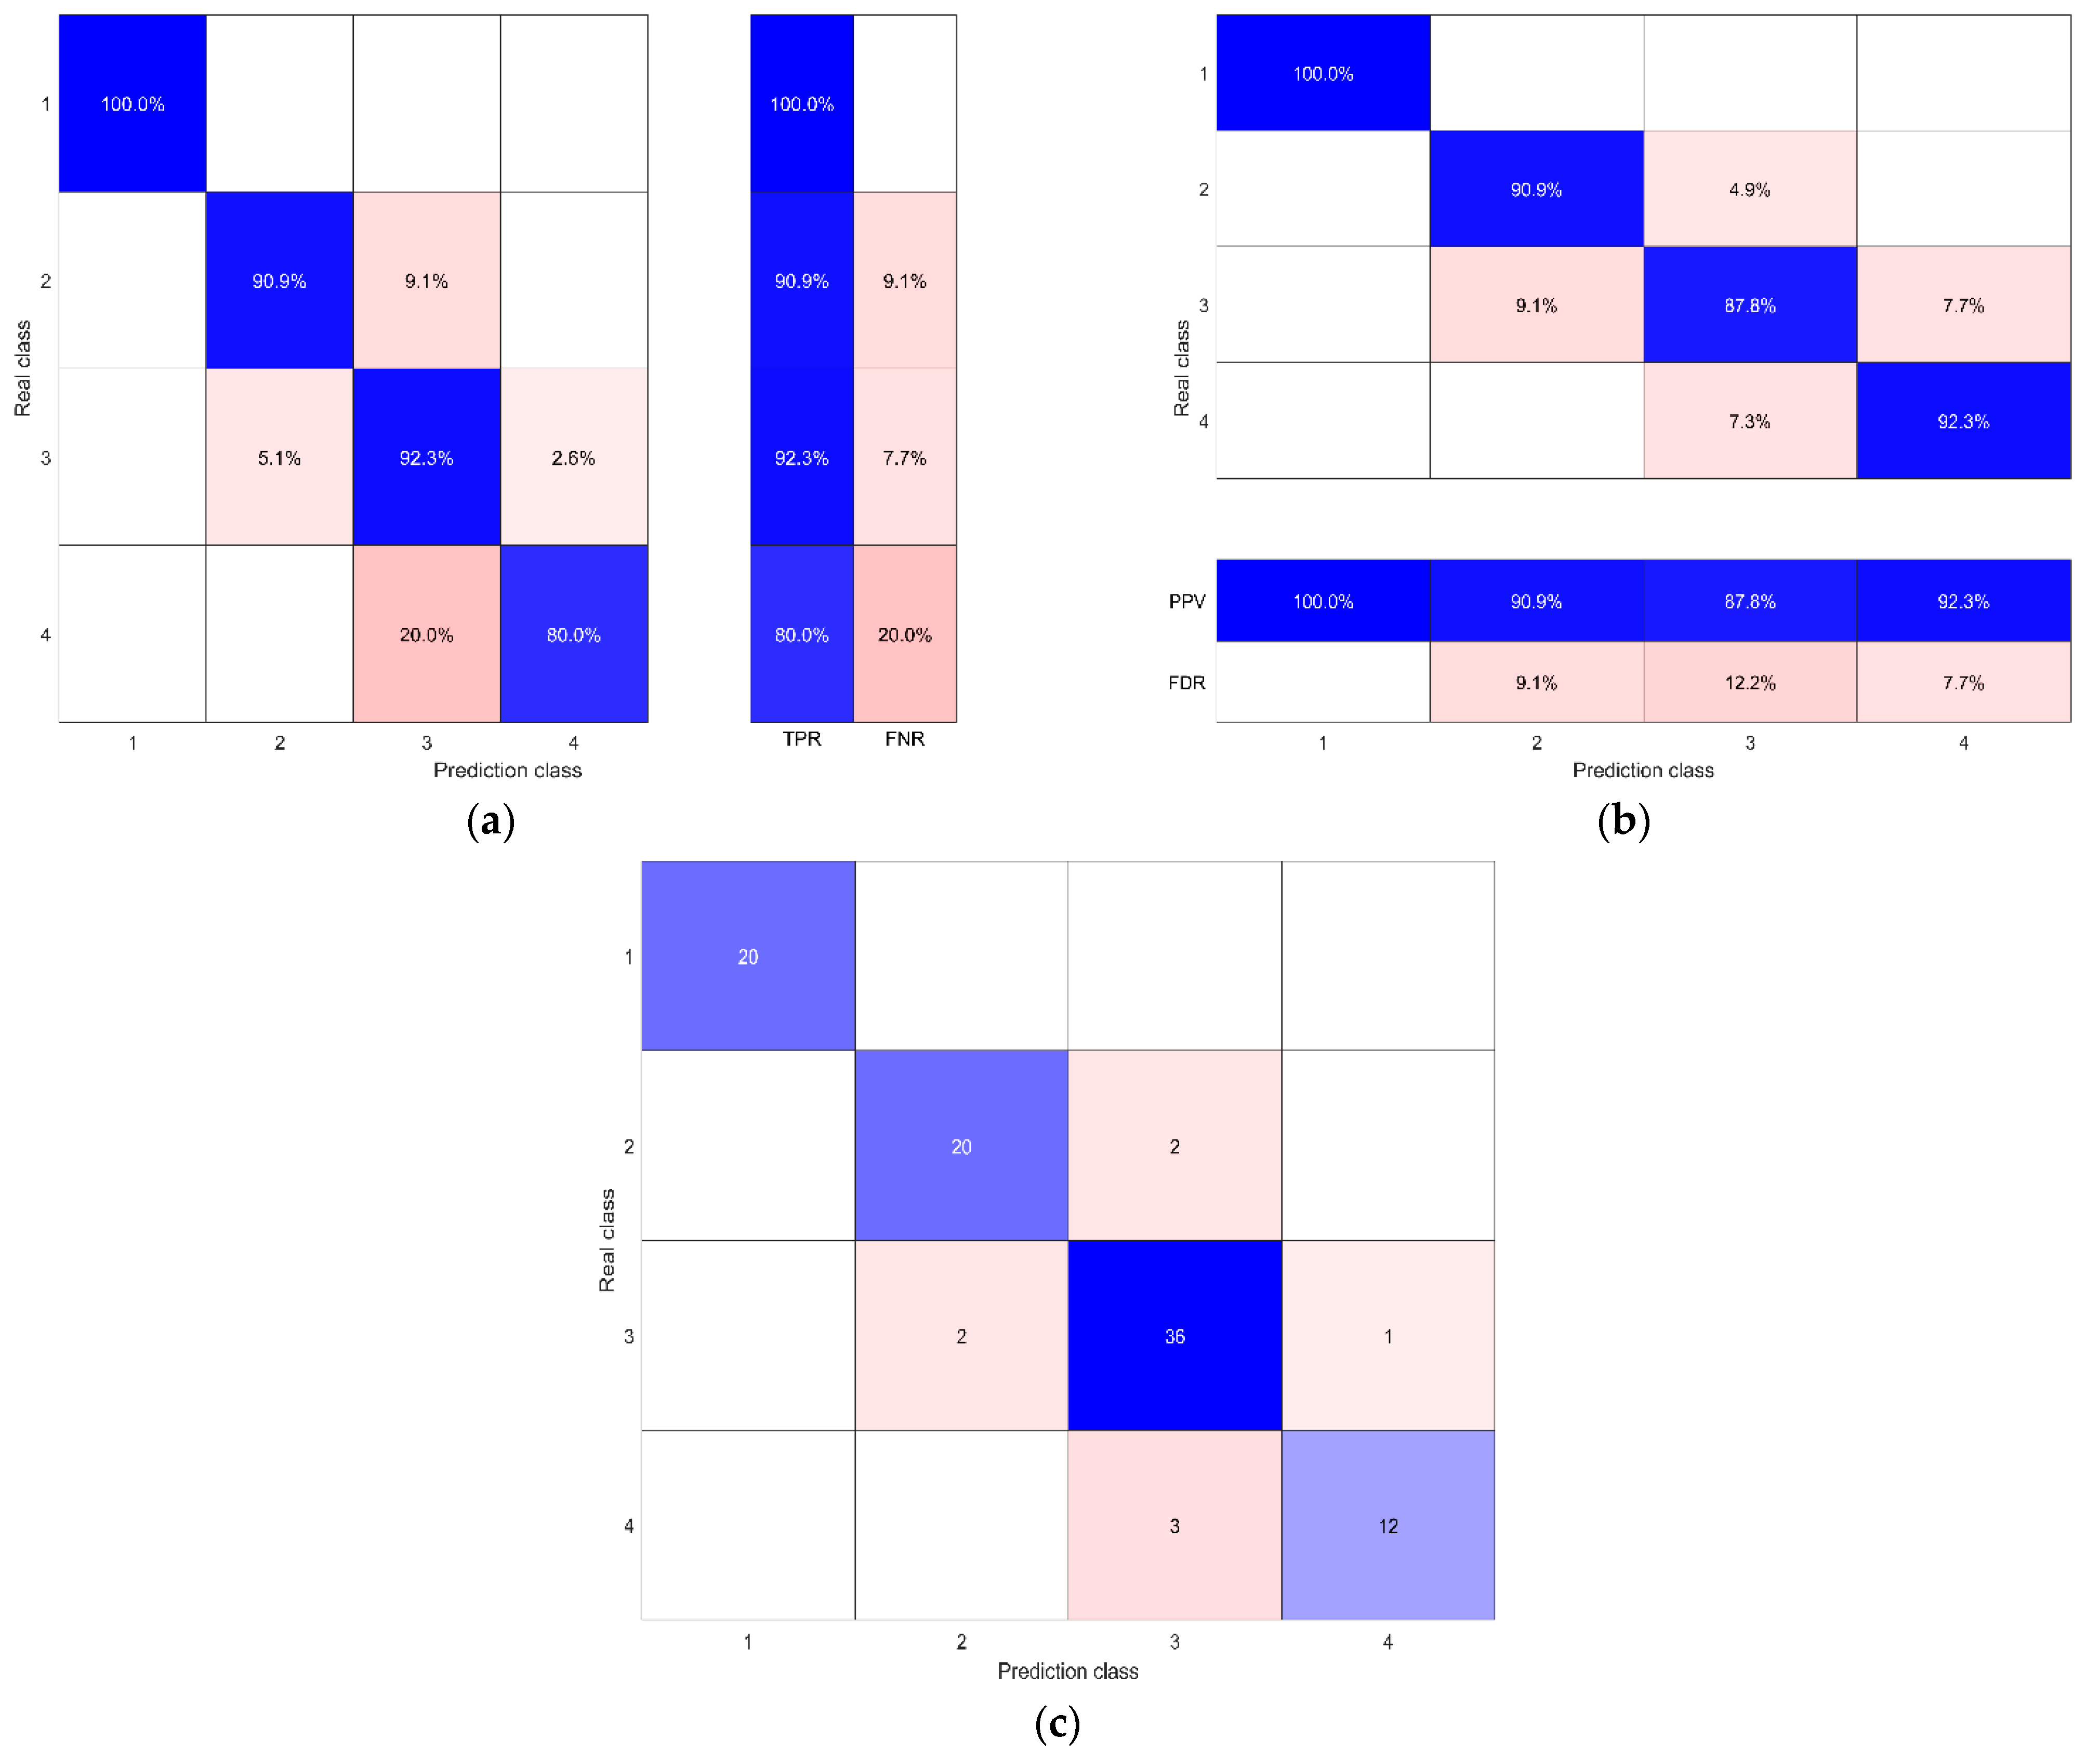
Output confusion matrix. (a) The first confusion matrix. (b) The second confusion matrix. (c)The third confusion matrix.
(1) Initialize network parameters
After several preliminary tests on the prediction model, combined with some common experience on support vector machines, the initial parameters are set to the following: the penalty factor is 1; the width of the Gaussian kernel is , and m is the number of prediction indicators; and the maximum number of iterations is 100.
(2) Input samples
According to the first section of this paper, the three prediction indicators, σθ/σc, σc/σt and Wet, and the corresponding 120 groups of rock burst instance data, are selected as the input variables of the prediction model, and the input variables are weighted. The numbers “1”, “2”, “3” and “4” are used to represent the four intensity levels of rock burst as the output variables of the prediction model.
(3) Sample division
The sample data are divided into test sets and training sets, according to the routine ratio of 1:4. The training set is used to mine the law behind the data, and the test set is used to evaluate the prediction effect of the prediction model.
(4) Data normalization
The same method as in Section 2.3.2 is used to normalize the weighted sample data to achieve the purpose of accelerating the iterative convergence of the model.
(5) Select kernel function
In this paper, three types of kernel function support vector machine models are trained and tested. Among them, the polynomial kernel type support vector machine typically selects quadratic function and cubic function as the kernel function for training test.
(6) Determine the optimal hyperparameters
The Bayesian optimization algorithm is used to determine the hyperparameters in the prediction model, namely the penalty factor and the Gaussian kernel width.
(7) Calculation output
After the prediction results are output in the form of a confusion matrix, the true positive rate (TPR), false negative rate (FNR), positive prediction value (PPV), false discovery rate (FDR) and accuracy rate (ACC) of the prediction model can be obtained. And they have the following relationship: TPR + FNR = 1; PPV + FDR = 1. The meanings of the confusion matrix are shown in Table 6, and the meanings of each output result are shown in Table 7.
Table 6.
Confusion matrix.
Table 7.
Output results.
(8) Result analysis
Taking the prediction results of a training set during the experiment as an example, the significance of the above output results represented in the prediction model is elaborated:
As shown in Figure 8a, the TPR of Grade-1 rock burst is 100%, which means that all the actual level-1 rock burst samples are predicted to be level-1 rock burst; that is, the correct prediction rate of grade 1 is 100%. The TPR of level-2 rock burst is 90.9%, which means that 90.9% of the actual level-2 rock burst samples are correctly predicted to be level-2 rock burst; that is, the correct prediction rate of level-2 rock burst is 90.9%. The TPR of level-3 rock burst is 92.3%, which means that 92.3% of the actual level-2 rock burst samples are correctly predicted to be level-3 rock burst; that is, the correct prediction rate of level-2 rock burst is 90.9%. The TPR of level-4 rock burst is 80.0%, which means that 80.0% of the actual level-4 rock burst samples are correctly predicted to be level-4 rock burst; that is, the correct prediction rate of level-4 rock burst is 80.0%.
PPV: As shown in Figure 8b, the PPV of level-1 rock burst is 100%, which means that the predicted level-1 rock burst samples in the prediction results are all consistent with the actual level-1 rock burst samples; that is, the forecasted correct rate of level-1 rock burst is 100%.The PPV of level-2 rock burst is 90.9%, which means that 90.9% of the predicted level-2 rock burst is consistent with the actual level-2 rock burst samples; that is, the forecasted correct rate of level-2 rock burst is 90.9%. The PPV of level-3 rock burst is 87.8%, which means that 87.8% of the predicted level-3 rock burst is consistent with the actual level-3 rock burst samples; that is, the forecasted correct rate of level-3 rock burst is 87.8%. The PPV of level-4 rock burst is 92.3%, which means that 92.3% of the predicted level-4 rock burst is consistent with the actual level-4 rock burst samples; that is, the forecasted correct rate of level-4 rock burst is 92.3%.
ACC: As shown in Figure 8c, the prediction of the training set is quantitatively observed. The actual situation of rock burst is as follows: including 20 level-1 rock burst samples, all were predicted correctly: there were 20 + 2 = 22 level-2 rock burst samples, 20 of which were predicted correctly and 2 of which were wrongly predicted as class-3 rock burst. There were 36 + 2 + 1 = 39 level-3 rock burst samples, 36 of which were predicted correctly, 2 of which were wrongly predicted as level 3, and 1 of which was wrongly predicted as level 4. The samples contained 12 + 3 = 15 class-4 rock burst samples, 12 of which were correctly predicted and 3 of which were incorrectly predicted to be level-3 rock burst. The forecast of rock burst was as follows: there were 20 forecasted results of level-1 rock burst, all of which were correct. There were 20 + 2 = 22 forecasted results of level-2 rock burst, 20 of which were correct and 2 of which were wrong, and should actually be level-3 rock burst. There were 36 + 2 + 3 = 41 forecasted results of level-3 rock burst, 36 of which were correct and 5 of which were wrong, and should actually be two level-2 rock bursts and three level-4 rock bursts. There were 12 + 1 = 13 forecasted results of level-4 rock burst, 12 of which were correct and 1 of which was wrong, and should actually be level-3 rock burst. The overall accuracy is: (20 + 20 + 36 + 12)/(20 + 22 + 39 + 15) = 91.67%, that is, (20 + 20 + 36 + 12)/(20 + 22 + 41 + 13) = 91.67%.
Among these: FNR and TPR have conflicting meanings, as do FDR and PPV. So, FNR and FDR are not discussed here.
4.3. Analysis of Test Results
According to the elaboration in article 4.3.2 (8), the information attributes expressed by prediction correct rate and prediction error rate are consistent, and the information attributes expressed by forecast correct rate and forecast error rate are also consistent. In order to fully display the information and simplify the expression, the two indexes of prediction correct rate and forecast correct rate, which are larger and better, are selected as the evaluation criteria of the model. The prediction effects of the three models are shown and analyzed below:
(1) Build a prediction model with raw data and unoptimized SVM. (SVM model)
The indicator data of rock burst samples are not weighted, and the hyperparameters of the support vector machine are selected subjectively to predict the intensity level of rock burst. The specific prediction situation is shown in Table 8:
Table 8.
Output results of the general SVM model.
It can be seen from the table that the performance of the rock burst intensity-grade prediction model based on traditional SVM is poor. The average prediction correct rate of four kinds of kernel SVM was lower: 68.39%, 78.48%, 80.02% and 68.34%, respectively. The average forecast correct rate is not high, and is, respectively, 78.24%, 85.08%, 86.42%, and 82.10%. The results show that it is not reasonable to select the hyperparameters of SVM only by subjective experience, and that the mapping ability of unweighted indicator data is not strong enough.
(2) After weighted data processing, the prediction model is built with unoptimized SVM (W-SVM model)
The rock burst intensity grade is predicted by using unoptimized-support vector machine-training weighted data. Due to space limitations, compared with the above table, only the average prediction correct rate and average forecast correct rate of each grade of rock burst are shown here. The prediction situation is shown in Table 9:
Table 9.
Output results of the W-SVM model.
It can be seen from the table that the performance of the rock burst intensity-grade prediction model based on W-SVM is not good. The average prediction correct rate of the four kernel SVMs is not high, and is 78.00%, 82.48%, 83.59% and 74.14% respectively. The average forecast correct rate was also low: 85.15%, 87.54%, 88.78% and 89.45%, respectively. The results show that the mapping ability of indicator data is enhanced after weighted processing, which can improve the effect of rock burst intensity-grade prediction, to a certain extent. However, in view of the problems of poor stability and low prediction correct rate of the SVM with subjective selection of hyperparameters, it is necessary to improve the SVM to further improve the performance of the rock burst intensity-grade prediction model.
(3) After data-weighted processing and BOA-improved SVM to build the prediction model (W-BOA-SVM model)
The SVM is improved by BOA, and then the weighted index data are trained by it to predict the intensity level of rock burst. The specific forecasted results are shown in Table 10:
Table 10.
Output results of the W-BOA-SVM model.
It can be seen from the table that the rock burst intensity- grade prediction model built on the W-BOA-SVM has excellent performance. The average prediction correct rate of the four kernel SVMs was higher, with 94.56%, 93.56%, 92.73% and 94.28%, respectively. The average forecast correct rate was 95.99%, 94.99%, 94.22% and 96.20%, respectively. The results show that the performance of the rock burst intensity-grade prediction model can be greatly improved by using the Bayesian optimization algorithm to determine the hyperparameters of the support vector machine on the basis of weighted processing of indicator data.
(4) Comparative analysis
The results of the three forecasting models based on different methods are compared and analyzed, and the specific results are shown in Table 11:
Table 11.
Comparison of the predictive performance of the three models.
As can be seen from the above table, the average TPR and PPV of the SVM model are 74.14% and 82.96%,respectively, and the average accuracy is 78.97%. The average TPR and PPV of the W-SVM model were 79.55% and 87.73%, respectively, and the average accuracy was 82.29%. The average TPR and PPV of W-BOA-SVM model are 93.78% and 95.35% respectively, and the average accuracy is 93.30%.
Comparison between SVM and W-SVM: Compared with SVM, the TPR and PPV of W-SVM are increased by 7.41% and 4.77%, respectively, and the improvement efficiency is 10.27% and 5.75%, respectively. The average accuracy rate was improved by 7.32%, and the efficiency was improved by 9.76%. It can be seen that the performance of the rock burst intensity-grade prediction model can be slightly improved after weighted processing of the indicator data.
Comparison between W-SVM and W-BOA-SVM: Compared with W-SVM, the TPR and PPV of W-BOA-SVM are increased by 14.23% and 7.62%, respectively, and the improvement efficiency is 17.89% and 8.69%, respectively. The average accuracy rate is improved by 11.01%, and the improvement efficiency is 13.38%. It can be seen that the performance of the rock burst intensity-grade prediction model is greatly improved by using the Bayesian optimization algorithm to improve the support vector machine.
Comparison between SVM and W-BOA-SVM: Compared with SVM, the TPR and PPV of W-BOA-SVM are increased by 21.64% and 12.39%, respectively, and the improvement efficiency is 30.00% and 14.93%, respectively. The average accuracy rate is increased by 18.33%, and the improvement efficiency is 24.45%. It can be seen that the performance of the rock burst intensity-grade prediction model can be significantly improved by combining indicator data-weighting processing and the Bayesian optimization algorithm to improve the support vector machine.
The model in this paper is compared and analyzed with the model in previous studies, and the specific results are shown in Table 12.
Table 12.
Comparison of different forecasting models.
As can be seen from Table 13, some scholars have predicted the rock burst intensity level by means of the weighting method and the machine learning algorithm, and achieved some good results. However, compared with the model constructed in this paper, the data set of these models is relatively small, so the generalization of the model is not as good as the model in this paper, and its accuracy is not high. At the same time, the weighting methods of some models are relatively simple, which will lead to the determined index weights not being reasonable and balanced, and reduce the reliability of the models. In this paper, four weighting methods are coupled together to determine the weight of the index, and the support vector machine is improved by using the Bayesian optimization algorithm with strong optimization ability, so as to predict the intensity level of rock burst. The result is relatively good.
Table 13.
Actual rating and indicator data of tunnel and mine to be predicted.
5. Engineering Application
In order to verify the generalization and engineering applicability of the model, 15 sets of rock burst case data from Maluping mine [41] and Dxiangling Tunnel [42] were selected to predict the intensity grade and further evaluate the model constructed in this paper. In the data set, the number of class I-to-IV rock bursts is 3, 3, 6, 3 in sequence, which is consistent with the proportion of each class of rock bursts in 120 training samples. Some of the selected data are shown in Table 13.
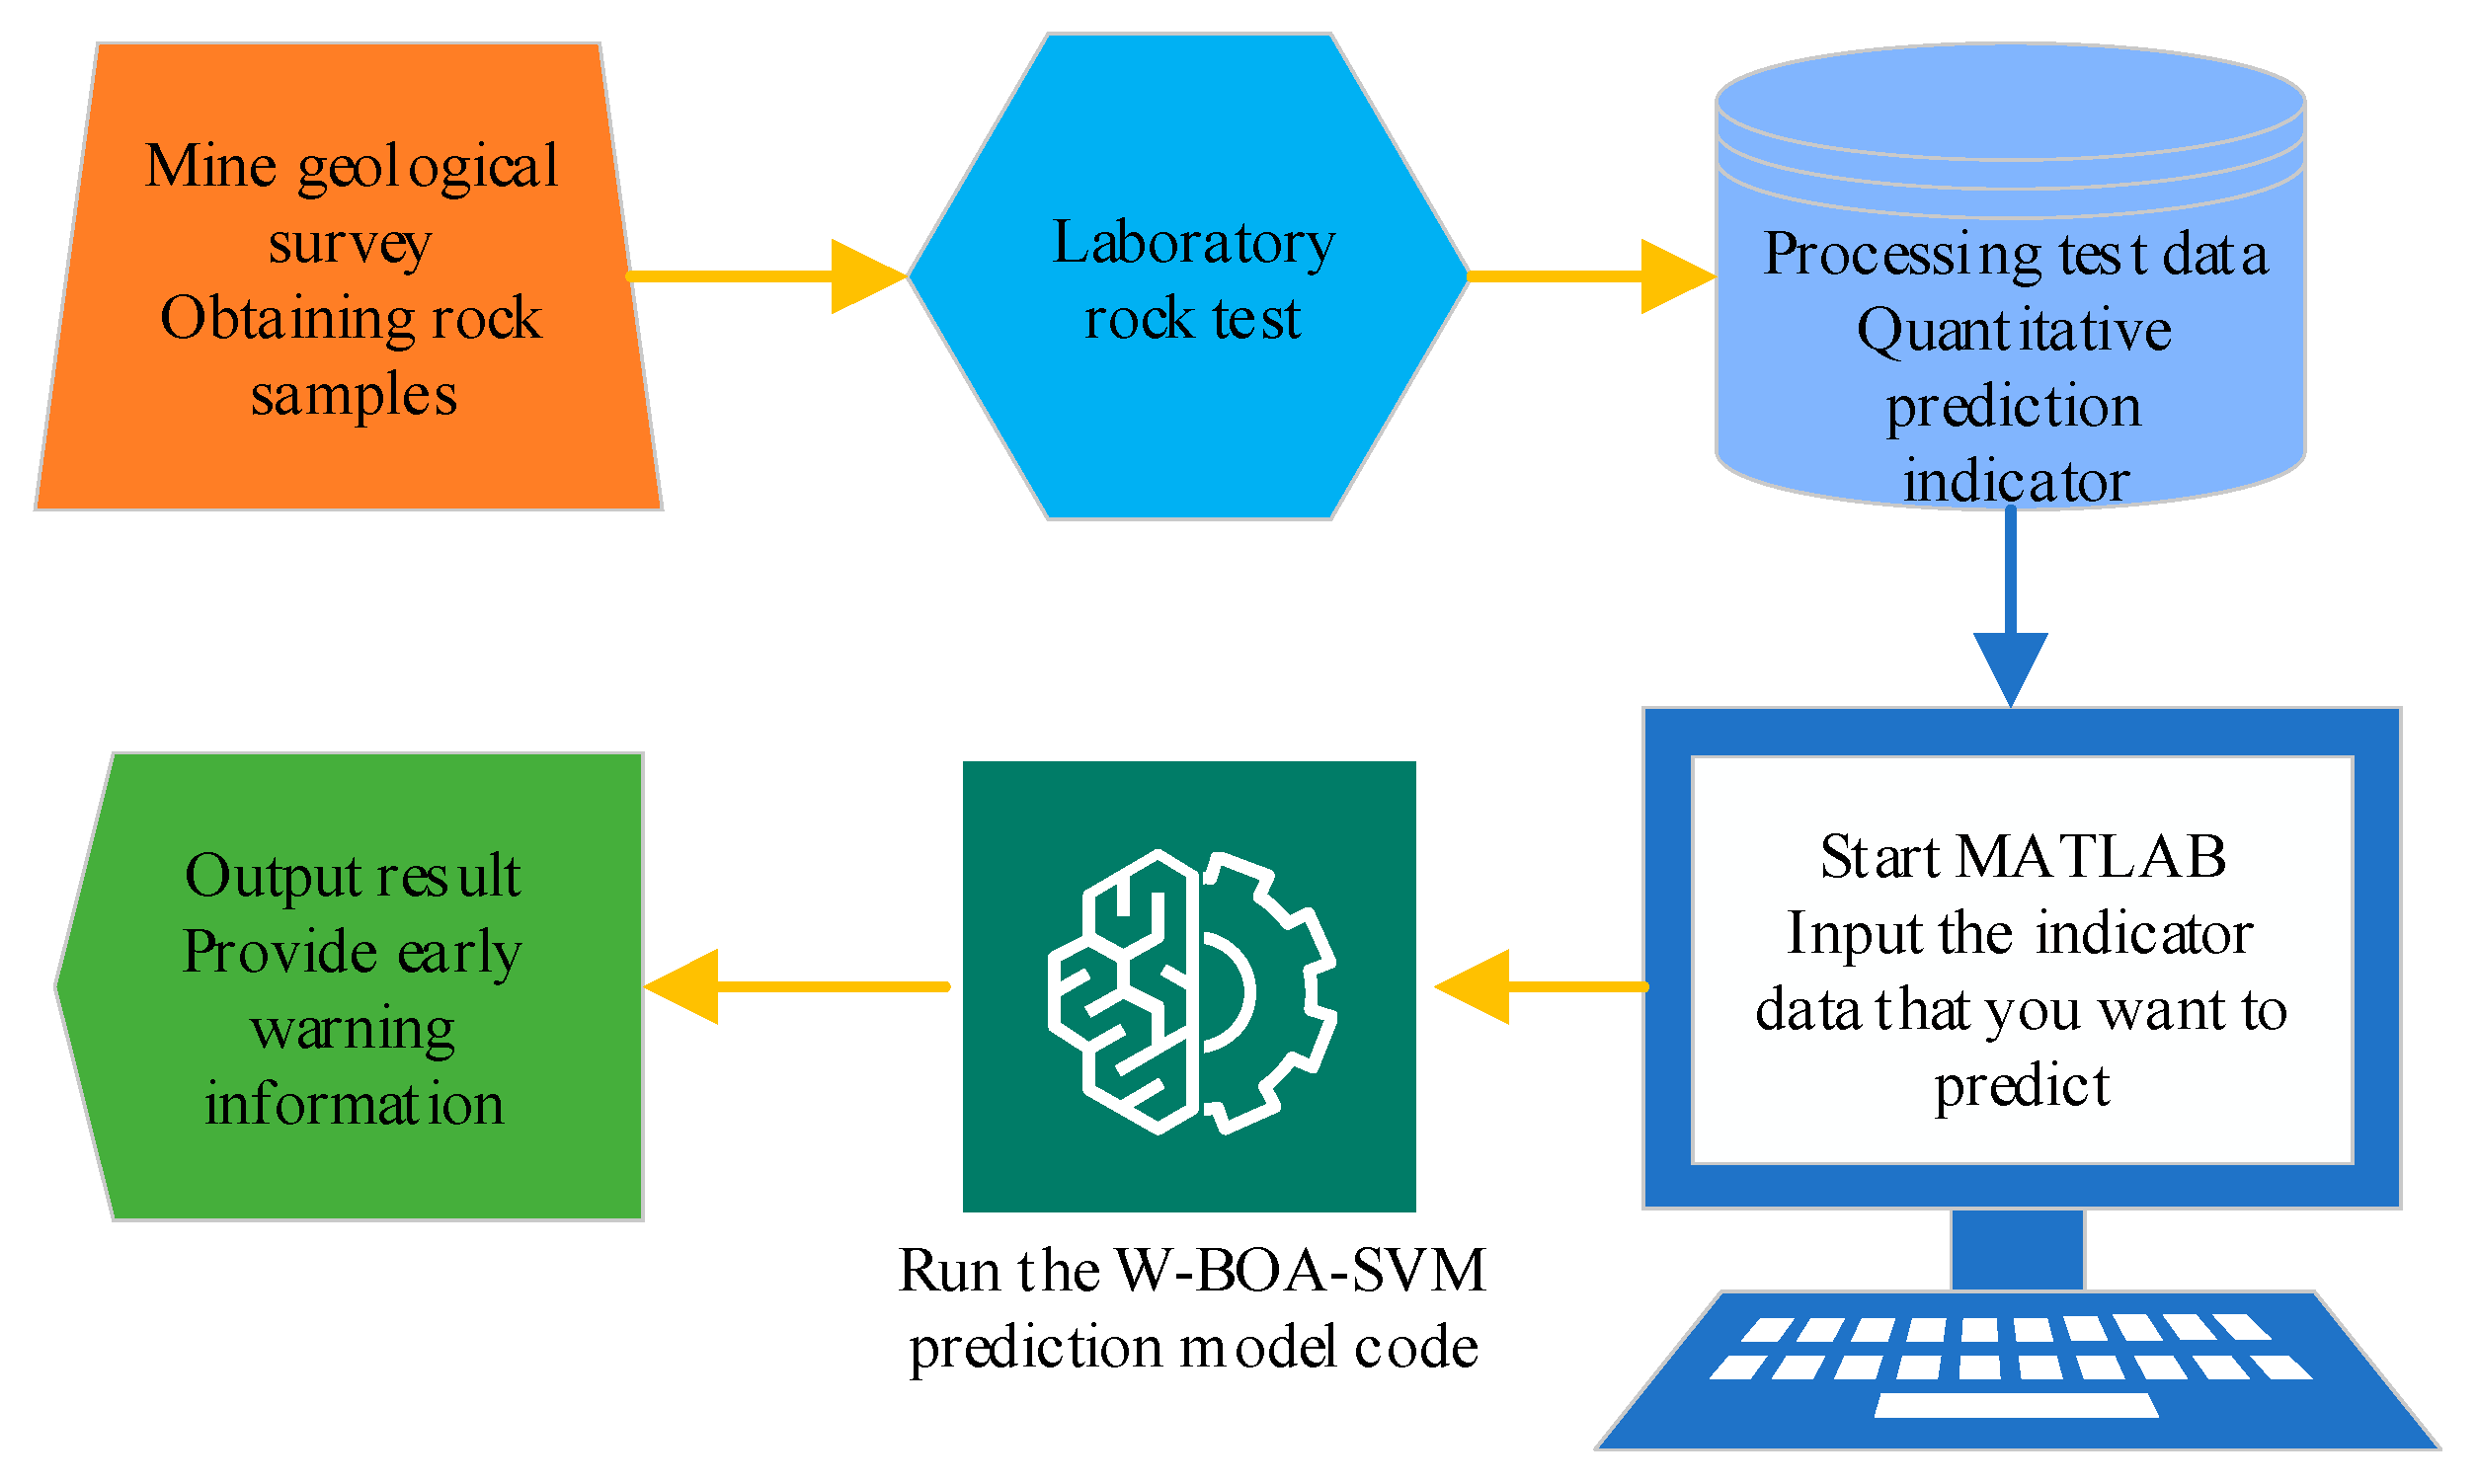
In practical engineering, the specific application process of the W-BOA-SVM model constructed in this paper is shown in Figure 9. Based on the model, the above 15 groups of rock burst case data are predicted. During the experiment, the prediction accuracy of the W-BOA-SVM model with Gaussian function as the kernel function reached the maximum of the experimental results. It can be seen that the choice of the Gaussian function as the kernel function has certain advantages in the W-BOA-SVM model, so the Gaussian function is selected as the kernel function of the model in this test. The optimization process is shown in Figure 10.
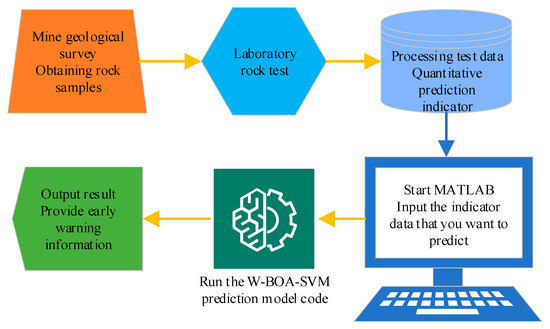
Figure 9.
Model application process.
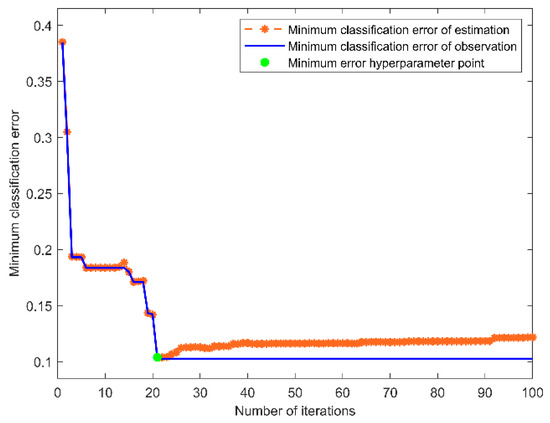
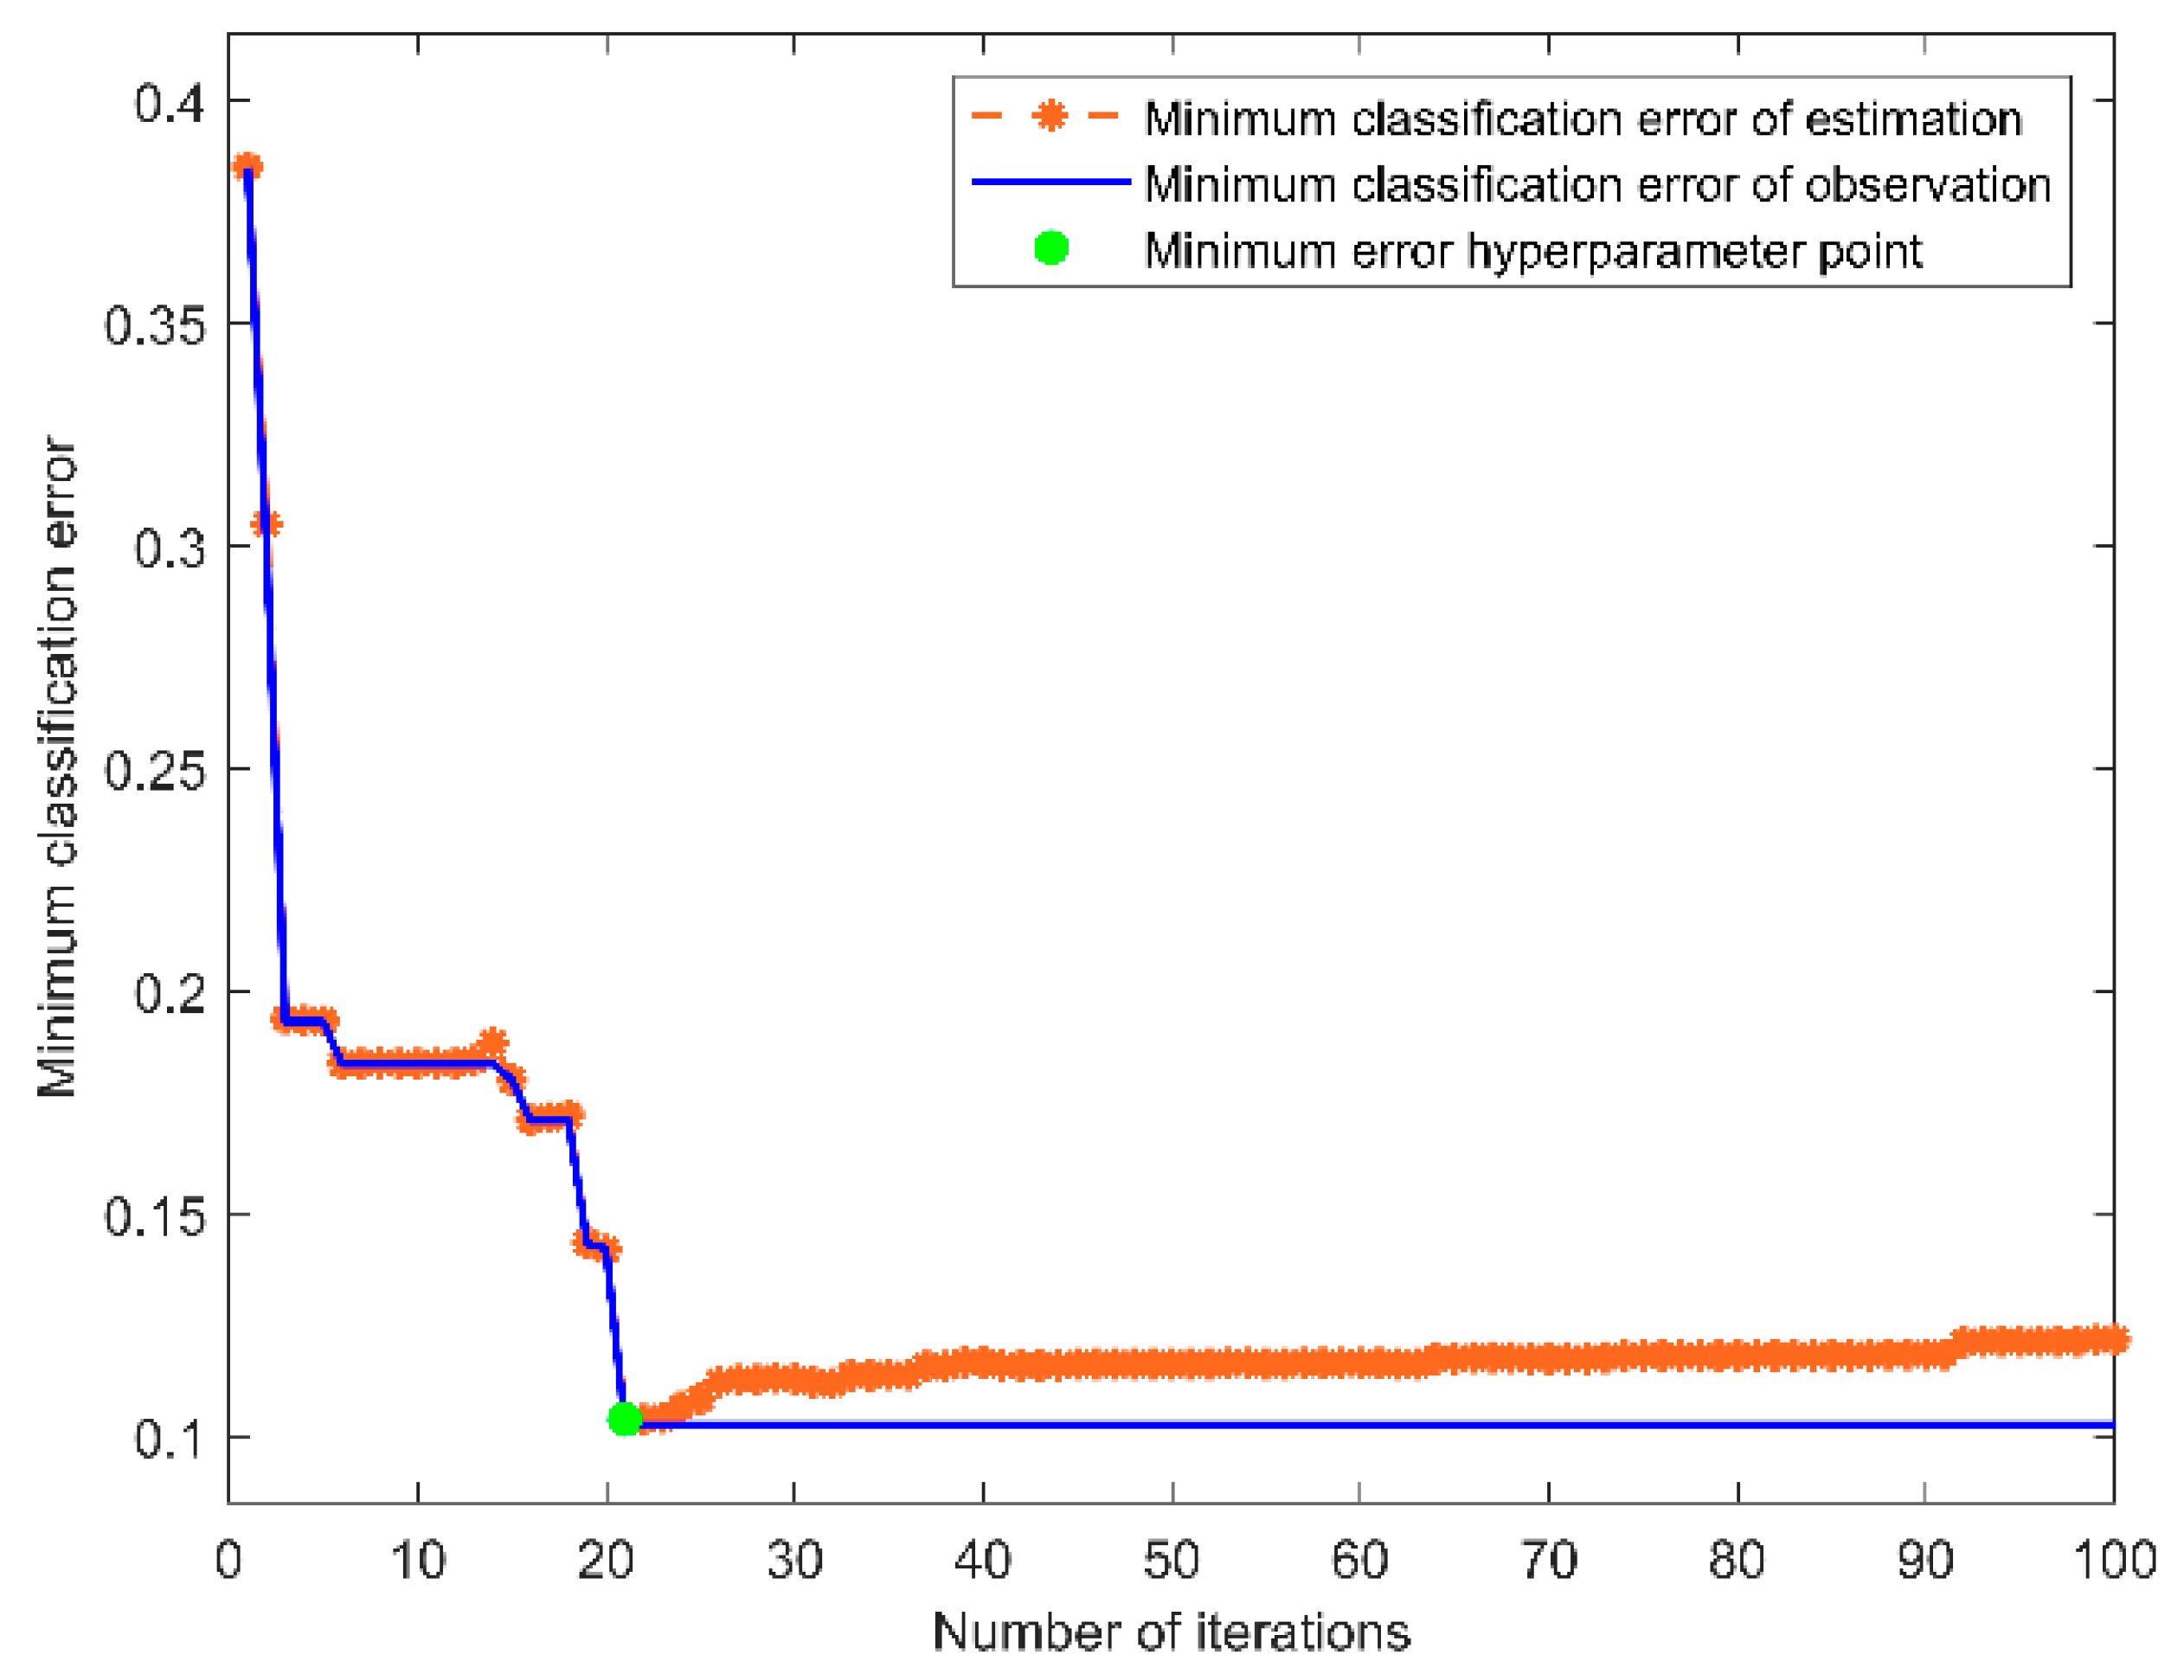
Figure 10.
Hyperparameter optimization process.
As shown in Figure 10, this training reached convergence at the 21st iteration calculation, and the minimum classification error value was 0.10252. The optimal hyperparameter combination is found: the is 76.26 and the is 7.12.
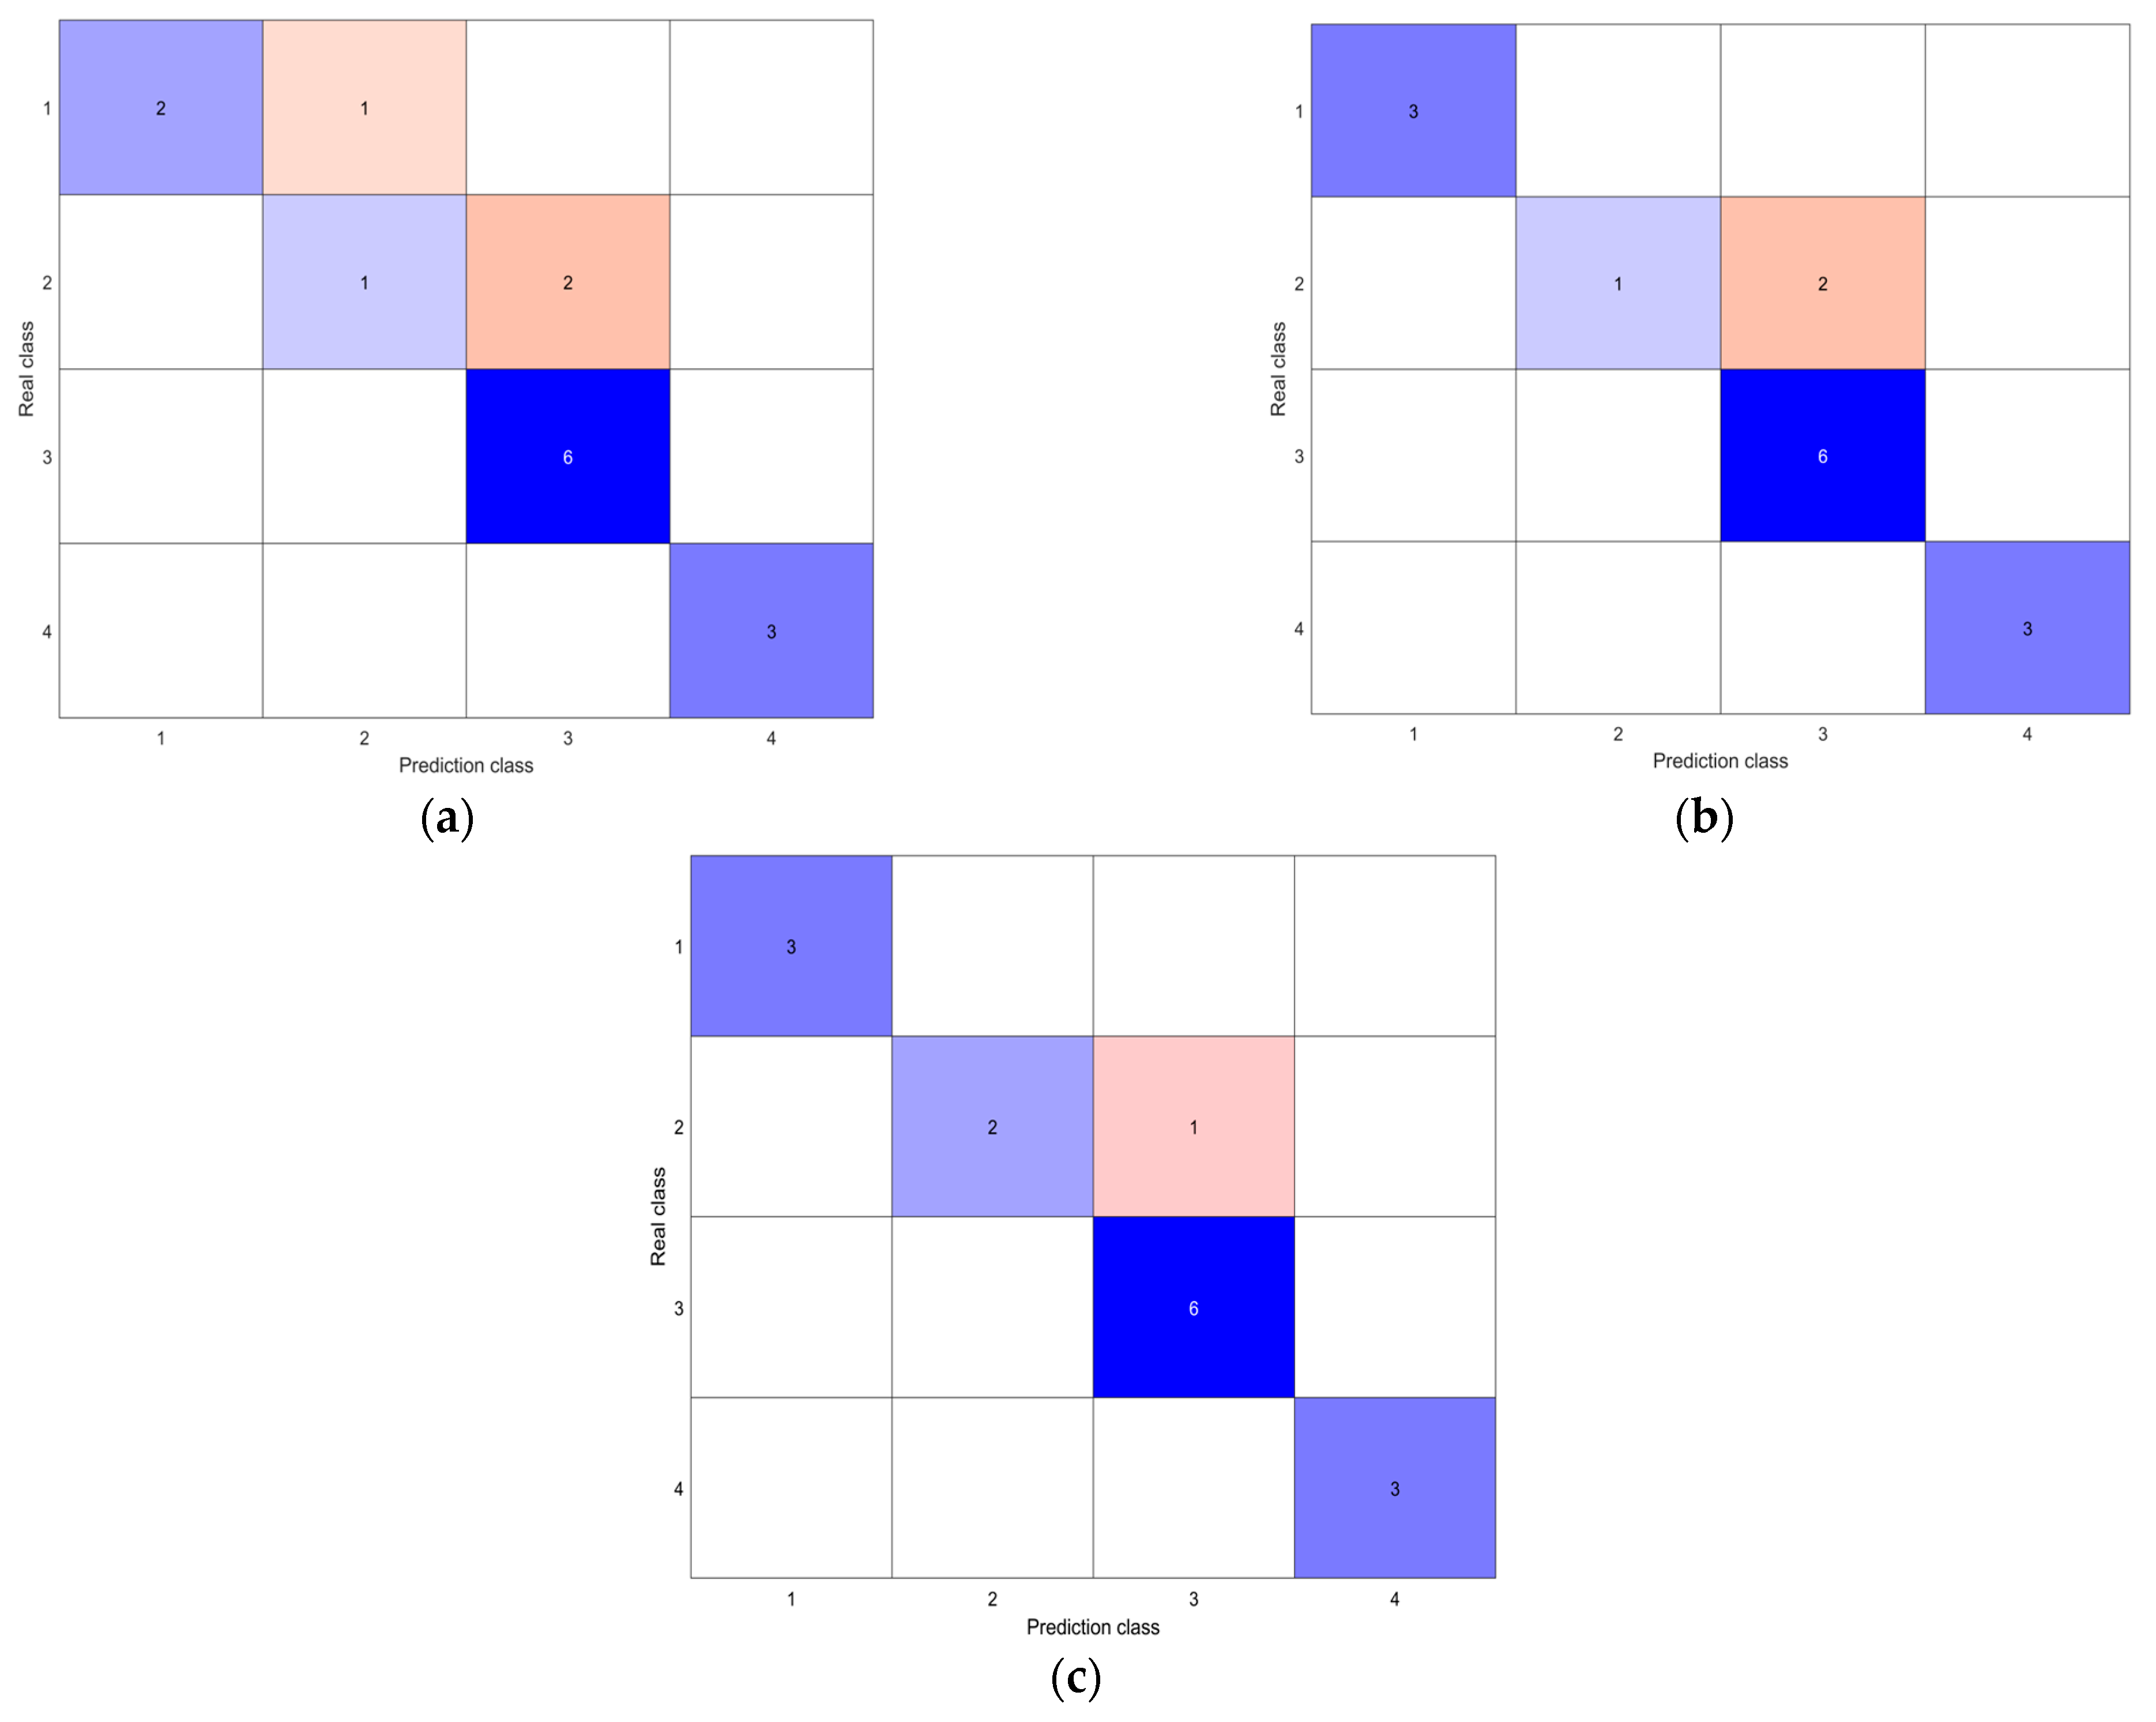
At the same time, the three test results of the SVM model, W-SVM model and W-BOA-SVM model were compared, and the specific test results are shown in Figure 11.

Figure 11.
Test results. (a) result of SVM model. (b) result of W-SVM model. (c) result of W-BOA-SVM model.
The analysis of Figure 11 shows that the average prediction correct rate of the ordinary SVM model is 75.00%, the average forecast correct rate is 81.25%, and the prediction accuracy is 80.00%. The average prediction correct rate of the W-SVM model is 83.25%, the average prediction accuracy is 93.75%, and the prediction accuracy is 86.68%. The average prediction correct rate of the W-BOA-SVM model is 91.66%, the average forecasted correct rate is 96.43%, and the prediction accuracy is 93.33%. Comparing the above three models, it can be seen that the W-BOA-SVM model has the best test effect. The model incorrectly predicted a grade-2 rock burst to a grade-3 rock burst, that is, it wrongly forecasted a grade-3 rock burst, but it should actually be a grade-2 rock burst, and overestimated the intensity level of the rock burst. In the forecasted results, if the rock burst intensity level is overestimated, it may increase the safety cost and waste the resources of the construction project, but it will not cause serious disasters. If the rock burst intensity level is underestimated, the prepared disaster prevention and reduction conditions are not enough to cope with the actual disaster level, resulting in high-risk engineering disaster accidents, bringing very serious consequences. Therefore, the W-BOA-SVM model constructed in this paper can effectively predict the intensity level of rock burst, provide early-warning information for the occurrence and intensity of rock burst, and provide reference for rock burst disaster prevention in deep underground engineering construction.
6. Discussion
6.1. Superiority
- (1)
- There are few prediction indicators, which is convenient for collection and sorting of sample data. In addition, this can reduce the workload caused by quantitative indicators in the application process of the model.
- (2)
- The T-SNE algorithm is used to reduce the dimension of sample data, which can more intuitively and clearly show the distribution of samples.
- (3)
- The four weighting principles are coupled for the first time, and a new comprehensive weighting method is proposed. The prediction accuracy is improved effectively by weighting the prediction indicators.
- (4)
- Two machine learning algorithms of BOA and SVM were fused; and a W-BOA-SVM rock burst intensity-grade prediction model was constructed for the first time on the basis of data pre-processing, and good results were achieved.
6.2. Limitation
- (1)
- The occurrence of rock burst is affected by many factors; the actual situation of each project is different, and if there are no similar characteristics, it will be difficult to compare and analyze the two projects, which is a difficulty in the study of rock burst.
- (2)
- The number of project case data collected in this paper is relatively small, and the sample data set is small, so this study is a preliminary study. At the same time, the rock burst prediction indicator system will change with the different rock behavior characteristics of underground engineering in the future, and the prediction model should be further improved. The essence of rock burst is artificially induced micro-seismic activity. For more complex seismic events, on-site monitoring is needed to obtain more information for analysis. In addition, in reality, the background and situation of each project are different, so the model may not be suitable for some underground projects. In view of this, this study is still a partial study.
- (3)
- The geological structure of the mine is complex and may contain many types of rock mass, and the brittleness coefficient of rock mass of different rock types is different. The brittleness coefficient will change with the change in mine geological structure, and also with the deterioration of rock mass. Therefore, when predicting the rock burst of the same mine, if the geological structure of the mine is simple, it can be assumed that the rock mass is uniform. If the geological structure of the mine is complex, it is necessary to quantify the rock burst prediction index according to different geological structures. If the degradation of rock mass is serious, it is necessary to reduce the strength of rock mass. Generally speaking, rock burst rocks are relatively uniform, and hard, have good structural density, with few cracks, and have good brittleness and elasticity. The prediction model in this paper assumes that the rock mass is uniform. Rock burst is more likely to occur in complex geological structures, such as folds, bends, fractures and abrupt changes in strata. In view of this, the model may not be suitable for underground projects with complex geological structures.
6.3. Outlook
- (1)
- Visualization of the running code of the model can facilitate some engineers who are unfamiliar with programming to use the rock burst prediction model. This will be the focus of the author’s future work.
- (2)
- In the future, it is necessary to establish rock burst sample databases according to different engineering backgrounds such as mines, hydropower stations and tunnels. This will make the sample data more characteristic and improve the applicability of the prediction model to similar projects. At the same time, it is necessary to expand the sample database and mine more data information in the future. Based on big data samples and intelligent algorithms, the future trend will be to solve the problem of rock burst prediction.
- (3)
- Against the background of continuous accumulation of engineering data and increasingly mature machine learning algorithms, machine learning algorithms will become one of the effective ways of solving the problem of rock burst intensity-grade prediction.
7. Conclusions
- (1)
- Combined with the research results of other scholars, this paper selects three main factors, σθ/σc, σc/σt and Wet to construct the prediction indicator system of rock burst intensity grade; according to the main performance and characteristics of rock burst, the intensity of rock burst is divided into I~IV levels. A total of 120 groups of rock burst data at home and abroad were collected as learning samples, and the T-SNE algorithm was used to reduce the dimension of the sample data, which showed the distribution of samples intuitively and clearly.
- (2)
- In this paper, the Delphi method and improved analytic hierarchy process are used to determine the subjective weight of the prediction indicator, the entropy weight method and CRITIC method are used to determine the objective weight of the prediction indicator, and the method of harmonic average coefficient is used to integrate the subjective weight and objective weight to obtain a more scientific and reliable indicator weight. At the same time, BOA is used to determine the best hyperparameters of SVM to improve the prediction performance of SVM. Finally, SVM improved by BOA is used to train and learn the weighted indicator data, and the W-BOA-SVM rock burst intensity-grade prediction model proposed in this paper is obtained. At the same time, the model is compared with other models to show the superiority of this model.
- (3)
- The W-BOA-SVM model constructed in this paper was used to predict the rock burst case data pairs of the two actual projects of the Maluping mine and Daxiangling tunnel; there was only one error in the prediction results, and the consequences were within the controllable range. It shows that the model has good validity and engineering applicability, and provides a reference for rock burst disaster prevention.
Author Contributions
Conceptualization, G.B.; Methodology, G.B.; Software, G.B. and H.S.; Data curation, G.B.; Writing—original draft, G.B.; Visualization, G.B.; Supervision, K.H.; Project administration, K.H.; Funding acquisition, K.H. All authors have read and agreed to the published version of the manuscript.
Funding
This research was funded by the project of the Science and Technology Department of Yunnan Province [202101AT070094].
Institutional Review Board Statement
Not applicable.
Informed Consent Statement
Not applicable.
Data Availability Statement
Not applicable.
Conflicts of Interest
The authors declare no conflict of interest.
Abbreviations
| BOA | Bayesian optimization algorithm |
| SVM | Support vector machine |
| BOA-SVM | Bayesian optimization algorithm–improve- support vector machine model |
| W-BOA-SVM | BOA-SVM model after indicator comprehensive weighting |
| T-SNE | t-distributed stochastic neighbor embedding |
| H | Underground depth |
| Kv | The rock integrity factor |
| σθ | Maximum tangential stress of rock |
| σc | Maximum uniaxial compressive strength of rock |
| σt | Maximum uniaxial tensile strength of rock |
| σθ/σc | The rock stress coefficient |
| σc/σt | The rock brittleness coefficient |
| Wet | The rock elastic-energy index |
| IAHP | Improved analytic hierarchy process |
| CRITIC | Criteria Importance Though Intercriteria Correlation |
References
- Zhu, B.; Fan, J.; Shi, X.; Liu, P.; Guo, J. Study on Rockburst Proneness of Deep Tunnel Under Different Geo-Stress Conditions Based on DEM. Geotech. Geol. Eng. 2022, 40, 1373–1386. [Google Scholar] [CrossRef]
- Sun, F.; Wu, W.; Wang, Z.; Liu, Z.; Shao, Z. Research on rockburst proneness evaluation method of deep underground engineering based on multi-parameter criterion. Electron. J. Struct. Eng. 2023, 23, 64–80. [Google Scholar] [CrossRef]
- Liu, R.; Ye, Y.; Hu, N.; Chen, H.; Wang, X. Classified prediction model of rockburst using rough sets-normal cloud. Neural Comput. Appl. 2019, 31, 8185–8193. [Google Scholar] [CrossRef]
- Yin, X.; Lui, Q.; Ding, Z.; Zhang, Q.; Wang, X.; Huang, X. Toward intelligent early-warning for rockburst in underground engineering: An improved multi-criteria group decision-making approach based on fuzzy theory. J. Basic Sci. Eng. 2022, 30, 374–395. [Google Scholar]
- Lou, Y.; Li, K. A rockburst grade evaluation method based on principal component analysis and the catastrophe progression method. Front. Earth Sci. 2023, 11, 1163187. [Google Scholar] [CrossRef]
- Xue, Y.; Li, Z.; Li, S.; Qiu, D.; Tao, Y.; Wang, L.; Yang, W.; Zhang, K. Prediction of rock burst in underground caverns based on rough set and extensible comprehensive evaluation. Bull. Eng. Geol. Environ. 2019, 78, 417–429. [Google Scholar] [CrossRef]
- Guo, J.; Zhang, W.; Zhao, Y. A multidimensional cloud model for rockburst prediction. Chin. J. Rock Mech. Eng. 2018, 37, 1199–1206. [Google Scholar]
- Zhang, M. Prediction of rockburst hazard based on particle swarm algorithm and neural network. Neural Comput. Appl. 2022, 34, 2649–2659. [Google Scholar] [CrossRef]
- Zhou, J.; Yang, P.; Peng, P.; Khandelwal, M.; Qiu, Y. Performance Evaluation of Rockburst Prediction Based on PSO-SVM, HHO-SVM, and MFO-SVM Hybrid Models. Min. Metall. Explor. 2023, 40, 617–635. [Google Scholar] [CrossRef]
- Wen, T.; Chen, Y. Prediction model of rockburst intensity grade based on Hellinger distance and AHDPSO-ELM. China Saf. Sci. J. 2022, 32, 38–46. [Google Scholar]
- Liang, W.; Sari, A.; Zhao, G.; McKinnon, S.D.; Wu, H. Short-term rockburst risk prediction using ensemble learning methods. Nat. Hazards 2020, 104, 1923–1946. [Google Scholar] [CrossRef]
- Kadkhodaei, M.H.; Ghasemi, E. Development of a Semi-quantitative Framework to Assess Rockburst Risk Using Risk Matrix and Logistic Model Tree. Geotech. Geol. Eng. 2022, 40, 3669–3685. [Google Scholar] [CrossRef]
- Ullah, B.; Kamran, M.; Rui, Y. Predictive Modeling of Short-Term Rockburst for the Stability of Subsurface Structures Using Machine Learning Approaches: T-SNE, K-Means Clustering and XGBoost. Mathematics 2022, 10, 449. [Google Scholar] [CrossRef]
- Ge, Q.; Feng, X. Classification and prediction of rockburst using AdaBoost combination learning method. Rock Soil Mech. 2008, 29, 943–948. [Google Scholar]
- Wu, X.; Wang, S.; Zhang, Y. Survey on theory and application of k-Nearest-Neighbors algorithm. Comput. Eng. Appl. 2017, 53, 1–7. [Google Scholar]
- Xie, X.; Li, D.; Kong, L.; Ye, Y.; Gao, S. Rockburst propensity prediction model based on CRITIC-XGB algorithm. Chin. J. Rock Mech. Eng. 2020, 39, 1975–1982. [Google Scholar]
- Wen, T.; Chen, X. Forecast research on the rock burst liability based on the comprehensive evaluation H-PSO-SVM model. J. Saf. Environ. 2018, 18, 440–445. [Google Scholar]
- Yang, L.; Wei, J. Prediction of rockburst intensity grade based on SVM and adaptive boosting algorithm. Earth Sci. 2023, 48, 2011–2023. [Google Scholar]
- Wang, H.; Lu, Z.; Qiu, J.; Liu, W.; Zhang, L. Prediction of rockburst by improved particle swam optimization based support vector machine. Chin. J. Undergr. Space Eng. 2017, 13, 364–369. [Google Scholar]
- Gao, L.; Liu, Z.K.; Zhang, H.Y. Prediction of Rockburst Classification of Railway Tunnel Based on Hybrid PSO-RBF Neural Network. J. Railw. Sci. Eng. 2021, 18, 450–458. [Google Scholar]
- Liu, D.; Dai, Q.; Zuo, J.; Shang, Q.; Chen, G.; Guo, Y. Research on rockburst grade prediction based on stacking integrated algorithm. Chin. J. Rock Mech. Eng. 2022, 41 (Suppl. S1), 2915–2926. [Google Scholar]
- Li, M.L.; Li, K.G.; Qin, Q.C.; Wu, S.; Liu, Y.; Liu, B. Discussion and Selection of Machine Learning Algorithm Model for Rockburst Intensity Grade Prediction. Chin. J. Rock Mech. Eng. 2021, 40 (Suppl. S1), 2806–2816. [Google Scholar]
- Wu, S.C.; Zhang, C.X.; Cheng, Z.Q. Prediction of intensity classify-cation of rockburst based on PCA-PNN principle. J. China Coal Soc. 2019, 44, 2767–2776. [Google Scholar]
- Zhou, J.; Li, X.; Shi, X. Long-term prediction model of rockburst in underground openings using heuristic algorithms and support vector machines. Saf. Sci. 2012, 50, 629–644. [Google Scholar] [CrossRef]
- Xu, L.S.; Wang, L.S.; Li, Y.L. Study on mechanism and judgement of rockbursts. Rock Soil Mech. 2002, 23, 300–303. [Google Scholar]
- Li, T.; Meng, L.; Wang, L. High Geostress Tunnel Stability and Rockburst and Large Deformation Disaster Prevention; Science Press: Beijing, China, 2016. [Google Scholar]
- Liu, X.; Yang, W.; Zhang, X. Rockburst prediction of Multi-dimensional cloud model based on improved hierarchical method and CRITIC method. J. Hunan Univ. (Nat. Sci. Ed.) 2021, 48, 118–124. [Google Scholar]
- Zhou, K.P.; Lei, T.; Hu, J.H. RS-TOPSIS model of rockburst prediction in deep metal mines and its application. Chin. J. Rock Mech. Eng. 2013, 32 (Suppl. S2), 3705–3711. [Google Scholar]
- Guo, D.; Chen, H.; Tang, L.; Chen, Z.; Samui, P. Assessment of rockburst risk using multivariate adaptive regression splines and deep forest model. ACTA Geotech. 2021, 17, 1183–1205. [Google Scholar] [CrossRef]
- Cai, T.T.; Ma, R. Theoretical Foundations of t-SNE for Visualizing High-Dimensional Clustered Data. J. Mach. Learn. Res. 2022, 23, 1–54. [Google Scholar]
- Zhou, Y.; Wang, W.; Lu, X.; Wang, K. Combination weighting prediction model and application of rockburst disaster based on game theory. China Saf. Sci. J. 2022, 32, 105–112. [Google Scholar]
- Li, S.; Wang, S.; Zhu, J. Prediction of rock burst tendency based on weighted fusion and improved cloud model. Chin. J. Geotech. Eng. 2018, 40, 1075–1083. [Google Scholar]
- Feng, C.; Li Ji Li, S. Application of the analytical hierarchy process method to the safety science research in Chinese. J. Saf. Environ. 2018, 18, 2126–2130. [Google Scholar]
- Tian, R.; Meng, H.; Chen, S.; Wang, C.; Shi, L. Prediction model of rockburst intensity classification based on RF-AHP-Cloud model. China Saf. Sci. J. 2020, 30, 166–172. [Google Scholar]
- Zhou, K.P.; Yun, L.I.; Deng, H.W.; Li, J.L.; Liu, C.J. Prediction of rock burst classification using cloud model with entropy weight. Trans. Nonferrous Met. Soc. China 2016, 26, 1995–2002. [Google Scholar] [CrossRef]
- Li, S.; Kuang, Z.; Xiao, Y.; Qiao, Z.; Yang, W. Rockburst tendency prediction based on an integrating method of combination weighting and matter-element extension theory: A case study in the Bayu Tunnel of the Sichuan-Tibet Railway. Eng. Geol. 2022, 308, 106796. [Google Scholar] [CrossRef]
- Li, M.; Li, K.; Qin, Q.; Yue, R.; Shi, J. Research and Application of an Intelligent Prediction of Rock Bursts Based on a Bayes-Optimized Convolutional Neural Network. Int. J. Geomech. 2023, 23, 04023042. [Google Scholar] [CrossRef]
- Yan, S.; Zhang, Y.; Liu, X.; Liu, R. Rock Burst Intensity Classification Prediction Model Based on a Bayesian Hyperparameter Optimization Support Vector Machine. Mathematics 2022, 10, 3276. [Google Scholar] [CrossRef]
- Li, N.; Wang, L.G.; Jia, M.T. Rockburst prediction based on rough set theory and support vector machine. J. Cent. South Univ. (Sci. Technol.) 2017, 48, 1268–1275. [Google Scholar]
- Yang, X. Improved gray wolf algorithm to optimize support vector machine for network traffic prediction. J. Electron. Meas. Instrum. 2021, 35, 211–217. [Google Scholar]
- Wang, J.; Li, X.; Yang, J. A weighted Mahalanob is distance discriminant analysis for predicting rock-burst in deep hard rocks test results. J. Min. Saf. Eng. 2011, 28, 395–400. [Google Scholar]
- Afraei, S.; Shahriar, K.; Madani, S.H. Developing intelligent classification models for rock burst prediction after recognizing significant predictor variables, Section 1: Literature review and data preprocessing procedure. Tunn. Undergr. Space Technol. 2019, 83, 324–353. [Google Scholar] [CrossRef]


Disclaimer/Publisher’s Note: The statements, opinions and data contained in all publications are solely those of the individual author(s) and contributor(s) and not of MDPI and/or the editor(s). MDPI and/or the editor(s) disclaim responsibility for any injury to people or property resulting from any ideas, methods, instructions or products referred to in the content. |
© 2023 by the authors. Licensee MDPI, Basel, Switzerland. This article is an open access article distributed under the terms and conditions of the Creative Commons Attribution (CC BY) license (https://creativecommons.org/licenses/by/4.0/).