Article

Optimal Scale and Scenario Simulation Analysis of Landscape Ecological Risk Assessment in the Shiyang River Basin

College of Geography and Environmental Science, Northwest Normal University, Lanzhou 730070, China
*
Author to whom correspondence should be addressed.
Sustainability 2023, 15(22), 15883; https://doi.org/10.3390/su152215883
Submission received: 17 October 2023 / Revised: 8 November 2023 / Accepted: 10 November 2023 / Published: 13 November 2023

Abstract

:
The evaluation of landscape ecological risk (LER) in a river basin holds significant importance for the overall ecological environmental protection of the basin and subsequent sustainable development. The Shiyang River basin, a typical arid inland river basin, was selected as the research object, and the optimal scale of LER research was explored. Multi-period land use data was used to build an LER assessment model and reveal the temporal and spatial changes of LER in the Shiyang River basin. The PLUS model was used to simulate the spatial distribution characteristics and change trends of LER under different scenarios in 2030. The results show that the LER in the Shiyang River Basin has obvious scale dependence, with optimal granularity and magnitude of 60 m and 4.5 km, respectively. LER is dominated by higher risk and high risk categories, with significant spatial differences, showing a trend of low in the southwest and high in the northeast. The LER of the Shiyang River Basin decreased from 2000 to 2020. It is expected that the LER value under different scenarios in 2030 will show a downward trend, and the LER value under the ecological conservation priority scenario will be the lowest. This study can provide a reference for LER assessment in arid inland river basins.

1. Introduction

Rapid socio-economic development and accelerated urbanization have exacerbated global environmental changes; nearly one-third to one-half of the world’s land surface has been changed by human activities [1]. The change in land use can lead to instability in ecosystem structure and function, causing ecological risks [2,3], threatening the harmony of human–land relations and the healthy development of ecosystems [4]. Landscape ecological risk (LER) is the possible adverse consequences of the interaction of landscape patterns and ecological processes under the influence of natural or human factors [5]. An LER assessment can quantify the negative impacts of human activities or natural disasters on the composition, structure, and function of regional ecosystems [6]. With the deepening of LULC change research, land use simulation and LER assessment have gradually become hot issues in research, providing an important theoretical basis for regional risk control and sustainable development of the ecological environment [7,8].
Among the methods of the LER assessment, the most representative ones are the integrated relative risk model (RRM) and landscape loss model. RRM is constructed based on the conceptual model of “risk source-risk receptor-exposure hazard analysis” [9]. However, RRM is only applicable to areas with obvious ecological stress factors [5] and involves many complex variables that are difficult to obtain. The landscape loss model constructs the ecological risk of land use by calculating the product of disturbance degree and vulnerability degree, which can quantitatively describe the landscape structure as well as explain the evolutionary mechanism of LER from the perspective of spatial pattern change. Moreover, it has become an important tool for analyzing and revealing the spatial and temporal characteristics of LER. In landscape ecology, scale refers to magnitude and granularity in space and time, and landscape pattern is the result of various ecological processes at different scales, which is a manifestation of landscape heterogeneity [10,11]. It has been shown that the choice of granularity and magnitude can directly affect the results of LER analysis, a phenomenon also known as the modifiable areal unit problem (MAUP) [12]. The evaluation units of administrative districts and risk grids do not fully consider the spatial heterogeneity and, to a certain extent, the original surface natural geographic connections were cut, which seriously interferes with researchers’ overall grasp and comprehensive analysis of landscape patterns. Thus, the assessment results may not reflect the real spatial heterogeneity of ecological risks [13,14]. Therefore, it is necessary to determine the optimal scale before evaluation in order to reflect regional LER and existing problems accurately and effectively.
Previous researchers have made rich research contributions in LER assessment, LER assessment scale selection, and land use change simulation, but there are still some deficiencies: In LER assessment, the research hotspots are mainly concentrated in regions with developed economies and intense human activities; the research on ecologically fragile and sensitive to global changes, such as agropastoral interleaved areas and desert oases, needs to be strengthened. The selection of the LER research scale is usually determined by the situation of the study area and the personal experience of researchers [15,16,17]. In recent years, LER assessment has begun to pay attention to the scientific selection of evaluation unit scale, but the research on the optimal scale of LER in arid inland river basins is still lacking. In the arid inland river basin, there is little research on the future LER simulation by combining land use simulation and LER analysis. This paper expects to explore the spatial and temporal characteristics of LER in the Shiyang River Basin by determining the optimal scale for LER evaluation of the typical arid inland river basin and simulate LER under different scenarios in the future to provide a reference for risk prevention and evaluation in the study area.

2. Materials and Methods
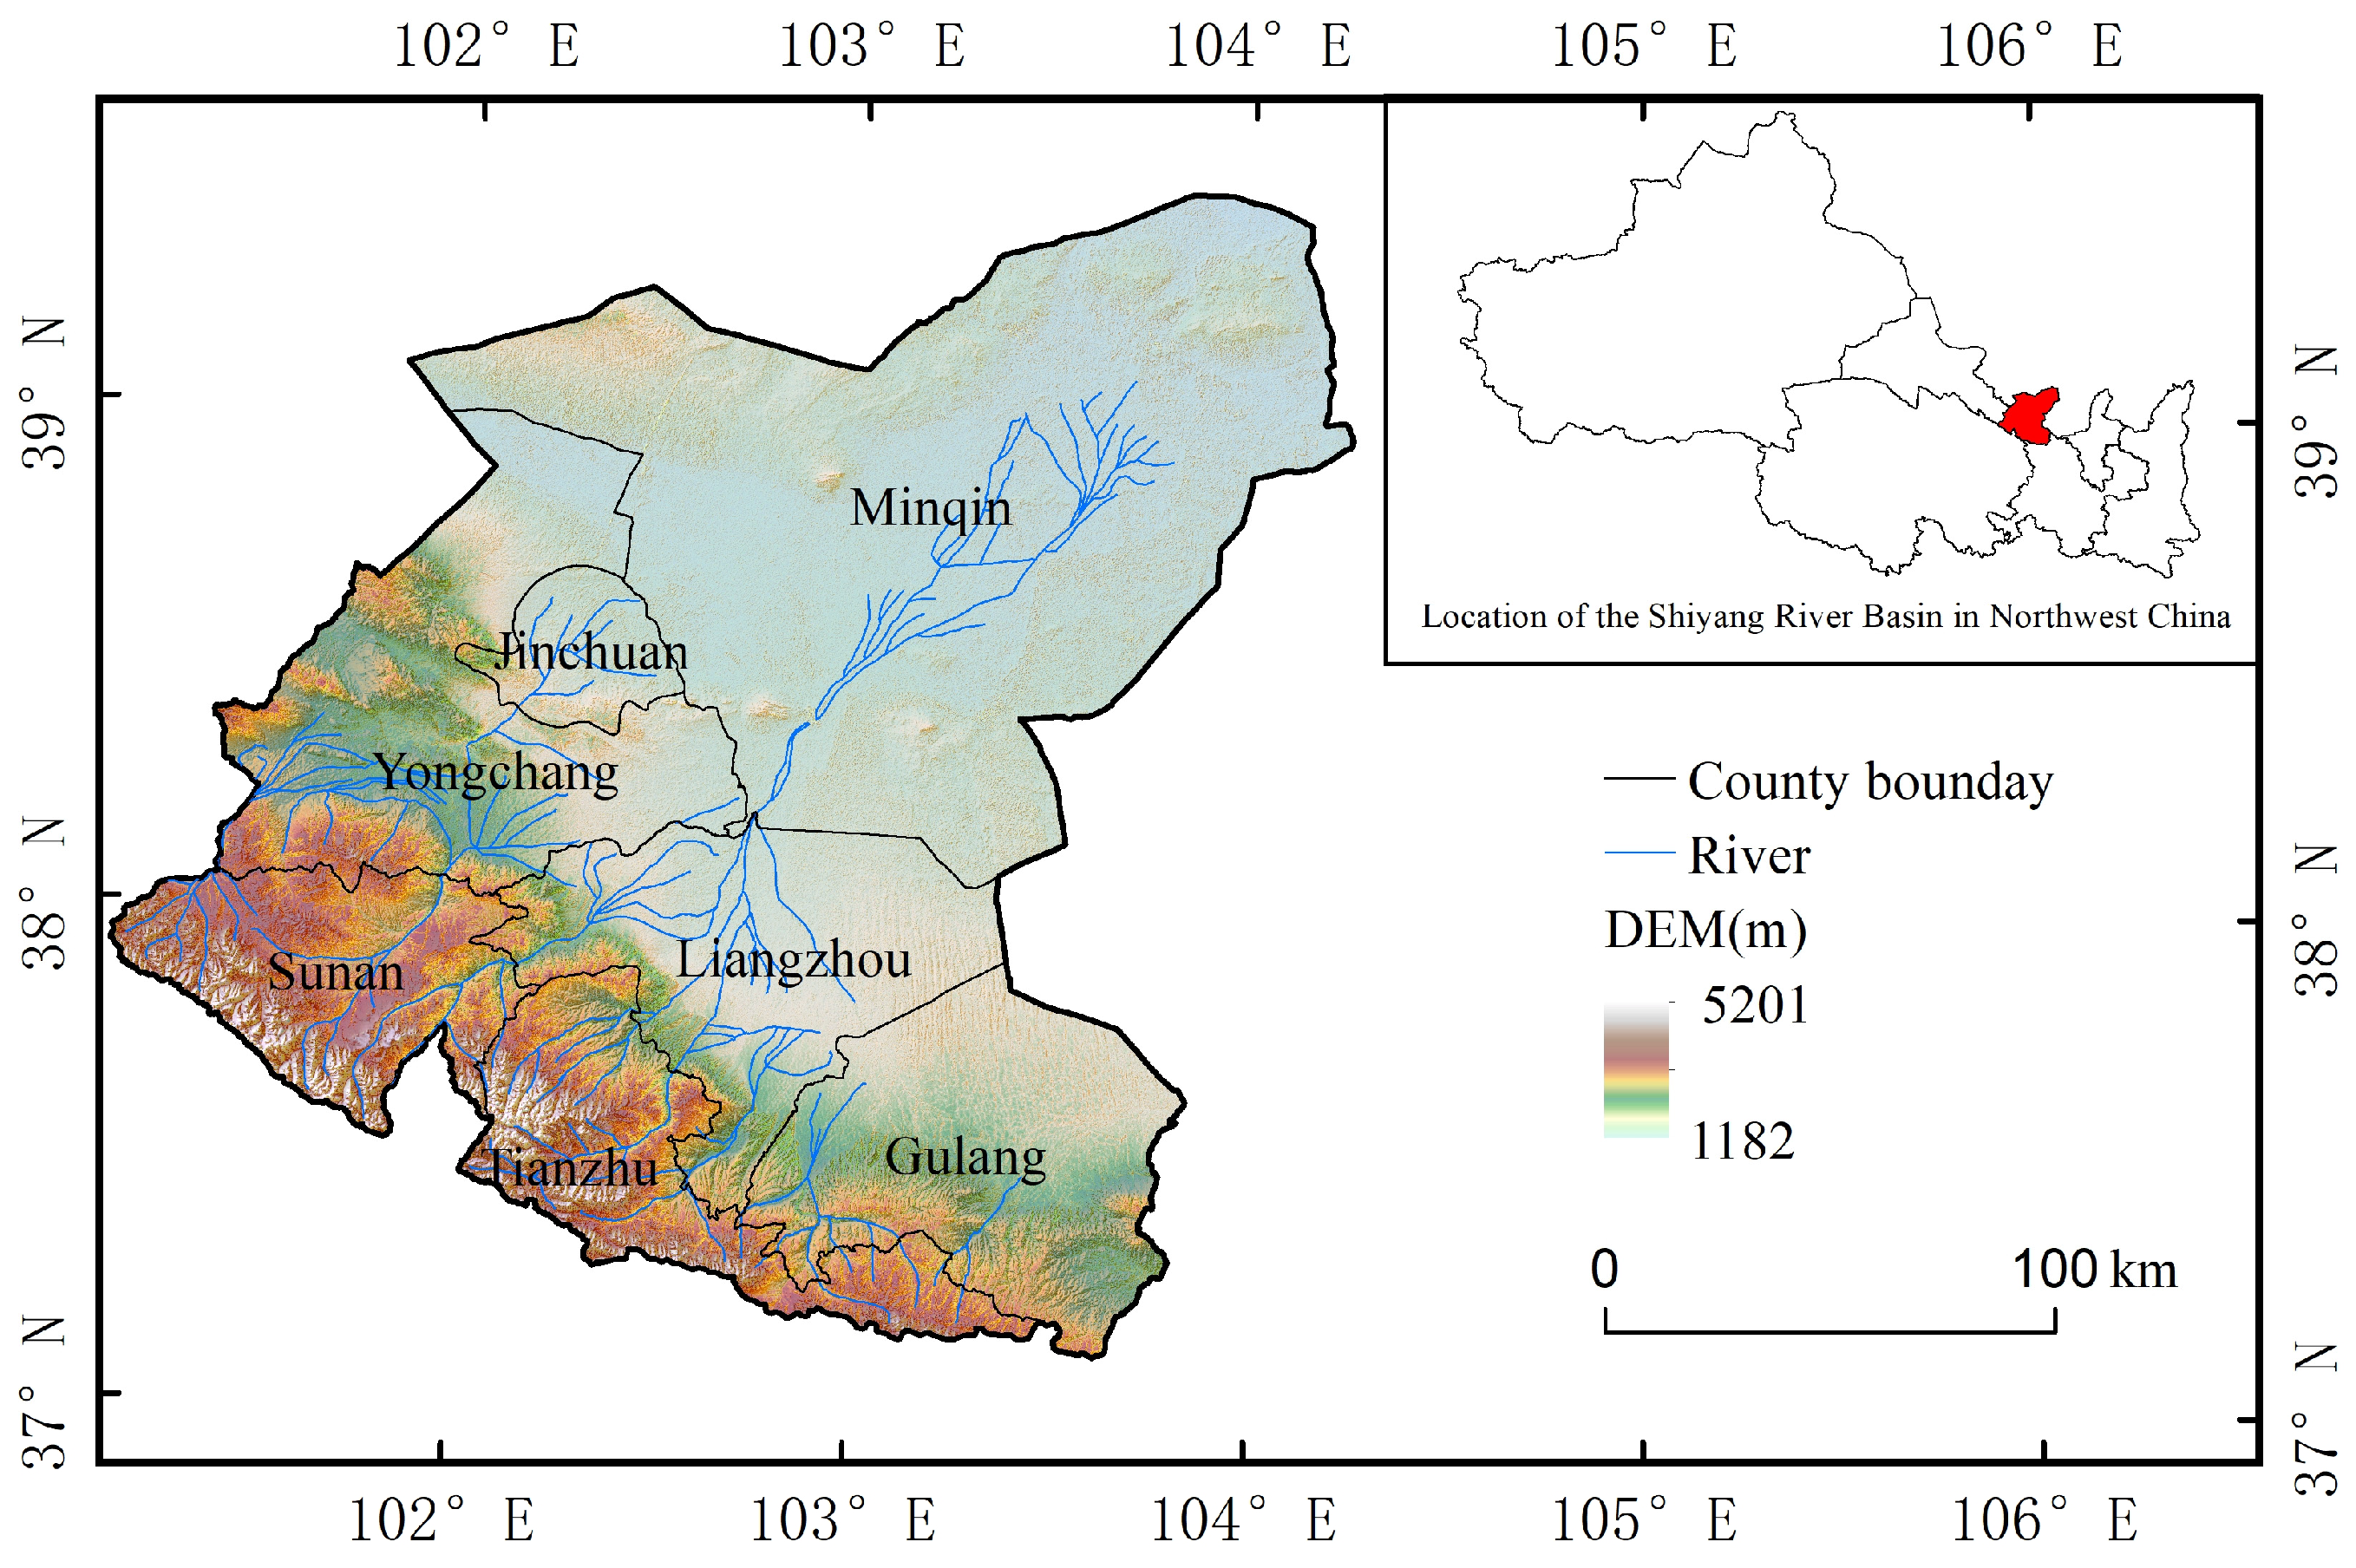
2.1. Study Area

The Shiyang River Basin is located in the eastern part of the Hexi Corridor of Gansu Province, west of the Wushao Mountains, and along the northern foot of the Qilian Mountains, between 101°22′ and 104°16′ E and 36°29′ and 39°27′ N, with a total area of 4.16 × 10⁴ km2 (Figure 1). The climate type of the basin is temperate continental arid climate, and the climate characteristics of the upper, middle, and lower reaches are different: the upper Qilian Mountain area is the main water conservation area of the basin, with annual precipitation of 300–600 mm and annual evaporation of 700–1200 mm; the arid area of the middle plain is the main irrigated agricultural area in the basin, with annual precipitation of 150–300 mm and annual evaporation of 1300–2000 mm. The downstream warm arid region is mainly Minqin oasis and desert, with annual precipitation of less than 150 mm and annual evaporation of 2000–2600 mm [18]. With low precipitation, strong evaporation, and poor natural substrate conditions, the Shiyang River basin is an inland river basin in the arid zone with the most serious ecological and environmental problems.

2.2. Data Sources and Pre-Processing

Land use data were obtained from the Resource and Environmental Science Data Centre of the Chinese Academy of Sciences (https://www.resdc.cn/, accessed on 10 February 2023); meteorological data, including temperature and precipitation data, were derived from the daily value dataset of China’s surface climate data (http://data.cma.cn, accessed on 10 February 2023). A digital elevation model (DEM) was downloaded from the geospatial Data cloud website (http://www.gscloud.cn/, accessed on 10 February 2023), which is mainly used for slope analysis and elevation analysis; road data was downloaded from OSM (https://www.openhistoricalmap.org, accessed on 10 February 2023); the population density data was derived from the WordPop website (https://www.worldpop.org/, accessed on 10 February 2023); soil type data were obtained from HWSD soil database; GDP statistics were obtained from the China Economic and Social Big Data Research Platform (http://data.cnki.net, accessed on 10 February 2023); and the statistical yearbooks of counties and districts in the study area as well as the GDP data were spatialized by the area weighting method based on land use data [19,20]. The data coordinates and projections of this study were unified as WGS 1984 and UTM, and the spatial resolution was unified to 500 m.

2.3. Methods

2.3.1. Optimal Scale Analysis Methods

(1)
Granularity effect analysis
Landscape index granularity effect analysis is a method to select the appropriate particle size range based on the particle size effect curve of the landscape index [21]. Referring to related studies [22,23], this paper is based on the land use data of the Shiyang River Basin in 2020; ten landscape pattern indices were selected, including the number of patches (NP), patch density (PD), maximum patch index (LPI), landscape divisibility index (DIVISION), Shannon diversity index (SHDI), Shannon homogeneity index (SHEI), separateness index (SPLIT), patch cohesion (COHESION), average patch area (AREA_MN), and effective grid size (MESH), and the granularity effect of landscape index was analyzed by the Fragstats software (https://fragstats.org/, accessed on 9 November 2023).
The loss of area in the study area was assessed by the area information loss evaluation model [24], which can quantitatively evaluate the accuracy after scale changes. The formulas are as follows:
Li = (Ai − Abi)/Abi
S i = i = 1 n L i 2 n
where Li is the relative index of area loss (unit: %); Ai represents the area of Class i landscape after scale conversion; and Abi represents the area of Class i landscape before scale transformation. Si stands for regional land area change index and n indicates the number of landscape types.
(2)
The semivariogram function
To ensure the completeness of the patches when conducting the LER assessment, the most commonly used method to determine the scale is to use 2–5 times the average area of the patches in the study area as the research scale [25]. We tried to determine the best scale for ecological risk assessment in the study area within this range. By comprehensively considering the average area of the patches in the study area, five scales, i.e., 3 km, 3.5 km, 4 km, 4.5 km, and 5 km, were tested with semivariogram analysis. The semivariogram is a function of the variance value and distance of data points in geostatistics [24]. Using land use data in 2020 as experimental data, the semivariogram model of the ecological risk index of the study area was examined at different scales, the characteristics of the changes in the related parameters on various scales were analyzed, and the morphological characteristics and complexity of each type of patch were better maintained at a specific amplitude to determine the optimal amplitude. The formulas are as follows:
γ ( h ) = 1 2 N ( h ) i = 1 N ( h ) [ X i X ( i + h ) ] 2
where γ(h) is the semivariogram, N(h) is the total number of sample point pairs when the separation distance is h, and X(i) and X(i + h) are the values of the regionalized variables at the spatial points Xi and Xi + h, respectively.

2.3.2. LER Analysis Methods

(1)
LER assessment model
In this paper, an LER index model was constructed based on the landscape disturbance index, vulnerability index, and loss index by referring to previous studies [26,27]. The formulas are as follows:
LER = i = 1 n ( A k i / A k ) R i
where LER is the landscape ecological risk index, Aki is the area of landscape types I in k risk plots, Ak represents the total area of the kth risk plots, and n is the landscape type; Ri is the landscape loss index, which is constructed by the landscape disturbance index and the landscape vulnerability index, and the specific calculation method is referred to in [27].
(2)
Spatial autocorrelation analysis
Spatial autocorrelation is one of the biggest features of the distribution of landscape patterns, reflecting the distribution characteristics of a variable in space and its degree of dispersion or agglomeration. In this paper, Moran’s I [24] is selected to study the global spatial correlation of the spatial structure of the LER index, and its aggregation in local areas was analyzed by the LISA index [28].

2.3.3. Multi-Scenario Simulation of Future LER

(1)
PLUS model and validation
The PLUS model [29] integrates the Land Expansion Analysis Strategy (LEAS) module with a Cellular Automaton Model (CARS) that incorporates multiple categories of random patch seeds. The principle of LEAS is to extract the expansion components of each land use type and the spatial characteristics of driving factors between two time periods of land use data; then, the random forest algorithm is used to dig the factors of land use expansion and driving force one by one, and obtain the development probability of various types of land use and the contribution of driving factors to various types of land use expansion in this period. The cellular automata (CA) model is based on a multi-type random seed mechanism, combined with random seed generation, transition transfer matrix, and threshold decline mechanism, which can be used to obtain a simulated spatial distribution map of land use under the constraint of development probability.
Based on the existing studies [30,31] and the current situation of the study area, eleven natural and social factors, including elevation, slope, annual precipitation, average annual temperature, soil type, GDP, population density, distance from railways, distance from the first class road, distance from the second class road, and distance from the third class road, were selected as driving factors of land use change in the study area. The LEAS module was used to identify its drivers, the random forest decision tree was set to a default value of 20, the resampling rate was set to 0.01, the eigenvalue of the training RF cannot exceed the number of driving factors, which was set to 11, and the threshold of the running parameter was set to 4, which was run to obtain the suitability atlases of the six land use types. The suitability maps of each land use type and the land use images in 2010 were inputted into the CARS module of the model, and the land use of the Shiyang River Basin in 2020 was simulated based on the Markov chain prediction results in 2020. Comparing the simulation results with the current land use situation in 2020, the overall accuracy was 90.9%, the Kappa coefficient was 0.865, and the FOM value was 0.13, which indicated that the model simulation results had high credibility and were able to satisfy the needs of subsequent simulations.
(2)
Scenario setting
Based on the current land use status in the Shiyang River Basin, combined with the relevant policies and plans of Shiyang River Basin [32] (i.e., Qilian Mountain ecological protection policy, basic farmland protection policy, and land planning policy) (Qilian Mountain Ecological Protection and Comprehensive Management Plan (2012–2020) [33]), and referring to relevant studies [31,32], we have established three scenarios for future land use spatial changes in the Shiyang River Basin: a natural development (ND) scenario, an ecological conservation priority (EC) scenario, and a cultivated land conservation priority (CC) scenario, and three different conversion cost matrices were set (Supplementary Tables S1–S3) to realize the scenario simulation of land use with three different demands.
Under the natural development scenario, the conversion grade of all types of land is as follows: construction land, forest land, cultivated land, water area, grassland, and unused land, and the conversion principle is not allowed to convert high-grade land to low-grade land. Under the ecological conservation priority scenario, land types are ranked based on their ecological benefits as follows: forest land, grassland, cultivated land, water area, and others, and the conversion principle is the same as that of the natural development scenario. Under the cultivated land conservation priority, all land except construction land can be converted into cultivated land.

3. Results

3.1. Optimal Scale Analysis

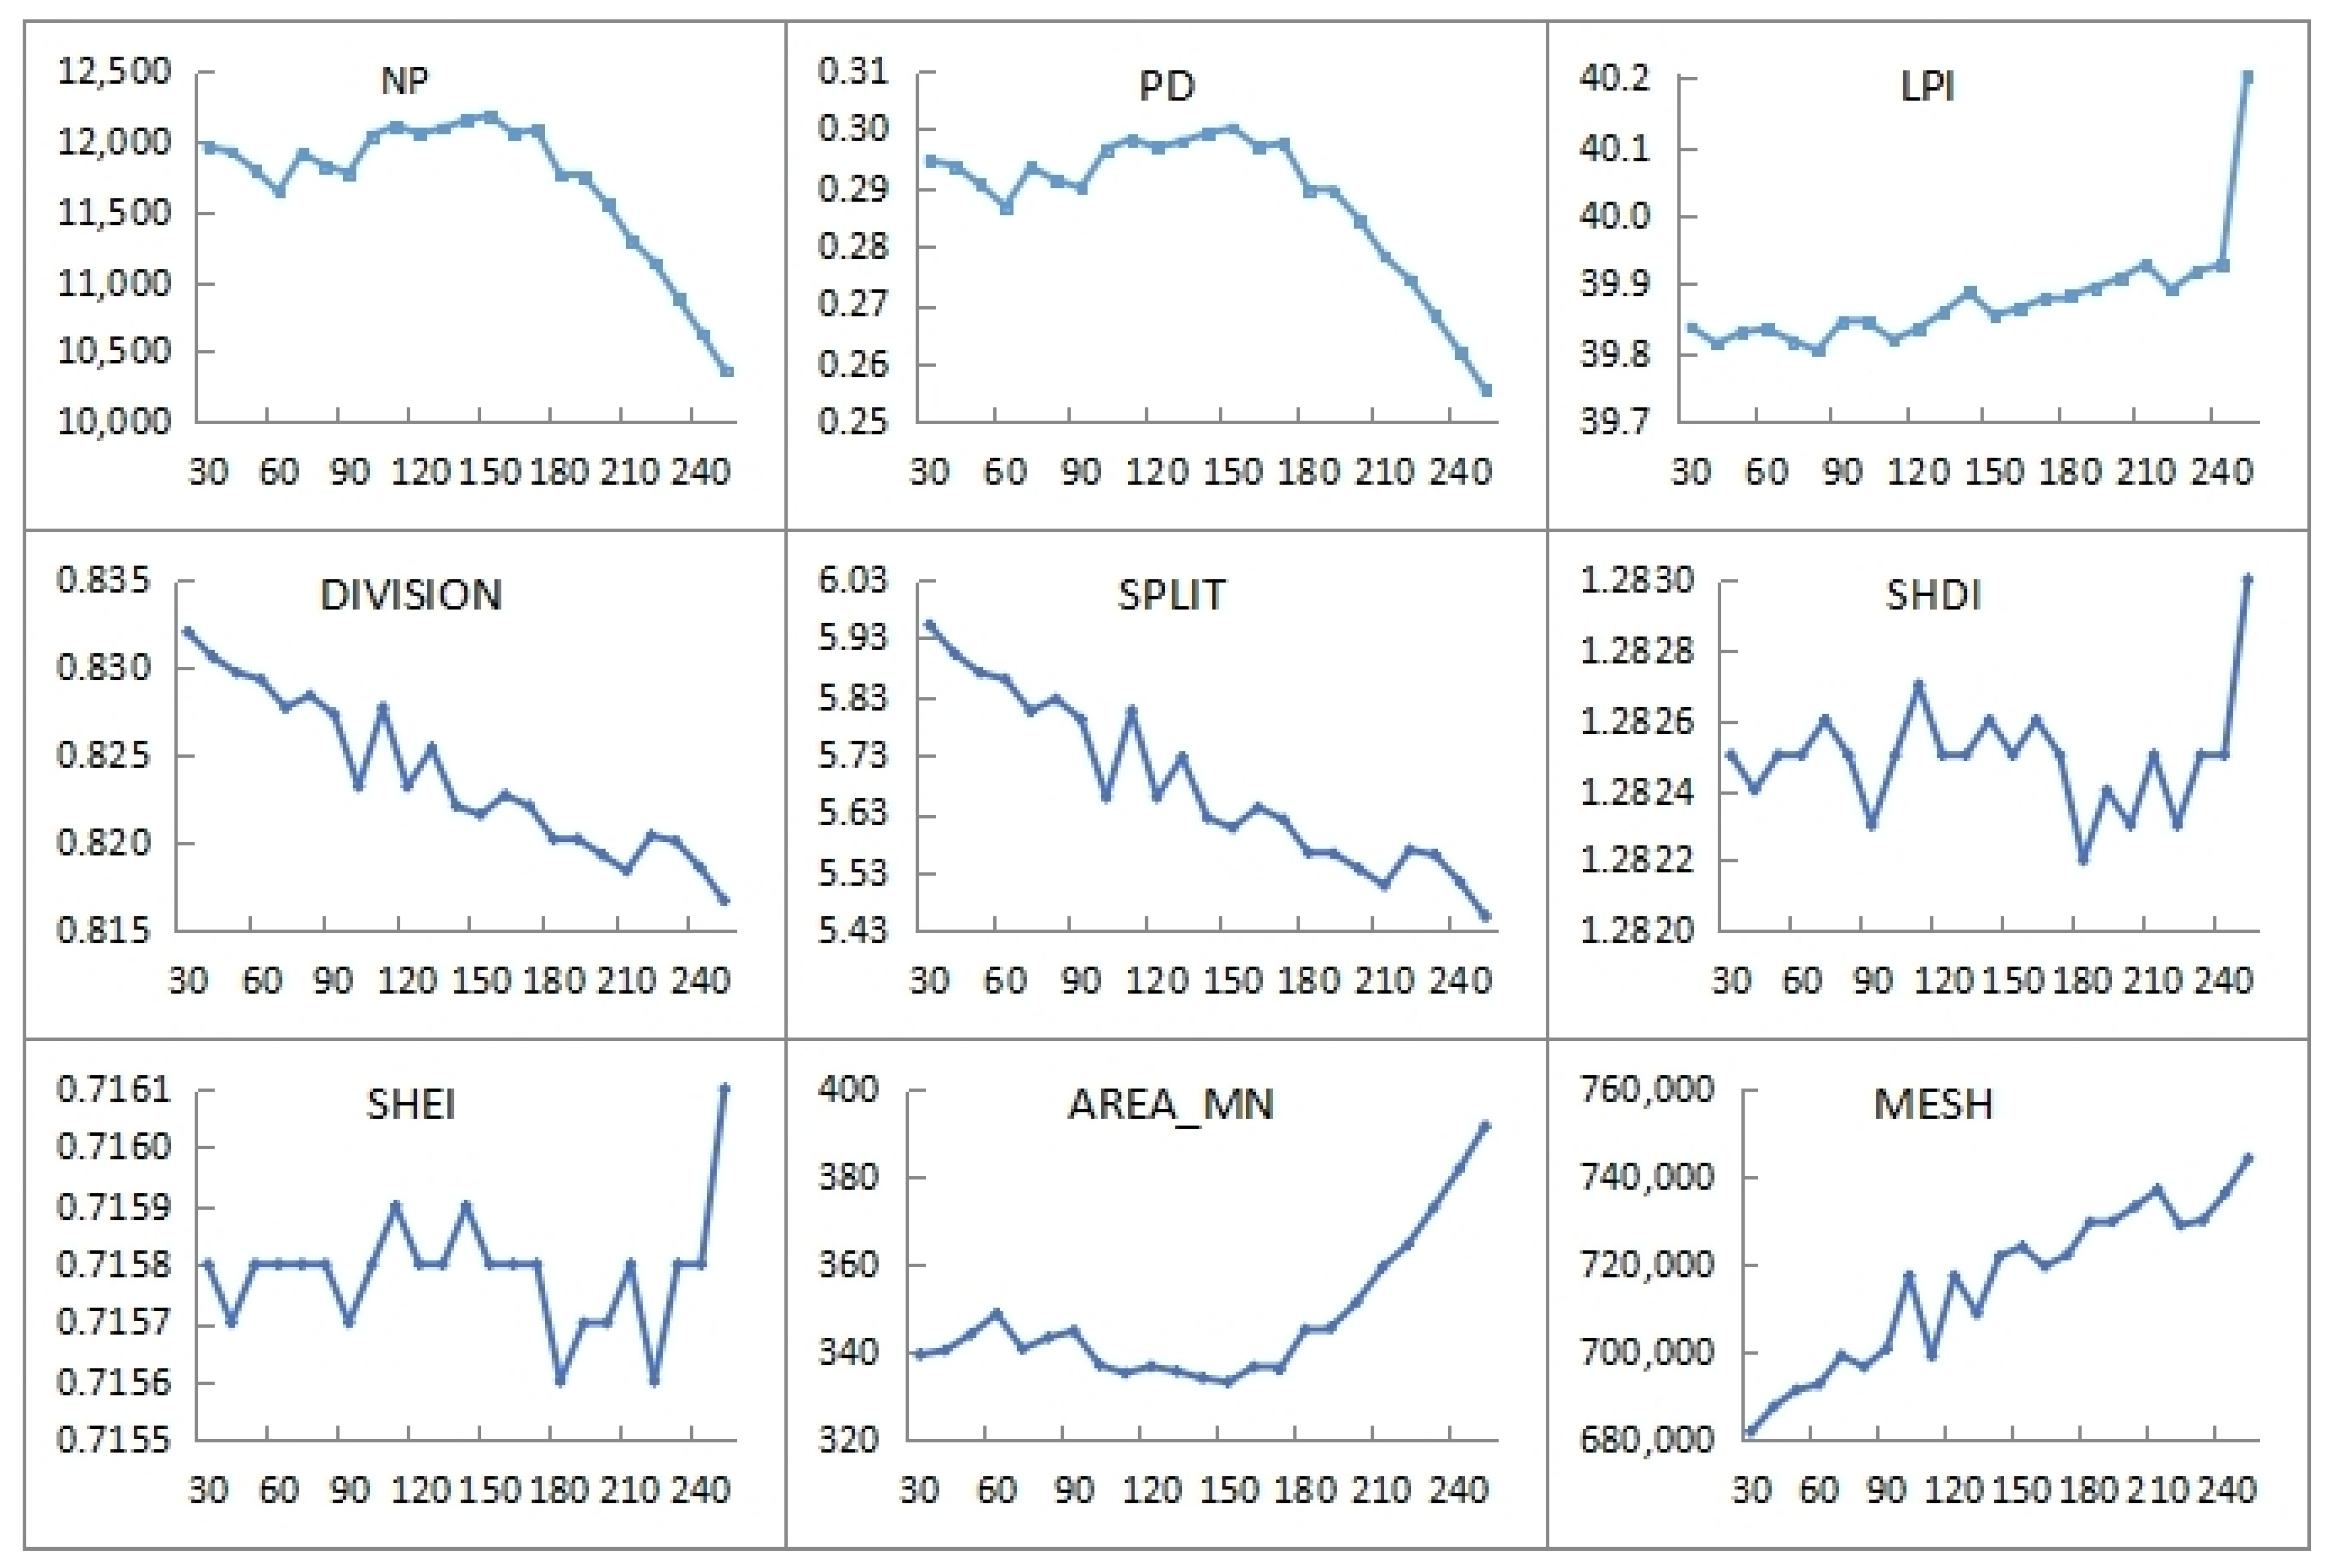
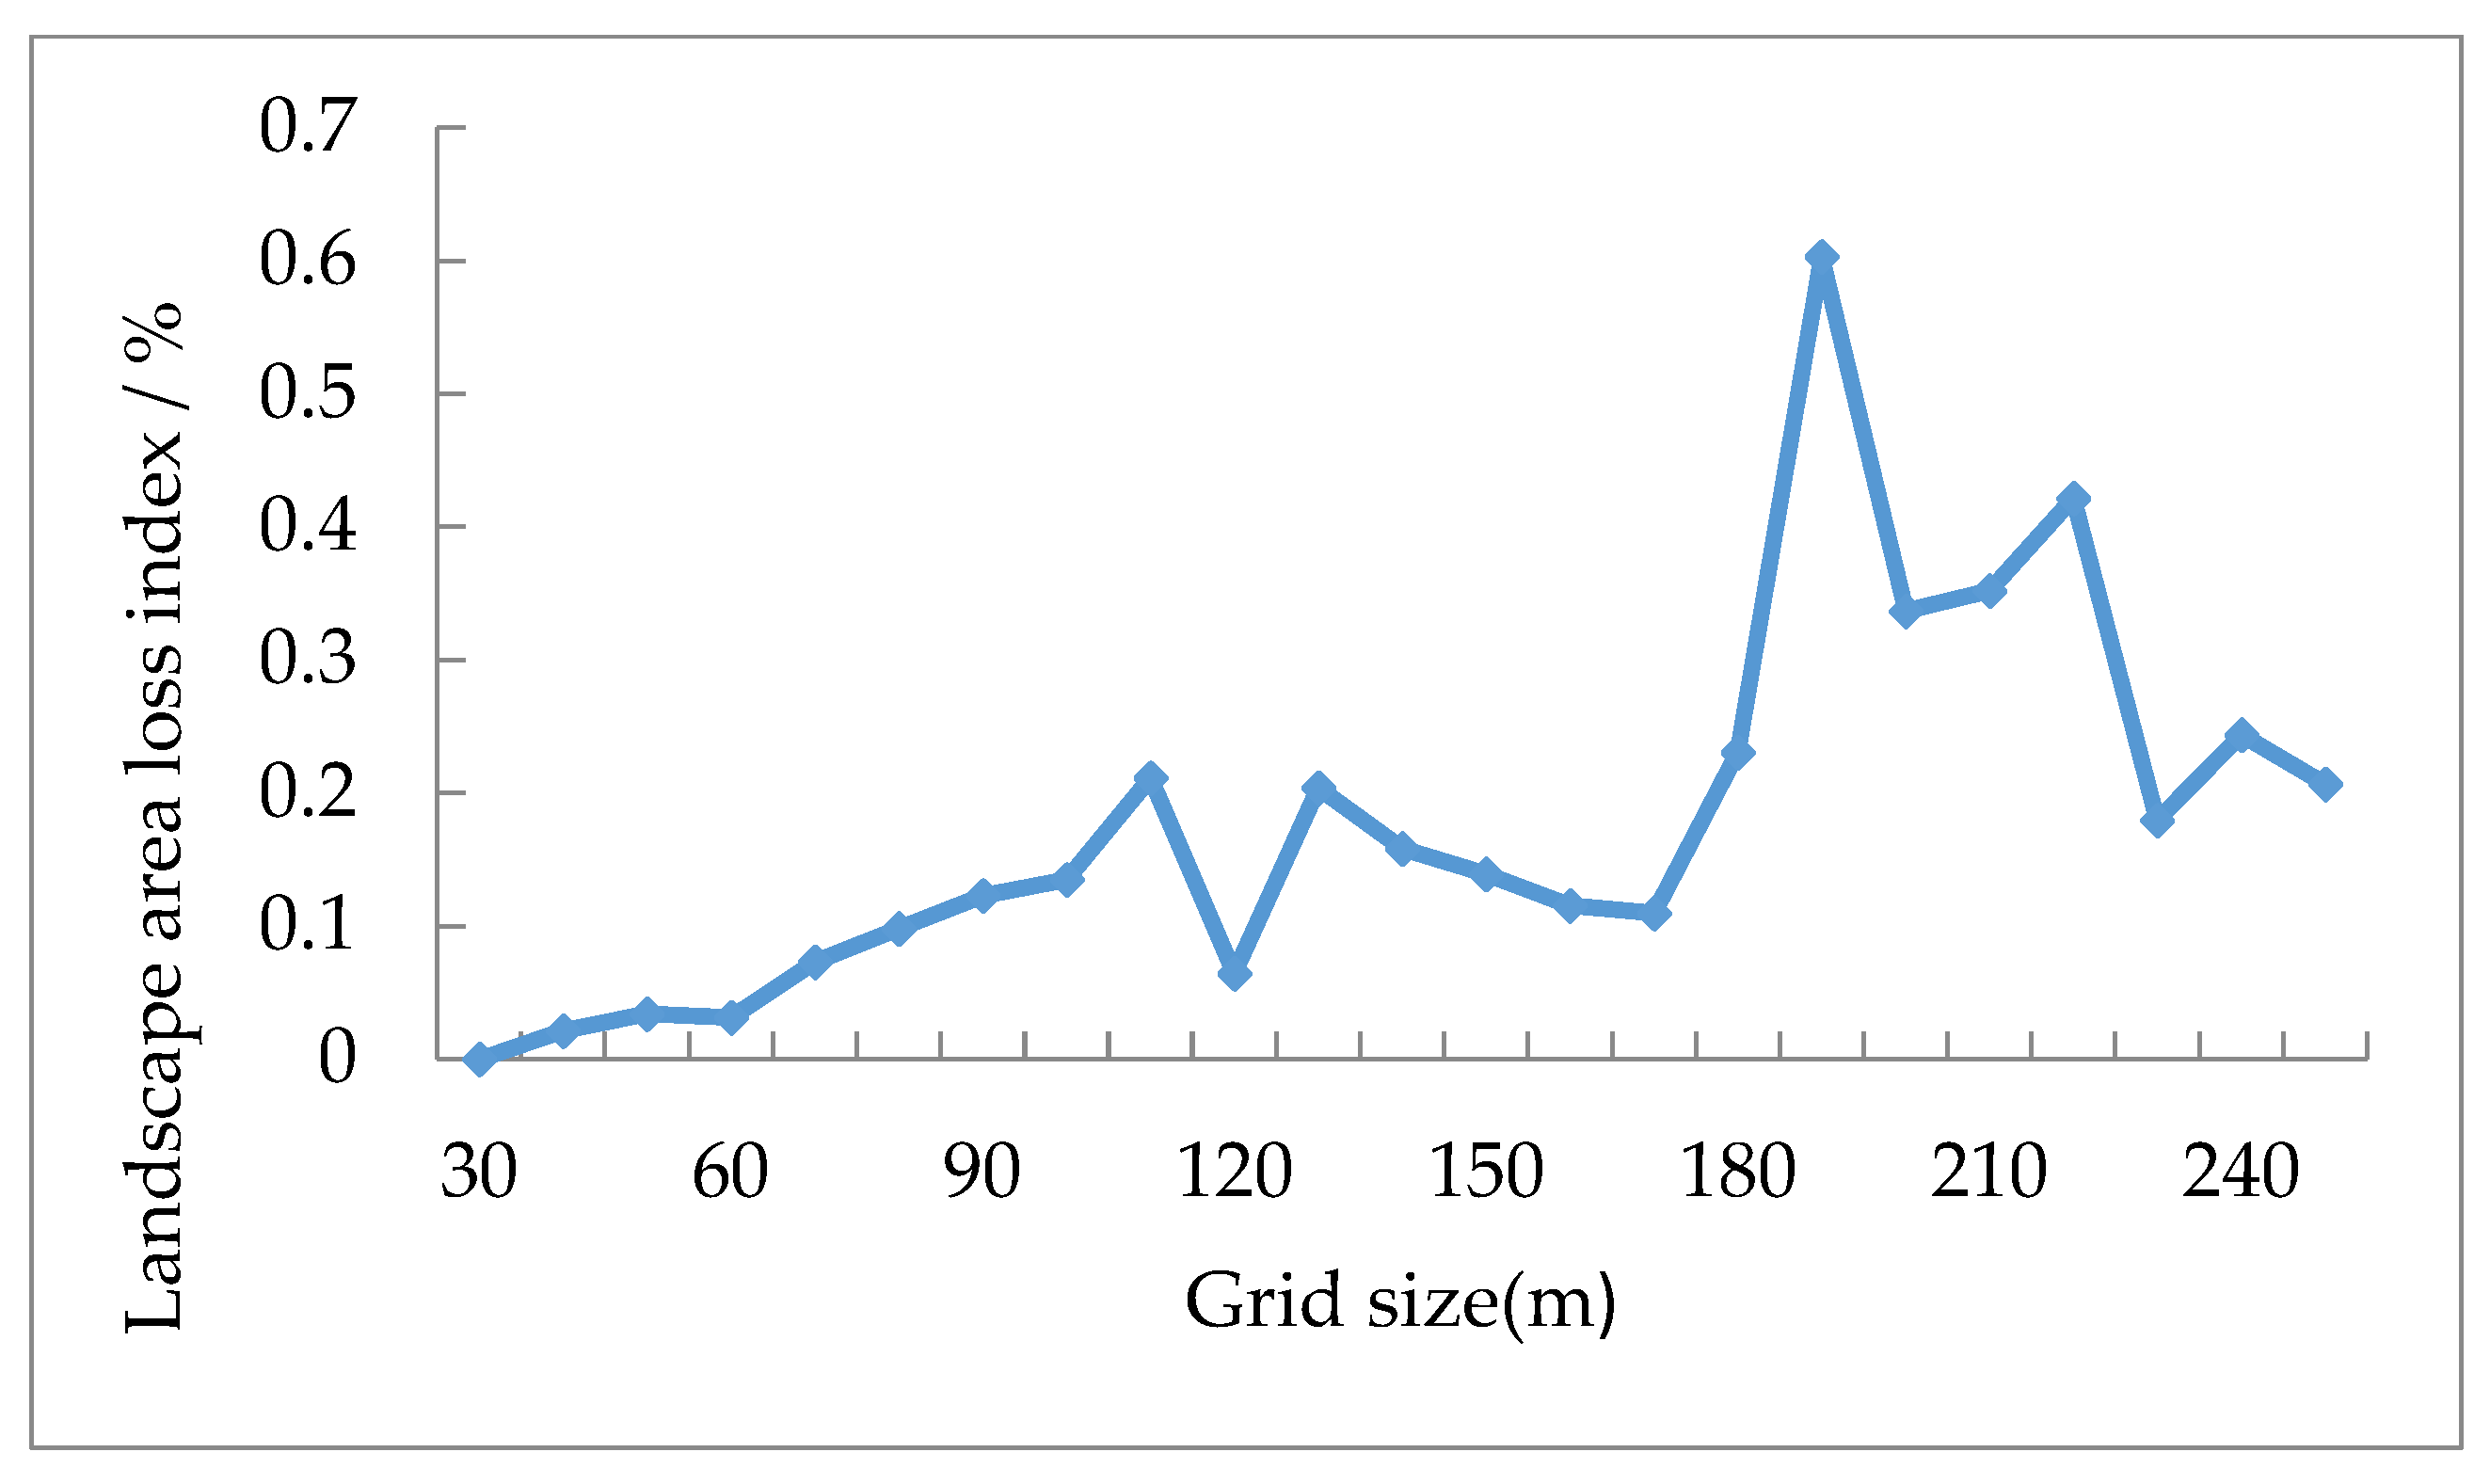
3.1.1. Optimal Particle Size Analysis

Except for the cohesion index (COHESION), which did not have obvious turning points, the other landscape pattern indices show different degrees of responsiveness to spatial grid changes. According to Figure 2, the Shannon diversity Index (SHDI) did not fluctuate significantly between 30–80 m and 120–170 m. The number of patches (NP), patch density (PD), landscape division index (DIVISION), splitting index (SPLIT), mean patch size (AREA_MN), and effective grid size (MESH) all showed an inflection point at 60 m, and the fluctuation was small between 30 and 60 m. The Shannon’s evenness index (SHEI) and the largest patch index (LPI) did not fluctuate significantly between 30 and 80 m. Therefore, the first scale domain of the suitable grid of the land use landscape pattern of Shiyang River Basin was set in the range of 30–60 m.
According to the results of the area information loss evaluation model in Figure 3, it can be seen that when the size range was from 30 to 60 m, the overall change in the regional landscape area loss index was not significant, indicating that the landscape information loss caused by the granularity effect is relatively small and the change is relatively stable within this interval. The optimal grid size interval is 30 to 60 m according to the granularity effect analysis and area information loss evaluation, and the area information loss at 50 m is greater than that at 60 m. To ensure the quality of the calculation, avoid redundant calculation, and reduce the spatial boundary information distortion, 60 m was ultimately deemed the optimal grid size for the analysis of the landscape pattern of the Shiyang River Basin.

3.1.2. Optimal Margin Analysis

When the magnitude is too small, the overall law of LER change will be covered by local law, and the main law of LER spatial pattern cannot be reflected. When the magnitude is too large, the overall change can be visually displayed, but more spatial law information will be lost [34]. The results show that the exponential model can better reflect the characteristics of LER (Table 1). As the scale increases from 3 km to 5 km, the nugget decreases from 3.8 × 10⁻⁵ to 2.9 × 10⁻⁵. This means that the nugget effect gradually weakens, indicating that the spatial heterogeneity caused by random variation is diminishing. The Influence of variability at smaller scales on the overall patterns is gradually reduced. It can also be seen that, with the increase of scale, the variation characteristics of LER at smaller scales are ignored, the scale effect is enhanced, and the macro change law is more significant. The Still decreased from 2.05 × 10⁻⁴ to 1.98 × 10⁻⁴, indicating that the degree of change in LER decreases with the increase of scale. Nugget/Still fluctuation decreases with increasing scale, indicating that the contribution rate of spatial heterogeneity caused by random part to the total spatial heterogeneity shows a weakening trend; in other words, the proportion of spatial heterogeneity caused by spatial autocorrelation is continuously increasing about the total spatial heterogeneity. The Nugget/Still ranges from 0.1465 to 0.1854, indicating that there is strong spatial autocorrelation of LER within the study area at different scales [35] when the magnitude is 4.5 km, RSS is the smallest, and R2 is the largest. Considering the spatial variation of each parameter and the number of samples in different magnitudes, the optimal magnitude of the LER assessment of the Shiyang River Basin was determined to be 4.5 km.

3.2. LER Analysis in Shiyang River Basin

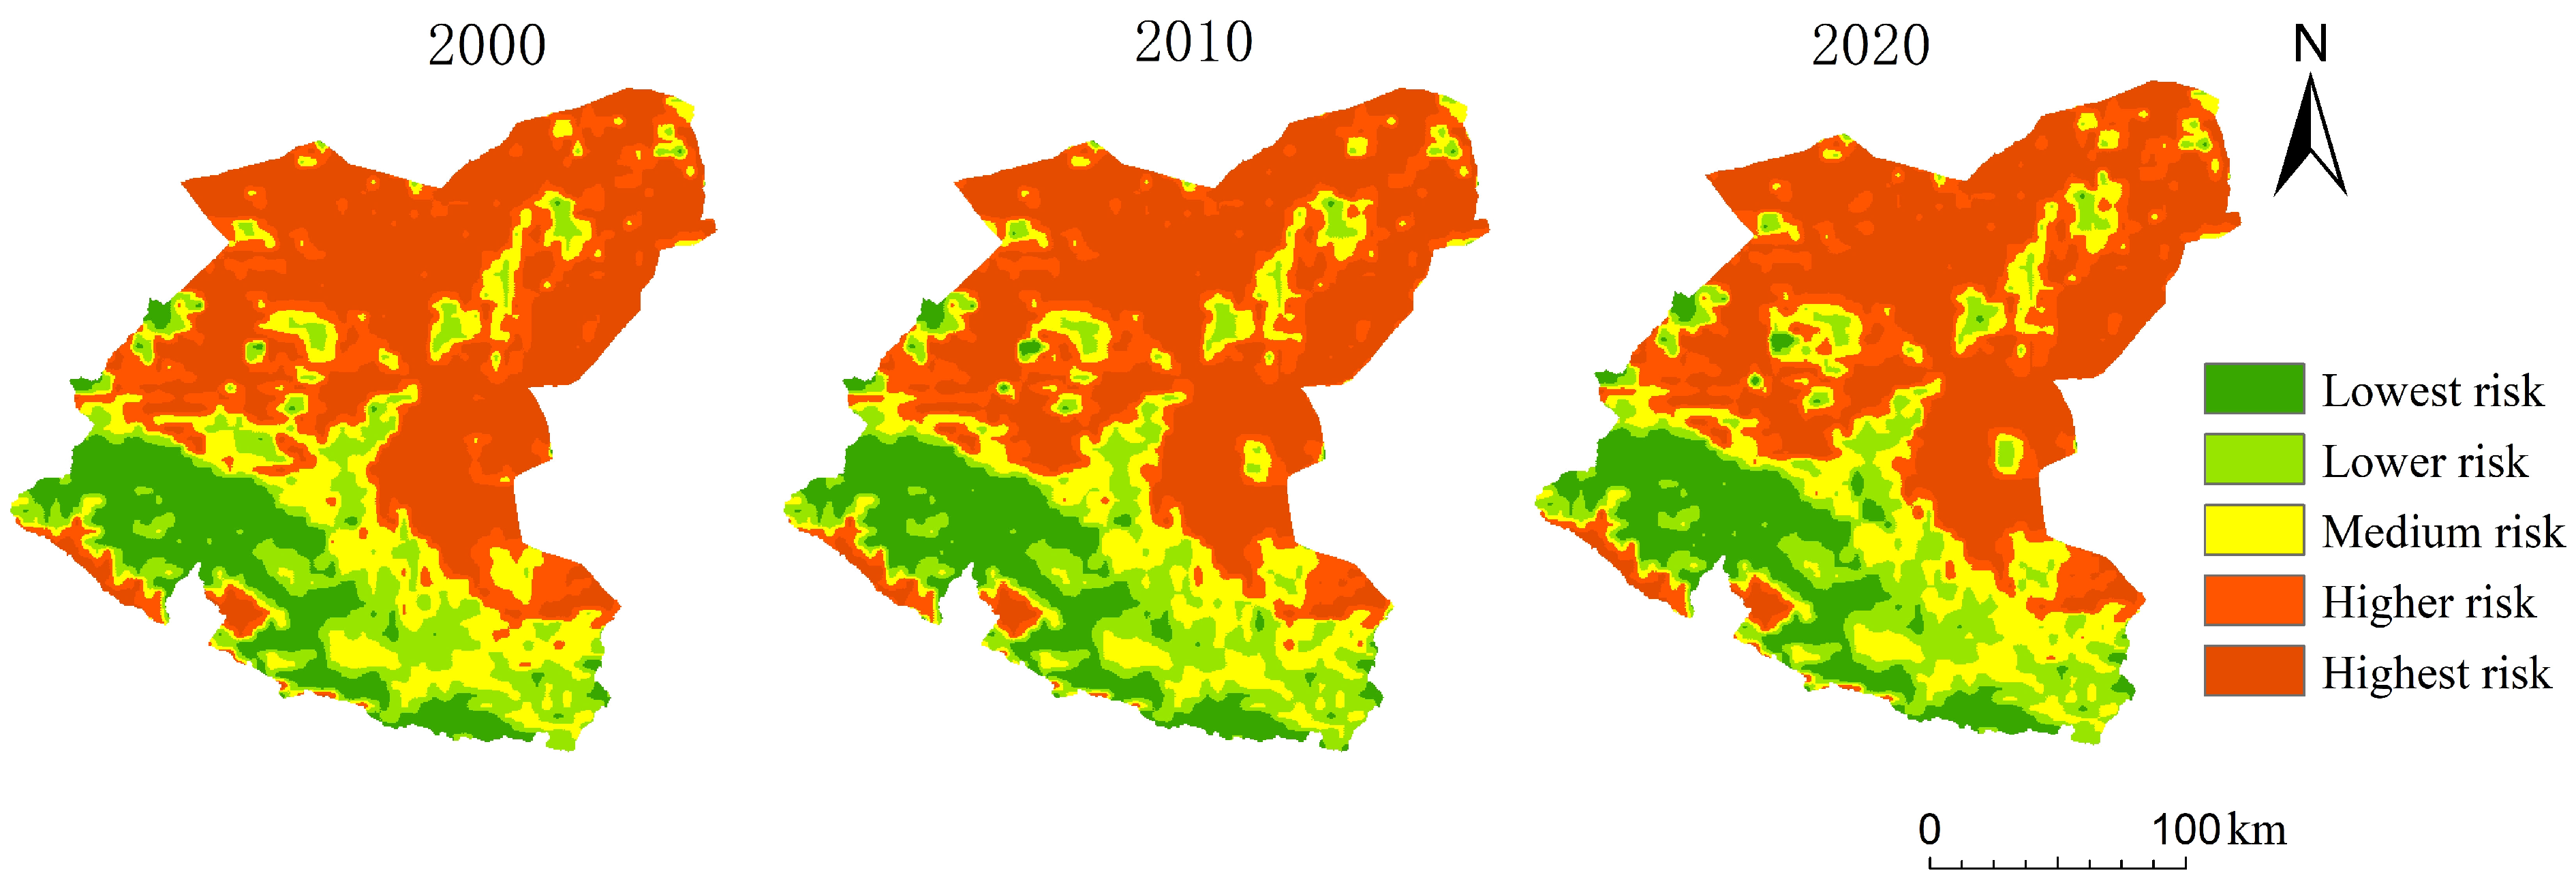
3.2.1. Spatial and Temporal Distribution and Change of LER

The LER of each evaluation unit in the Shiyang River Basin was calculated according to the comprehensive ecological risk index and assigned to the center of the grid. The LER spatial map of the study area was generated using ordinary kriging interpolation. To visually analyze and compare the spatial distribution characteristics of LER in each period, according to the actual range of LER values in the third period, the LER values were divided into five levels by natural breaks classification method [36]: lowest risk (0.016–0.034), lower risk (0.034–0.041), medium risk (0.041–0.047), higher risk (0.047–0.054), and highest risk areas (0.054–0.08).
Figure 4 shows that medium and high-risk areas account for the majority of the study area, and the ecological risk in the northeast of the basin is significantly higher than that in the southwest. The dominant landscapes in the lowest and lower-risk areas are mostly forest land and grassland in the upper reaches and the inner oasis areas in the middle and lower reaches with good vegetation growth conditions and better ecological protection. The other part of the dominant landscape is the construction land because the construction land in the study area is concentrated and stable, and it is difficult to significantly change due to environmental or human interference, so the LER is low [37]. Medium-risk zones are mainly in cultivated land and low-cover grassland, while higher-risk and highest-risk zones are mainly in the downstream ecologically fragile desert areas.
From Table 2, we observe that during the study period, the overall LER decreased, and the average ERI decreased from 0.04762 in 2000 to 0.04731 in 2020. The lowest risk zone, lower risk zone, and medium risk zone all expanded significantly, with the areas increasing by 173 km2, 215.75 km2, and 196.5 km2, respectively; the proportion increased by 0.43%, 0.53%, and 0.48%, respectively. The area of the higher risk zone and highest risk zone decreased, with the area being reduced by 54.75 km2 and 530.5 km2, respectively.

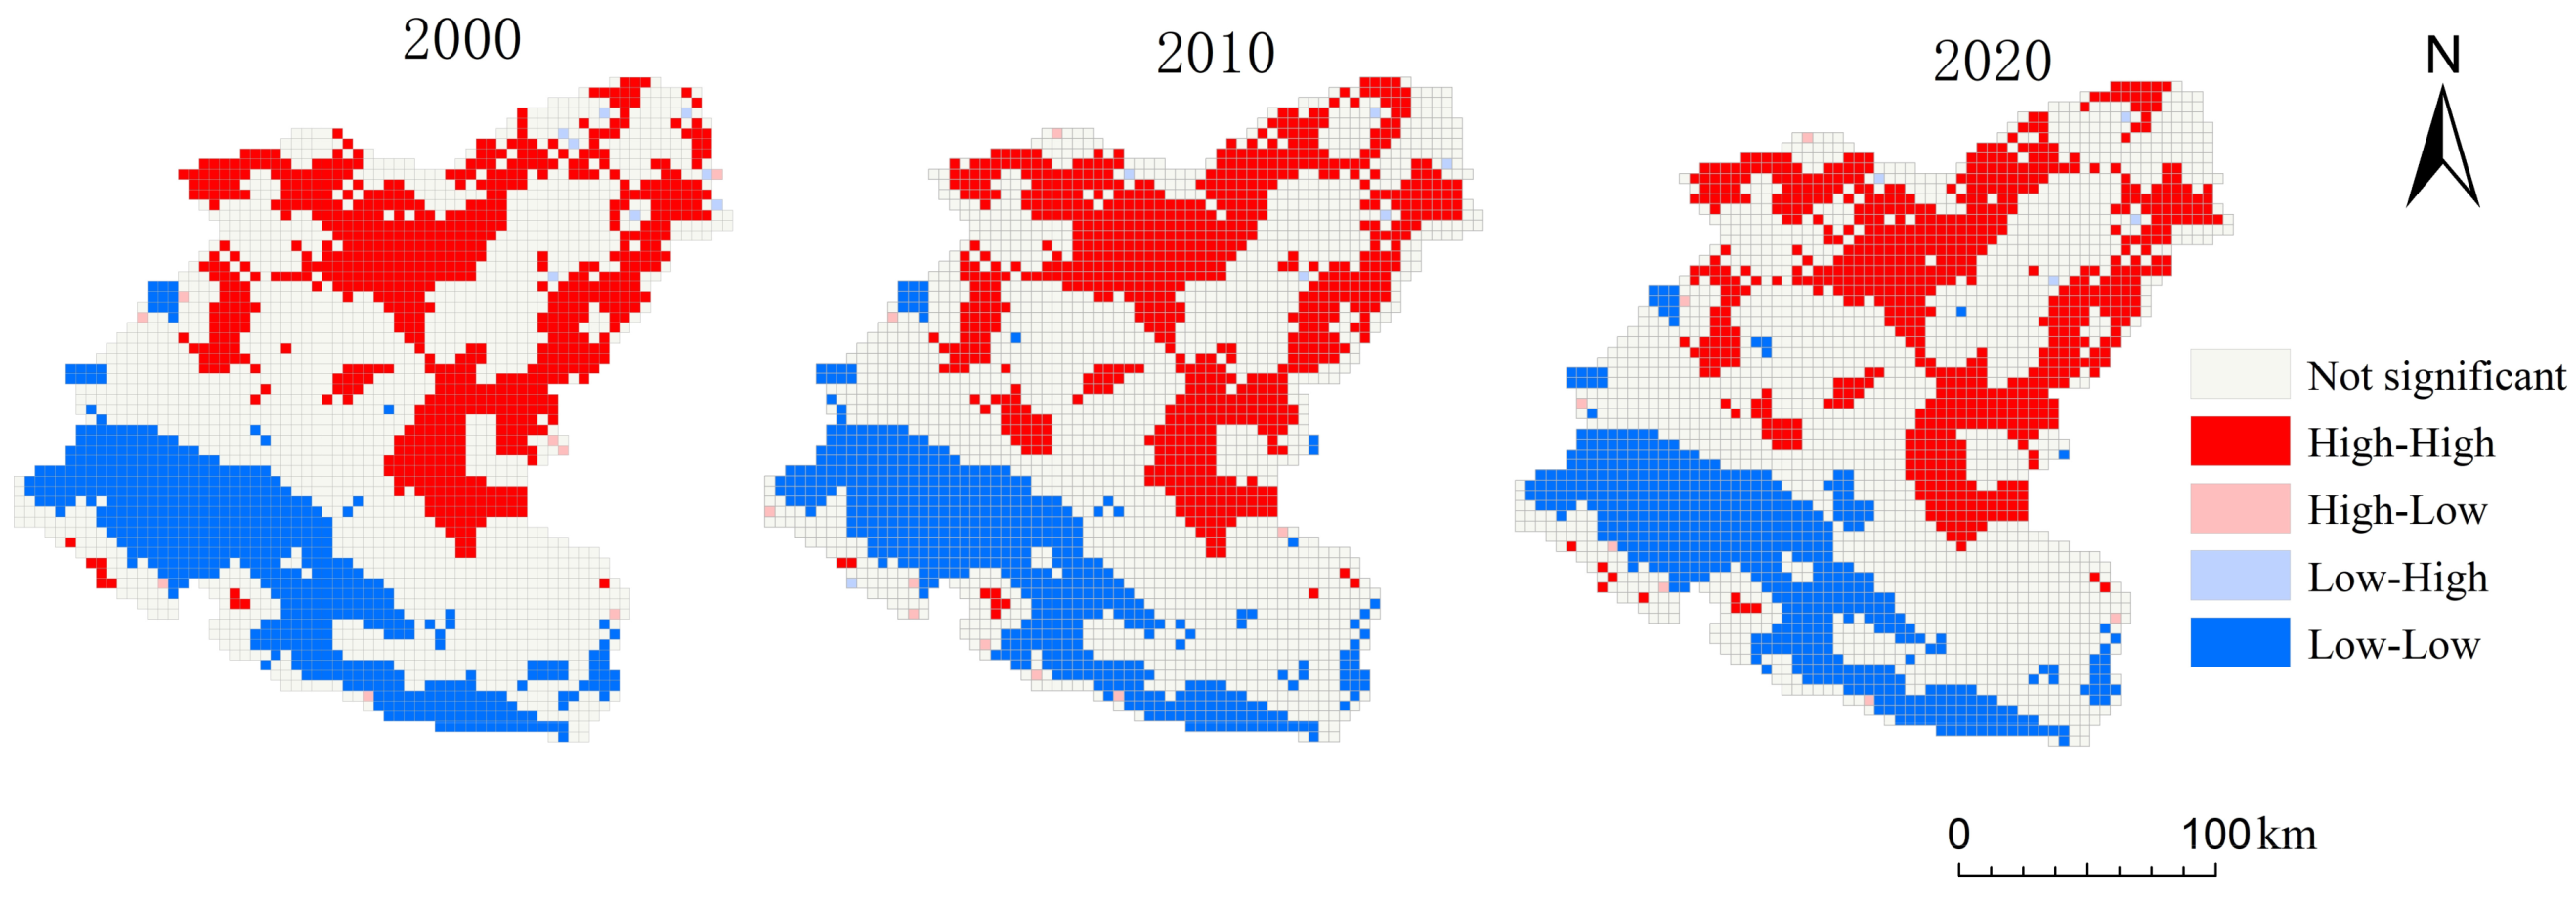
3.2.2. Spatial Correlation Analysis of LER

The global Moran’s I values of the LER in 2000, 2010, and 2020 were 0.7889, 0.7547, and 0.7683, respectively, which were significant at the p < 0.0100 level. The results show that the LER in the Shiyang River Basin was significantly positively correlated and spatially aggregated. According to the Lisa cluster map (Figure 5), from 2000 to 2020, the overall spatial pattern of LER aggregation in Shi Yang River Basin has little change, primarily characterized by “low-low” aggregation and “high-high” aggregation. The low-low aggregation was mainly concentrated in the Qilian mountain area in the upper reaches of the basin, showing an increasing trend, and high-high aggregation is mainly distributed in the desert area of the middle and lower reaches of the basin, showing a decreasing trend.

3.3. Multi-Scenario Simulation of LER in Shiyang River Basin

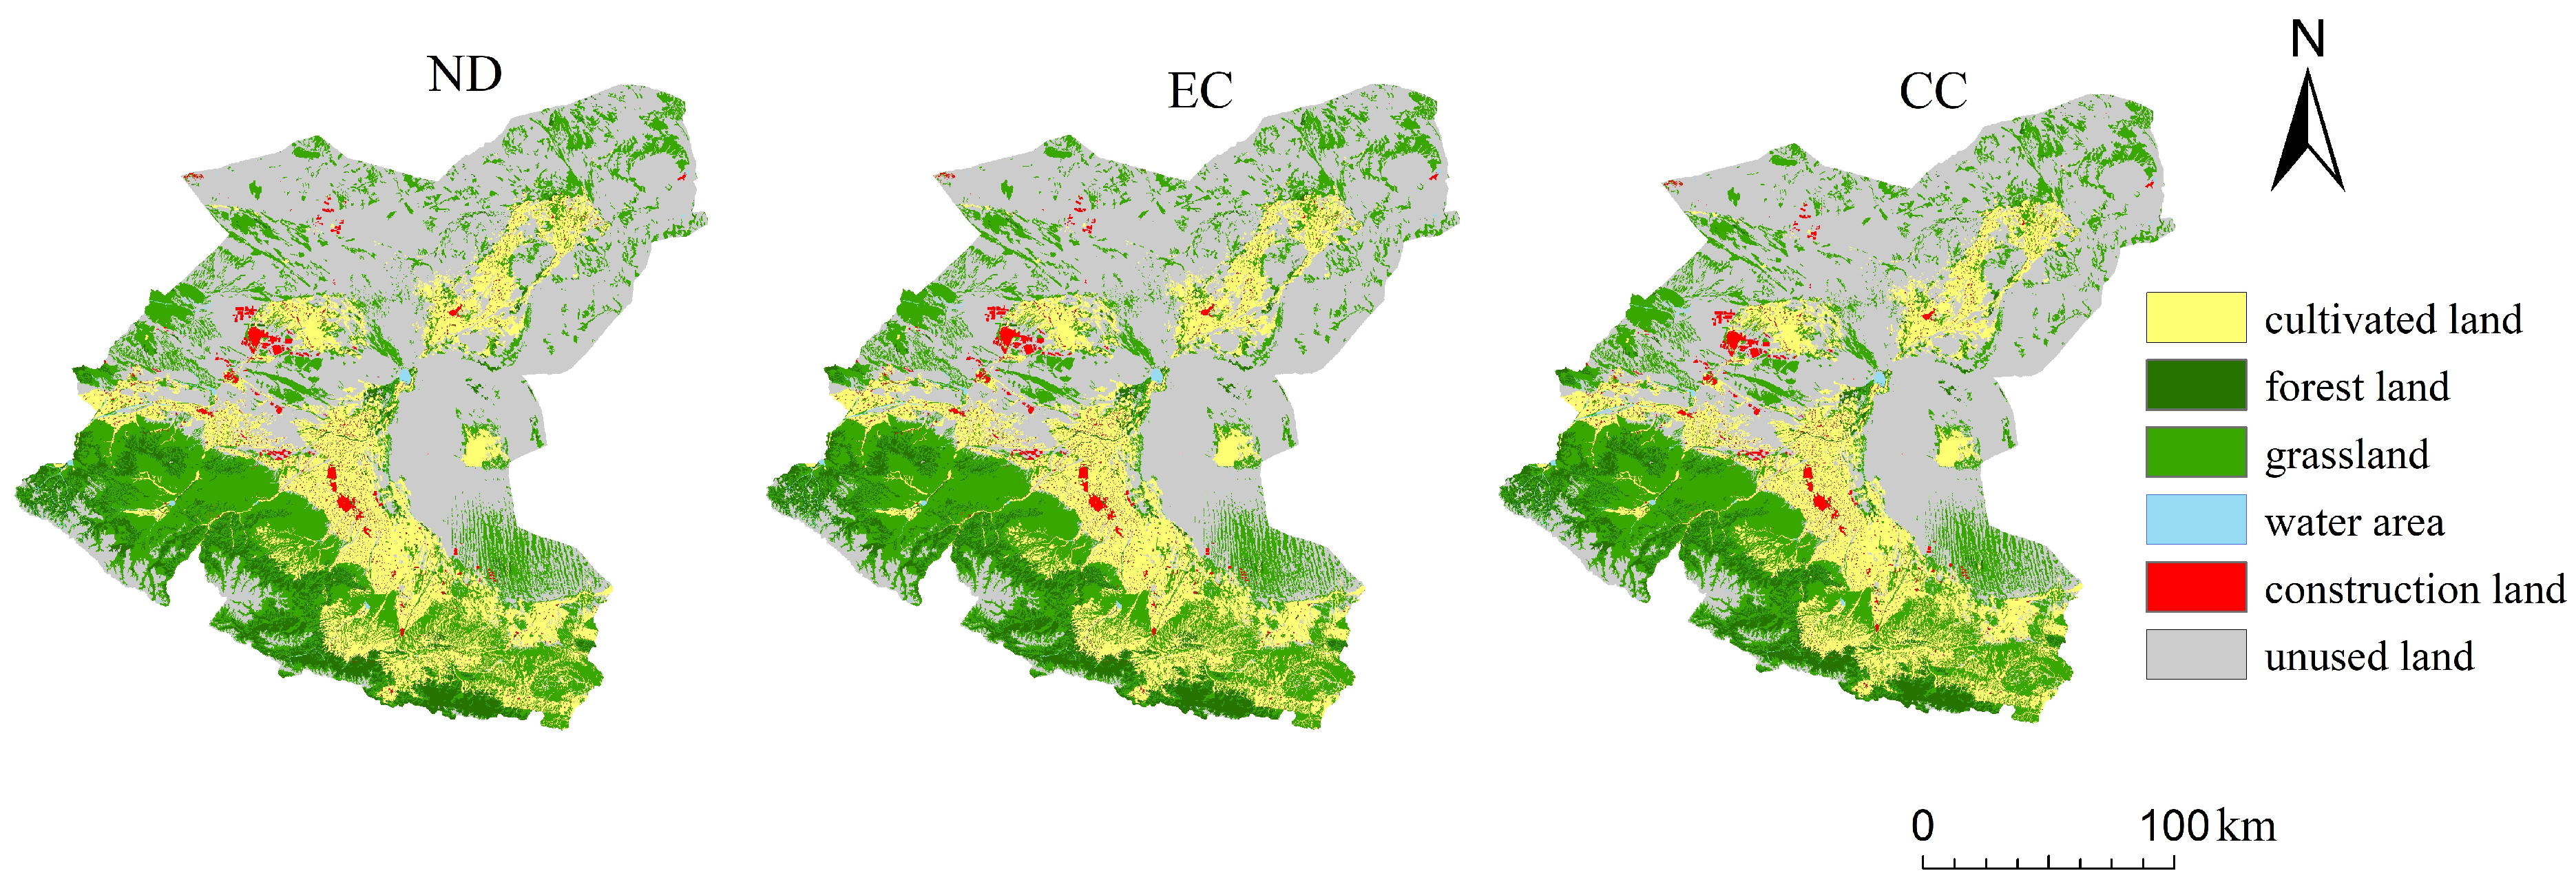
3.3.1. Changes in Land Use Types under Different Scenarios

According to the simulation results of the PLUS model (Figure 6, Table 3), under the natural development scenario and the cultivated land conservation priority scenario in 2030, the changing trend of class area in the Shiyang River Basin is the same, which shows that the area of cultivated land, grassland, and construction land increases, while the area of forest land, water area, and unused land decreases. Under the ecological conservation priority scenario, the changes in the areas of grassland, water area, construction land, and unused land are consistent with the first two scenarios. The difference is that in the ecological conservation priority scenario, there is a small expansion in the forest land area and a slight decrease in the cultivated land area. The details are as follows:
Under the natural development scenario, the grassland area will increase the most from 2020 to 2030, which represents an addition of 79.34 km2; the cultivated land area will increase by 31.93 km2; the construction land area will increase by 19.45 km2, which is mainly shifted from the unused land; the forest land area will decrease by 32.55 km2, and the water area will have a lesser change, with a decrease of 1.52 km2.
Under the ecological conservation priority scenario, the areas of forest land, grassland, and construction land expanded from 2020 to 2030. Among them, the grassland area will increase the most, with a growth of 97.31 km², which was mainly distributed in the middle of the basin. Compared to the natural development scenario, the area of forest land will increase by 36.23 km2. At the same time, under the ecological conservation priority scenario, the area of unused land will decrease the most, reaching 118.45 km2 compared with 2020.
Under the cultivated land conservation priority scenario, from 2020 to 2030, the area of cultivated land will expand the most, reaching 97.27 km2, which is mainly transferred from grassland and unused land; the forest land area will decrease the most to 86.77 km2; grassland area will increase but, compared to the natural development scenario, decrease by 10.76 km2.

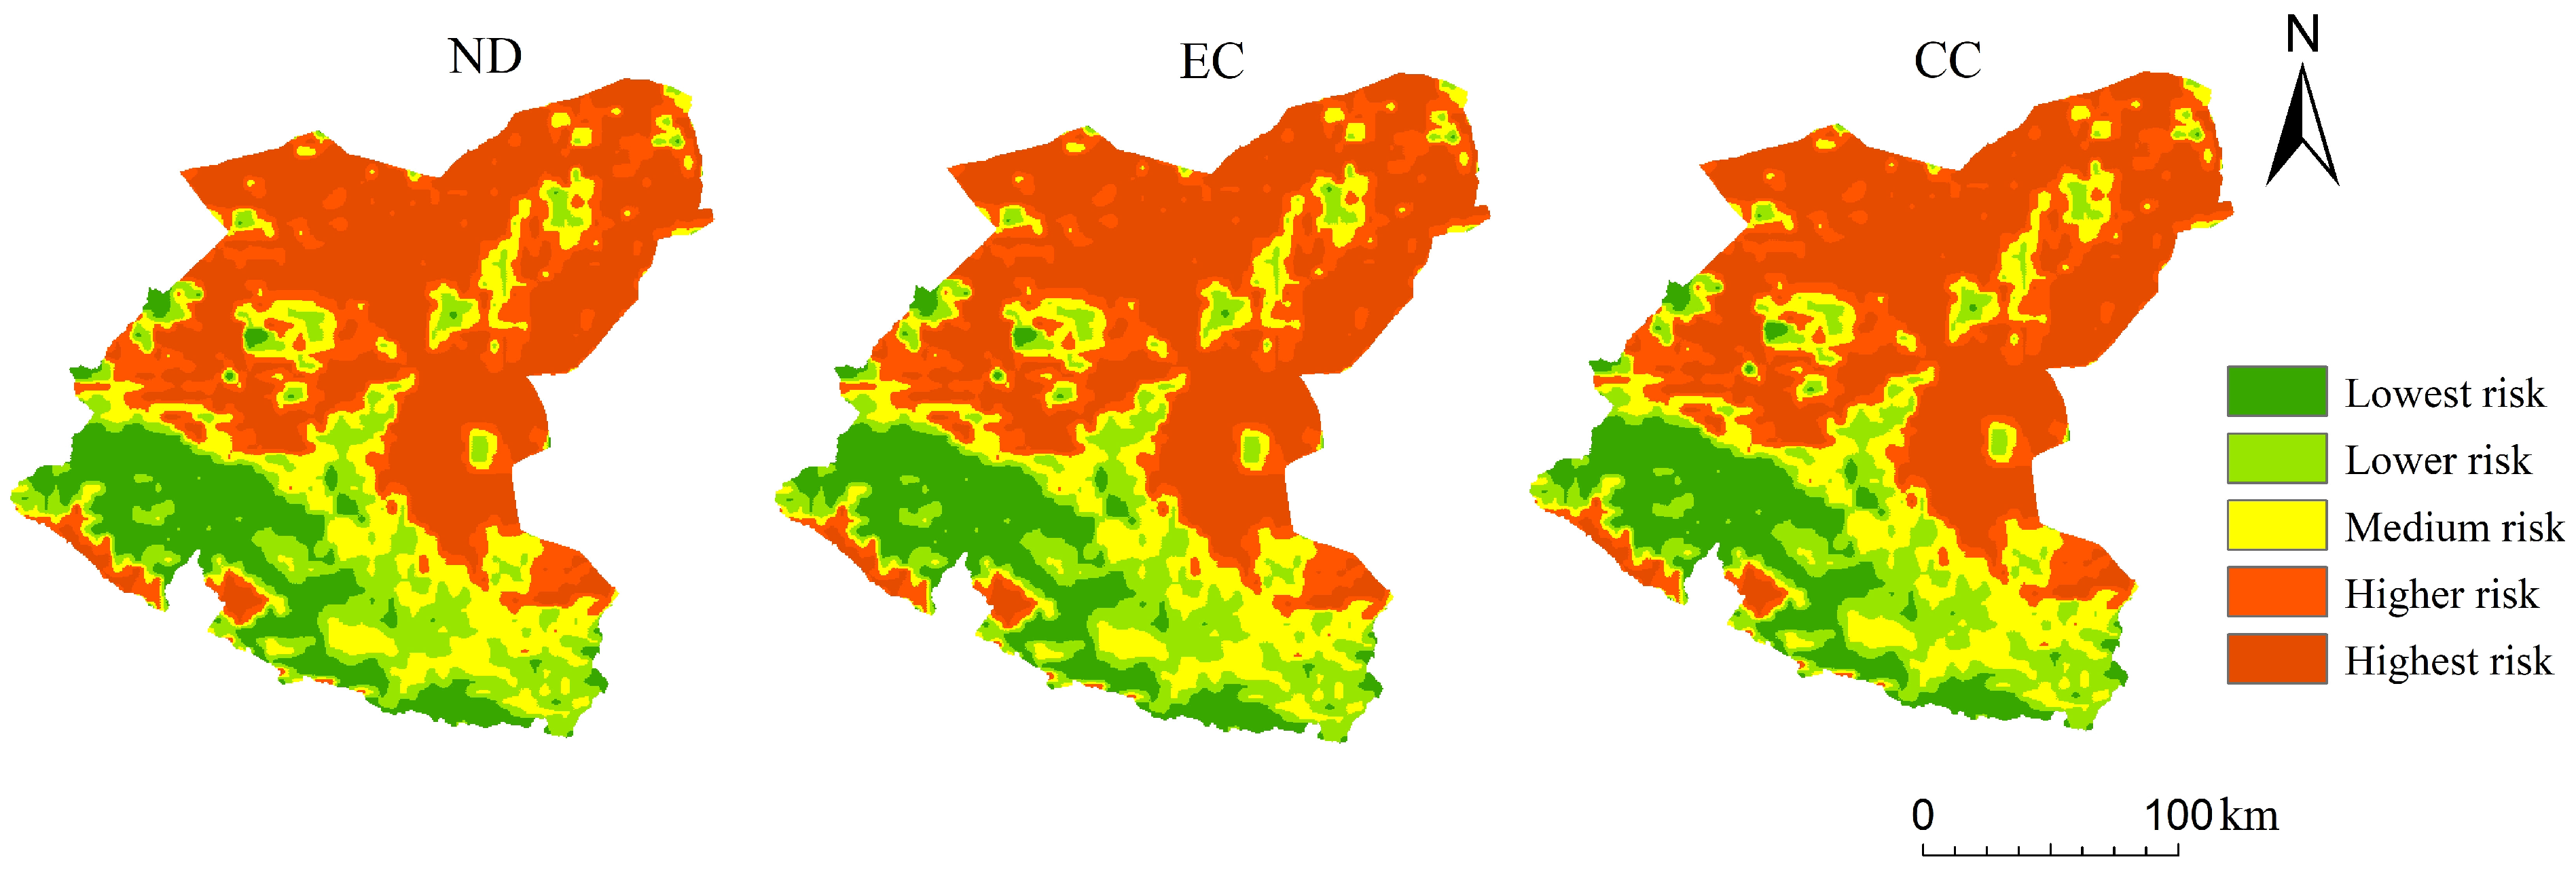
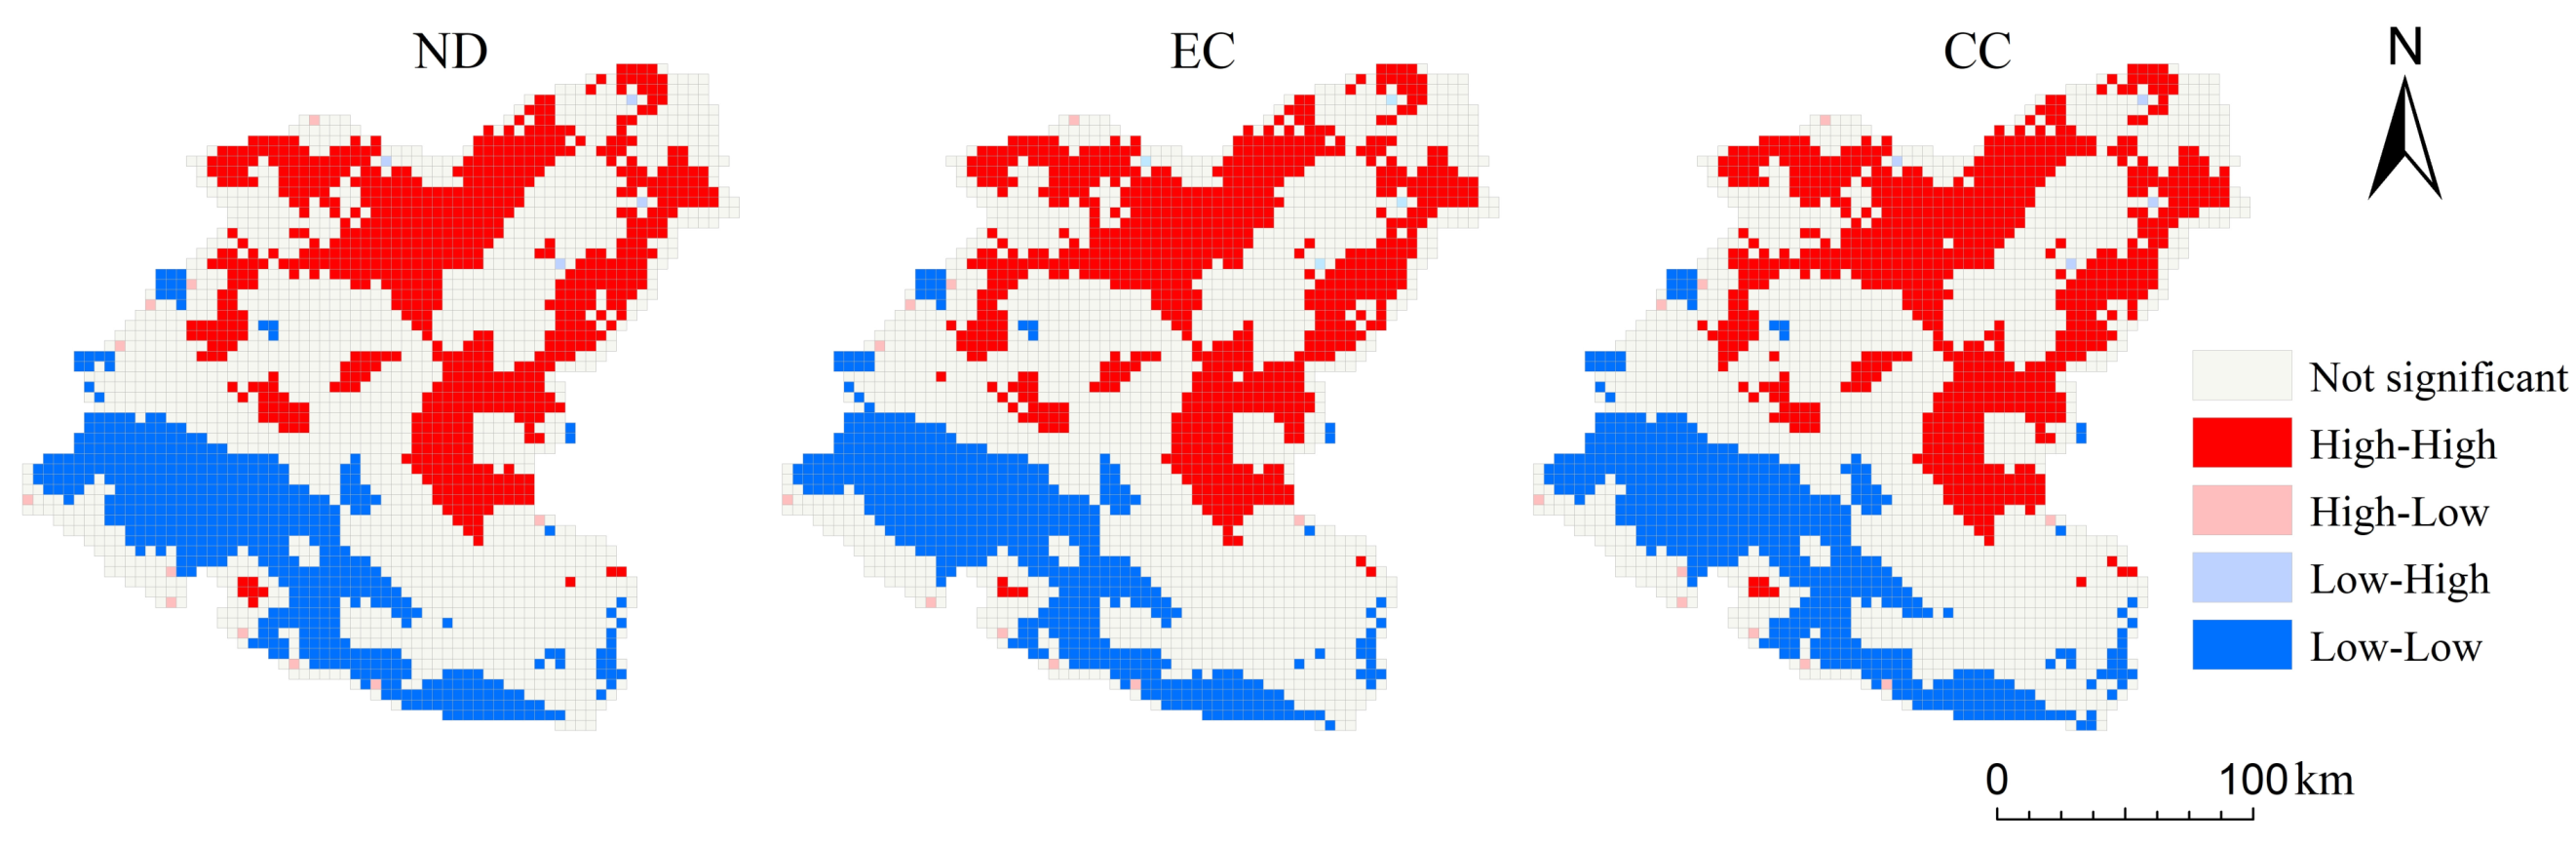
3.3.2. Characteristics of LER Changes under Different Scenarios

According to Figure 7 and Table 4, the LER under the three scenarios will all decline in 2030, and the ecological risk is the lowest under the ecological conservation priority scenario. The spatial distribution of LER in 2030 is overall similar to that of 2020, with no significant changes in the general characteristics and patterns. Higher-risk and highest-risk areas continue to dominate, but the areas of high-risk areas will decrease, and the areas of low-risk areas will increase. The global Moran I values of LER values for the three scenarios of natural development, ecological conservation priority, and cultivated land conservation priority in 2030 were 0.7475, 0.7477, and 0.7475, respectively, which were significant at the p < 0.01 level, indicating that the LER had significant positive correlation and spatial aggregation characteristics. It can be seen from Figure 8 that the spatial pattern of LER aggregation in the Shiyang River Basin under different scenarios in 2030 is similar to that in 2020, with “high-high” and “low-low” value clustering distributed.
Under the natural development scenario, the areas of lowest-risk, lower-risk, medium-risk, and higher-risk zones in the Shiyang River Basin will increase in 2030; specifically, the area of the lowest-risk zone will increase the most (by 72.25 km2), and the area of the highest-risk zone will decrease by 84 km2, indicating that if the historical trend is maintained, the future LER of Shiyang River Basin will decrease. This is due to the continuation of the trend before 2020 and the further economic development of the Shiyang River basin; in addition, the implementation of ecological protection projects and water conservancy projects, which have led to the expansion of oases, facilitated the conversion of unused land to grassland and construction land.
Under the ecological conservation priority scenario, the areas of the lowest-risk and lower-risk areas will significantly increase compared to 2020, increasing by 84.75 km2 and 69.75 km2, respectively, and the area will be larger than the other two scenarios. The areas of medium-risk areas, higher-risk areas, and highest-risk areas all show a decreasing trend and, in this scenario, the sum of the lowest-risk and lower-risk areas is the largest, and the sum of the highest-risk and higher-risk areas is the smallest. The main reason for this observation is that, under the ecological conservation priority scenario, the expansion of cultivated land into forest land, grassland, and construction land is restricted, the stability of the water area is protected, and the ecological land is protected to a certain extent. As a result, forest land and grassland areas are gradually restored, the landscape stability is enhanced, and the low-risk areas of ecological protection area are expanded.
Under the cultivated land conservation priority scenario, the area of lowest-risk, medium-risk, and higher-risk areas will increase, while the area of lower-risk areas and highest-risk areas both decrease, among which the area of lower-risk areas will decrease the most by 77.25 km2. Compared to the other two scenarios, the areas of the lowest-risk and lower-risk zones are the smallest, and the areas of the higher-risk and highest-risk zones are the highest. This is because under the cultivated land conservation priority scenario, the conversion of cultivated land to other land is restricted, and the area of cultivated land will continue to expand, encroaching upon surrounding forest land, grassland, and other land types. All landscape types changed, and the landscape stability decreased, which led to the decrease in the area of lower-risk areas and the increase in the area of medium-risk areas and higher-risk areas.

4. Discussion

LER assessment inevitably faces MAUP [14], and changes in the spatial resolution of data in the same study area can have substantial impacts on landscape patterns [38]. Referring to previous studies on the spatial effects of LER [39,40,41], we analyzed and concluded that the optimal granularity and magnitude were 60 m and 4.5 km, respectively, and the LER in the Shiyang River Basin was evaluated on this basis. The research results are consistent with the actual ecological environmental status of the study area and, compared with previous research results [42], it can better show the change characteristics of ecological risks in sensitive areas, such as the agro–pastoral transition zone and oasis edge area, indicating that it is feasible and reasonable for this paper to evaluate LER based on analyzing the optimal scale of LER research.
At present, there are few relevant studies in arid inland river basins. This paper can more accurately reveal the spatial heterogeneity of LER in arid inland river basins, increase the number of research cases, and provide a reference for the evaluation of LER in inland river basins in the arid zone. In addition, in the process of LER assessment, this study analyzed the modifiable areal unit problem, which improved the previous research on LER in arid inland river basins. In the ecological protection and restoration of river basins, different risk countermeasures should be taken according to the characteristics of different risk levels. In ecologically fragile highest-risk and higher-risk areas, sand control projects should be implemented to avoid the expansion of high-risk regions. Agricultural activities should be managed comprehensively in the middle-risk areas, such as oasis edges and the transition zone between forest land and cultivated land. In the Qilian mountain area with better ecological conditions in the upper reaches of the basin, it is necessary to strengthen the protection of forest land and grassland, avoid over-exploitation of human activities, and slow down the transformation from lowest-risk and lower-risk areas to medium-risk areas. Because short-term changes in ecological risks are heavily influenced by government policy, future research should consider quantitative policy methods and incorporate policy factors into driving factors.

5. Conclusions

In this study, the Shiyang River basin, a typical arid inland river basin, was used as the study area. The analysis was based on determining the optimal scale for LER research in the basin; the spatial and temporal distribution and spatial correlation of LER in the basin were explored with the years 2000, 2010, and 2020 representing the time series. The LER of the Shiyang River Basin under different development scenarios in the future are analyzed. The conclusions are as follows:
The LER in the Shiyang River Basin has obvious scale dependence, with optimal granularity and magnitude of 60 m and 4.5 km, respectively. The LER in the Shiyang River Basin is dominated by higher-risk and highest-risk areas, with significant spatial differences, showing a trend of low in the southwest and high in the northeast. The average LER in the Shiyang River Basin was 0.04762, 0.04743, and 0.04731 in 2000, 2010, and 2020, respectively, showing a decreasing trend. From 2000 to 2020, the lowest-risk zone, lower-risk zone, and medium-risk zone all expanded significantly, the area of the higher-risk zone and highest-risk zone decreased, and the overall LER decreased.
Compared to 2020, there is no significant change in the spatial distribution pattern and spatial agglomeration characteristics of each LER type in 2030. It is expected that the LER value under different scenarios in 2030 will show a downward trend, and the LER value under the ecological conservation priority scenario will be the lowest.

Supplementary Materials

The following supporting information can be downloaded at: https://www.mdpi.com/article/10.3390/su152215883/s1, Table S1. Conversion cost matrix of land use under natural development scenario. Table S2. Conversion cost matrix of land use under ecological conservation priority scenario. Table S3. Conversion cost matrix of land use under cultivated land conservation priority scenario.

Author Contributions

J.X. contributed to all aspects of this work. J.Z. provided a large number of important opinions on the development of the research framework and the writing and improvement of this paper. S.Z. and Z.S. contributed to resource acquisition. All authors have read and agreed to the published version of the manuscript.

Funding

This research was funded by the National Natural Science Foundation of China (Grant No. 42161072).

Institutional Review Board Statement

Not applicable.

Informed Consent Statement

Not applicable.

Data Availability Statement

The data presented in this study are available on request from the corresponding author.

Conflicts of Interest

The authors declare no conflict of interest.

References

  1. Vitousek, P.M.; Mooney, H.A.; Lubchenco, J.; Melillo, J.M. Human domination of earth’s ecosystems. Science 1997, 277, 494–499. [Google Scholar] [CrossRef]
  2. Ghosh, S.; Chatterjee, N.D.; Dinda, S. Urban ecological security assessment and forecasting using integrated DEMATEL-ANP and CA-Markov models: A case study on Kolkata Metropolitan Area, India. Sustain. Cities Soc. 2021, 68, 102773. [Google Scholar] [CrossRef]
  3. Zhu, C.; Jiang, F.; Wu, L.; Zeng, M.; Jia, T.; Zhou, S.; Ning, Y.; Yu, J.; Feng, X. On the problems of urbanization in the Yangtze River Delta under the background of global change. Acta Geogr. Sin. 2017, 72, 633–645. [Google Scholar]
  4. Wang, J.; Zhou, W.; Pickett, S.T.A.; Yu, W.; Li, W. A multiscale analysis of urbanization effects on ecosystem services supply in an urban megaregion. Sci. Total Environ. 2019, 662, 824–833. [Google Scholar] [CrossRef] [PubMed]
  5. Peng, J.; Dang, W.X.; Liu, Y.X.; Zong, M.; Hu, X. Review on landscape ecological risk assessment. Acta Geogr. Sin. 2015, 70, 664–677. [Google Scholar]
  6. Landis, W.G. Twenty years before and hence; ecological risk assessment at multiple scales with multiple stressors and multiple endpoints. Hum. Ecol. Risk Assess. 2003, 9, 1317–1326. [Google Scholar] [CrossRef]
  7. Chen, S.Q.; Chen, B.; Fath, B.D. Ecological risk assessment on the system scale: A review of state of the art models and future perspectives. Ecol. Model. 2013, 250, 25–33. [Google Scholar] [CrossRef]
  8. Xing, L.; Hu, M.S.; Wang, Y. Integrating ecosystem services value and uncertainty into regional ecological risk assessment: A case study of Hubei Province, Central China. Sci. Total Environ. 2020, 740, 140126. [Google Scholar] [CrossRef]
  9. Landis, W.G.; Wiegers, J.A. Perspective: Design considerations and a suggested approach for regional and comparative ecological risk assessment. Hum. Ecol. Risk Assess. 1997, 3, 287–297. [Google Scholar] [CrossRef]
  10. Fu, B.J.; Liang, D.; Lu, N. Landscape ecology: Coupling of pattern, process, and scale. Chin. Geogr. Sci. 2011, 21, 385–391. [Google Scholar] [CrossRef]
  11. Su, C.H.; Fu, B.J. Discussion on Links Among Landscape Pattern, Ecological Process, and Ecosystem Services. Chin. J. Nat. 2012, 34, 277–283. [Google Scholar]
  12. Chen, J.P.; Zhang, Y.; Yu, Y.J. Effect of MAUP in Spatial Autocorrelation. Acta Geogr. Sin. 2011, 66, 1597–1606. [Google Scholar]
  13. Wu, J. Effects of changing scale on landscape pattern analysis: Scaling relations. Landsc. Ecol. 2004, 19, 125–138. [Google Scholar] [CrossRef]
  14. Ju, H.; Niu, C.; Zhang, S.; Jiang, W.; Zhang, Z.; Zhang, X.; Yang, Z.; Cui, Y. Spatiotemporal patterns and modifiable areal unit problems of the landscape ecological risk in coastal areas: A case study of the Shandong Peninsula, China. J. Clean. Prod. 2021, 310, 127522. [Google Scholar] [CrossRef]
  15. Peng, J.; Zong, M.; Hu, Y.; Liu, Y.; Wu, J. Assessing Landscape Ecological Risk in a Mining City: A Case Study in Liaoyuan City, China. Sustainability 2015, 7, 8312–8334. [Google Scholar] [CrossRef]
  16. Zheng, K.J.; Li, C.; Wu, Y.M.; Gao, B.P.; Li, C.; Wu, Y. Temporal and spatial variation of landscape ecological risk and influential factors in Yunnan border mountainous area. Acta Ecol. Sin. 2022, 42, 7458–7469. [Google Scholar]
  17. Liu, K.X.; Wang, D.M.; Wei, Y.S.; Chang, G.L. Spatio-temporal evolution trend of multi-scale landscape ecological risk in Miyun Reservoir watershed. Acta Ecol. Sin. 2023, 43, 105–117. [Google Scholar]
  18. Gao, C.; Zhao, J.; Li, C.H.; Wei, W.; Wang, J.B.; Kang, C.Y. Grassland cover and ecological service function changes in Shiyang River basin. Pratacultural Sci. 2019, 36, 27–36. [Google Scholar]
  19. Zhong, K.W.; Li, J.L.; Zhang, X.D. Application of hybrid programming of vc and matlab in road extration from remote sensingimage. J. Geomat. 2007, 32, 10–12. [Google Scholar]
  20. Zhao, J.; Yang, D.H.; Pan, J.H. A study on spatial pattern of GDP in Lanzhou City based on spatialization and land utilization. J. Northwest Norm. Univ. 2010, 46, 92–96+102. [Google Scholar]
  21. Zhao, W.U.; Fu, B.J.; Chen, L.D. The effects of grain change on landscape indices. Quat. Sci. 2003, 23, 326–333. [Google Scholar]
  22. Zhang, L.L.; Zhao, Y.H.; Yin, S.; Fang, S.; Liu, X.J.; Pu, M.M. Gradient analysis of dry valley of Minjiang River landscape pattern, based on moving window method. Acta Ecol. Sin. 2014, 34, 3276–3284. [Google Scholar]
  23. Zuo, Q.; Zhou, Y.; Li, Q.; Wang, L.; Liu, J.Y.; He, N. Spatial and temporal variations of landscape ecological risk in the mountainous region of southwestern Hubei Province based on optimal scale. Chin. J. Ecol. 2023, 42, 1186–1196. [Google Scholar]
  24. Xu, Z.Y.; Hu, Y.F.; Liu, Y.; Yan, Y. A Review on the Accuracy Analysis of Spatial Scaling Data. Prog. Geogr. 2012, 31, 1574–1582. [Google Scholar]
  25. Li, Y.; Wen, F.G.; Yong, F.D.; Ze, X.L. Study on Ecological Risk of Land Use in Urbanization Watershed Based on RS and GIS: A Case Study of Songhua River Watershed in Harbin Section. Asian Agric. Res. 2013, 5, 61–65+69. [Google Scholar]
  26. Li, S.; Wang, L.; Zhao, S.; Gui, F.; Le, Q. Landscape Ecological Risk Assessment of Zhoushan Island Based on LULC Change. Sustainability 2023, 15, 9507. [Google Scholar] [CrossRef]
  27. Yu, H.; Liu, X.L.; Zhao, T.; Zhang, M.; Nian, L.; Li, X. Landscape ecological risk assessment of Qilian Mountain National Park based on landscape pattern. Ecol. Sci. 2022, 41, 99–107. [Google Scholar]
  28. Yan, W.B.; Zhang, X.X.; Yao, J.; Xu, P.; Yu, Q.P. Spatial and temporal characteristics of Yancheng regional development based on GIS. Geospat. Inf. 2013, 11, 104–106+110+111. [Google Scholar]
  29. Liang, X.; Guan, Q.; Clarke, K.C.; Liu, S.; Wang, B.; Yao, Y. Understanding the drivers of sustainable land expansion using a patch-generating land use simulation (PLUS) model: A case study in Wuhan, China. Comput. Environ. Urban Syst. 2021, 85, 101569. [Google Scholar] [CrossRef]
  30. Yang, S.; Su, H.; Zhao, G.P. Multi-scenario simulation of urban ecosystem service value based on PLUS model: A case study of Hanzhong city. J. Arid. Land Resour. Environ. 2022, 36, 86–95. [Google Scholar]
  31. Qing, M.; Zhao, J.; Feng, C.; Huang, Z.H.; Wen, Y.Y.; Zhang, W.J. Response of ecosystem carbon storage service to land-use change in Shiyang River Basin from 1980 to 2030. Acta Ecol. Sin. 2022, 42, 9525–9536. [Google Scholar]
  32. Wang, Q.Z.; Guan, Q.Y.; Sun, Y.F.; Du, Q.Q.; Xiao, X.; Luo, H.P.; Zhang, J.; Mi, J.M. Simulation of future land use/cover change (LUCC) in typical watersheds of arid regions under multiple scenarios. J. Environ. Manag. 2023, 335, 117543. [Google Scholar] [CrossRef]
  33. Miao, X.H.; Dong, Z.F.; Hao, C.X. Ecological Protection Red Line Managementand Control Policy Framework in Gansu Qilian Mountains. Ecol. Econ. 2018, 34, 214–218. [Google Scholar]
  34. Yang, K.; Xin, G.X.; Jiang, H.Y.; Yang, C.X. Study on Spatiotemporal Changes of Landscape Ecological Risk Based on the Optimal Spatial Scale: A Case Study of Jiangjin District, Chongqing City. J. Ecol. Rural Environ. 2021, 37, 576–586. [Google Scholar]
  35. Chen, Z.; Luo, X.B.; Gao, Y.H.; Ye, Q.Y.; Wang, S.M. Modeling and multi-scale analysis of the spatial heterogeneity of land surface temperature in Chongqing based on Semi-Variogram. J. Geo Inf. Sci. 2019, 21, 1051–1060. [Google Scholar]
  36. Guo, H.J.; Cai, Y.P.; Li, B.W.; Tang, Y.; Qi, Z.; Huang, Y.; Yang, Z. An integrated modeling approach for ecological risks assessment under multiple scenarios in Guangzhou, China. Ecol. Indic. 2022, 142, 109270. [Google Scholar] [CrossRef]
  37. Gao, B.P.; Li, C.; Wu, Y.M.; Zheng, K.J.; Wu, Y. Landscape ecological risk assessment and influencing factors in ecological conservation area in Sichuan-Yunnan provinces, China. Chin. J. Appl. Ecol. 2021, 32, 1603–1613. [Google Scholar]
  38. Zhang, Q.; Chen, C.; Wang, J.; Yang, D.; Zhang, Y.; Wang, Z.; Gao, M. The spatial granularity effect, changing landscape patterns, and suitable landscape metrics in the Three Gorges Reservoir Area, 1995–2015. Ecol. Indic. 2020, 114, 106259. [Google Scholar] [CrossRef]
  39. Guo, L.; Liu, R.; Men, C.; Wang, Q.; Miao, Y.; Shoaib, M.; Wang, Y.; Jiao, L.; Zhang, Y. Multiscale spatiotemporal characteristics of landscape patterns, hotspots, and influencing factors for soil erosion. Sci. Total Environ. 2021, 779, 146474. [Google Scholar] [CrossRef]
  40. Nouri, H.; Anderson, S.; Sutton, P.; Beecham, S.; Nagler, P.; Jarchow, C.J.; Roberts, D.A. NDVI, scale invariance and the modifiable areal unit problem: An assessment of vegetation in the Adelaide Parklands. Sci. Total Environ. 2017, 584–585, 11–18. [Google Scholar] [CrossRef]
  41. Ai, J.; Yu, K.; Zeng, Z.; Yang, L.; Liu, Y.; Liu, J. Assessing the dynamic landscape ecological risk and its driving forces in an island city based on optimal spatial scales: Haitan Island, China. Ecol. Indic. 2022, 137, 108771. [Google Scholar] [CrossRef]
  42. Zhang, X.B.; Shi, P.J.; Luo, J.; Liu, H.L.; Wei, W. The Ecological Risk Assessment of Arid Inland River Basin at the Landscape Scale: A Case Study on Shiyang River Basin. J. Nat. Resour. 2014, 29, 410–419. [Google Scholar]
Figure 1. Location of the study area.
Sustainability 15 15883 g001
Figure 2. Response curve of landscape metrics to increasing grid size in Shiyang River Basin in 2020 (The horizontal coordinate is the grid size, and the vertical coordinate is the value of the corresponding index).
Sustainability 15 15883 g002
Figure 3. Information loss of landscape area at different granularities.
Sustainability 15 15883 g003
Figure 4. Spatial distribution of LER in Shiyang River Basin from 2000 to 2020.
Sustainability 15 15883 g004
Figure 5. Local autocorrelation clustering map of LER in the Shiyang River Basin.
Sustainability 15 15883 g005
Figure 6. Simulation of spatial distribution of land use types under different scenarios in 2030.
Sustainability 15 15883 g006
Figure 7. Spatial distribution of the LER levels in the study area under different scenarios in 2030.
Sustainability 15 15883 g007
Figure 8. LISA cluster map of LER in the study area under different scenarios in 2030.
Sustainability 15 15883 g008
Table 1. Parameters of the semivariogram at different scales.
Scale Size (km)Best ModelNuggetStillNugget/StillRange (m)RSSR2
3Exponential3.8 × 10−52.05 × 10−40.1854382,2002.09 × 10−100.988
3.5Exponential3.6 × 10−51.99 × 10−40.1809369,0002.25 × 10−100.987
4Exponential3.4 × 10−51.87 × 10−40.1818333,9002.186 × 10−100.987
4.5Exponential3.2 × 10−51.99 × 10−40.1608367,8001.999 × 10−100.989
5Exponential2.9 × 10−51.98 × 10−40.1465397,5002.640 × 10−100.985
Table 2. Area and proportion of different LER grades in the study area from 2000 to 2020.
Category200020102020
Area (km2)Proportion (%)Area (km2)Proportion (%)Area (km2)Proportion (%)
Lowest risk5368.513.235608.513.825541.513.66
Lower risk5677.2513.995815.7514.33589314.52
Medium risk6609.2516.296866.516.926805.7516.77
Higher risk6962.7517.166920.2517.05690817.02
Highest risk15,961.7539.3315,368.537.8715,431.2538.03
LER mean0.047620.047430.04731
Table 3. Comparison of landscape types and areas under different scenarios in the study area in 2020 and 2030.
Category2020 (km2)2030 (km2)Amount of Area Change (2020–2030) (km2)
NDECCCNDECCC
cultivated land7261.837293.767260.727359.1031.93−1.1197.27
forest land2599.622567.072603.302512.85−32.553.68−86.77
grassland11,004.8511,084.1911,102.1611,073.4379.3497.3068.58
water area170.45168.93167.49174.68−1.53−2.974.22
construction land636.28655.73655.69655.7319.4419.4119.44
unused land18,838.4518,739.6718,720.0018,733.55−98.78−118.45−104.90
Table 4. Comparison of LER level area under different scenarios in the study area in 2020 and 2030.
CategoryStatus Quo (2020)ND (2030)EC (2030)CC (2030)
Area (km2)Proportion (%)Area (km2)Proportion (%)Area (km2)Proportion (%)Area (km2)Proportion (%)
Lowest risk5541.513.665613.7513.835626.2513.865608.513.82
Lower risk589314.525896.514.535962.7514.695815.7514.33
Medium risk6805.7516.776810.2516.786753.2516.646866.516.92
Higher risk690817.026911.7517.03687016.936920.2517.05
Highest risk15,431.2538.0315,347.2537.8215,367.2537.8715,368.537.87
LER mean0.047310.047260.047250.04728
Disclaimer/Publisher’s Note: The statements, opinions and data contained in all publications are solely those of the individual author(s) and contributor(s) and not of MDPI and/or the editor(s). MDPI and/or the editor(s) disclaim responsibility for any injury to people or property resulting from any ideas, methods, instructions or products referred to in the content.

