


Designing the Distribution Network of Essential Items in the Critical Conditions of Earthquakes and COVID-19 Simultaneously


Abstract
:1. Introduction
- What could happen and what factors need to be considered when creating a distribution network for necessities in the event of COVID-19 and earthquakes occurring simultaneously?
- How can a distribution network be made more efficient to guarantee prompt and effective delivery of necessities when COVID-19 and earthquakes occur simultaneously?
2. Literature Review
2.1. Related Work
2.1.1. Location and Allocation
2.1.2. Transportation
2.1.3. Location and Transportation
2.2. Research Gap and Contributions
- Considering reliable support DCs for affected population centres to improve reliability.
- Providing a bi-objective mathematical model to minimize the time spent transporting relief goods and related logistics costs is also considered.
- The uncertainties related to earthquake probability, earthquake magnitude, and the probability of DC destruction are considered using a scenario-based approach.
- Public facilities and establishments are considered DCs.
- Turkey has been used as a case study to describe the model’s performance and the application of the described method.
- Considering distance restriction between people at the demand point.
- Reusing vehicles during the time horizon and in each period is considered.
3. Problem Statement
3.1. Assumptions
- The capacity of distribution and backup centers is specified, but the capacity of central warehouses is considered unlimited.
- The uncertainties of the model, including the probability of an earthquake, the likelihood of failure of local DCs, and demand, were modeled using a probabilistic scenario-based approach.
- If the supply of goods through the main DC is not possible, goods will be supplied through backup centers.
- Goods have priority, reflected in the cost of a shortage of goods.
- Each vehicle can make multiple trips during the time horizon and in each period.
- Two methods of land and air transportation are used to transport goods.
- Vehicles are homogeneous in each transportation mode.
- The number and location of affected areas are identified.
- The possibility of shortages exists.
- The capacity of vehicles is specified.
- The distances between nodes are identified.
- Multiple periods are considered in the model.
- Multiple types of goods are considered in the model.
3.2. Sets
| Set of warehouses during both earthquakes and COVID-19 disasters ; | |
| Set of DCs during the both earthquakes and COVID-19 disasters ; | |
| Set of reliable DCs that can be used as a backup during both earthquakes and COVID-19 disasters | |
| Set of damaged points for earthquake and COVID-19 disasters ; | |
| Set of vehicles ; | |
| Set of vehicles of type in the warehouse | |
| Set of vehicles of type in the DC | |
| Set of number of trips of each vehicle type in each period t | |
| Set of scenarios ; | |
| Set of time periods for earthquakes and COVID-19 disaster; | |
| Set of goods ; |
3.3. Model Parameters
| Fixed cost of establishing a warehouse ; | |
| Fixed cost of establishing the DC | |
| Size of the product, which includes the volume and weight of the product; | |
| The demand of good in damaged point in scenario in period during the earthquakes and COVID-19 disasters; | |
| The capacity of DC ; | |
| The cost of each transportation unit from warehouse to the DC by vehicle type | |
| The cost of each transportation unit from DC to the damaged point by vehicle type ; | |
| Transfer time of products from the warehouse to the DC by vehicle type | |
| Transfer time of products from the DC to the damaged point by vehicle type | |
| Probability of scenarios during both earthquakes and COVID-19 disasters; | |
| Probability of destruction of the DC under scenario | |
| Shortage cost of products during the two earthquakes and COVID-19 disasters; | |
| The capacity of vehicle type , which includes the volume and weight capacity of the vehicle; | |
| Distance from warehouse to DC ; | |
| Distance between the DC to the damaged point ; | |
| Maximum allowable distance between people in damaged point | |
| Distance between people in damaged point | |
| Large positive number; |
3.4. Decision Variables
| If the central is selected in the scenario s in the period is 1; otherwise, 0 | |
| If DC is selected in scenario s in period is 1; otherwise, 0 | |
| If DC is selected to the warehouse in scenario in period is 1; otherwise, 0 | |
| If the damaged point be assigned to the DC in scenario in the period 1; otherwise, 0 | |
| If the damaged point is assigned to the DC as the leading supplier in scenario in period is 1; otherwise, 0 | |
| If damaged is assigned to the DC as a backup supplier in scenario in period ; otherwise, 0 | |
| The quantity of product that transfers from the central warehouse to the DC by vehicle type around with vehicle in scenario in period ; | |
| The quantity of the backup product that is transported from the warehouse to the DC by vehicle type in round and by vehicle in scenario in period ; | |
| The quantity of the product that is transported from the DC to the damaged point by vehicle type in round and by Vehicle in scenario in period ; | |
| Shortage amount of commodity at incident point in scenario in period ; | |
| If the route is taken by vehicle type in round or with vehicle in scenario in period is 1; otherwise, 0 | |
| If the route to is taken by vehicle type ‘ at round or by Vehicle in scenario in period is 1; otherwise, 0 |
3.5. Mathematical Model
| s.t | ||
| (3) | ||
| (4) | ||
| (5) | ||
| (6) | ||
| (7) | ||
| (8) | ||
| (9) | ||
| (10) | ||
| (11) | ||
| (12) | ||
| (13) | ||
| (14) | ||
| (15) | ||
| (16) | ||
| (17) | ||
| (18) | ||
| (19) | ||
| (20) | ||
| (21) | ||
| (22) | ||
| (23) | ||
| (24) | ||
| (25) |
3.6. Linearity
- In issues related to optimization, the method is used to linearize nonlinear functions.
- A matching auxiliary equality constraint and an auxiliary variable are introduced for each intermediate nonlinear component of the function [44].
- A nonlinear optimization problem can be made linear by using this strategy.
- Linearization based on an auxiliary variable is a commonly employed method in optimization.
| Binary auxiliary variable for linearization | |
| Continuous auxiliary variable for linearization | |
| Continuous auxiliary variable for linearization | |
| Binary auxiliary variable for linearization |
| (26) | ||
| (27) | ||
| (28) | ||
| (29) | ||
| (30) | ||
| (31) | ||
| (32) |
4. Solution Methods
4.1. Goal Programming
- Ascertain the resources needed to accomplish a desired set of goals.
- Assess the extent to which the objectives have been met in relation to the resources at hand.
- Offer the most fulfilling solution given the different resources available and the goals’ relative importance.
| The states | The variables deviating from the ideal | Description |
| First | Full achievement of the goal | |
| Second | Overtaking of the goal. | |
| Third | Failure to achieve the goal | |
| Fourth | This is not possible |
4.2. Lp-Metrics Approach
5. Case Study
6. Comparing Solution Methods
7. Sensitivity Analysis
7.1. Demand
7.2. Transportation Cost
7.3. Failure Rate Percentage
7.4. Maximum Allowable Distance between People
8. Managerial Insights
- In the event of a crisis, it is essential to give first priority to the distribution of resources like labour, supplies, and tools. The author can make recommendations for creating a system for allocating resources that takes into account things like population density, the extent of the damage, and the urgent needs of impacted communities. As a result, resources may be distributed by the government where they are most needed.
- Effective inter-stakeholder collaboration is crucial to disaster management. The management might suggest a strong communication system that facilitates real-time information exchange between governmental institutions, relief groups, and communities that were impacted. Coordination, decision-making, and the efficient use of resources may all benefit from this.
- The manager can stress how crucial it is for local government officials and non-governmental organizations (NGOs) to work together on disaster assistance. These organizations frequently possess important information about the surroundings, available resources, and impacted areas. Government agencies can better understand local conditions and enable more specialized assistance efforts by forming partnerships.
- The manager might emphasize the importance of making data-driven decisions while managing a crisis. The government can learn about the level of damage, population relocation, and resource needs by utilizing technologies like satellite photography, remote sensing, and data analytics. Better decision-making, resource planning, and efficient allocation may all be aided by this data-driven strategy.
- Regulatory roadblocks and ineffective bureaucracy can impede aid operations in times of crisis. By reducing paperwork, simplifying procedures, and using effective approval mechanisms, the author can recommend streamlining administrative operations. This can hasten relief efforts and guarantee that impacted populations receive aid on time.
- Finally, management should emphasize how crucial it is to make investments in catastrophe preparedness measures. The government may reduce the effect of future catastrophes by investing in early warning systems, holding exercises, and proactively creating disaster response plans. When comparable situations develop, having a long-term outlook on disaster management can assist in expeditiously and suitably arranging resources.
9. Conclusions and Future Suggestion
Author Contributions
Funding
Institutional Review Board Statement
Informed Consent Statement
Data Availability Statement
Conflicts of Interest
References
- Abbasi, S.; Choukolaei, H.A. A systematic review of green supply chain network design literature focusing on carbon policy. Decis. Anal. J. 2023, 6, 100189. [Google Scholar] [CrossRef]
- Seneviratne, K.; David, B.; Chaminda, P. Disaster knowledge factors in managing disasters successfully. Int. J. Strateg. Prop. Manag. 2010, 14, 376–390. [Google Scholar] [CrossRef]
- Tehrani, N.A.; Makhdoum, M. Implementing a spatial model of Urban Carrying Capacity Load Number (UCCLN) to monitor the environmental loads of urban ecosystems. Case study: Tehran metropolis. Ecol. Indic. 2013, 32, 197–211. [Google Scholar] [CrossRef]
- Edrissi, A.; Nourinejad, M.; Matthew, J. Transportation network reliability in emergency response. Transp. Res. Part E Logist. Transp. Rev. 2015, 80, 56–73. [Google Scholar] [CrossRef]
- Jica, C. The Study on Seismic Micro Zoning of the Greater Tehran Area in the Islamic Republic of Iran; Pacific Consultants International Report; OYO Cooperation: Tokyo, Japan, 2000; pp. 291–390. [Google Scholar]
- Jain, P.; Dhanraj, P.T.; Vaibhav, S.N. Is the Implementation of Big Data Analytics in Sustainable Supply Chain Really a Challenge? The Context of the Indian Manufacturing Sector. Int. J. Innov. Technol. Manag. 2023, 20, 2350033. [Google Scholar] [CrossRef]
- Drake, J.M.; Éric, M.; Kamal, J.K.G.; Meredith, W.-D.; Brian, B.; Marshall, S.; Lynne, S.; Christine, C.F.; Cristian, M. Disasters collide at the intersection of extreme weather and infectious diseases. Ecol. Lett. 2023, 26, 485–489. [Google Scholar] [CrossRef] [PubMed]
- Chen, Y.; Zhao, Q.; Huang, K.; Xi, X. A Bi-objective optimisation model for contract design of humanitarian relief goods procurement considering extreme disasters. Socio-Econ. Plan. Sci. 2022, 81, 101214. [Google Scholar] [CrossRef]
- World Bank, & Global Facility for Disaster Reduction and Recovery. Global Rapid Post-Disaster Damage Estimation (GRADE) Report: Mw 7.8 Türkiye-Syria Earthquake—Assessment of the Impact on Syria. 2023. Available online: https://elibrary.worldbank.org/doi/abs/10.1596/39529 (accessed on 20 February 2023).
- Doocy, S.; Daniels, A.; Packer, C.; Dick, A.; Kirsch, T.D. The Human Impact of Earthquakes: A Historical Review of Events 1980-2009 and Systematic Literature Review. PLoS Curr. 2013, 5. [Google Scholar] [CrossRef]
- Vlachos, I.P.; Thiesset, E.; Singh, R.; Malindretos, G. The role of wholesale markets in food supply chain resilience. Int. J. Value Chain Manag. 2023, 14, 346–375. [Google Scholar] [CrossRef]
- Tofighi, S.; Torabi, S.; Mansouri, S. Humanitarian logistics network design under mixed uncertainty. Eur. J. Oper. Res. 2016, 250, 239–250. [Google Scholar] [CrossRef]
- Alem, D.; Clark, A.; Moreno, A. Stochastic network models for logistics planning in disaster relief. Eur. J. Oper. Res. 2016, 255, 187–206. [Google Scholar] [CrossRef]
- Abbasi, S.; Maryam, M.; Ilias, V.; Mohammad, T. Designing the Location–Routing Problem for a Cold Supply Chain Considering the COVID-19 Disaster. Sustainability 2023, 15, 15490. [Google Scholar] [CrossRef]
- Abbasi, S.; Maryam, D.-M.; Armin, G.K. Designing sustainable recovery network of end-of-life product during the COVID-19 pandemic: A real and applied case study. Discret. Dyn. Nat. Soc. 2022, 2022, 6967088. [Google Scholar] [CrossRef]
- Abbasi, S.; Zahmatkesh, S.; Bokhari, A.; Hajiaghaei-Keshteli, M. Designing a vaccine supply chain network considering environmental aspects. J. Clean. Prod. 2023, 417, 137935. [Google Scholar] [CrossRef]
- Di Giulio, G.M.; Mendes, I.M.; Campos, F.D.R.; Nunes, J. Risk governance in the response to global health emergencies: Understanding the governance of chaos in Brazil’s handling of the COVID-19 pandemic. Health Policy Planning 2023, 38, 593–608. [Google Scholar] [CrossRef] [PubMed]
- Balcik, B.; Beamon, B.M.; Krejci, C.C.; Muramatsu, K.M.; Ramirez, M. Coordination in humanitarian relief chains: Practices, challenges and opportunities. Int. J. Prod. Econ. 2010, 126, 22–34. [Google Scholar] [CrossRef]
- Yang, C.; Wang, J. A mathematical model for the novel coronavirus epidemic in Wuhan, China. Math. Biosci. Eng. 2020, 17, 2708–2724. [Google Scholar] [CrossRef]
- Emrouznejad, A.; Abbasi, S.; Sıcakyüz, C. Supply chain risk management: A content analysis-based review of existing and emerging topics. Supply Chain Anal. 2023, 3, 100031. [Google Scholar] [CrossRef]
- Ghasemi, P.; Khalili-Damghani, K.; Hafezalkotob, A.; Raissi, S. Uncertain multiobjective multi- commodity multi-period multi-vehicle location-allocation model for earthquake evacuation planning. Appl. Math. Comput. 2019, 350, 105–132. [Google Scholar]
- Boonmee, C.; Arimura, M.; Asada, T. Facility location optimisation model for emergency humanitarian logistics. Int. J. Disaster Risk Reduct. 2017, 24, 485–498. [Google Scholar] [CrossRef]
- Cotes, N.; Cantillo, V. Including deprivation costs in facility location models for humanitarian relief logistics. Socio-Econ. Plan. Sci. 2019, 65, 89–100. [Google Scholar] [CrossRef]
- Ahmed, M.; Juberi, H.; Bari, A.M.; Rahman, M.A.; Rahman, A.; Arefin, A.; Vlachos, I.; Quader, N. Investigation of the effect of vibration in the multi-objective optimization of dry turning of hardened steel. Int. J. Ind. Eng. Oper. Manag. 2023, 5, 26–53. [Google Scholar] [CrossRef]
- Haghi, M.; Ghomi, S.M.T.F.; Jolai, F. Developing a robust multiobjective model for pre/post-disaster times under un-certainty in demand and resource. J. Clean. Prod. 2017, 154, 188–202. [Google Scholar] [CrossRef]
- Rahmani, D.; Zandi, A.; Peyghaleh, E.; Siamakmanesh, N. A robust model for a humanitarian relief network with backup covering under disruptions: A real world application. Int. J. Disaster Risk Reduct. 2018, 28, 56–68. [Google Scholar] [CrossRef]
- Abbasi, S.; Daneshmand-Mehr, M.; Kanafi, A.G. Green Closed-Loop Supply Chain Network Design During the Coronavirus (COVID-19) Pandemic: A Case Study in the Iranian Automotive Industry. Environ. Model. Assess. 2022, 28, 69–103. [Google Scholar] [CrossRef]
- Dong, S.; Gao, X.; Mostafavi, A.; Gao, J.; Gangwal, U. Characterizing resilience of flood-disrupted dynamic trans-portation network through the lens of link reliability and stability. Reliab. Eng. Syst. Saf. 2023, 232, 109071. [Google Scholar] [CrossRef]
- Tirkolaee, E.B.; Goli, A.; Ghasemi, P.; Goodarzian, F. Designing a sustainable closed-loop supply chain network of face masks during the COVID-19 pandemic: Pareto-based algorithms. J. Clean. Prod. 2022, 333, 130056. [Google Scholar] [CrossRef]
- Ghasemi, P.; Khalili-Damghani, K.; Hafezalkotob, A.; Raissi, S. Stochastic optimisation model for distribution and evacuation planning (A case study of Tehran earthquake). Socio. Econ. Plan. Sci. 2020, 71, 100745. [Google Scholar] [CrossRef]
- Conges, A.; Breard, L.; Patruno, W.; Ouro-Sao, A.; Salatge, N.; Fertier, A.; Lauras, M.; Graham, J.; Benaben, F. Situational Awareness and Deci-sion-Making in a Crisis Situation: A Management Cell in Virtual Reality. Available online: https://ssrn.com/abstract=4211466 (accessed on 6 September 2022).
- Najafi, M.; Eshghi, K.; Dullaert, W. A multiobjective robust optimisation model for logistics planning in the earth-quake response phase. Transp. Res. Part E Logistic. Transp. Rev. 2013, 49, 217–249. [Google Scholar] [CrossRef]
- Maghfiroh, M.F.; Hanaoka, S. Multi-modal relief distribution model for disaster response operations. Prog. Disaster Sci. 2020, 6, 100095. [Google Scholar] [CrossRef]
- Li, C.; Han, P.; Zhou, M.; Gu, M. Design of multimodal hub-and-spoke transportation network for emergency relief under COVID-19 pandemic: A meta-heuristic approach. Appl. Soft Comput. 2022, 133, 109925. [Google Scholar] [CrossRef]
- Safeer, M.; Anbuudayasankar, S.; Balkumar, K.; Ganesh, K. Analyzing Transportation and Distribution in Emergency Humanitarian Logistics. Procedia Eng. 2014, 97, 2248–2258. [Google Scholar] [CrossRef]
- Haghgoo, F.; Navaei, A.; Aghsami, A.; Jolai, F.; Abraham, A. Designing a Humanitarian Supply Chain for Pre and Post Disaster Planning with Transshipment and Considering Perishability of Products. In Intelligent Systems Design and Applications; Springer: Berlin/Heidelberg, Germany, 2022. [Google Scholar] [CrossRef]
- Anaya-Arenas, A.M.; Renaud, J.; Ruiz, A. Relief distribution networks: A systematic review. Ann. Oper. Res. 2014, 223, 53–79. [Google Scholar] [CrossRef]
- Shokr, I.; Jolai, F.; Bozorgi-Amiri, A. A novel humanitarian and private sector relief chain network design model for disaster response. Int. J. Disaster Risk Reduct. 2021, 65, 102522. [Google Scholar] [CrossRef]
- Zokaee, M.; Tavakkoli-Moghaddam, R.; Rahimi, Y. Post-disaster reconstruction supply chain: Empirical optimization study. Autom. Constr. 2021, 129, 103811. [Google Scholar] [CrossRef]
- Hosseini-Motlagh, S.-M.; Ghatreh Samani, M.R.; Homaei, S. Design of control strategies to help prevent the spread of COVID-19 pandemic. Eur. J. Oper. Res. 2023, 304, 219–238. [Google Scholar] [CrossRef] [PubMed]
- Li, L.; Gong, Y.; Wang, Z.; Liu, S. Big data and big disaster: A mechanism of supply chain risk management in global logistics industry. Int. J. Oper. Prod. Manag. 2023, 43, 274–307. [Google Scholar] [CrossRef]
- Ehsani, B.; Karimi, H.; Bakhshi, A.; Aghsami, A.; Rabbani, M. Designing humanitarian logistics network for managing epidemic outbreaks in disasters using Internet-of-Things. A case study: An earthquake in Salas-e-Babajani city. Comput. Ind. Eng. 2023, 175, 108821. [Google Scholar] [CrossRef]
- Tian, Q.; Lin, Y.H.; Wang, D.Z.; Liu, Y. Planning for modular-vehicle transit service system: Model formulation and solution methods. Transp. Res. Part C: Emerg. Technol. 2022, 138, 103627. [Google Scholar] [CrossRef]
- Najman, J.; Bongartz, D.; Mitsos, A. Linearisation of McCormick relaxations and hybridisation with the auxiliary variable method. J. Glob. Optim. 2021, 80, 731–756. [Google Scholar] [CrossRef]
- Chang, C.T. An efficient linearisation approach for mixed-integer problems. Eur. J. Oper. Res. 2000, 123, 652–659. [Google Scholar] [CrossRef]
- Oral, M.; Kettani, O. A linearisation procedure for quadratic and cubic mixed-integer problems. Oper. Res. 1992, 40 (Suppl. S1), S109–S116. [Google Scholar] [CrossRef]
- Asghari, M.; Fathollahi-Fard, A.M.; Mirzapour Al-E-Hashem SM, J.; Dulebenets, M.A. Transformation and line-arisation techniques in optimisation: A state-of-the-art survey. Mathematics 2022, 10, 283. [Google Scholar] [CrossRef]
- Dagistanli, H.A.; Üstün, O. An integrated Multi-Criteria Decision Making and Multi-Choice Conic Goal Programming approach for customer evaluation and manager assignment. Decis. Anal. J. 2023, 8, 100270. [Google Scholar] [CrossRef]
- Taherdoost, H.; Madanchian, M. Multi-Criteria Decision Making (MCDM) Methods and Concepts. Encyclopedia 2023, 3, 77–87. [Google Scholar] [CrossRef]
- Lee, J.R.; Naor, A. Lp metrics on the Heisenberg group and the Goemans-Linial conjecture. In Proceedings of the 2006 47th Annual IEEE Symposium on Foundations of Computer Science (FOCS’06), Berkeley, CA, USA, 21–24 October 2006; pp. 99–108. [Google Scholar]
- Xu, Z.-B.; Cao, F.-L. Simultaneous Lp-approximation order for neural networks. Neural Netw. 2005, 18, 914–923. [Google Scholar] [CrossRef]
- Mahdian, M.; Ye, Y.; Zhang, J. Improved approximation algorithms for metric facility location problems. In Proceedings of the Approximation Algorithms for Combinatorial Optimisation: 5th International Workshop, APPROX 2002, Rome, Italy, 17–21 September 2002; Proceedings 5. Springer: Berlin/Heidelberg, Germany, 2002; pp. 229–242. [Google Scholar]
- Available online: https://en.wikipedia.org/wiki/2023_Turkey%E2%80%93Syria_earthquake (accessed on 6 February 2023).
- Available online: https://disasterphilanthropy.org/disasters/2023-turkey-syria-earthquake (accessed on 27 October 2023).
- Available online: https://www.worldvision.org/disaster-relief-news-stories/2023-turkey-and-syria-earthquake-faqs (accessed on 7 February 2023).
- Available online: https://www.preventionweb.net/news/preliminary-report-february-6-2023-earthquakes-turkiye (accessed on 6 February 2023).
- Available online: https://www.un.org/en/turkiye-syria-earthquake-response (accessed on 6 February 2023).
- Available online: https://www.directrelief.org/2023/05/turkey-syria-earthquake-three-month-update/ (accessed on 5 February 2023).
- Available online: https://www.nytimes.com/interactive/2023/02/06/world/turkey-earthquake-damage.html (accessed on 6 February 2023).
- Available online: https://cartoblography.com/2023/02/15/maps-of-the-turkey-syria-earthquakes/ (accessed on 15 February 2023).
- Available online: https://redeemerpres.org/aid-for-turkey (accessed on 8 February 2023).


| Authors | Objective Functions | Kind of Parameters | Number of Products | Decision Level | Time Window | Kind of Disaster | Case Study | Solution Method | |||||||
|---|---|---|---|---|---|---|---|---|---|---|---|---|---|---|---|
| Cost | Time | Unmet Demand | Certain | Uncertain | Single | Multi | Location | Allocation | Transportation | Distribution | |||||
| Tofighi et al. (2016) [12] | ✓ | ✓ | ✓ | ✓ | ✓ | ✓ | - | ✓ | Meta-Heuristic | ||||||
| Cotes and Cantillo (2019) [23] | ✓ | ✓ | ✓ | - | Exact | ||||||||||
| Yang and Wang (2020) [19] | ✓ | ✓ | ✓ | ✓ | COVID-19 | Exact | |||||||||
| Maghfiroh et al. (2020) [33] | ✓ | ✓ | ✓ | ✓ | ✓ | ✓ | - | ✓ | Heuristic | ||||||
| Shokr et al. (2021) [38] | ✓ | ✓ | ✓ | ✓ | - | Exact | |||||||||
| Zokaee et al. (2021) [39] | ✓ | ✓ | ✓ | ✓ | ✓ | Earthquake | ✓ | Exact | |||||||
| Babaee-Tirkolaee et al. (2022) [29] | ✓ | ✓ | ✓ | ✓ | ✓ | COVID-19 | ✓ | Meta-Heuristic | |||||||
| Hosseini-Motlagh et al. (2023) [40] | ✓ | ✓ | ✓ | ✓ | COVID-19 | ✓ | Exact | ||||||||
| Li et al. (2023) [41] | ✓ | ✓ | ✓ | ✓ | ✓ | COVID-19 | Meta-Heuristic | ||||||||
| Ehsani et al. (2023) [42] | ✓ | ✓ | ✓ | ✓ | ✓ | ✓ | COVID-19 | ✓ | Exact | ||||||
| This Study | ✓ | ✓ | ✓ | ✓ | ✓ | ✓ | ✓ | ✓ | ✓ | ✓ | Earthquake COVID-19 | ✓ | Exact | ||
| Earthquake Scenario | Scenario1 | Scenario2 | Scenario3 | Scenario4 |
|---|---|---|---|---|
| Fault | Location 1 | Location 2 | Location 3 | Location 3 |
| Length | 68 | 74 | 32 | 20 |
| Width | 22 | 45 | 12 | 9 |
| Severity of occurrence | 3.5 | 8.5 | 60.1 | 7.1 |
| Probability of occurrence | 0.40 | 0.66 | 0.14 | 0.5 |
| Commodity | Volume () | Weight (kg) | Shortage Cost ($) | Discharge Time/Loading Time (Minutes) |
|---|---|---|---|---|
| Non-consumable | 0.2 | 38 | 25 | 0.1 |
| Consumable | 0.17 | 5 | 77 | 0.03 |
| Vehicles | Weight Capacity (tons) | ) | Speed (km/h) | Cost ($) |
|---|---|---|---|---|
| Kind of one | 1.2 | 30 | 100 | 8 |
| Kind of two | 5 | 61 | 70 | 3 |
| Central Warehouse | Local DC | Backup DC | |
|---|---|---|---|
| Capacity | 2 | 5000 | 4000 |
| Construction cost | 1.1 | 0.20 | 0.8 |
| Earthquake Scenario | Scenario1 | Scenario2 | Scenario3 | Scenario4 |
|---|---|---|---|---|
| District 15 | 22 | 17 | 21 | 15 |
| District 16 | 30 | 10 | 15 | 12 |
| District 18 | 40 | 20 | 30 | 15 |
| District 19 | 30 | 10 | 20 | 16 |
| District 20 | 60 | 40 | 56 | 39 |
| Damaged Points | Scenario1 | Scenario2 | Scenario3 | Scenario4 |
|---|---|---|---|---|
| 1 | 3300 | 2088 | 7176 | 5621 |
| 2 | 5791 | 1122 | 6611 | 2011 |
| 3 | 4210 | 1081 | 8058 | 6344 |
| 4 | 1010 | 520 | 7622 | 5031 |
| 5 | 1329 | 850 | 5445 | 4310 |
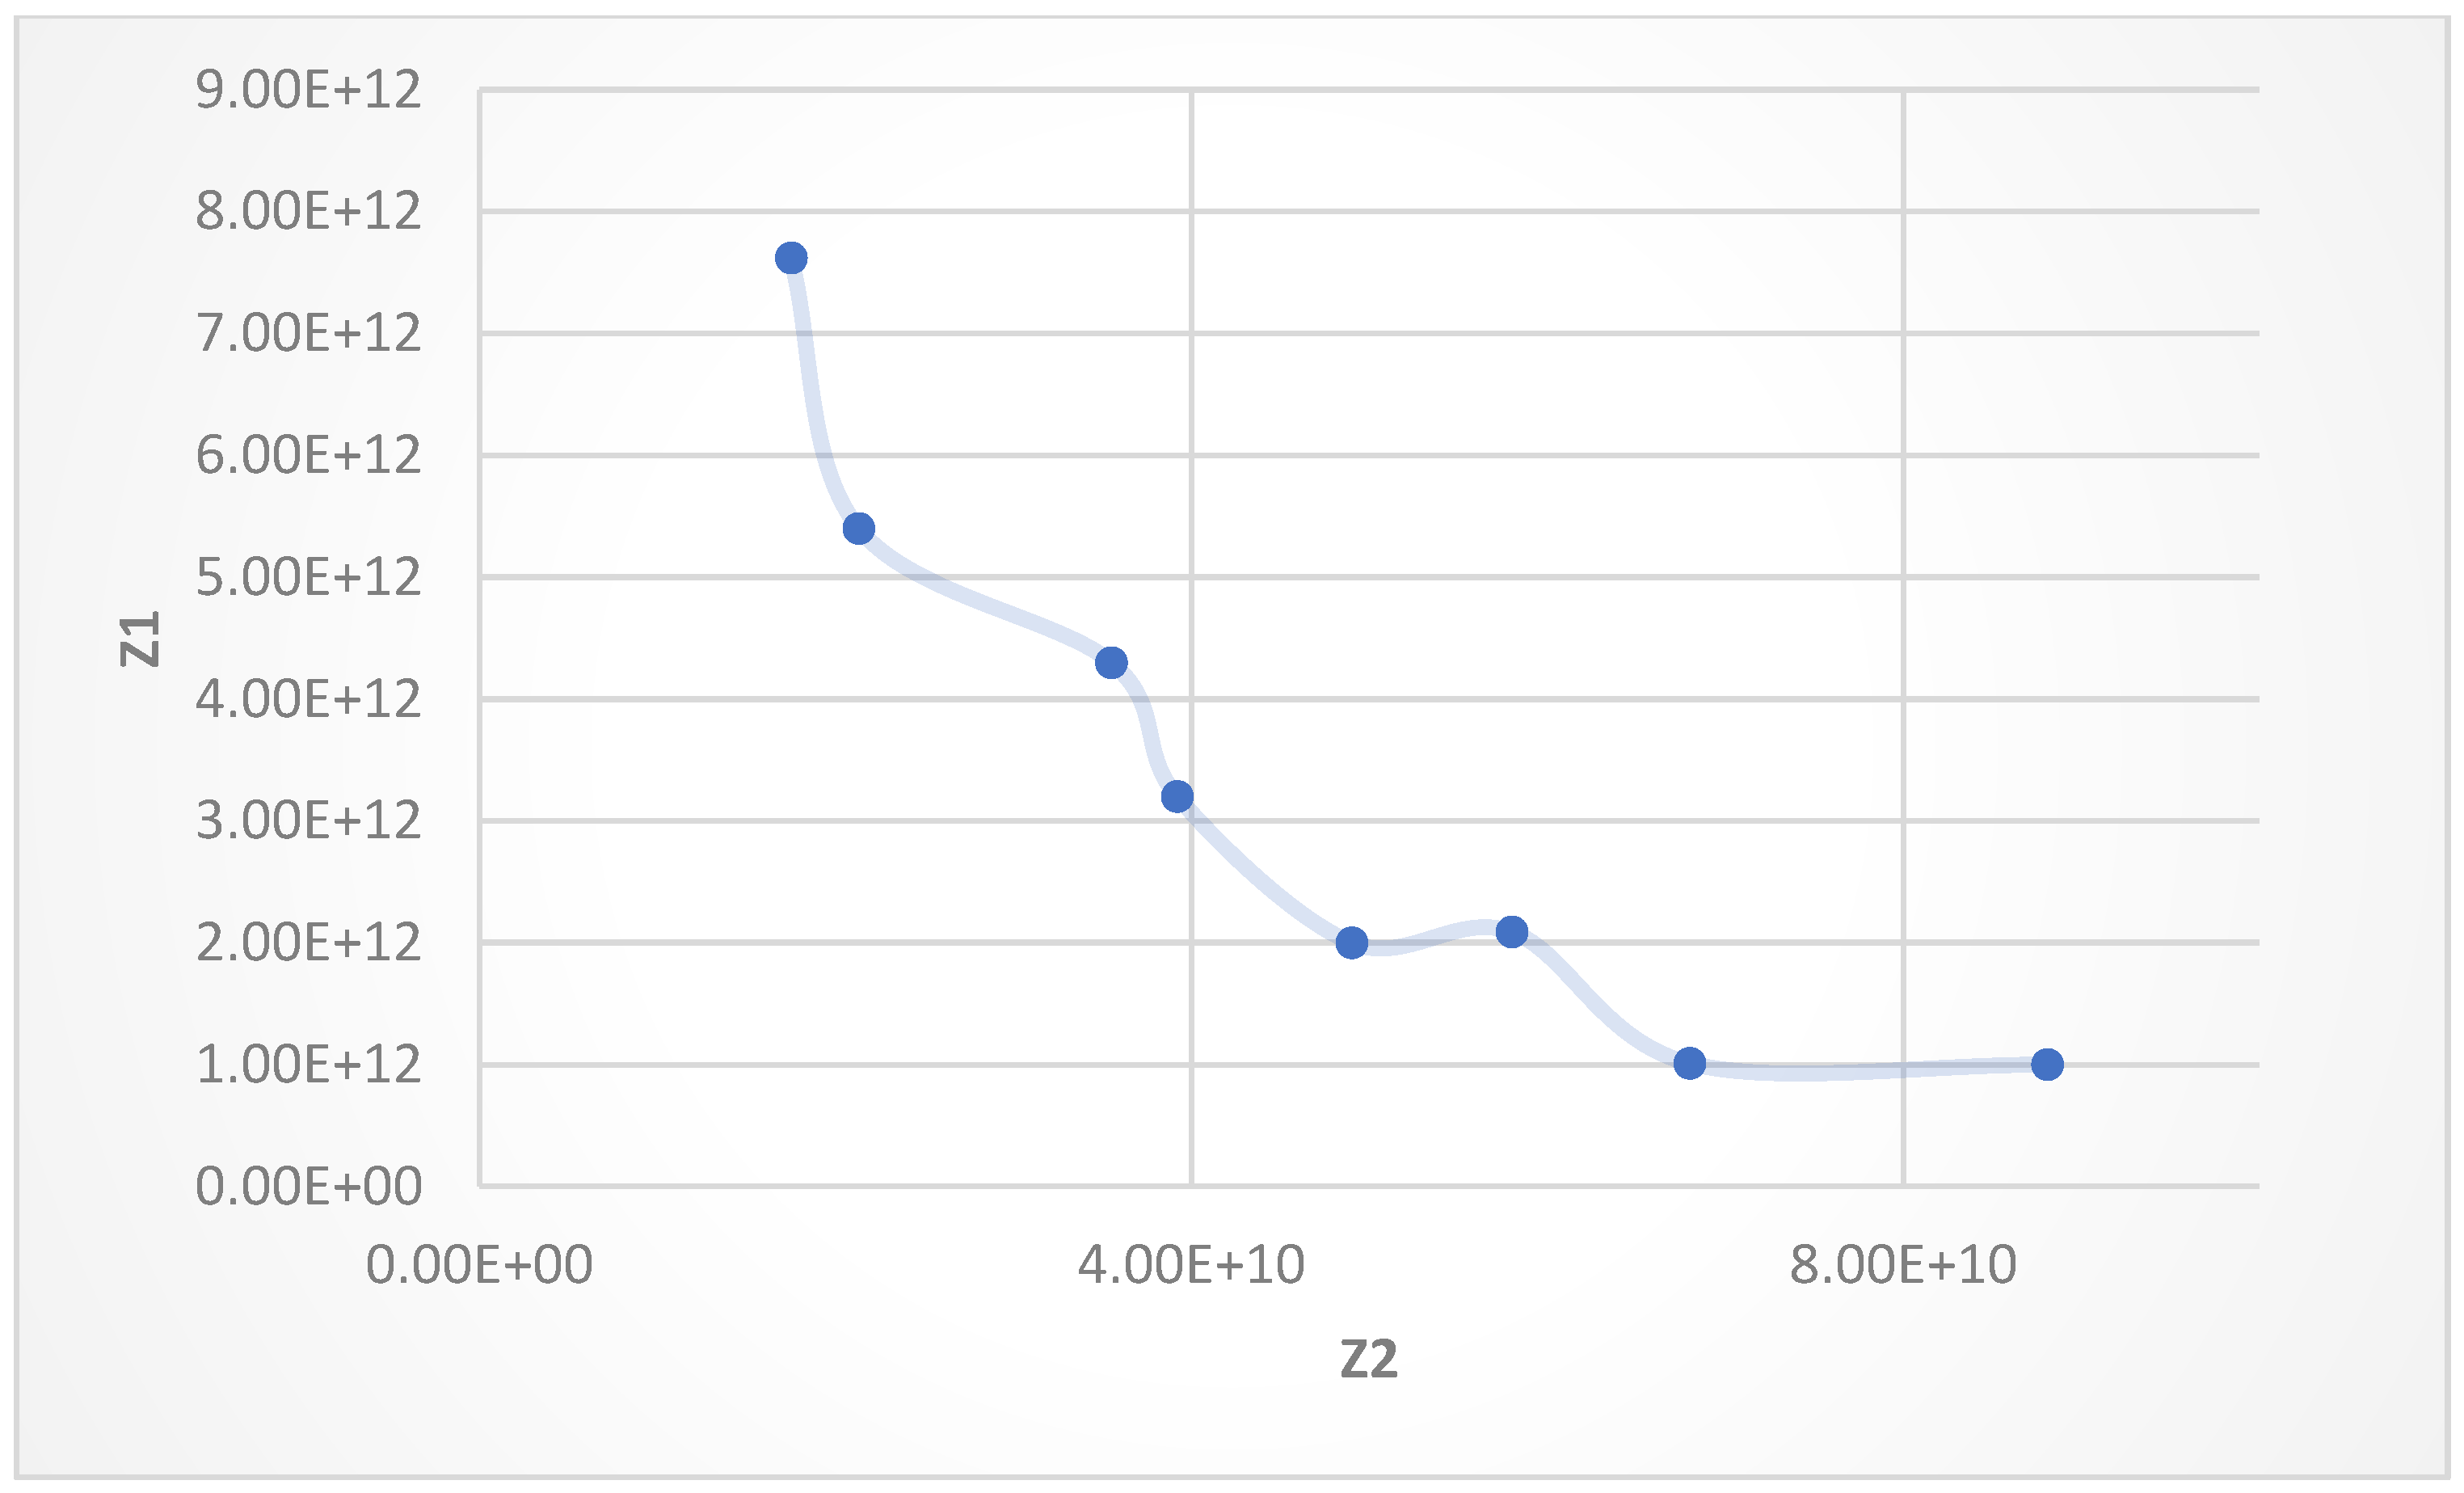
| First OF | Second OF |
|---|---|
| 1.75 × 10¹⁰ | 7.62 × 10¹² |
| 2.13 × 10¹⁰ | 5.40 × 10¹² |
| 3.55 × 10¹⁰ | 4.30 × 10¹² |
| 3.92 × 10¹⁰ | 3.20 × 10¹² |
| 4.90 × 10¹⁰ | 2.00 × 10¹² |
| 5.80 × 10¹⁰ | 2.09 × 10¹² |
| 6.80 × 10¹⁰ | 1.01 × 10¹² |
| 8.81 × 10¹⁰ | 1.00 × 10¹² |
| First OF | Second OF |
|---|---|
| 1.33 × 10¹⁰ | 9.62 × 10¹² |
| 2.10 × 10¹⁰ | 8.20 × 10¹² |
| 4.15 × 10¹⁰ | 7.30 × 10¹² |
| 5.98 × 10¹⁰ | 6.27 × 10¹² |
| 7.10 × 10¹⁰ | 4.03 × 10¹² |
| 7.89 × 10¹⁰ | 4.09 × 10¹² |
| 8.82 × 10¹⁰ | 2.81 × 10¹² |
| 9.82 × 10¹⁰ | 1.99 × 10¹² |
| Number of Test Problem | Size of Test Problem | CPU Time (for GP.) | CPU Time (for Lp.) | ||||
|---|---|---|---|---|---|---|---|
| Small | 8.27631 × 10⁵ | 54,640.18 | 8.2893 × 10¹⁰ | 45,483.172 | 14.8 | 12.4 | |
| Small | 4.27232 × 10⁶ | 158,069 | 2.11 × 10¹¹ | 115,527.3 | 15.1 | 12.5 | |
| Medium | 2.56632 × 10⁸ | 190,281.2 | 4.13 × 10¹¹ | 226,506.2 | 17.4 | 13.7 | |
| Medium | 4.32509 × 10⁷ | 617,904.7 | 5.14 × 10¹¹ | 281,904.7 | 18 | 15 | |
| Medium | 5.70672 × 10⁷ | 785,247 | 6.79 × 10¹¹ | 372,507.2 | 23 | 20 |
| Methods | SAW Criteria | Ranking |
|---|---|---|
| Lp-metric | 0.441206 | 1 |
| GP | 0.371205 | 2 |
Disclaimer/Publisher’s Note: The statements, opinions and data contained in all publications are solely those of the individual author(s) and contributor(s) and not of MDPI and/or the editor(s). MDPI and/or the editor(s) disclaim responsibility for any injury to people or property resulting from any ideas, methods, instructions or products referred to in the content. |
© 2023 by the authors. Licensee MDPI, Basel, Switzerland. This article is an open access article distributed under the terms and conditions of the Creative Commons Attribution (CC BY) license (https://creativecommons.org/licenses/by/4.0/).
Share and Cite
Abbasi, S.; Vlachos, I.; Rekabi, S.; Talooni, M. Designing the Distribution Network of Essential Items in the Critical Conditions of Earthquakes and COVID-19 Simultaneously. Sustainability 2023, 15, 15900. https://doi.org/10.3390/su152215900
Abbasi S, Vlachos I, Rekabi S, Talooni M. Designing the Distribution Network of Essential Items in the Critical Conditions of Earthquakes and COVID-19 Simultaneously. Sustainability. 2023; 15(22):15900. https://doi.org/10.3390/su152215900
Chicago/Turabian StyleAbbasi, Sina, Ilias Vlachos, Shabnam Rekabi, and Mohammad Talooni. 2023. "Designing the Distribution Network of Essential Items in the Critical Conditions of Earthquakes and COVID-19 Simultaneously" Sustainability 15, no. 22: 15900. https://doi.org/10.3390/su152215900
APA StyleAbbasi, S., Vlachos, I., Rekabi, S., & Talooni, M. (2023). Designing the Distribution Network of Essential Items in the Critical Conditions of Earthquakes and COVID-19 Simultaneously. Sustainability, 15(22), 15900. https://doi.org/10.3390/su152215900