Abstract
As an important pillar of human civilization, the development of agriculture has gradually become the focus of the international community to solve the development dilemma and promote the implementation of the global Sustainable Development Goals (SDGs). Agricultural sustainability issues are widely addressed in scientific literature and various reports by international organizations. However, there are some problems in the existing studies, such as the design of agricultural sustainable development evaluation indicators does not consider the differences in development stages and data statistical capacity of various countries, and the research depth of spatial and temporal change of agricultural sustainable development is insufficient. Agriculture has become a bottleneck for the world and China to achieve the SDGs. Based on the global indicator framework of the Sustainable Development Goals and comprehensive consideration of agricultural development common problems and regional characteristics, this work has established a basic index library consisting of 86 indicators to evaluate the agricultural sustainable development in China and provide the basis for the assessment in different regions. In the indicator optimization process, having considered the development stage of China, the basic characteristics of agriculture, data availability, and reliability, we determined an evaluation index system of China’s agricultural sustainable development that includes 25 specific indicators. The constant elasticity of substitution (CES) model was used to assess the temporal and spatial changes in agricultural sustainability in China at the national, regional, and provincial levels. The results showed that China’s Agricultural Sustainable Development Index (ASDI) score increased from 44.76 in 2011 to 59.22 in 2021, and the ASDI scores of all agricultural regions and provinces also increased to varying degrees. In terms of goal scores, SDG2, SDG6, SDG7, SDG8, SDG9, and SDG12 all exhibited an overall upward trend, in which SDG6 performed the best, and SDG2 performed the worst, scoring 84.76 and 43.05 in 2021, respectively. This paper will provide a basis for systematically evaluating the progress of agricultural sustainable development goals and accurately identifying unsustainable problems in agricultural development to help China implement the 2030 Agenda for Sustainable Development.
1. Introduction
Agriculture is a basic industry of the national economy, which is directly related to food security and social stability [1]. Agricultural development is indispensable for meeting the people’s needs for a better life, realizing high-quality development, and strengthening the foundation of national security. It is both highly dependent on and reactive to the resource environment [2]. In recent years, the agricultural and rural development of China has made great achievements. It is of great and far-reaching significance for China to accelerate its current efforts to promote a new situation of agricultural and rural modernization. However, global agriculture is currently facing problems such as land and water scarcity, increasing surface pollution, declining ecosystem stability, and threats to food security [3]. Therefore, it is critical and urgent to conduct a systematic and effective agriculture sustainable development assessment for the country.
The 2030 Agenda on Sustainable Development Goals (SDGs), adopted by the United Nations General Assembly in 2015, has emerged as a prominent global response to the pressing challenge of dwindling sustainability [4]. While the Millennium Development Goals, the predecessor of the SDGs, mainly focused on poverty reduction in developing countries, the SDGs are more comprehensive and universal, aiming to overcome the economic, social, and environmental challenges that both developed and developing countries are currently facing. This agenda defines a framework system of SDGs consisting of 17 sustainable development goals and 169 targets [5]. Marking an important transition in global development governance, it has become a fundamental strategy for leading the development of all countries. As a directly utilized natural resource, agriculture has a strong dependence on the ecological environment. The promotion of the idea of sustainable development is of great significance to the future development of agriculture. In 1987, the World Commission on Environment and Development (WCED) published Food 2000: Global Policies for a Shift to Sustainable Agriculture, which formalized the concept of “sustainable agriculture” at the international level [6]. By 1991, the Food and Agriculture Organization of the United Nations (FAO) issued the Den Bosch Declaration and Programme of Action on Sustainable Agriculture and Rural Development at the International Conference on Agriculture and the Environment in the Netherlands. The declaration proposed “agricultural sustainable development” and defined it as agriculture that meets the agricultural needs of present and future generations without causing environmental degradation, which is technically and economically feasible and socially acceptable [7]. In 1994, China’s Agenda 21 included agriculture in the country’s strategic plan for sustainable development, pointing out that China’s agriculture and rural areas should prioritize the path of sustainable development to emerge from the predicament [8].
As the field of agriculture has attracted the attention of scholars, the research on sustainable agricultural development has entered a brand new period, which mainly focuses on the construction of the indicator system and the research methodology [9]. The “Pressure-State-Response” theoretical framework (PSR model) was used jointly by the Organization for Economic Co-operation and Development (OECD) and the United Nations Environment Programme (UNEP) in the 1990s for the study of environmental assessment. Dan Rigby (2011) [10] used the PSR framework model to establish a system of evaluation indicators for sustainable agricultural development. Yu et al. (2004) [11] took the lead in constructing an evaluation index system for agricultural sustainable development and further optimized the allocation of agricultural resources. Moridi et al. (2017) [12] constructed indicators for evaluating the sustainable development of agriculture in Golestan province in five dimensions: agricultural resources, agricultural development, environment and ecosystems, rural society and science, education, and management. Fu et al. (2022) [13] constructed a sustainable agriculture evaluation index system based on RUE from six aspects: agricultural resource endowment, agricultural production, and agricultural science and technology level, ecological, economic, and social benefits. The common, comprehensive evaluation methods mainly include the entropy weight method [14], hierarchical analysis method [15], multi-indicator analysis method [16], principal component analysis method [17], energy-value analysis [18], gray correlation analysis [19], and so on.
Aleksandra et al. (2022) [20] developed a composite green economy index composed of 19 variables to conduct the spatial analysis of the environmental, social, and economic aspects of the Green Economy in Polish Rural Areas. Zhang et al. (2023) [21] constructed an agricultural water resources evaluation system to evaluate agricultural water resources carrying capacity and analysis of its spatio-temporal variation in Henan Province, China. Wang et al. (2023) [22] constructed a six-dimensional comprehensive evaluation framework: innovation—effectiveness—sustainability—coordination—openness—sharing to evaluate and analyze the level of regional disparities and the dynamic distribution characteristics of high-quality agricultural development in China in the period from 2010 to 2018. It can be found that most of the current research on the spatio-temporal evolution of agricultural sustainability focuses on a certain aspect of agriculture or explores the impact of certain factors on agricultural development. The study of agricultural sustainability at national and provincial levels in China was limited, which was of great significance to emphasize the sustainable development of agriculture throughout the country. On account of the above research, this article makes the following two hypotheses: (1) the sustainable development level of agriculture in China is constantly improving, and there are significant differences in agricultural development levels among regions; (2) there are differences in the development shortcomings between different agricultural regions and provinces, and there is an imbalance in agricultural development.
Based on the above discussion, the following tasks are set: (1) establish a systematic and comprehensive agricultural sustainable development framework; (2) evaluate the spatiotemporal variation of China’s agricultural sustainable development based on environmentally-related SDGs (SDG2, SDG6, SDG7, SDG8, SDG9, SDG12); (3) validate the feasibility of the calculation method in this paper and evaluate performance across SDGs and provinces.
The current research on the sustainable development of agriculture lacks comprehensive consideration of the social attributes, economic development conditions, and resource environment of agricultural development areas. In addition, the construction of the index evaluation system ignores the effective coordination between social and economic development and the environment in the process of agricultural development. In this study, we combine the sustainable development goal with the reality of China’s agriculture, constructing an evaluation index system according to the requirements of the sustainable development goal in the new era and the direction of China’s agricultural development. The construction of the index system also takes into account key issues, such as food security, clean drinking water and sanitation facilities, and clean energy supply in the process of agricultural development. In addition, from the perspective of nations, provinces, and agricultural regions, this paper studies the temporal and spatial changes in agricultural sustainability and analyzes the inter-regional and intra-regional development differences in China’s agricultural sustainable development level, which is helpful to effectively identify the key issues and explore the sustainable development trends of agriculture in China. Most importantly, the findings in this study provide methodological and theoretical support for the identification and progress assessment of agricultural development problems in other regions, changing people’s actions, lifestyles, and traditional agriculture practices to achieve sustainable development.
2. Materials and Methods
2.1. Screening of SDGs for Agriculture Sustainability
Among the 17 sustainable development goals, SDG2 (Zero Hunger), SDG6 (Clean Water and Sanitation), SDG7 (Affordable and Clean Energy), SDG8 (Decent Work and Economic Growth), SDG9 (Industry, Innovation, and Infrastructure), and SDG12 (Responsible Consumption and Production) are closely related to agriculture sustainability.
To be specific, SDG2 is closely related to China’s food security and agricultural sustainability. SDG6 points out a lack of water resources. Global agricultural water consumption accounts for 70% of freshwater intake. Improving agricultural water efficiency is a key method to promote sustainable agricultural development and water resource utilization [23]. SDG7 is a global concern, and the carbon emissions of energy consumption in the agricultural sector have been on the rise. There are also prominent bottlenecks in low-carbon technology, lacking effective incentive mechanisms and low-quality agricultural labor. Under the dual historical responsibility of the “dual carbon” goal and rural revitalization strategy, rural energy transformation is urgent [24].
SDG8 aims to promote inclusive and sustainable economic growth, employment, and decent work for all. To promote the sustainable development of modern agriculture and ensure global food security, it is necessary to continuously explore the path of integrating agricultural development with sustainable economic growth, extend the agricultural industry chain, and increase the internal employment capacity of agriculture. SDG9 refers to Investment in infrastructure construction. Meanwhile, agricultural technology innovation is crucial for achieving stable income growth for farmers, ensuring national food security, and achieving sustainable and healthy agricultural development. SDG12 points out that we must immediately change production and consumption patterns to reduce our ecological footprint. The sustainable agricultural production model emphasizes ecological environment protection, avoids damage to land, water sources, and ecosystems, and achieves harmonious coexistence between agriculture and nature. The sustainable consumption mode of food is closely related to China’s food security guarantee. Therefore, considering the close relationship between these SDGs and agricultural sustainable development, we selected indicators based on SDG2, SDG6, SDG7, SDG8, SDG9, and SDG12 for the rational and accurate evaluation of the spatiotemporal variation of China’s agricultural sustainable development.
2.2. Evaluation Index System for Agricultural Sustainable Development
2.2.1. Scheme on Constructing the Evaluation Index System
The design of evaluation indicators for agricultural sustainable development should be oriented towards the above-mentioned SDGs. Moreover, the evaluation index system for agricultural sustainable development should be established based on drawing on the mature experience and evaluation paradigm of measuring and evaluating the progress of SDGs at the national and urban levels, as well as coordinating relevant national plans and policy actions (Figure 1).
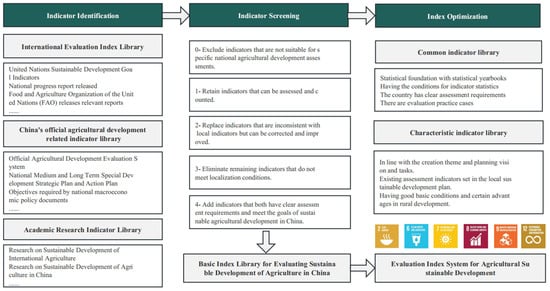
Figure 1.
Scheme on constructing an evaluation index system for agricultural sustainable development. Sources: Compiled by the author.
2.2.2. Basic Indicator Library
Under the guidance of the 2030 Agenda, the United Nations Statistical Commission organized an Inter-Agency Expert Group on Sustainable Development Goal Indicators (IAEG SDGs) to develop a global indicator framework for the follow-up and review of goals and specific targets. It aimed to objectively evaluate annual progress toward sustainable development goals, identify gaps, and ensure that sustainable development remained guided by the goals of the 2030 Agenda. However, the indicator framework is proposed at a global scale, and the sub-indicators involved are too complex. Moreover, the indicator design does not consider the differences in development stages and data statistical capabilities between countries, making it difficult to evaluate the member countries at different development stages and different evaluation objects. Therefore, it is necessary to localize the indicator framework to adapt SDGs to local actual conditions and demands.
The SDG-oriented evaluation index system for China’s sustainable agricultural development will be based on the monitoring needs of the country’s implementation of the 2030 Agenda, with the six SDGs closely related to agriculture as the core and under the global indicator framework proposed by IAEG-SDGs, taking into account the characteristics and current situation of China’s agricultural development. At present, China’s agriculture is in an important transition period. In order to solve China’s current agricultural development dilemma, the report of the 19th National Congress proposed for the first time to promote the implementation of the rural revitalization strategy. In 2018, China put forward Opinions on the Implementation of the Rural Revitalization Strategy and Strategic Plan for Rural Revitalization (2018–2022). During the 14th Five-Year Plan period, the goal is to promote high-quality economic and social development, strive to realize socialist modernization by 2035, basically realize urbanization and agricultural modernization, narrow the income gap between urban and rural residents, and achieve the goal of doubling farmers’ income.
Based on the current situation of agricultural development in China, the construction of the indicator library is based on the China Statistical Yearbook and considers China’s existing rural goals, such as green development, ecological civilization construction, rural revitalization, beautiful rural construction, and digital rural construction. The indicator library summarizes the mid- and long-term strategies, such as the Strategic Plan for Rural Revitalization (2018–2022) and refers to the goals set by national macro policies, such as Opinions on the Implementation of the Rural Revitalization Strategy. In addition, the indicators are also collated in conjunction with the indicators set by relevant international reports such as “Progress on Sustainable Development Goal Indicators related to Food and Agriculture 2020”, “World Food Security and Nutrition Status in 2021”, and “2020 Hunger Index Report”. Having analyzed the relationship between SDGs and agricultural development, some indicators that do not apply to localization in China, duplicate indicators, indicators with the same connotation, and indicators with unreliable sources were deleted. Finally, the basic indicator library for evaluating the agricultural sustainable development of China, consisting of 86 core indicators oriented towards SDGs, was established (Table 1).

Table 1.
Basic index library for evaluating agricultural sustainable development in China.
2.2.3. Construction of Evaluation Index System
Considering the practical needs of assessing the sustainable development capacity and level of agriculture, this work aims to promote ecological civilization construction and rural revitalization in a coordinated manner based on China’s agricultural green development plan and the requirements of “one control, two reductions, and three basics” in China.
Under the comprehensive consideration of the availability and reliability of agricultural data in China, the indicators in the basic index library for evaluating agricultural sustainable development in China (Table 1) were screened, and an evaluation index system for agricultural sustainable development that includes 25 key indicators was established as shown in Table 2.
Table 2.
Indicators selected for agricultural sustainable development.
2.3. Evaluation and Analysis Methods
The agricultural sustainable development score was calculated as follows. Firstly, the indicator values were normalized according to the upper and lower bound on the 0–100 scale. Secondly, the Constant Elasticity of Substitution (CES) model was employed to aggregate the indicators using 6 SDGs [24].
2.3.1. Data Sources
Public statistical databases, including the China Statistical Yearbook [25], the China Environmental Statistical Yearbook [26], the China Rural Statistics Yearbook [27], the China Energy Statistical Yearbook [28], the China Population and Employment Statistics Yearbook [29] and the China Emission Accounts and Datasets [30,31,32,33] were employed to collect indicator data.
Agricultural regionalization is an important method of managing and guiding agricultural production. The “China Comprehensive Agricultural Regionalization” compiled by the National Agricultural Regionalization Committee divides the country into nine agricultural zones based on the principles of agricultural production conditions, development direction, major issues and key measures, and the integrity of administrative units [34]. The nine agricultural zones are the Arid and Semi-arid Zones of the North, the Northeast Plain Region, the Yunnan and Guizhou Plateau Region, the South China Region, the Sichuan Basin and Neighboring areas, the middle and lower reaches of the Yangtze River region, the Qinghai–Tibetan Plateau Region, the Loess Plateau Region, and the Yellow-Huaihai Plain (Figure 2). The indicator data for six SDGs (SDG2, SDG6, SDG7, SDG8, SDG9, and SDG12) included 31 provinces (nine major agricultural zones in China), except Hong Kong, Macao, and Taiwan, China. Indicator selection also minimized the impact of missing data by using the data from nearby years, the mean value of data from adjacent years, or the regression method. Therefore, data coverage for 80% or more provinces was ensured.
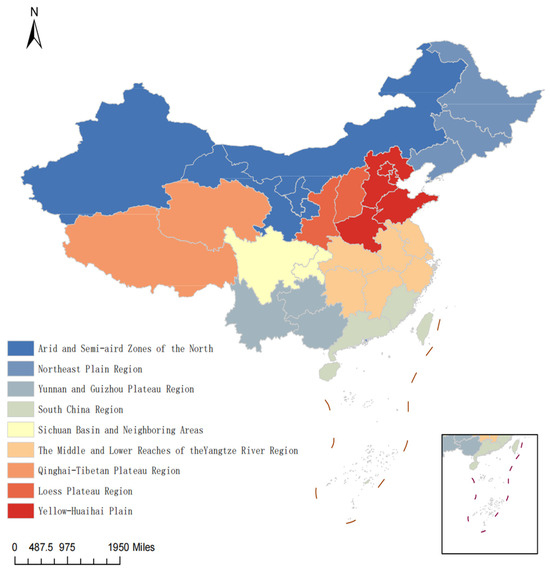
Figure 2.
Nine major agricultural zones in China. Sources: Compiled by the author.
2.3.2. Normalization
This article draws inspiration from the five-step decision tree method used in the SDGs index and dashboard report released by SDSN. In our work, we collected the annual data for each SDG indicator from 2011 to 2021, as well as carried out this analysis at both the national and provincial levels. The specific method for determining the threshold was as follows: (1) when SDGs have clear requirements for indicators, use the thresholds determined in SDGs; (2) when there is no clear requirement in SDGs, use the internationally recognized optimal indicators as the upper limit of the threshold; (3) if the indicator is commonly used internationally and domestically, the highest performing regional indicator level internationally will be used as the upper threshold; (4) excluding the first three cases, select the average of the five best performing agricultural indicator values from the set of indicator sources as the optimal value; (5) if the selected indicators are unique to Chinese agriculture, the average of the top five agricultural indicators with the best performance from 31 provinces (cities) in China will be selected as the optimal value. The selection method for the worst performing indicator is basically the same as the optimal value, except for the above case 5. For indicators that meet case 5, after excluding the worst-performing provinces in China, the indicator value of the second worst-performing province is selected as the worst value, which is beneficial for eliminating the impact of outliers.
The min–max method (Equations (1) and (2)) was carried out to normalize the indicator. This made it more convenient to use these rescaled values to explain and compare the changes or relative performance of different indicators in time and space.
Positive indicators:
Negative indicator:
where xi was the raw data of the indicator; x′i means the normalized data; max/min indicates the upper/lower bounds for the data. The value is set to 0 and 100 when raw data exceeds the lower and upper bound, respectively.
2.3.3. Aggregation
ASDI and all 6 SDGs (SDG2, SDG6, SDG7, SDG8, SDG9, SDG12) were weighted equally when calculating composite index scores. An equal weight reflects the normative assumption that fixed and equal attention is paid to variables at the same level. The method of equal weight is widely used for comprehensive index evaluation in the world, such as the Sustainable Development Report [35], Ocean Health Index (OHI) [36], and so on. When aggregating variables in the indicator system, the concepts of “strong sustainability” and “weak sustainability” are introduced. The strong sustainability perspective holds that artificial capital and natural capital are complementary and irreplaceable, while economic and social behavior should be constrained by the environment [37]. The weak sustainability perspective believes that there is a mutual substitution relationship between artificial capital and natural capital, and economic and social development can sacrifice the environment at a cost [38]. Similarly, in the field of indicator evaluation, “weak sustainability” means that there is complete substitutability between indicators. An increase in the score of one indicator can compensate for a decrease in the score of another indicator, as long as the total score obtained by weighted summation of all indicators does not decrease. “Strong sustainability” means that indicators cannot be replaced, and score compensation between indicators is not allowed (or the degree of compensation allowed is very limited), which places more emphasis on low-scoring indicators [39,40,41]. From this perspective, “weak sustainability” emphasizes the maintenance of total scores, while “strong sustainability” focuses more on the scores of individual indicators.
The nested CES model proposed by Dovern et al. [42] was used to calculate the ASCI scores as follows:
where N represents the number of variables to be aggregated per SDG; σ represents the substitution elasticity between variables at the same level, with a value range of 0 ≤ σ ≤ ∞. The higher the value, the greater the substitutability between variables and vice versa. The CES function can maximize the flexibility of variable aggregation through different transformation forms [43].
Three specific values of σ (0, 1, ∞) represent different special cases: (1) Completely substitutable between variables (σ = ∞) corresponds to “weak sustainability”. As this article adopts the equal weight method, the form of the CES function becomes ; (2) irreplaceability between variables (σ = 0) corresponds to “strong sustainability”, and the comprehensive index is determined by the lowest score Ii; (3) intermediate case of linear substitutability (σ = 1). The CES function becomes .
In this work, agricultural sustainable development was assessed through indicators, SDGs, and index levels. Referring to the existing research [44], to compare the impact of two sustainability models on scores at the indicator and target levels, substitutability between indicators (targets) is set σ = ∞ (corresponding to the “weak sustainability” scenario) and σ = 0.5 (corresponding to the “strong sustainability” scenario). Calculate the ASDI score for the corresponding scenario (Figure 3).
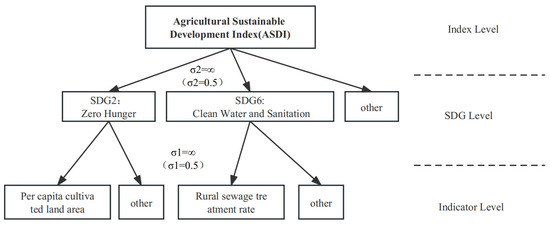
Figure 3.
The framework for assessment of agricultural sustainable development in China. Sources: Compiled by the author.
3. Results
3.1. Agriculture-Related SDGs Assessment
3.1.1. Spatio-Temporal Evolution for Agriculture-Related SDGs
Figure 4 displays the scores of six agriculture-related SDGs in 31 provinces from 2011–2021, demonstrating the changes and differences in SDG scores among provinces. Among the six SDGs, SDG6 has the best overall score, while the performance of Tibet is relatively poor. It is mainly due to the special geographical environment, uneven distribution of water resources in time and space, uneven water source areas, and limited reserve water sources. Evidently, water remains one of the main “bottlenecks” that constrain the development and progress of agriculture in Tibet. SDG2 scores poorly overall in the six SDGs. In the process of achieving SDG2, the nine major agricultural zones showed significant differences, among which the Loess Plateau Region, the Qinghai–Tibetan Plateau Region, the Yunnan and Guizhou Plateau Region, and the Arid and Semi-arid Zones of the four North regions performed relatively poor. In spite of this, all 31 provinces showed an upward trend in their scores compared to 2011. In contrast to the performance of SDG2, 11 provinces showed a downward trend in the realization of SDG7. Among them, Heilongjiang and Xinjiang Province, respectively, saw a 43.65% and 37% drop in scores over the 11-year period. The main reason is the growth of carbon emissions from agriculture, forestry, fisheries, and water conservancy in the two regions. In the process of achieving SDG8, economically active cities, such as Shanghai and Chongqing, performed better, and all provinces showed an upward trend. In realizing SDG12, three agricultural zones, including the Loess Plateau Region, the Qinghai–Tibetan Plateau Region, and the Arid and Semi-arid Zones of the North, performed better. Among them, the performance of Xinjiang is the most outstanding, which is closely related to Xinjiang’s vigorously developing high-quality agriculture by giving full play to its resource advantages and ecological advantages.
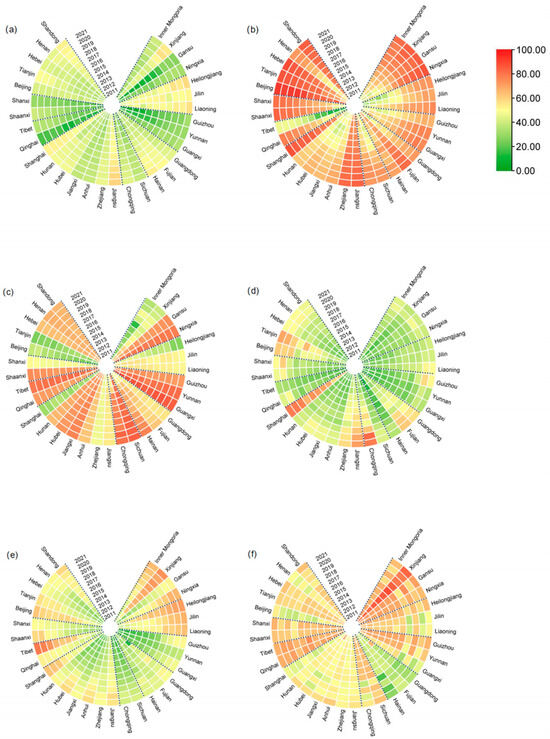
Figure 4.
SDG scores including (a) SDG2, (b) SDG6, (c) SDG7, (d) SDG8, (e) SDG9, and (f) SDG12 for 31 provinces in 2011–2021. Sources: Compiled by the author.
3.1.2. SDGs Sensitivity Analysis
As depicted in Figure 5, the target scores under the “weak sustainability” scenario are generally higher than those under the “strong sustainability” scenario. This is because when substitutability is high, the poor performance of the indicator can be offset by another better indicator. The compensation effect between these indicators would reduce the impact of low-scoring indicators on the target scores, and this impact will increase with the decrease in substitutability. Comparing the target scores of each agricultural region under two sustainable scenarios can reveal the imbalance between the corresponding indicator scores. The greater the difference in indicator scores, the greater the magnitude of the corresponding change in target scores.
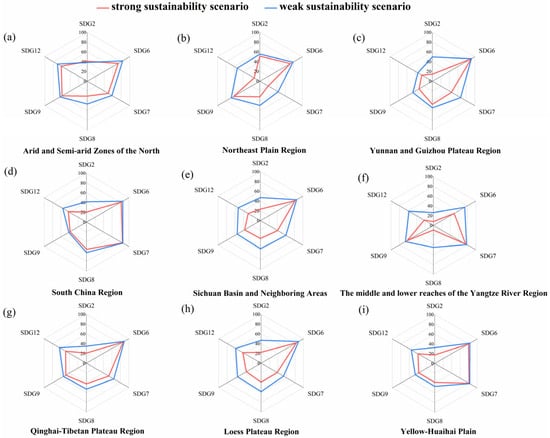
Figure 5.
Target scores for nine major agricultural zones including (a) Arid and Semi-arid Zones of the North, (b) Northeast Plain Region, (c) Yunnan and Guizhou Plateau Region, (d) South China Region, (e) Sichuan Basin and Neighboring Areas, (f) The middle and lower reaches of the Yangtze River region, (g) Qinghai-Tibetan Plateau Region, (h) Loess Plateau Region, and (i) Yellow-Huaihai Plain in two sustainability scenarios.
Figure 5 shows that under the two scenarios of sustainability, the elasticity coefficient significantly affected the SDG scores for the agricultural region. SDG2 scores under weak sustainability for the Northeast Plain Region, the Yunnan and Guizhou Plateau Region, and the Sichuan Basin and Neighboring areas differ significantly from those under the strong sustainability scenario. It is mainly due to the fact that some of the indicators in SDG2 scored higher under weak sustainability, compensating for the indicators that scored poorly. Nevertheless, the potential for high scores in one area of strong sustainability to compensate for lower scores in other areas is limited. Therefore, there are significant differences in the SDG2 scores of several agricultural regions under the two sustainable development concepts. The greater the difference in indicator scores, the greater the magnitude of the corresponding change in target scores. As a result, the concept of strong sustainability was applied to reveal imbalances in agricultural sustainable development.
3.2. ASDI Assessment
3.2.1. Spatio-Temporal Evolution for ASDI
At the national level, China’s Agricultural Sustainable Development Index (ASDI) score showed improvement over time, increasing from 44.76 in 2011 to 59.22 in 2021 (Figure 6). This represents a growth of approximately 32.39%. In 2018, there was a decrease in ASDI in China, mainly due to a decrease in SDG12 and SDG8 scores.
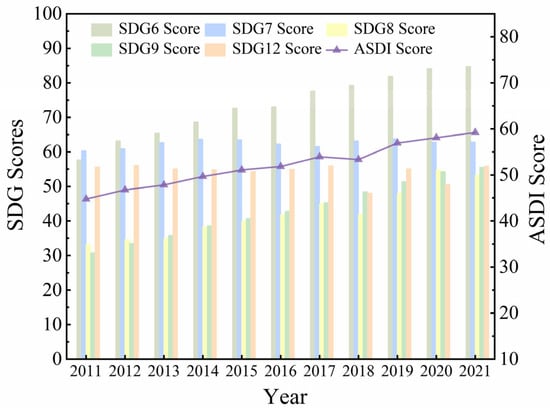
Figure 6.
China’s ASDI score and individual SDG scores. Sources: Compiled by the author.
At the provincial level, the ASDI scores exhibited a range of variations. In 2010, the scores ranged from 38.43 (Guizhou) to 53.03 (Xinjiang), with a mean value of 44.76, spanning a range of 14.59 points. By 2013, the scores of the 31 provinces ranged from 40.55 (Guizhou) to 56.55 (Xinjiang), with a mean value of 47.831 and a range of 16.00 points. In 2015, the scores ranged from 45.76 (Guizhou) to 58.97 (Xinjiang), with a mean value of 51.07 and a range of 13.21 points. In 2017, the scores ranged from 47.55 (Inner Mongolia) to 59.75 (Jiangsu), with a mean value of 53.93 and a range of 12.20 points. By 2019, the mean value increased to 56.93, and the range decreased to 11.58 points. In 2021, the mean value further increased to 57.93, and the range decreased to 10.19 points. It showed an upward trend of scores in 31 provinces over time (Figure 7, Table 3). From 2011 to 2021, the ASDI scores increased from 19.95% (Xinjiang) to 50.53% (Guizhou).
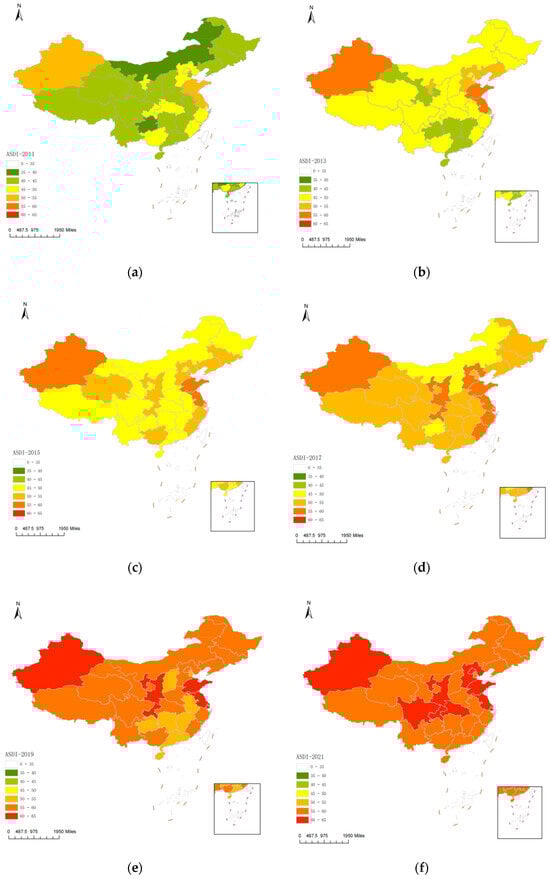
Figure 7.
Spatial pattern of ASDI scores in (a) 2011, (b) 2013, (c) 2015, (d) 2017, (e) 2019, (f) 2021 for 31 provinces. Sources: Compiled by the author.
Table 3.
The score for 31 provinces under the arithmetic means method (σ1 = ∞, σ2 = ∞) from 2011 to 2021.
From the perspective of nine major agricultural zones, the changes in ASDI scores in China from 2011 to 2021 could also be observed. In the Arid and Semi-arid Zones of the North, except Xinjiang, the scores were relatively poor compared to other agricultural regions. The reason is that this agricultural area is one of the seriously unbalanced areas in the country. Most agricultural areas are extensively cultivated, and the yield per unit area is the lowest among all agricultural areas. Therefore, the structure and distribution of agriculture and animal husbandry should be adjusted according to local conditions to stabilize the cultivated land in agricultural areas and strive to increase the yield per unit area.
The Northeast Plain Region, possessing vast and fertile land, is suitable for the development of planting and provides the country with a large amount of commercial grain and soybeans all year round. However, this region adopts an extensive management model, and the score does not show a prominent advantage.
The Yunnan and Guizhou Plateau Region has formed a variety of agricultural types due to its characteristics of high altitude, complex terrain, and diverse climate. Among them, the combination of agriculture and animal husbandry is the most important agricultural type in this local area, accounting for more than 70% of the total agricultural output value of the Yunnan–Guizhou Plateau. However, the average yield of grain per mu in this area is low, which is not commensurate with its superior natural conditions. Thus, this region has better development potential.
South China Region is the only region suitable for the development of tropical crops. However, this region has more mountains and fewer fields, where nearly 90% of the area is hilly and mountainous. Future agricultural development should pay attention to the reasonable arrangement of crop layout and the location advantage and vigorously develop agricultural import and export trade from the overall perspective.
The relatively high level of sustainable agricultural development in the Sichuan Basin and Neighboring areas is mainly due to the abundant precipitation, the good coordination of hydrothermal conditions, and the advantageous geographical location of the region, which is conducive to the development of agricultural industry.
In the middle and lower reaches of the Yangtze River region, where there are more people, less land, and rich water and heat resources, paddy field utilization in this region is relatively intensive, while drylands management is very extensive. The non-coastal areas in this agricultural area have a poor score. It is urgent to further develop agricultural production, utilize and protect freshwater resources, and improve the level of sustainable agricultural development.
The high cold (high terrain and low temperature) in most areas of the Qinghai–Tibetan Plateau Region is the main natural feature of this area, and the lack of heat is only suitable for grazing. Therefore, the agricultural development of this area is also relatively slow. Therefore, it is necessary to develop self-sufficiency in grain production in the region while developing animal husbandry.
The Loess Plateau Region is a region that mainly produces dry and coarse grain, suffers serious soil and water loss, and its yield is not high and unstable. It can be seen from this assessment that the score of Shanxi in this agricultural area is always behind the national level, and it should determine reasonable land use methods according to local conditions, implement comprehensive development of agriculture, forestry, and animal husbandry, and vigorously build basic farmland.
The Yellow–Huaihai Plain is the country’s largest wheat, cotton, peanut, sesame, and flue-cured tobacco production base. After more than 30 years of agricultural construction, its agricultural modernization level is relatively higher, which leads to its higher score. To give full play to the area’s huge potential to increase production, the agricultural production structure and management mode should be improved.
3.2.2. ASDI Sensitivity Analysis
The scores and related ranking for 31 provinces from 2011 to 2021 were obtained by aggregating the SDG level with a substitution elasticity (σ) value ∞ into the ASDI (σ2 = 0.5, strong sustainability). Subsequently, the scores and ranking were compared to that with σ2 = ∞ at index level using the arithmetic mean. Based on the comparison, it was found that the ASDI score obtained under perfect substitution possibilities (the arithmetic mean) was higher than the score obtained under limited substitution possibilities.
Figure 8 illustrates the ranking obtained for the two sustainability concepts in 2021. The coefficient of determination (R2) was found to be 0.78, indicating the reasonableness of our selection for the elasticity coefficient at the index level. Provinces situated below the 45° line demonstrated better rankings in strong sustainability and showed a more balanced performance. As shown in Table 4, Gansu and Qinghai obtained rankings of 11 and 14, respectively, which were higher than their rankings under the concept of weak sustainability. Provinces above the line achieved higher scores and rankings in weak sustainability. However, the performance of different provinces exhibited relative inconsistency. For instance, Jilin ranked 13th under the concept of weak sustainability, surpassing its ranking in strong sustainability. Similarly, Hunan achieved a higher ranking of 11th in strong sustainability. Provinces situated above the line have the potential to improve their rankings by addressing low scores in certain SDGs while maintaining good scores in other SDGs. Notably, Jiangsu, Shandong, and Shaanxi consistently ranked in the top three in both strong and weak sustainability, highlighting their high ASDI scores and well-balanced development. Jiangsu, Shandong, and Shaanxi ranked in the top three under both strong and weak sustainability, indicating high ASDI scores and balanced development in these three provinces.
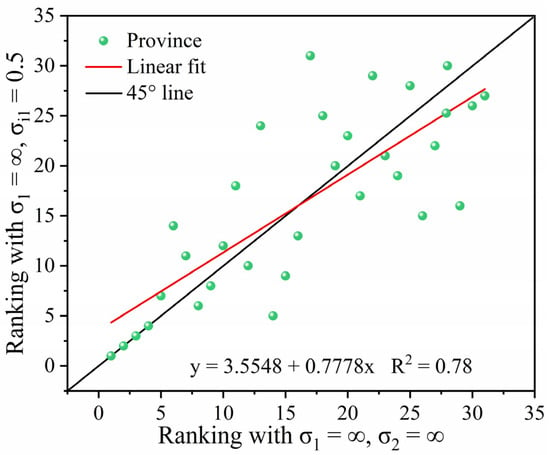
Figure 8.
Comparison of ASDI ranking for 31 provinces under different elasticity coefficient values. Sources: Compiled by the author.
Table 4.
Comparison of ASDI ranking for 31 provinces under different elasticity coefficient values in 2021.
4. Discussion
Assessing the spatiotemporal variation of agricultural sustainable development in China is critical to its achievement of sustainable development. In this work, a database for sustainable rural development consisting of 86 indicators was constructed. These indicators were based on the global indicator framework and aligned with the directions of sustainable development in agriculture. Considering the availability and reliability of indicators, we further established an evaluation index system for sustainable agricultural development applicable to current China. Based on the developed indicator system, this work extensively examines the evolution of agriculture-related SDGs. We employed the concepts of strong and weak sustainability for SDG assessments to explain the possibility of substitution between indicators and SDGs. By applying different substitution elasticity values, we can readily identify imbalances in scores among indicators and across provinces within the Agricultural Sustainable Development Index (ASDI).
Overall, China’s agriculture sustainability has shown improvement from 2011 to 2021, with varying degrees of progress observed across all six SDGs. Furthermore, the ASDI of the 31 provinces and nine major agricultural zones in China has also demonstrated positive growth over time. The continuous improvement of China’s agricultural sustainable development level stems from a series of policy actions. Since the new era, China’s agricultural support policies have supported agricultural modernization, effectively guaranteed the supply of grain and important agricultural products, gradually reduced the distorting effect on resource allocation, formed incentive and regulatory effects, and promoted the steady improvement of China’s agricultural sustainable development level. Although the overall level of ASDI in China continues to improve, the regional development gap between provinces and different agricultural regions is still obvious. On the whole, due to its inherent advantages in geography and climate and the rapid development of the regional economy, the level of sustainable agricultural development in the eastern region has been continuously improved. The economy, resources, the application of agricultural science and technology, and the quality of the labor force in the eastern region are generally at a high level. With the continuous development and the large-scale reclamation, the northeastern region has gradually developed into an important agricultural warehouse in China, with obvious characteristics of agricultural modernization, which has promoted the sustainable development level of local agriculture. The central region is dominated by plains and has also made great progress in its agricultural sustainable development with its four distinct seasons, mild climate, and abundant water resources. In contrast, the agricultural foundation of the western region is relatively weak, and the economic development is relatively backward, which restricts the promotion of its sustainable agricultural development level.
In addition, this paper reveals the imbalance of sustainable development goals between the provinces and the nine agricultural divisions through strong and weak sustainable development. For instance, the Sichuan Basin and surrounding areas have imbalanced performance in all SDGs closely related to agriculture, indicating that these agricultural divisions have not performed well in SDG2, SDG6, SDG7, SDG8, SDG9, and SDG12. In addition, provinces with unbalanced performance in ASDI were also revealed, such as Qinghai, Jilin, Hunan, and Gansu. China’s agricultural development is in a good trend, but there still exist shortcomings and obvious regional differences. There are many factors and aspects that affect the difference in agricultural sustainable development levels in different regions, including natural conditions, policy measures, financial and talent input, culture, and education foundation. Among these factors, ensuring national food security is an important basis for achieving economic development, social stability, and national security, whilst energy and resource security is an overall and strategic issue related to national economic and social development, which was paid special attention to in the SDG2 and SDG7 aspects during the construction and evaluation process of the index system in this study. However, due to the lack of energy-related data in the field of agriculture, it cannot well reflect the dilemma of food vs. energy. Therefore, more in-depth research should be carried out to formulate targeted policies and measures to promote the overall development of agriculture. Moreover, as reported in the Editorial of Sustainability [45], an analysis map illustrating the research distribution of various SDGs indicators showed that SDG2 (1212), SDG6 (840), SDG7 (764) related to the agricultural sustainability development ranks 2, 5, 7, whilst SDG8 (590), SDG9 (468) and SDG12 (643) ranks 15, 16, 9 in the last five years. The results demonstrated that our study is academically valuable and contributes to the comprehensive understanding and research on agricultural sustainability development.
Compared with the current research on agricultural sustainable development, this paper combines the international SDGs with the actual conditions of China’s agriculture to construct an evaluation indicator system in order to play its role of guidance, measurement, coordination, and restriction, better promote and guide China to implement SDGs at the agricultural level. Meanwhile, this paper identifies the differences and bottlenecks of agricultural sustainable development within and among regions in China through spatial and temporal change analysis. It provides theoretical, technical, and decision-making support for China to realize sustainable agricultural development and finally promotes the achievement of SDGs by 2030.
5. Conclusions
SDGs guide the new direction of agricultural development in the new era, and the establishment of a systematic and scientific evaluation framework for agricultural sustainable development is very important to improve China’s sustainable development. This study selects 25 indicators of agricultural sustainable development around the SDGs and uses the CES model to assess the level of sustainable agricultural development at the national and provincial levels in China, obtaining three main conclusions as follows: (1) China’s ASDI score increased from 44.76 in 2011 to 59.22 in 2021, indicating that China’s agricultural sustainable development improved from 2011 to 2021. The ASDI scores for all provinces also improved at different levels over time. At the level of agricultural regions, among the nine agricultural regions, the Yellow–Huaihai Plain scored better overall, while the Sichuan Basin and Neighboring areas and the Yunnan and Guizhou Plateau Region scored relatively poorly. (2) In terms of target scores, all six SDG targets showed varying degrees of increase, with SDG6 performing the best and SDG2 performing the worst, with 84.76 and 43.05 scores in 2021, respectively. (3) By changing the value of the elasticity of substitution, the equilibrium level of agricultural sustainability was analyzed for both the strong and weak sustainability scenarios, and the scores for the “weak sustainability” scenario were generally higher than the scores for the “strong sustainability” scenario, and the imbalance between the indicator scores was the reason for the change in the corresponding target scores. The imbalance between the indicator scores is the reason for the change in the corresponding target scores. The concept of “strong sustainability” favors balanced performance across indicators over “weak sustainability”.
The level of sustainable development of agriculture in China is constantly improving, but unbalanced development still exists between regions. To achieve sustainable agricultural development is a systematic project. The government and relevant parties should take into account local economic development, resource endowment, history, culture, transportation environment, and other factors, and design overall planning and formulate sound policies to promote the all-round development of agriculture in all regions. Limitations also existed in this study. For example, some representative indicators were abandoned in order to reduce the impact of the lack of indicator data, and thus, the indicator system might be further improved in future research. Moreover, the impact of policies on agricultural sustainability should be evaluated in the future, and effective policy recommendations should be proposed for different types of regions. The authors will continue to push into more in-depth research.
Author Contributions
Software, X.Z. and Y.L.; validation, X.Z. and S.X.; formal analysis, X.Z.; investigation, X.Z. and S.X.; resources, S.X. and F.Y.; data curation, S.X. and Y.L.; writing—original draft preparation, X.Z. and S.X.; writing—review and editing, C.S. and X.Z.; visualization, S.X.; supervision, C.S. All authors have read and agreed to the published version of the manuscript.
Funding
This work was supported by the Shandong Province key research and development program (No. 2021SFGC0904-05) and the Zaozhuang independent innovation and achievement transformation plan (No. 2021GH21).
Institutional Review Board Statement
Not applicable.
Informed Consent Statement
Not applicable.
Data Availability Statement
The data used to support the findings of this study will be made available by the corresponding authors upon request.
Acknowledgments
The authors would like to thank the anonymous reviewers and the editor for their constructive comments and suggestions for this paper.
Conflicts of Interest
The authors declare no conflict of interest.
References
- Dorward, A.; Kydd, J.; Morrison, J.; Urey, I. A Policy Agenda for Pro-Poor Agricultural Growth. World Dev. 2004, 32, 73–89. [Google Scholar] [CrossRef]
- Mahdei, K.N.; Esfahani, S.M.J.; Lebailly, P.; Dogot, T.; Van Passel, S.; Azadi, H. Environmental impact assessment and efficiency of cotton: The case of Northeast Iran. Environ. Dev. Sustain. 2023, 25, 10301–10321. [Google Scholar] [CrossRef]
- Hu, S.W.; Mi, C.H.; Shi, R.G.; Yang, Y.Y. Hotspots and trends of agriculture sustainable development: Visualization analysis based on bibliometrics. J. Agric. Resour. Environ. 2022, 39, 1–10. [Google Scholar] [CrossRef]
- Dickens, C.; McCartney, M.; Tickner, D.; Harrison, I.J.; Pacheco, P.; Ndhlovu, B. Evaluating the Global State of Ecosystems and Natural Resources: Within and Beyond the SDGs. Sustainability 2020, 12, 7381. [Google Scholar] [CrossRef]
- United Nations. Transforming Our World: The 2030 Agenda for Sustainable Development; United Nations: New York, NY, USA, 2014; pp. 1–41. [Google Scholar]
- Liu, Y.S.; Wu, C.J. Theories and Progress of Study on Sustainable Agriculture Development. Econ. Geogr. 2000, 20, 63168. [Google Scholar]
- Nelson, K.S.; Nguyen, T.D.; Francois, J.R.; Ojha, S. Rural sustainability methods, drivers, and outcomes: A systematic review. Sustain. Dev. 2023, 31, 1226–1249. [Google Scholar] [CrossRef]
- China’s Agenda 21: China’s White Paper on Population, Environment and Development in the 21st Century; China Environmental Science Press: Beijing, China, 1994.
- Liu, X.B.; Zhang, X.Y.; Wang, Y.X.; Sui, Y.Y.; Zhang, S.L.; Herbert, S.J.; Ding, G. Soil degradation: A problem threatening the sustainable development of agriculture in Northeast China. Plant Soil Environ. 2010, 56, 87–97. [Google Scholar] [CrossRef]
- Rigby, D.; Woodhouse, P.; Young, T.; Burton, M. Constructing a farm level indicator of sustainable agricultural practice. Ecol. Econ. 2001, 39, 463–478. [Google Scholar] [CrossRef]
- Yu, B.H.; Lv, C.H. Application of DPSIR Framework for Analyses of Sustainable Agricultural Developmen. China Popul. Resour. Environ. 2004, 5, 70–74. [Google Scholar]
- Shah Moridi, R.; Kazemi, H.; Kamkar, B. Evaluation of Sustainable Agricultural Development in Golestan Province. J. Agric. Sci. Sustain. Prod. 2017, 27, 197–215. [Google Scholar]
- Fu, L.L.; Mao, X.B.; Mao, X.H.; Wang, J. Evaluation of Agricultural Sustainable Development Based on Resource Use Efficiency: Empirical Evidence from Zhejiang Province, China. Front. Environ. Sci. 2022, 10, 13. [Google Scholar] [CrossRef]
- Li, S.P.; Gong, Q.X.; Yang, S. A Sustainable, Regional Agricultural Development Measurement System based on Dissipative Structure Theory and the Entropy Weight Method: A Case Study in Chengdu, China. Sustainability 2019, 11, 5313. [Google Scholar] [CrossRef]
- Li, X.; Guo, Q.X. Sustainable Development of Agroecosystem in Hilly Ridge Areas of Loess Hills Based on Emergy: A Case of Yonghe County, Shanxi Province. Chin. Agric. Sci. Bull. 2018, 34, 91–100. [Google Scholar]
- Tiwari, D.N.; Loof, R.; Paudyal, G.N. Environmental-economic decision-making in lowland irrigated agriculture using multi-criteria analysis techniques. Agric. Syst. 1999, 60, 99–112. [Google Scholar] [CrossRef]
- Golusin, M.; Ivanovic, O.M.; Teodorovic, N. The review of the achieved degree of sustainable development in South Eastern Europe-The use of linear regression method. Renew. Sustain. Energy Rev. 2011, 15, 766–772. [Google Scholar] [CrossRef]
- Smith, L.G.; Williams, A.G.; Pearce, B.D. The energy efficiency of organic agriculture: A review. Renew. Agric Food Syst. 2015, 30, 280–301. [Google Scholar] [CrossRef]
- Liu, Y.B.; Yao, C.S.; Wang, G.X.; Bao, S.M. An integrated sustainable development approach to modeling the eco-environmental effects from urbanization. Ecol. Indic. 2011, 11, 1599–1608. [Google Scholar] [CrossRef]
- Jezierska-Thöle, A.; Gwiaździńska-Goraj, M.; Dudzińska, M. Environmental, Social, and Economic Aspects of the Green Economy in Polish Rural Areas—A Spatial Analysis. Energies 2022, 15, 3332. [Google Scholar] [CrossRef]
- Zhang, Y.M.; Gao, Y.; Zhang, Y.; Liang, Z.J.; Zhang, Z.L.; Zhao, Y.L.; Li, P. Assessment of agricultural water resources carrying capacity and analysis of its spatio-temporal variation in Henan Province, China. J. Clean. Prod. 2023, 403, 136869. [Google Scholar] [CrossRef]
- Wang, Y.Y.; Kuang, Y.P. Evaluation, Regional Disparities and Driving Mechanisms of High-Quality Agricultural Development in China. Sustainability 2023, 15, 6328. [Google Scholar] [CrossRef]
- Zoleikhaie Sayyar, L.; Naderi Mahdei, K.; Shabanali Fami, H.; Motaghed, M. Developing and Analyzing the Agri-cultural Water Poverty Index in West Iran. Sustainability 2022, 14, 1410. [Google Scholar] [CrossRef]
- Wen, L.; Song, Q.Q. The forecasting model research of rural energy transformation in Henan Province based on STIRPAT model. Environ. Sci. Pollut. Res. 2022, 29, 98–103. [Google Scholar] [CrossRef] [PubMed]
- National Bureau of Statistics of the People’s Republic of China, 2012–2022. In China Statistical Yearbook; China Statistics Press: Beijing, China, 2022; ISBN 978-7-5037-9950-1. (In Chinese)
- National Bureau of Statistic & Ministry of Ecological Environment of the People’s Republic of China, 2012–2022. In China Statistical Yearbook on Environment; China Statistics Press: Beijing, China, 2021; ISBN 978-7-5230-0075-5. (In Chinese)
- Department of Rural Socio-Economic Surveys, National Statistical Office, 2012–2022. In China Agricultural Statistics Yearbook; China Statistics Press: Beijing, China, 2021; ISBN 978-7-5037-9680-7. (In Chinese)
- National Bureau of Statistics of the People’s Republic of China, 2012–2022. In China Energy Statistical Yearbook; China Statistics Press: Beijing, China, 2023; ISBN 978-7-5230-0106-6. (In Chinese)
- Population and Employment Statistics Division, National Statistical Office, 2012–2022. In China Population and Employment Statistics Yearbook; China Statistics Press: Beijing, China, 2022; ISBN 978-7-5037-9915-0. (In Chinese)
- Shan, Y.; Guan, D.; Zheng, H.; Ou, J.; Li, Y.; Meng, J.; Mi, Z.; Liu, Z.; Zhang, Q. China CO2 emission accounts 1997–2015. Sci. Data 2018, 5, 170201. [Google Scholar] [CrossRef] [PubMed]
- Shan, Y.; Huang, Q.; Guan, D.; Hubacek, K. China CO2 emission accounts 2016–2017. Sci. Data 2020, 7, 54. [Google Scholar] [CrossRef] [PubMed]
- Guan, Y.R.; Shan, Y.L.; Huang, Q.; Chen, H.L.; Wang, D.; Hubacek, K. Assessment to China’s Recent Emission Pattern Shifts. Earth’s Future 2021, 9, 13. [Google Scholar] [CrossRef]
- Shan, Y.L.; Liu, J.H.; Liu, Z.; Xu, X.W.H.; Shao, S.; Wang, P.; Guan, D.B. New provincial CO2 emission inventories in China based on apparent energy consumption data and updated emission factors. Appl. Energy 2016, 184, 742–750. [Google Scholar] [CrossRef]
- Wu, X.S.; Wang, Z.L.; Zhou, X.W.; Lai, C.G.; Chen, X.H. Trends in temperature extremes over nine integrated agricultural regions in China, 1961–2011. Theor. Appl. Clim. 2021, 129, 1279–1294. [Google Scholar] [CrossRef]
- Sachs, J.; Schmidt-Traub, G.; Kroll, C.; Lafortune, G.; Fuller, G.W.F. The Sustainable Development Goals and COVID-19. In Sustainable Development Report 2020; Cambridge University Press: Cambridge, UK, 2020; Available online: https://www.sustainabledevelopment.report/reports/sustainable-development-report-2020/ (accessed on 26 September 2023).
- Halpern, B.S.; Longo, C.; Scarborough, C.; Hardy, D.; Best, B.D.; Doney, S.C.; Katona, S.K.; McLeod, K.L.; Rosenberg, A.A.; Samhouri, J.F. Assessing the Health of the US West Coast with a Regional-Scale Application of the Ocean Health Index. PLoS ONE 2014, 9, e98995. [Google Scholar] [CrossRef]
- Wu, J.G. Landscape sustainability science: Ecosystem services and human well-being in changing landscapes. Landsc. Ecol. 2013, 28, 999–1023. [Google Scholar] [CrossRef]
- Daly, H.E. On Wilfred Beckerman’s critique of sustainable development. Environ. Values 1995, 4, 49–55. [Google Scholar] [CrossRef]
- Rickels, W.; Quaas, M.F.; Visbeck, M. How healthy is the human-ocean system? Environ. Res. Lett. 2014, 9, 044013. [Google Scholar] [CrossRef]
- Rickels, W.; Dovern, J.; Hoffmann, J.; Quaas, M.F.; Schmidt, J.O.; Visbeck, M. Indicators for monitoring sustainable development goals: An application to oceanic development in the European Union. Earth’s Future 2016, 4, 252–267. [Google Scholar] [CrossRef]
- Sachs, J.; Schmidt-Traub, G.; Kroll, C.; Durand-Delace, D.; Teksoz, K. SDG Index and Dashboards—Global Report; Bertelsmann Stiftung and Sustainable Development Solutions Network: New York, NY, USA, 2016. [Google Scholar]
- Dovern, J.; Quaas, M.F.; Rickels, W. A comprehensive wealth index for cities in Germany. Ecol. Indic. 2014, 41, 79–86. [Google Scholar] [CrossRef]
- Lafortune, G.; Fuller, G.; Moreno, J.; Schmidt-Traub, G.; Kroll, C. SDG Index and Dashboards Detailed Methodological Paper; Bertelsmann Stiftung and Sustainable Development Solutions Network: New York, NY, USA, 2018. [Google Scholar]
- Wang, Q.; Liu, C.; Hou, Y.T.; Xin, F.; Mao, Z.; Xue, X.Z. Study of the spatio-temporal variation of environmental sustainability at national and provincial levels in China. Sci. Total Environ. 2022, 807, 12. [Google Scholar] [CrossRef]
- Ali, S.M.; Appolloni, A.; Cavallaro, F.; D’Adamo, I.; Di Vaio, A.; Ferella, F.; Gastaldi, M.; Ikram, M.; Kumar, N.M.; Martin, M.A.; et al. Development Goals towards Sustainability. Sustainability 2023, 15, 9443. [Google Scholar] [CrossRef]


Disclaimer/Publisher’s Note: The statements, opinions and data contained in all publications are solely those of the individual author(s) and contributor(s) and not of MDPI and/or the editor(s). MDPI and/or the editor(s) disclaim responsibility for any injury to people or property resulting from any ideas, methods, instructions or products referred to in the content. |
© 2023 by the authors. Licensee MDPI, Basel, Switzerland. This article is an open access article distributed under the terms and conditions of the Creative Commons Attribution (CC BY) license (https://creativecommons.org/licenses/by/4.0/).