Article

Spatiotemporal Dynamics of the Suitability for Ecological Livability of Green Spaces in the Central Yunnan Urban Agglomeration

1
Faculty of Architecture and City Planning, Kunming University of Science and Technology, Kunming 650500, China
2
College of Landscape Architecture and Horticulture Sciences, Southwest Forestry University, Kunming 650224, China
*
Author to whom correspondence should be addressed.
Sustainability 2023, 15(22), 15964; https://doi.org/10.3390/su152215964
Submission received: 29 August 2023 / Revised: 31 October 2023 / Accepted: 10 November 2023 / Published: 15 November 2023
(This article belongs to the Section Sustainable Urban and Rural Development)

Abstract

:
Green spaces are an essential aspect of building an eco-livable city and play an important role in building for eco-livability in the central Yunnan urban agglomeration. However, there are relatively few studies evaluating the eco-livability of green spaces. The establishment of a green-space eco-livability assessment system may help researchers to analyze the eco-livability of urban green spaces more effectively. To address this research gap, we constructed an ecological livability-evaluation index system for green spaces that incorporates three determinants—economic development, social life, and the ecological environment—using the green spaces of the urban agglomeration in central Yunnan as a case study. We used the entropy method to calculate the suitability for ecological livability of the green spaces in each district and county in the central Yunnan urban agglomeration for 2010, 2015 and 2020. We used the spatial autocorrelation analysis function of ArcGIS 10.8 software to explore the spatial clustering characteristics of the suitability for ecological livability of green spaces in the central Yunnan urban agglomeration. The results showed that, from 2010 to 2020, the suitability for ecological livability of green spaces of the 49 districts and counties in the central Yunnan urban agglomeration increased in some districts and decreased in others. The spatial characteristics were high in the central districts and counties and low in the peripheral districts and counties. The spatial characteristics of the suitability of the target layers for economic development and ecological-environment target were consistent with the overall suitability. Through a spatial autocorrelation analysis, we observed that the suitability of green spaces for ecological livability had a positive spatial correlation and demonstrated significant spatial clustering. In this study, we propose recommendations to improve the suitability for ecological livability of green spaces from two dimensions of government policy and urban development, using a combination of the three target layers. The results of the study provide a reference for decision-making in the construction of eco-livable cities in the central Yunnan urban agglomeration.

1. Introduction

Green spaces are an extremely important foundation of building an ecologically livable city. They include all areas in a region where plants grow [1]. Urbanization is an inevitable trend in urban development that has resulted in significant changes to economies, social structures, production, and lifestyles [2,3]. It has also resulted in substantial negative impacts, pressures, and challenges for green spaces [4,5,6,7,8]. In view of the prominence of these urban problems, researchers have begun to consider the disadvantages of traditional urbanization models by proposing a goal of building ecologically livable cities as a new approach to urban development.
For this study, we searched the China Knowledge and Web of Science platforms using the keywords “ecological and livable city”, “eco-livable city”, and “livability city”. According to our literature analysis, the current research on ecological livability focuses on four main aspects: the definition of ecological livability, evaluation index systems, evaluation methods, and construction measures. In terms of definition, the concept of eco-livability was proposed at the beginning of the 21st century. Different researchers have different views. Lu [7] posited that eco-livability includes all aspects of economic development, social development, and ecological environmental quality and that these factors objectively and realistically reflect the eco-livability of cities. Li [9] argued that eco-livability encompasses the natural environment, the spiritual humanistic environment, and the soft environment of the social life of residents. Xie [10] considered an eco-livable city to be one in which the natural and human environments are perfectly integrated, where the social system and the ecosystem co-exist in harmony. Evidently, a unified concept of eco-livability has yet to be developed. By synthesizing the views of most researchers, we defined eco-livability as a composite system that encompasses economic prosperity and social development, as well as a clean and beautiful ecological environment. This concept involves the sustainability and coordination of the economy, society, and the environment [11]. It reflects the degree of civilization and the sustainable development of an area. It is also an essential requirement for urban development [12].
At present, the literature on the construction of an ecological-livability indicator system mainly considers two factors: the construction of subjective indicators and the construction of objective indicators. Subjective indicators are constructed mainly through questionnaires and interviews and are used to construct a comprehensive assessment of resident satisfaction. Objective indicators assess the ecological livability of a city mainly through quantitative measurements. Subjective indicators have the advantage of measuring the ecological livability of a city primarily from a human perspective and are often used in surveys of individual areas. The advantage of objective indicators is that they can be studied from multidimensional and multiregional perspectives [13]. It is well known that the indicators for assessing eco-livability are diverse. However, there is general agreement that economic, social, and environmental factors are the main factors determining eco-livability [12]. For example, Li constructed evaluation indexes based on five factors: population, society, environment, support, and residence [14]. Fan built evaluation indexes based on three factors: citizen, ecology, and city [15]. Barrera-Roldán constructed evaluation indexes based on three factors: economy, society, and nature [16]. Ghasemi constructed evaluation indexes based on residential land, urban infrastructure, health facilities, green spaces, industry, commerce, military, etc. [17]. Zanella constructed the evaluation indexes from two factors: human well-being and environmental impact [18].
In the research on the methods of evaluating ecological livability, scholars mainly use subjective evaluation methods, objective evaluation methods, or a combination of subjective and objective methods. Subjective evaluation methods mainly include questionnaire surveys [19,20] and the analytic hierarchy process (AHP) [21,22]. Objective evaluation methods mainly consist of principal component analysis (PCA) [23], grey correlation analysis [24], the technique for order of preference by similarity to ideal solution (TOPSIS) [25], and the entropy method [26]. The main method of combining subjective and objective methods is to use a questionnaire survey combined with objective evaluation methods [27].
Researchers have evaluated the ecological livability of cities [28], urban agglomerations [29], regions [13], and provinces [30], as well as of places on other geographic scales [31]. Several researchers have evaluated ecological livability from the perspectives of innovative urban development [32], suitable industry [33], ecological space [34], and Sansheng space [35]. The scope of research on eco-livability assessments mainly focuses on individual cities; there are relatively few studies on the eco-livability of urban agglomerations. Research on the construction of an ecological-livability evaluation index system from the perspective of green spaces is relatively limited, and the scope of this research is confined to a small scale [36].
The central Yunnan urban agglomeration is the bridgehead of Yunnan to Southeast Asia and the gateway support area of the Belt and Road construction project in China. In the Central Yunnan Urban Agglomeration Plan (2016–2049), one of the development goals is the construction of an urban agglomeration that is ecologically livable with respect to the mountains and the watershed. With the accelerated urbanization of the central Yunnan urban agglomeration, the size and number of green spaces are gradually decreasing. Green spaces play an important role in building an ecologically livable central Yunnan urban agglomeration.
Based on the above factors, we constructed an innovative assessment of the suitability for ecological livability of the urban agglomeration in central Yunnan from the perspective of green spaces. The research innovations and main contributions of this study include the following: (1) a eco-livability evaluation index system for green spaces constructed using three factors: economic development, social life, and the ecological environment. Constructing the ecological livability index system for green space is rarely addressed in other studies; and (2) the identification of the spatial and temporal changes and spatial distribution of green spaces’ suitability for ecological livability in the central Yunnan urban agglomeration. In this study, we propose suggestions for development to improve the suitability for ecological livability of green spaces in the central Yunnan urban agglomeration. The results of this study may provide a reference for the development of the ecological livability of green spaces in the urban agglomeration of central Yunnan.

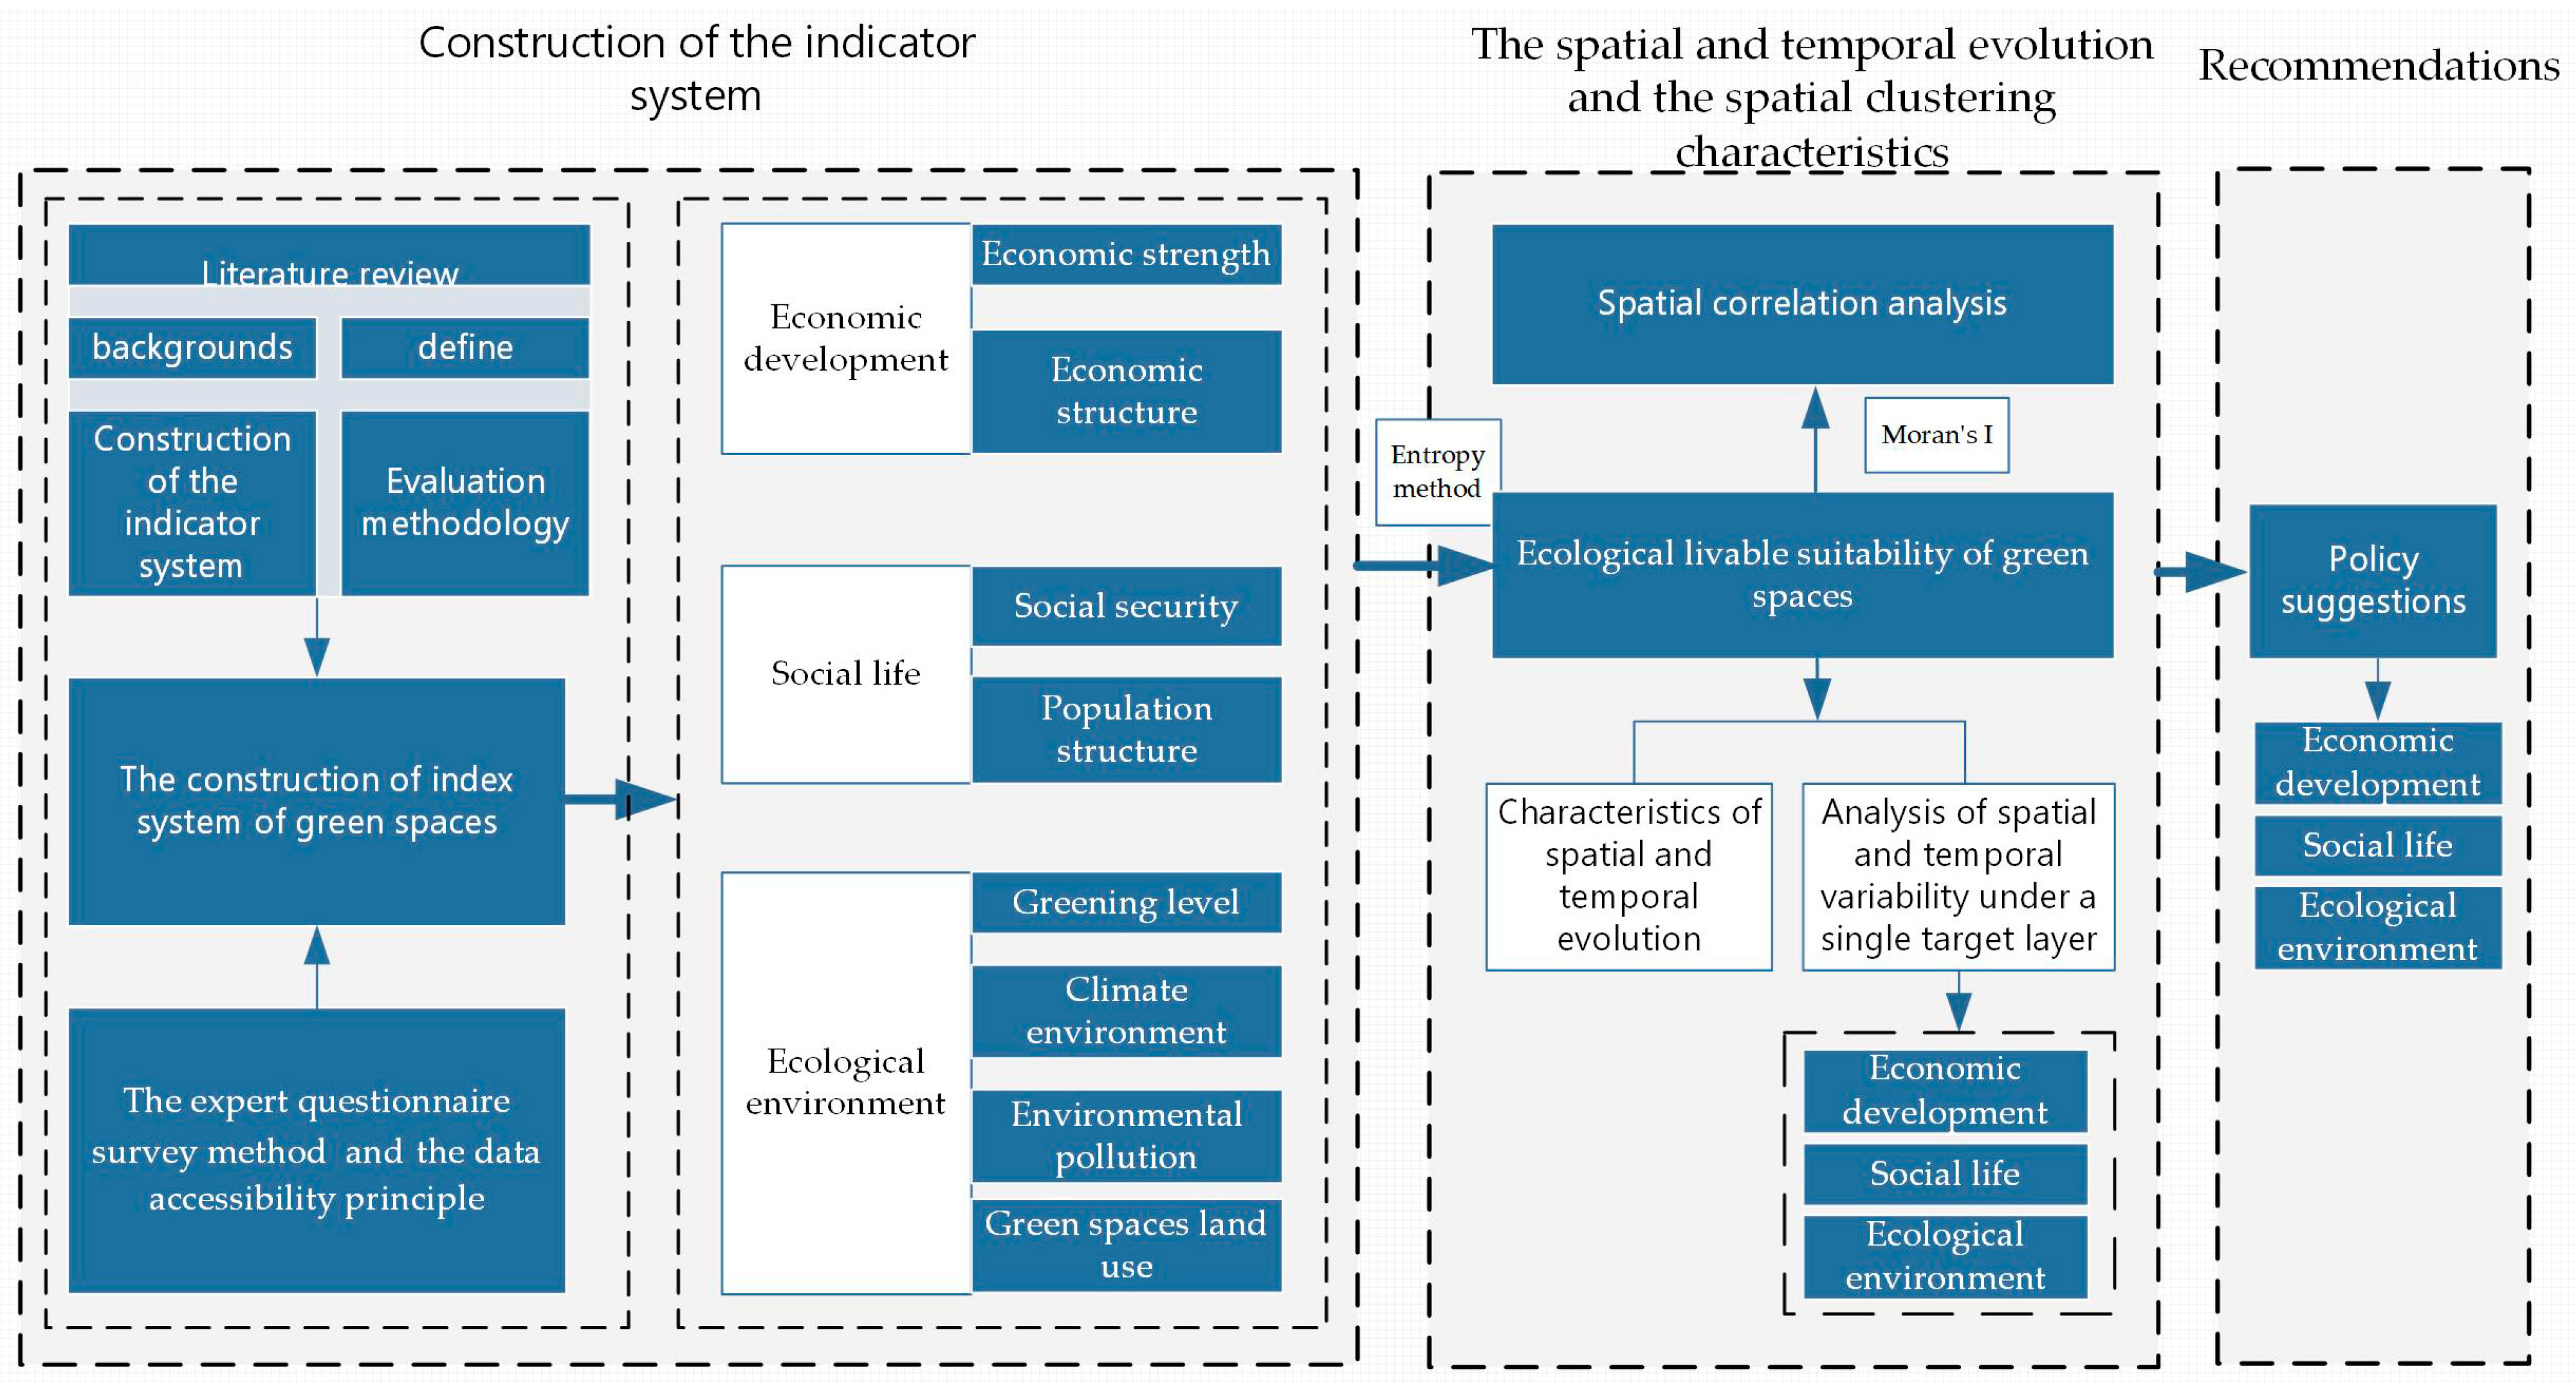
2. Analysis of the Methodological Framework

Figure 1 presents the methodological framework used to evaluate the ecological livability of green spaces in the study area. The framework consisted of three main aspects: (1) the construction of an evaluation indicator system for the ecological livability of green spaces; (2) the spatial and temporal evolution of the suitability for ecological livability of green spaces and the spatial clustering of the urban agglomeration in central Yunnan; and (3) recommendations to improve the suitability for ecological livability of green spaces in the urban agglomeration of central Yunnan.

3. Materials and Methods

3.1. Study Area

The urban agglomeration in central Yunnan has a lake basin karst plateau landscape, with mountains and intermountain basins as the main terrain. The climate is mild and humid, with abundant precipitation. The region experiences a low-latitude plateau mountain monsoon climate. According to the Central Yunnan Urban Agglomeration Plan (2016–2049), the scope of the area includes Kunming, Qujing, Yuxi, Chuxiong, and seven districts and counties in the north of Honghe, which comprises 49 districts and counties (Figure 2). It is one of the urban agglomerations cultivated by the state and is a key area for the development of the western region. Its land area accounts for 29% of the land area of Yunnan Province, approximately 111,400 square kilometers. According to existing statistics, the resident population of the central Yunnan urban agglomeration was 21.4376 million at the end of 2019. The urbanization rate was over 60%, and the regional GDP was CNY 14,091.72 trillion, accounting for 60.68% of the GDP of Yunnan Province.

3.2. Construction of the Evaluation System and Data Sources

3.2.1. Construction of the Evaluation System

We constructed an eco-livability evaluation system for green spaces based on three factors, namely, economic development, social life, and the ecological environment, from the perspective of “green spaces” and of eco-livability. The specific steps were as follows.
1. Based on the “Scientific Evaluation Criteria for Livable Cities (2007)” and the relevant studies of more than 40 researchers in China and abroad, we derived evaluation indicators related to ecological livability and integrated green-space land use from the perspective of green spaces (Figure 3). In this study, green spaces included four land-use types. These were forest land, farmland, grassland, and water bodies [1].
2. We distributed an expert questionnaire to construct eco-livability indicators for green spaces. We designed a questionnaire format in which a scoring system was combined with open-ended modifications. In total, 29 questionnaires were returned. Of these, 28 were valid. The main areas of expertise of the participants in this study included landscape architecture, gardening, urban and rural planning, human geography, and urban ecology.
3. Based on the expert questionnaire survey and data accessibility in the study area, we selected 25 indicators as the eco-livability evaluation indicators for green spaces (Table 1).

3.2.2. Data Sources

The data required for the seven subsystems of economic strength, economic structure, social security, population structure, greening level, climate environment, and environmental pollution were sourced from various official publications. These sources included the Yunnan Province Statistical Yearbook, the Kunming City Yearbook, the Qujing City Yearbook, the Chuxiong Prefecture Yearbook, the Honghe Prefecture Yearbook, the Yuxi City Yearbook, and the yearbooks and statistical yearbooks of different districts and counties from 2010 to 2020. The land-use data for 2010, 2015, and 2020 required by the land-use subsystem were sourced from the Center of Resources and Environmental Science and Data, Chinese Academy of Sciences (http://www.resdc.cn (accessed on 2 August 2022)). We used the interpolation method to complete the missing data and deleted the evaluation indicators that were missing a very large number of datapoints [15,37,38].

3.3. Methods

3.3.1. Entropy Method

The entropy method is an objective evaluation method that can eliminate the influence of cognitive biases, making the process of determining the weights of indicators more rational and the evaluation results more scientific compared with the subjective method [39]. Compared with other objective methods, the entropy method algorithm is simple and easy to understand and has a wide range of applications. It can be applied to a variety of decision problems and different types of data [40]. The entropy method uses the degree of aggregation of the raw data of an indicator to determine its weight, which is used to indicate the degree of importance of an indicator among all indicators. In the entropy method, the sum of the weights of all indicators is equal to 1. Usually, the greater the weight of an indicator, the more it affects the results [41]. We used the entropy method to determine the weights of the indicators (Table 1). The steps were as follows.
(1) The data were normalized.
Positive   index :   Y i j = x i j x m i n x m a x x m i n
Negative   index :   Y i j = x m a x x i j x m a x x m i n
where Yij refers to the values of the positive and negative indicators after data normalization, with Yij ∈ [0, 1]; xij refers to the original positive and negative indicator values; and xmax and xmin refer to the maximum and minimum values of the original indicators, respectively.
(2) The data were shifted: Because “0” values remaining after normalization would affect subsequent calculations, order to eliminate them, a shifting of 0.0001 was carried out on the indicators after the normalization of the data [42].
X i j = Y i j + 0.0001
where Xij is the indicator after the shifting process, with Xij ∈ [0, 1].
(3) The weight of j indicator in i city was calculated as follows:
P i j = X i j i = 1 m X i j
(4) The entropy of j indicator was calculated as follows:
e j = 1 I n m i = 1 m P i j I n P i j
(5) The coefficient of variation dj for indicator j was calculated as follows:
d j = 1 e j
The greater the value of dj, the more important indicator j is in the calculation.
(6) The weights of the indicators were calculated as follows:
W j = d j k = 1 n d k
(7) The composite livability was calculated as follows:
R = j = 1 n W j Y i j

3.3.2. Moran’s I

Moran’s I index includes a global Moran’s I index and a local Moran’s I index [43]. We used the spatial statistical analysis tools of ArcGIS 10.8 software—namely, spatial autocorrelation (global Moran’s I index) and cluster and outlier analysis (local Moran’s I index)—to analyze the spatial correlation of the ecological livability of green spaces in the urban agglomeration of central Yunnan. We explored the spatial clustering of the ecological livability of green spaces in the central Yunnan urban agglomeration by calculating the global and local spatial autocorrelations. The formulas were as follows.
Global   Moran s   I   index :   I 1 = i = 1 N j = 1 N W i j G i G P G j G P i = 1 N j = 1 N W i j i = 1 N G j G P 2
Local   Moran s   I   index :   I 2 = G i G P i = 1 N G i G P 2 j = 1 N G j G P
where N is the number of cities in the central Yunnan urban agglomeration; Wij represents the spatial weight matrix; Gi is the suitability for ecological livability of the green spaces of each city; Gj indicates the suitability for ecological livability of the green spaces of the neighboring cities of city i; and GP is the average value of the suitability for ecological livability of the green spaces of each city. The value of I is in the range of [−1, 1]. The closer the value of I is to 1, the greater the positive correlation between cities; the closer the value of I is to −1, the greater the negative correlation between cities; and if the value of I is close to 0, this result indicates that there is no correlation between cities [44,45,46].

4. Results

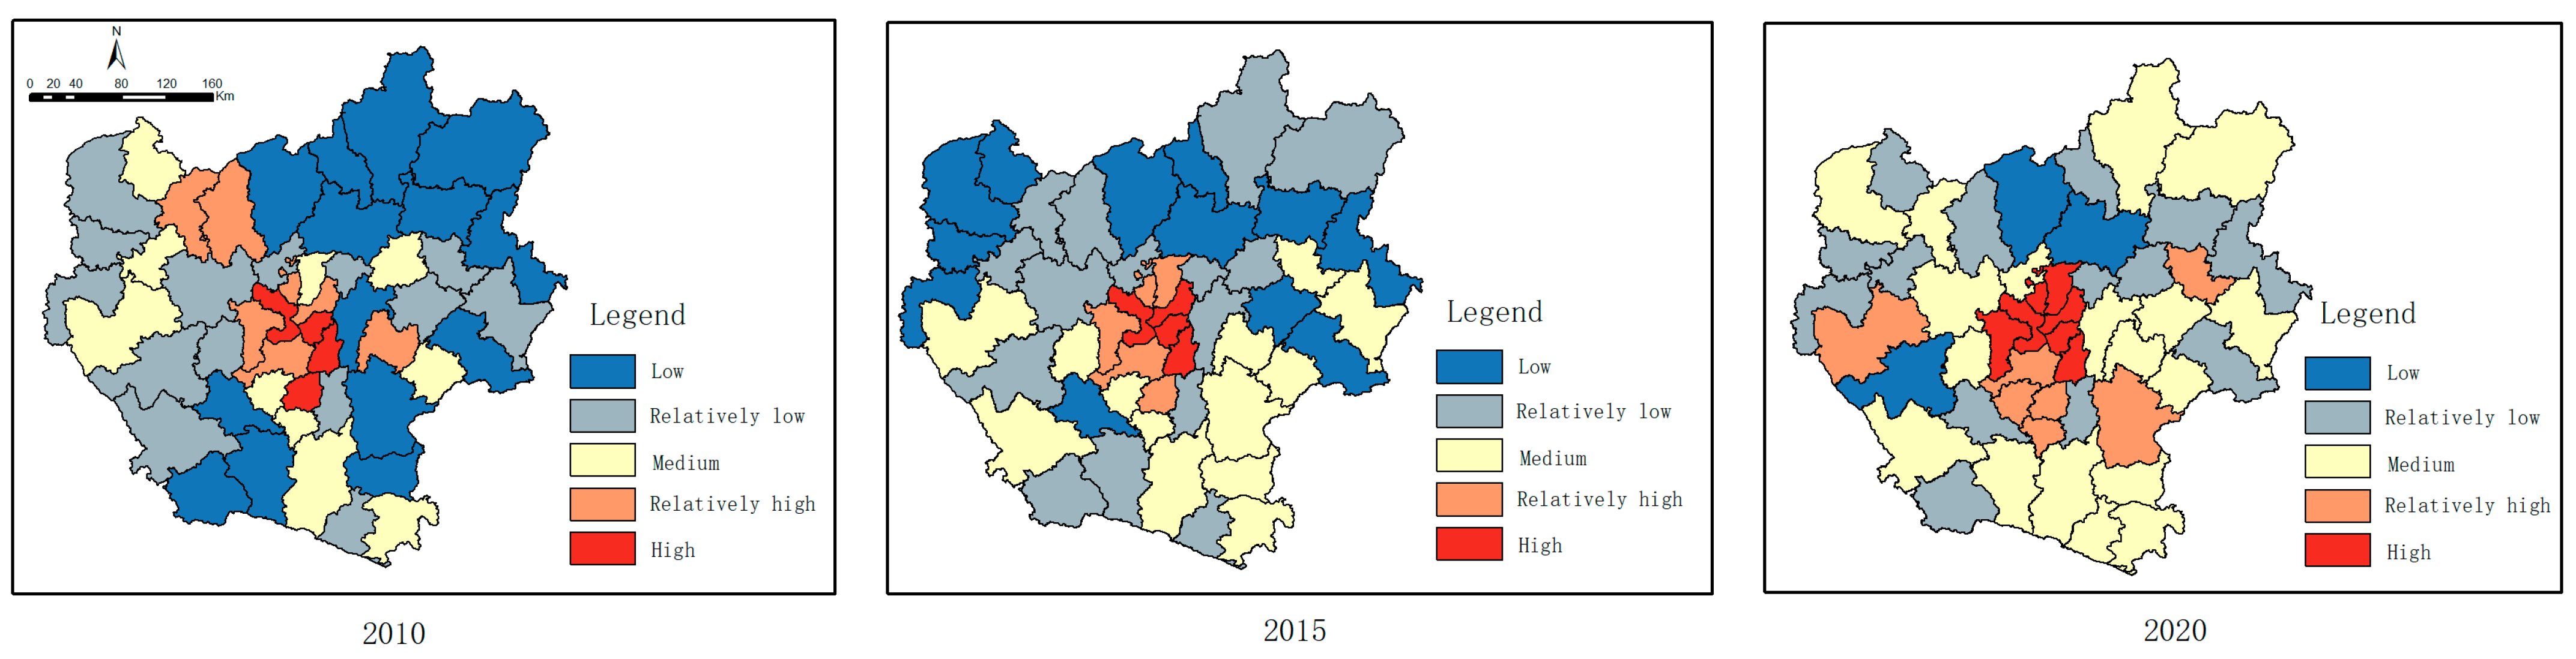
4.1. Characteristics of the Spatial and Temporal Evolution of the Suitability for Ecological Livability of Green Spaces

4.1.1. Characteristics of Temporal Evolution

Based on Formulas (1)–(8), this study assessed the suitability for ecological livability of green spaces in the 49 districts and counties of the central Yunnan urban agglomeration from 2010 to 2020 (Figure 4 and Table 2). From the perspective of temporal evolution, the three time periods of 2010–2015, 2015–2020 and 2010–2020 all showed increasing or decreasing trends in the suitability for ecological livability of their green spaces. From 2010 to 2015, some districts and counties in the northwest and south of the central Yunnan urban agglomeration showed a decrease, whereas others showed an increase. The largest decrease was in Chengjiang, where the value changed from 0.499 to 0.397, a decrease of 0.102. The largest increase was in Wuhua, where the value changed from 0.258 to 0.366, an increase of 0.107. From 2015 to 2020, the suitability for ecological livability of green spaces in Xundian and Shuangbai decreased, but it increased in the other districts and counties. The largest decrease was in Xundian, where the value changed from 0.198 to 0.187, a decrease of 0.011. The largest increase was in Anning, where the value changed from 0.297 to 0.390, an increase of 0.093. From 2010 to 2020, certain districts and counties in the northwestern part of the central Yunnan urban agglomeration showed a declining trend, whereas the remaining areas showed an increasing trend. Yuanmou had the greatest decrease, from 0.299 to 0.274; this was a decrease of 0.025. Panlong had the greatest increase, from 0.253 to 0.423; this was an increase of 0.170.

4.1.2. Characteristics of Spatial Evolution

This study visualized the suitability for ecological livability of green spaces in the 49 districts and counties of the central Yunnan urban agglomeration from 2010 to 2020. The comprehensive suitability for ecological livability of green spaces was classified into five levels using the natural breakpoint grading method [47]. These levels were high, relatively high, medium, relatively low, and low (Figure 5). In the three phases of 2010, 2015 and 2020, the suitability for ecological livability of the central districts and counties of the urban agglomeration was higher than that of the peripheral districts and counties. In 2010, the zones with green spaces rated as having high and relatively high suitability for ecological livability in the central Yunnan urban agglomeration were mainly located in its central and northwestern regions, while the zones rated low and relatively low were widely distributed. In 2015, the zones rated high and relatively high were mainly located in the central part of the urban agglomeration, while the zones rated low and relatively low were mainly located in the northern, northwestern and northeastern parts. In 2020, the zones rated high and relatively high were primarily located in the central region, with a reduced extent of zones rated low and relatively low, mainly in the northern and northwestern regions of the urban agglomeration.

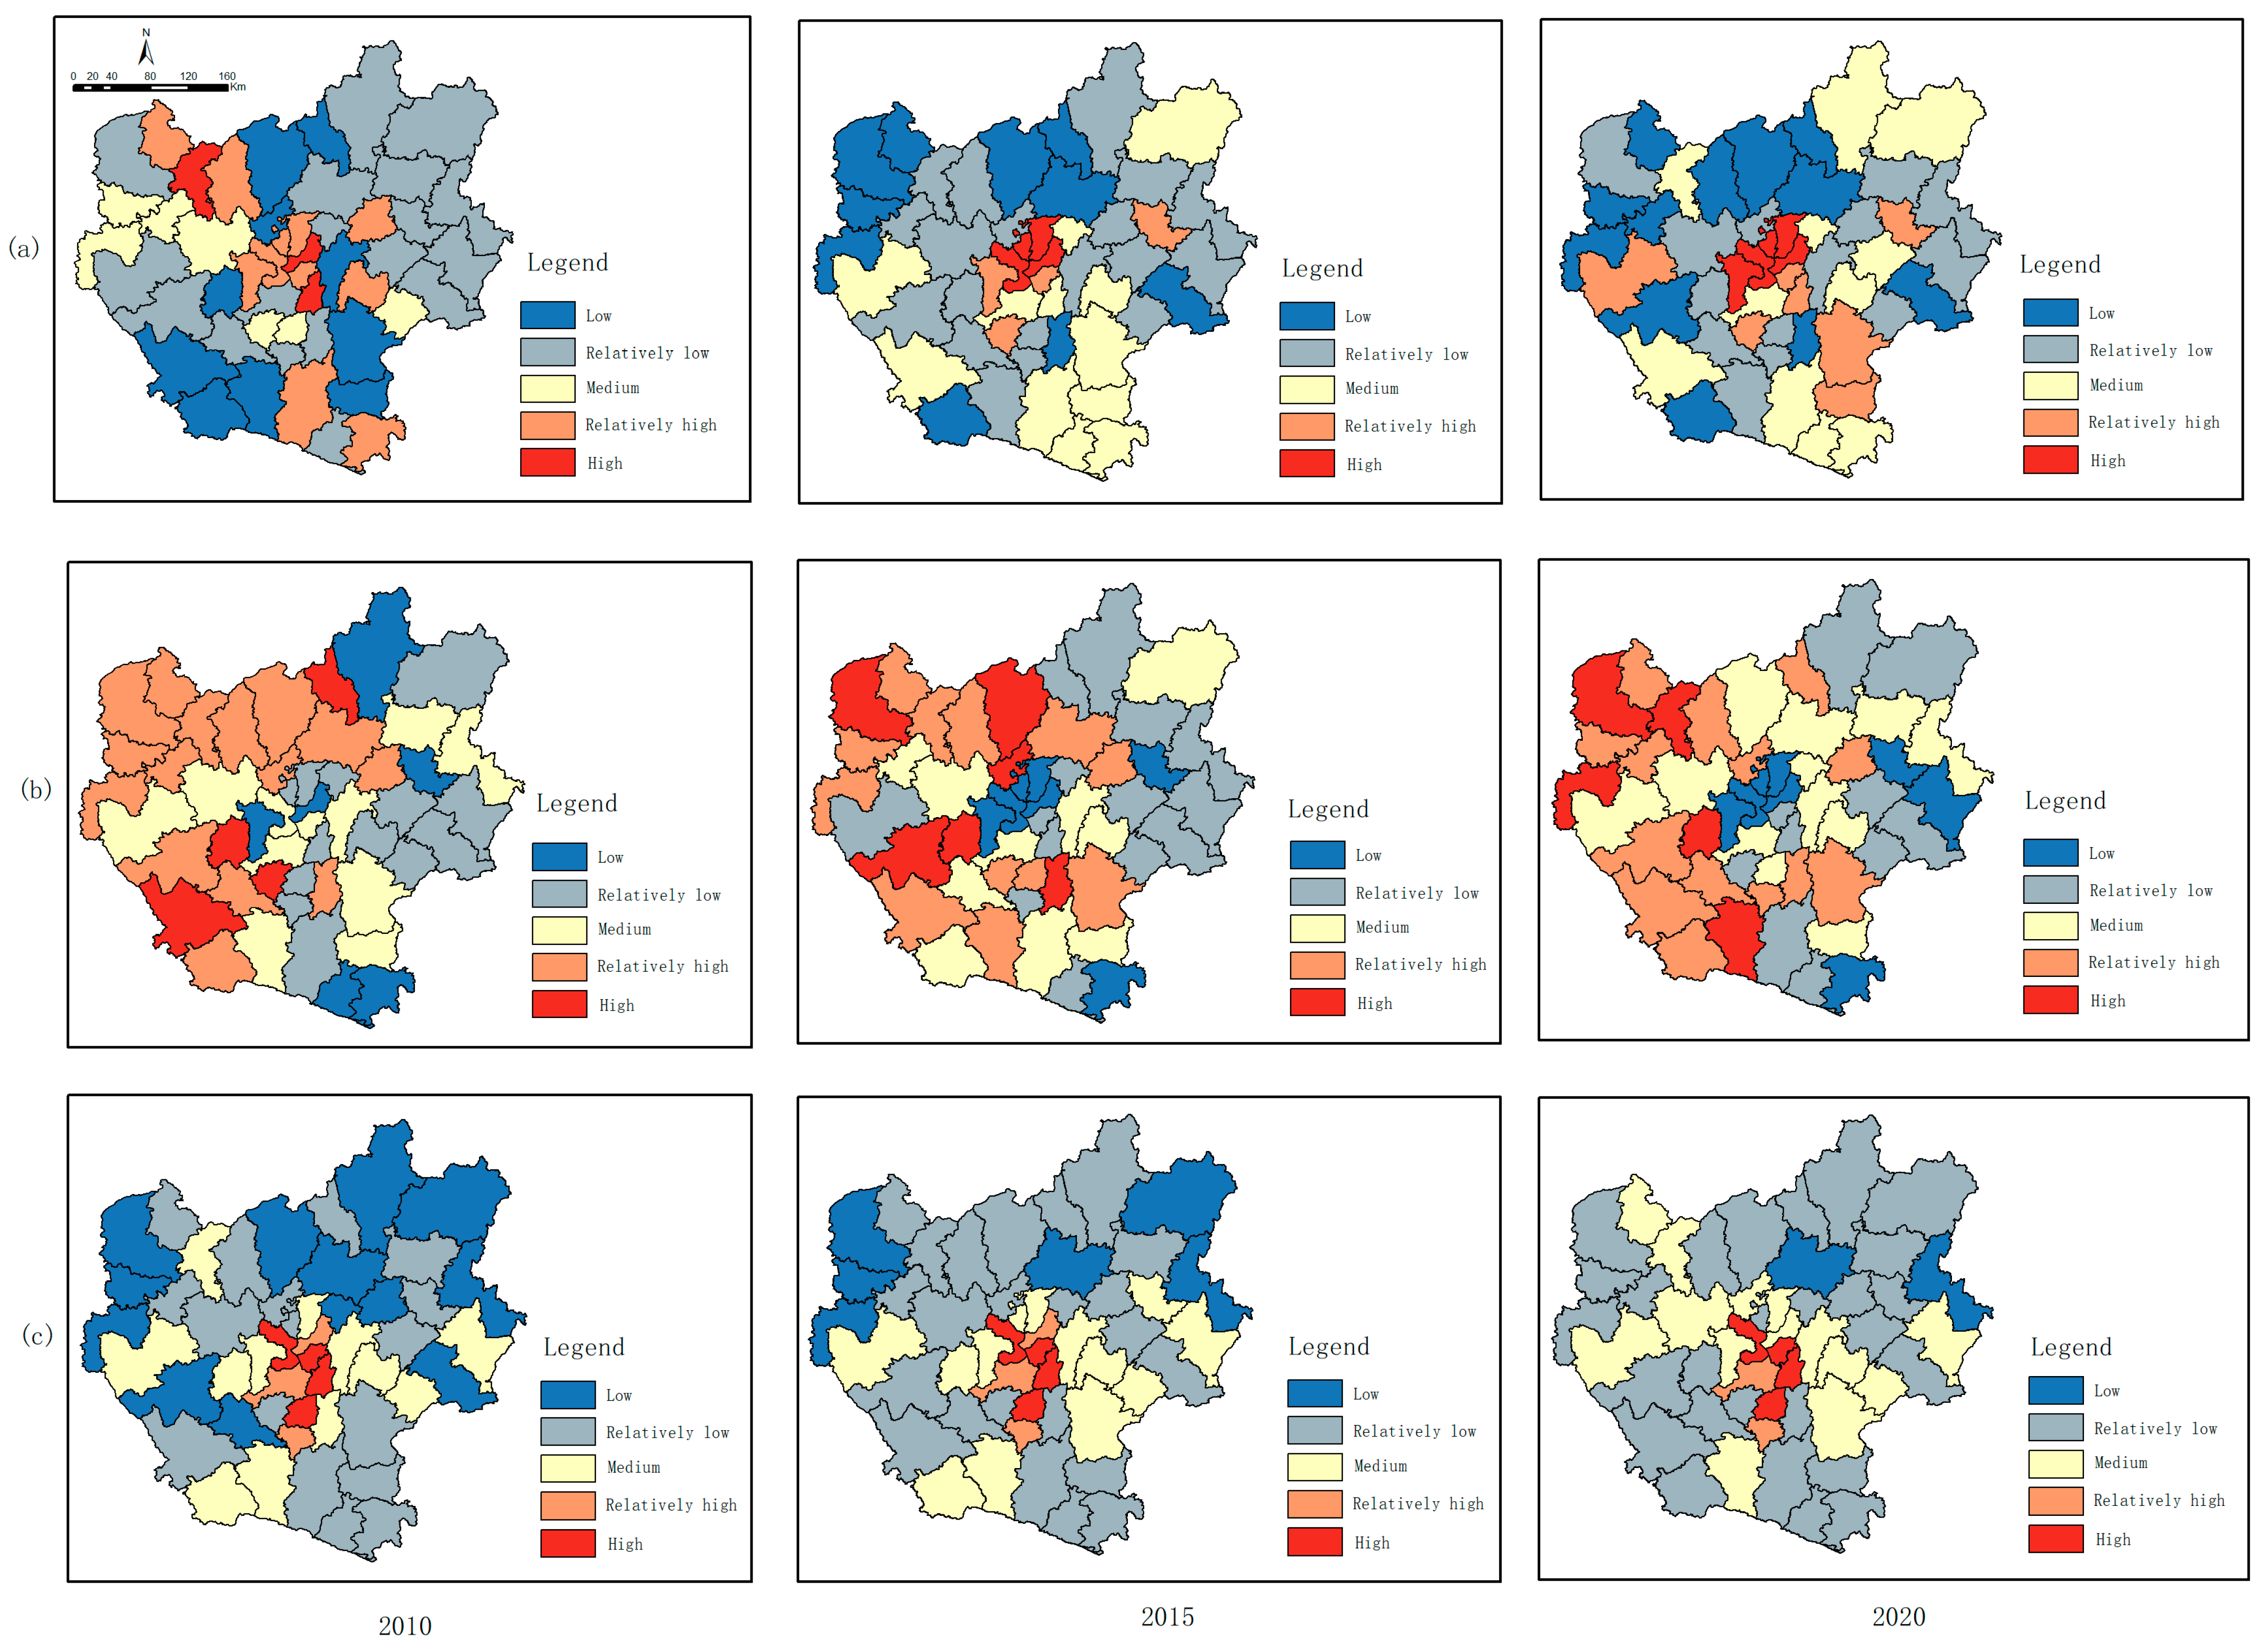
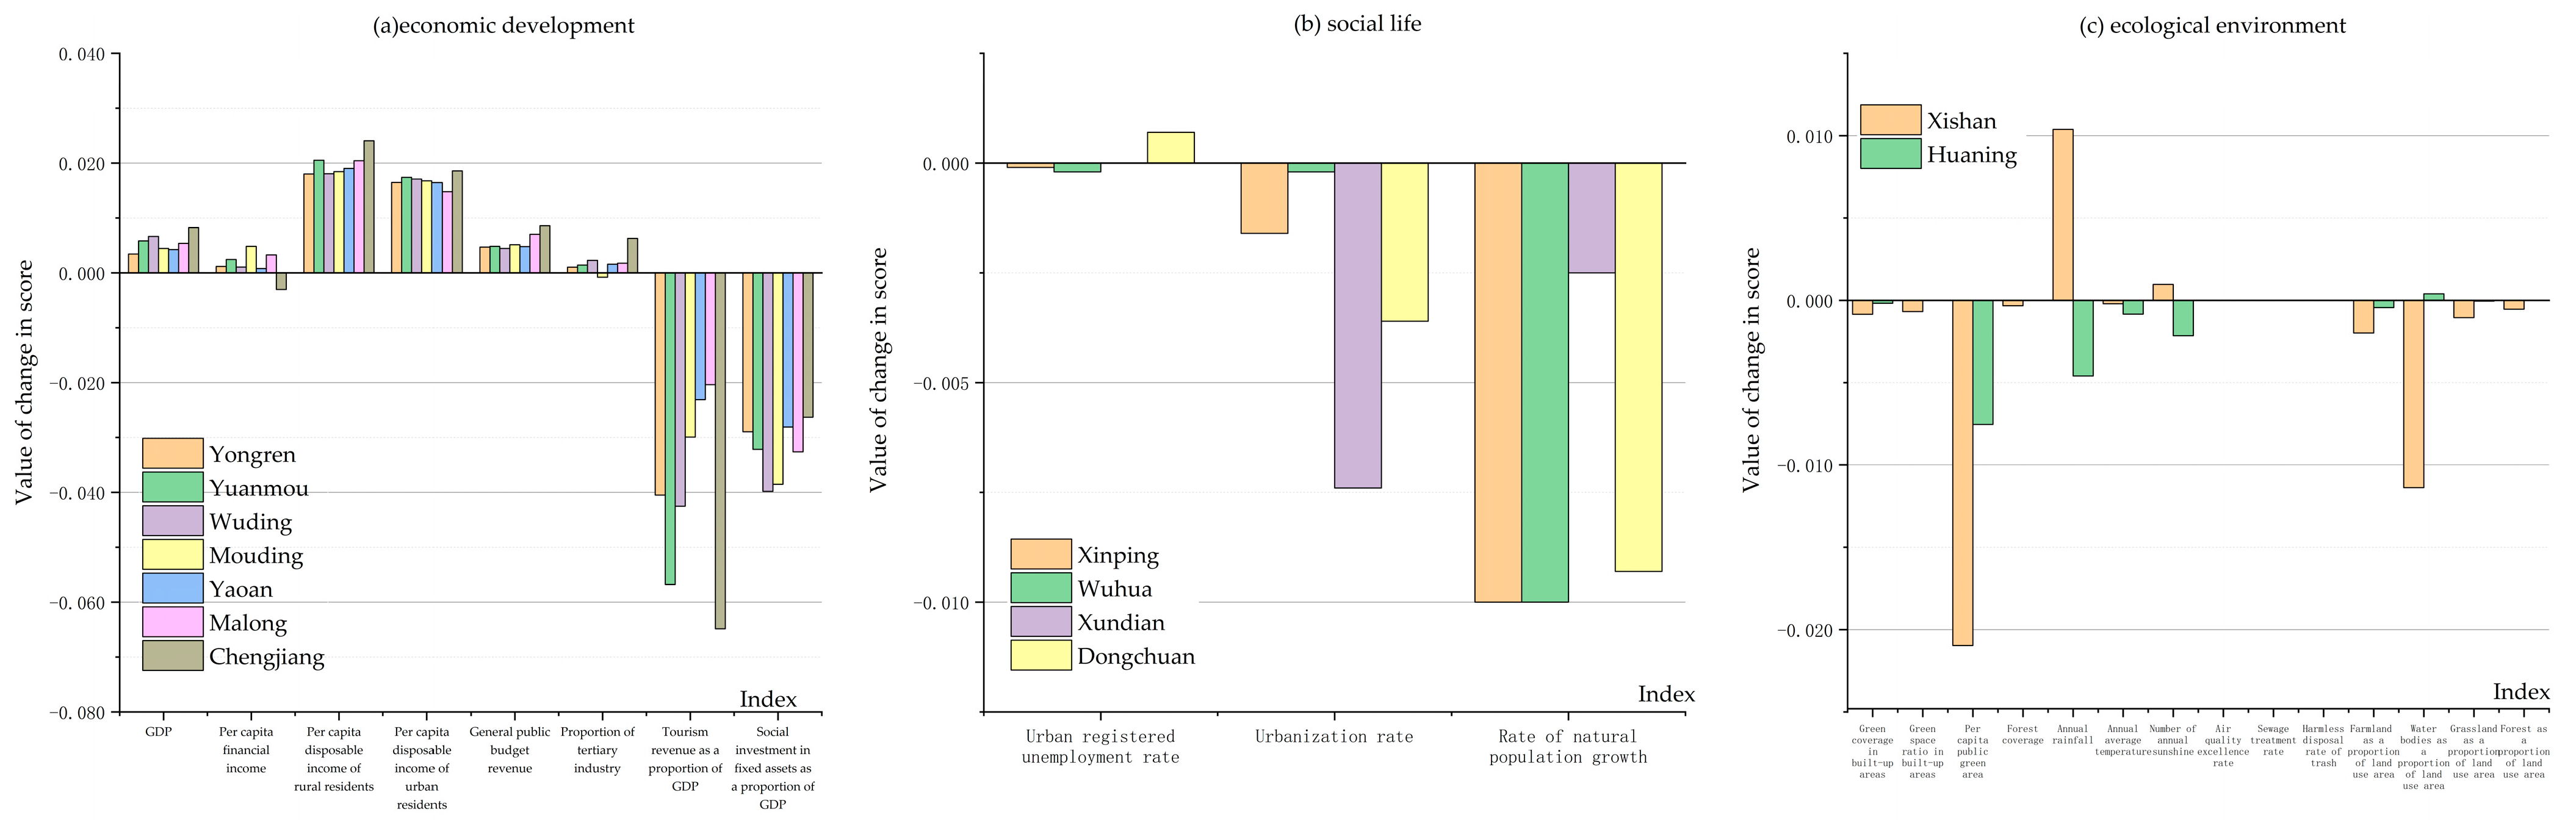
4.2. Analysis of Variability under a Single Target Layer of the Suitability for Ecological Livability of Green Spaces

In this study, the suitability for eco-livability of green spaces in 49 districts and counties in the central Yunnan urban agglomeration was calculated under the three single target layers of economic development, social life, and ecological environment, considering data from 2010 to 2020. Our aim was to explore the spatial variability of the green spaces’ suitability for ecological livability according to each objective layer.

4.2.1. Characteristics of Temporal Evolution

The three single target layers of economic development, social life, and ecological environment showed increases or decreases in the three time periods of 2010–2015, 2015–2020, and 2010–2020 (Figure 6). From 2010 to 2015, the economic-development target layer showed an increasing trend in all districts and counties except in areas in the northwest, center, and south of the urban agglomeration. The social-life target layer showed an increasing trend in all districts and counties except for the southwestern and central regions of the urban agglomeration. The ecological-environment target layer showed a decreasing trend in all districts and counties except for the central and eastern regions. From 2015 to 2020, all districts and counties except for Mouding showed an increase in the economic-development target layer. The districts and counties that showed an increase in the social-life target layer were mainly located in the central, northwestern, and southwestern regions of the urban agglomeration. The districts and counties that showed an increase in the ecological-environment target layer were mainly located in the northwest and south of the urban agglomeration. From 2010 to 2020, the districts and counties in the northwestern part of the urban agglomeration and other areas showed a decrease in the economic-development target layer, while the rest of the areas showed an increase. In the social-life target layer, the districts and counties in the north and southwest of the urban agglomeration showed a decreasing trend, while those in the northwest showed an increase. The districts and counties showing a decrease in the ecological-environment target layer were mainly located in the central and southern regions of the urban agglomeration, while the remaining districts and counties showed an increase.

4.2.2. Characteristics of Spatial Evolution

As presented in Figure 7, the economic-development target layer and the ecological-environment target layer showed high suitability in the middle of the region and low suitability in the surrounding areas in 2010, 2015, and 2020. The social-life target layer showed high suitability in the surrounding areas and low suitability in the middle. In 2010, the areas with high or relatively high suitability according to the economic-development target layer were mainly distributed in the central and southern regions of the urban agglomeration. In 2015, the areas with high or relatively high suitability were mainly distributed in the central area of the urban agglomeration. In 2020, the areas with high or relatively high suitability were mainly distributed in the central and southeastern regions of the urban agglomeration, as well as in other areas. The values in the economic-development target layer were high in the middle of the region and low in the surrounding areas because the central districts and counties of the urban agglomeration were the core areas of the central Yunnan urban agglomeration; their economic development was higher than that of the peripheral districts and counties. In 2010, 2015, and 2020, the areas with high or relatively high suitability in the social-life target layer were mainly distributed in the northern, northwestern, and southwestern regions of the urban agglomeration. The values for social life were low in the middle and high in the periphery because the urbanization rate, the urban unemployment rate and the natural population growth rate were higher in the central cities than in the peripheral cities. In 2010, 2015, and 2020, the areas with high or relatively high suitability according to the ecological-environment target layer were mainly distributed in the middle of the urban agglomeration because the weight of the indicator “Water bodies as a proportion of land-use area” is greatest in the ecological environment. Therefore, the cities with a high proportion of water bodies were in areas with a high or relatively high suitability for the ecological-environment target layer.

4.3. Spatial Correlation Analysis of Suitability for Ecological Livability of Green Spaces

This study used ArcGIS 10.8 software to conduct a spatial autocorrelation analysis on the ecological livability of green spaces in the 49 districts and counties of the central Yunnan urban agglomeration in 2010, 2015, and 2020. The global Moran’s I index was positive and passed the 5% significance test. This result indicates that there is a positive spatial correlation in the ecological livability of green spaces in the 49 districts and counties (Table 3). During 2010–2020, the Moran’s I index first increased and then decreased and increased overall, which means that the spatial correlation of the suitability for ecological livability of green spaces in the 49 districts and counties of the central Yunnan urban agglomeration gradually increased and that there is a spatial agglomeration effect in terms of geographical location.
Based on the analysis presented in Figure 8, the spatial clustering of the suitability for ecological livability of the green spaces in the central Yunnan urban agglomeration revealed high–high clustering in the middle of the urban agglomeration and low–low clustering at the edge. The high–high clustering and the low–low clustering were significant. The cause of this phenomenon was that the districts and counties with relatively high levels of suitability for ecological livability of green spaces were mainly concentrated in the core areas of the central Yunnan urban agglomeration, whereas the districts and counties with relatively low levels of suitability were mainly distributed in the peripheral areas. From 2010 to 2020, the high–high cluster areas were mainly located in the central region of the Yunnan urban agglomeration. These regions had a positive spatial spillover effect during development and increased the suitability of the neighboring districts and counties. In 2010, the low–high outlier areas were mainly located in the central region of the urban agglomeration. In 2010 and 2015, the high–low outlier areas were mainly located in the eastern region of the urban agglomeration; in 2020, they were mainly located in the western region of the urban agglomeration. In 2010, the low–low cluster areas were mainly located in the northeastern region of the central Yunnan urban agglomeration; smaller numbers were located in the southwestern and eastern regions. In 2015, these areas were mainly located in the northern and northwestern regions of the urban agglomeration. In 2020, they were mainly located in the northern and southwestern regions of the urban agglomeration. The suitability of the districts and counties in the low–low agglomeration areas was relatively low; the suitability of the surrounding counties was also low. These cities have the potential to develop the suitability for ecological livability of green spaces, which is crucial for improving the green spaces of the central Yunnan urban agglomeration. Therefore, cooperation between districts and counties should be strengthened and the development of the cities at the top level should be promoted to enhance the development of the cities at the bottom level, thus improving the overall livability of the central Yunnan urban agglomeration.

5. Discussion and Recommendations

5.1. Discussion

We observed that the economic-development layer was weighted most heavily among the target layers, indicating that economic development plays a substantial role in the suitability for ecological livability of green spaces. This result was consistent with that of a previous study [48]. The suitability for eco-livability of green spaces according to the three dimensions of economic development, social life and ecological environment in 2010–2020 showed a decreasing trend in certain districts and counties. The districts and counties with the largest decreases in the suitability for ecological livability of green spaces according to the economic-development target layer during 2010–2020 included Yongren, Yuanmou, Wuding, Muding, Yaoan, Chengjiang and Malong. This effect was observed because these cities showed a decrease in tourism revenue as a proportion of GDP and in the social investment in fixed assets as a proportion of GDP. Among all the economic-development indicators, only these two indicators showed negative suitability values (Figure 9a). The districts and counties with a relatively large decrease in the suitability for ecological livability of green spaces under the social-life target layer during 2010–2020 included Xinping, Wuhua, Xundian, and Dongchuan. This change occurred because these cities showed a small decrease in the suitability of the natural population growth rate and the suitability of the urbanization rate. The change in the urban unemployment rate was negligible (Figure 9b). The districts and counties with large decreases in the suitability for ecological livability of green spaces as shown by the ecological-environment target layer during 2010–2020 included Xishan and Huaning. This change was due to a decrease in the suitability of indicators such as water bodies as a proportion of land-use area, farmland area as a proportion of land-use area, and per capita public green space (Figure 9c).
The spatial correlation of the suitability of green spaces for ecological livability in the city cluster of central Yunnan was positive, and the spatial-agglomeration results showed high–high clustering in the middle of the urban agglomeration and low–low clustering at the edge. Therefore, it is necessary to strengthen cooperation among districts and counties. The cities with the most advanced economic development should lead the cities with the least advanced economic development in order to enhance the overall ecological livability level of green spaces in the central Yunnan urban agglomeration, as well as the coordinated development of the region.

5.2. Recommendations

Based on an analysis of the above research results, we formulated the following recommendations.
(1) Economic construction: The central Yunnan urban agglomeration should speed up the formation of the central Yunnan urban economic circle of “one region, two belts, four cities and several points” to obtain a pattern of regional integration. For cities like Yongren, Yuanmou, Wuding, Muding, Yao’an, Chengjiang and Malong, whose suitability declined according to the economic-development target layer, should focus on economic development, accelerating the construction of a modern ecotourism industry, improving auxiliary tourism services, creating cultural and tourism products, and promoting the modernization and development of the economy. This development will provide economic support for the rational use and planning of green spaces in the central Yunnan urban agglomeration.
(2) Social life: Improvements to the standards of social life play an important role in promoting economic development and optimizing the ecological environment. The government should improve the level of public services to enhance the public sense of wellbeing. Cities such as Xinping, Wuhua, Xundian, and Dongchuan, which demonstrated a decline in suitability according to the social-life target layer, should encourage entrepreneurship and employment, provide skill-training opportunities, increase employment opportunities, reduce urban unemployment, moderately extend the retirement age, and direct young talent to urban areas with lower suitability ratings.
(3) Ecological environment: The government should strictly control the three zones and three lines, strengthen the protection and management of highland lakes, and enhance the monitoring and regulation of the ecological environment. Cities like Xishan and Huaning, which showed a decline in suitability according to the ecological-environment target layer, should pay greater attention to the protection of the ecological environment, especially to the protection of the water systems of Dianchi, Fuxian Lake, Yangzonghai and Qilu Lake. The protection of green spaces should be strengthened, the green coverage rate should be increased, urban green spaces should be rationally planned, and the policy of three zones and three lines should be strictly adhered to.

6. Conclusions

In this study, we constructed a green space eco-livability evaluation index system using an expert questionnaire survey. This evaluation index system was used to effectively assess the suitability for eco-livability of the green spaces in the urban agglomeration in central Yunnan. Due to the feasibility of the methodology and data sources, it can be applied to other urban agglomerations. We assessed the eco-livability suitability of the green spaces in central Yunnan urban agglomeration using an entropy weight method. A spatial autocorrelation analysis revealed the spatial clustering of the suitability for ecological livability of green spaces in the central Yunnan urban agglomeration. According to the composite model, the suitability for ecological livability of green spaces in the urban agglomeration of central Yunnan showed varying degrees of spatial variability and temporal fluctuation. We observed that the suitability of green spaces for ecological livability showed positive spatial correlation and significant spatial-aggregation characteristics. Based on these results from a combination of the three target layers, we propose recommendations to improve the suitability for ecological livability of green spaces based on two dimensions of government policy and urban development. The identified spatial differences can help to accurately assess the suitability for ecological livability of green spaces in each district and county in the urban agglomeration. Such results are of great significance in promoting the development of ecological livability in the urban agglomeration in central Yunnan and provide a reference for planners and managers.
Innovation, Shortcomings, and Outlook
In this study, an expert questionnaire survey was used to construct an eco-livability evaluation index system for green spaces in terms of three factors, namely economic development, social life and ecological environment, which were combined to assess eco-livability. In an improvement on existing studies [35], this indicator system avoided the influence of individual subjective views to the greatest extent possible. Due to the flexibility of the methods and data, the evaluation index system for green-space ecological livability that was constructed in this study could be applied to other regions.
Most studies choose hierarchical analyses and questionnaires to determine indicator weights [19,20,21,22]. These methods are not applicable to multiple cities, and the weighting is subjective. We adopted the entropy method to solve the problem of subjectivity of weighting. This method is also applicable to multi-dimensional and multi-regional research [39].
This study involved the innovative construction of an eco-livability evaluation index for green spaces and showed that the indicator reflecting the proportion of water bodies to overall land use was important in determining the suitability of green spaces for eco-livability. This result represents the difference between this study and other studies.
There were several limitations to this study. First, the study had limitations regarding the construction of composite indicators. The subjectivity of a single composite indicator may be compensated for in the future by constructing interval-based composite indicators [49,50]. With the wide use of composite indicators, their quality becomes a major issue. In the future, we intend to optimize our composite-indicator system by analyzing the uncertainty and sensitivity of each composite indicator [51,52,53]. Secondly, there were limitations of objective conditions such as the large amount of missing data. We deleted indicators with particularly high numbers of missing values, which resulted in our having fewer relevant indicators for social life. Different methods of inputting missing values will lead to different results. In the future, data on social life could be collected from multiple sources to rationally adjust the correspondence among indicators of economic development, social life, and the ecological environment. The advantages and disadvantages of different methods of compiling missing values could also be explored to ascertain the most suitable method. Finally, we explored only the spatial and temporal evolution and spatial distribution of the suitability for ecological livability of green spaces in the urban agglomeration of central Yunnan. In the future, we will continue to explore the mechanisms by which economic development, social life, and the ecological environment influence the suitability for ecological livability of green spaces in the urban agglomeration of central Yunnan through regression modelling.

Author Contributions

Conceptualization, M.L.; Data curation, Y.P., Y.W. (Ying Wang), Y.W. (Yingxue Wang), Y.X. and J.D.; Funding acquisition, M.L.; Investigation, Y.P., Y.W. (Ying Wang), Y.W. (Yingxue Wang), Y.X. and J.D.; Methodology, Y.P. and M.L.; Project administration, M.L.; Software, Y.P. and M.L.; Validation, Y.P. and M.L.; Writing—original draft, Y.P.; Writing—review & editing, Y.P., Y.W. (Ying Wang), Y.W. (Yingxue Wang) and M.L. All authors have read and agreed to the published version of the manuscript.

Funding

This research was funded by the National Natural Science Foundation of China, grant number 52268014 and supported by the Postdoctoral Research Fund of Yunnan Province, grant number CG22256E010A.

Institutional Review Board Statement

Not applicable.

Informed Consent Statement

Not applicable.

Data Availability Statement

The data presented in this study are available on request from the corresponding author.

Conflicts of Interest

The authors declare no conflict of interest.

References

  1. Pan, Y.; Wang, J.; Li, J.; Liu, M.; Wei, X.; Zhi, L. Spatial and Temporal Evolution and Driving Analysis of Green Space Ecosystem Service Value of Urban Agglomeration in Central Yunnan. Res. Soiland Water Conserv. 2023, 30, 352–360. [Google Scholar]
  2. Geng, Y.; Fujita, T.; Bleischwitz, R.; Chiu, A.; Sarkis, J. Accelerating the transition to equitable, sustainable, and livable cities: Toward post-fossil carbon societies. J. Clean. Prod. 2019, 239, 118020. [Google Scholar] [CrossRef]
  3. Mike, D. From global intercity competition to cooperation for livable cities and economic resilience in Pacific Asia. Environ. Urban. 2002, 14, 53–68. [Google Scholar]
  4. Byomkesh, T.; Nakagoshi, N.; Dewan, A.M. Urbanization and green space dynamics in Greater Dhaka, Bangladesh. Landsc. Ecol. Eng. 2012, 8, 45–58. [Google Scholar] [CrossRef]
  5. Li, Y.Y.; Ren, B.T.; Chen, Y.S.; Huang, L.C.; Sun, C.G. Multiscale spatiotemporal dynamics analysis of urban green space: Implications for green space planning in the rapid urbanizing Hefei City, China. Front. Ecol. Evol. 2022, 10, 998111. [Google Scholar] [CrossRef]
  6. Reyes-Riveros, R.; Altamirano, A.; Barrera, F.D.L.; Rozas-Vasquez, D.; Vieli, L.; Meli, P. Linking public urban green spaces and human well-being: A systematic review. Urban For. Urban Green. 2021, 61, 127105. [Google Scholar] [CrossRef]
  7. Lu, D.; Yu, G.; Zhao, P.; Wen, Z. Eco-livable Assessment of Central Plains Urban Group. Ecol. Econ. 2012, 1, 351–354+362. [Google Scholar]
  8. Zhou, B.B.; Aggarwal, R.; Wu, J.; Lv, L. Urbanization-associated farmland loss: A macro-micro comparative study in China. Land Use Policy 2021, 101, 105228. [Google Scholar] [CrossRef]
  9. Xi, L. Providing Decision-making Advice for the Construction of Ecological and Livable Cities in Jilin City by Taking Advantage of “Internet Plus” Information Resources. Agric. Jilin 2019, 4, 110–111. [Google Scholar]
  10. Xie, H.; Feng, Z.; Fan, Z.; Yan, P.; Li, R. Research on Tianjin Eco-Livable City Indicator System and Countermeasures for Realization. Tianjin Econ. 2011, 2, 12–15. [Google Scholar]
  11. Yang, W. Study on Assessment Index of Livable Eco-City. Res. Environ. Sci. 2010, 23, 237–241. [Google Scholar]
  12. Fu, C.; Zhang, H. Evaluation of Urban Ecological Livability from a Synergistic Perspective: A Case Study of Beijing City, China. Sustainability 2023, 15, 10476. [Google Scholar] [CrossRef]
  13. Xiao, Y.; Li, Y.; Tang, X.; Huang, H.; Wang, G. Assessing spatial–temporal evolution and key factors of urban livability in arid zone: The case study of the Loess Plateau, China. Ecol. Indic. 2022, 140, 108995. [Google Scholar] [CrossRef]
  14. Li, X.M.; Bai, Z.Z.; Tian, S.Z.; Guo, Y.J.; Liu, H. Evaluation of the Livability of Urban Human Settlements: A Case Study of Liaoning Province. J. Hum. Settl. West China 2019, 34, 86–93. [Google Scholar]
  15. Fan, Z.; Wang, Y.; Feng, Y. Ecological livability assessment of urban agglomerations in Guangdong-Hong Kong-Macao greater bay area. Int. J. Environ. Res. Public Health 2021, 18, 13349. [Google Scholar] [CrossRef]
  16. Barrera-Roldán, A.; Saldıvar-Valdés, A. Proposal and application of a Sustainable Development Index. Ecol. Indic. 2002, 2, 251–256. [Google Scholar] [CrossRef]
  17. Ghasemi, K.; Hamzenejad, M.; Meshkini, A. The spatial analysis of the livability of 22 districts of Tehran Metropolis using multi-criteria decision making approaches. Sustain. Cities Soc. 2018, 38, 382–404. [Google Scholar] [CrossRef]
  18. Zanella, A.; Camanho, A.S.; Dias, T.G. The assessment of cities’ livability integrating human wellbeing and environmental impact. Ann. Oper. Res. 2015, 226, 695–726. [Google Scholar] [CrossRef]
  19. Wang, Y.; Jin, C.; Lu, M.Q.; Lu, Y.Q. Assessing the suitability of regional human settlements environment from a different preferences perspective: A case study of Zhejiang Province, China. Habitat Int. 2017, 70, 1–12. [Google Scholar] [CrossRef]
  20. Mouratidis, K. Commute satisfaction, neighborhood satisfaction, and housing satisfaction as predictors of subjective well-being and indicators of urban livability. Travel Behav. Soc. 2020, 21, 265–278. [Google Scholar] [CrossRef]
  21. Onnom, W.; Tripathi, N.; Nitivattananon, V.; Ninsawat, S. Development of a liveable city index (LCI) using multi criteria geospatial modelling for medium class cities in developing countries. Sustainability 2018, 10, 520. [Google Scholar] [CrossRef]
  22. Kara, Y. Measuring the sustainability of cities in Turkey with the analytic hierarchy process. Open J. Soc. Sci. 2019, 7, 322. [Google Scholar] [CrossRef]
  23. Fu, B.; Yu, D.; Zhang, Y. The livable urban landscape: GIS and remote sensing extracted land use assessment for urban livability in Changchun Proper, China. Land Use Policy 2019, 87, 104048. [Google Scholar] [CrossRef]
  24. Kose, E.; Vural, D.; Canbulut, G. The most livable city selection in Turkey with the grey relational analysis. Grey Syst Theory Appl. 2020, 10, 529–544. [Google Scholar] [CrossRef]
  25. Zhang, Y.; Li, Q.; Wang, H.Y.; Du, X.; Huang, H.P. Community scale livability evaluation integrating remote sensing, surface observation and geospatial big data. Int. J. Appl. Earth Obs. Geoinf. 2019, 80, 173–186. [Google Scholar] [CrossRef]
  26. Tan, Z.Y. Livability Evaluation of Wuhan Urban Area based on multi-source data. Territ. Nat. Resour. Study 2017, 2, 5–10. [Google Scholar]
  27. Liang, X.; Liu, Y.; Qiu, T. Livability assessment of urban communities considering the preferences of different age groups. Complexity 2020, 2020, 8269274. [Google Scholar] [CrossRef]
  28. Leach, J.M.; Lee, S.E.; Boyko, C.T.; Coulton, C.J.; Cooper, R.; Smith, N.; Joffe, H.; Büchs, M.; Hale, J.D.; Sadler, J.P.; et al. Dataset of the livability performance of the city of Birmingham, UK, as measured by its citizen wellbeing, resource security, resource efficiency and carbon emissions. Data Brief 2017, 15, 691–695. [Google Scholar] [CrossRef]
  29. Paul, A. Developing a methodology for assessing livability potential: An evidence from a metropolitan urban agglomeration (MUA) in Kolkata, India. Habitat Int. 2020, 105, 102263. [Google Scholar] [CrossRef]
  30. Fang, G.; Chen, X.-M. Study on the Evaluation of Ecological Livable City in Anhui Based on Intuitionistic Fuzzy Theory. J. Chongqing Technol. Bus. Univ. Nat. Sci. Ed. 2018, 35, 30–36. [Google Scholar]
  31. Wang, Y.; Zhu, Y.; Yu, M. Evaluation and determinants of satisfaction with rural livability in China’s less-developed eastern areas: A case study of Xianju County in Zhejiang Province. Ecol. Indic. 2019, 104, 711–722. [Google Scholar] [CrossRef]
  32. Liu, K.W.; Li, Q.-C.; Wang, L.; Xiao, C. Coupling and Coordination Study of Livable City and Innovative City Development in the Yangtze River Delta. Geogr. Geo-Inf. Sci. 2019, 35, 120–126+134. [Google Scholar]
  33. Zhang, H.; Tang, S.; Geng, Z. Synergy Development Level, Dynamic Trajectory and Convergence between Work Adaptability and Ecological Livability of Yangtze River Delta Urban Agglomeration. J. Quant. Tech. Econ. 2019, 36, 3–23. [Google Scholar]
  34. Wang, M.; Yang, X.; Huang, Y.; Wu, S.; Chen, J. Livability Evaluation of Land Ecological Space in Beijing, China Based on Geographical Conditions Census. Sens. Mater. 2023, 35, 669–677. [Google Scholar] [CrossRef]
  35. Zhang, M.F.; Zhu, P.J.; Cui, S.Q.; Zhang, H.H.; Tang-Xin, L.U. Evaluation of the Livability of Urban Space In Changsha from the Perspective of “Production-Living-Ecology”. J. Nat. Sci. Hunan Norm. Univ. 2019, 42, 9–17. [Google Scholar]
  36. Xi, J. Spatial Distribution and Ecological Livability Evaluation of Typical Open Space in the Central Urban Area of Guangzhou. Master’s Thesis, Guangzhou University, Guangzhou, China, 2022. [Google Scholar]
  37. Chen, Y. A Summary of the Processing Methods for Missing Data in Time Series. Inf. Comput. 2022, 32, 19–22. [Google Scholar]
  38. Xiong, Z.; Guo, H.; Wu, Y. Review of Missing Data Processing Methods. Comput. Eng. Appl. 2021, 57, 27–38. [Google Scholar]
  39. Tang, J.; Sui, L. Geodetector-Based Livability Analysis of Potential Resettlement Locations for Villages in Coal Mining Areas on the Loess Plateau of China. Sustainability 2022, 14, 8365. [Google Scholar] [CrossRef]
  40. Yin, C. Environmental Benefit Evaluation of Urban Infrastructure Based on Entropy Method: Taking Beijing, Tianjin, Shanghai, and Chongqing as Examples. City 2022, 12, 18–28. [Google Scholar]
  41. Shi, C.C.; Guo, N.L.; Zeng, L.L.; Wu, F. How climate change is going to affect urban livability in China. Clim. Serv. 2022, 26, 100284. [Google Scholar] [CrossRef]
  42. Meng, L.; Hao, L.; Lingling, S.; Qihong, S.; Chen, C. Construction of Comprehensive Evaluation System of Urban Ecological Economy Based on Entropy Method and Evaluation of Jiangsu Province. Ecol. Econ. 2022, 38, 68–71+87. [Google Scholar]
  43. Zhang, T.; Lin, G. Identification of local clusters for count data: A model-based Moran’s I test. J. Appl. Stat. 2008, 35, 293–306. [Google Scholar] [CrossRef]
  44. Tu, J.; Xia, Z.G. Examining spatially varying relationships between land use and water quality using geographically weighted regression I: Model design and evaluation. Sci. Total Environ. 2008, 407, 358–378. [Google Scholar] [CrossRef] [PubMed]
  45. Ishizawa, H.; Stevens, G. Non-English language neighborhoods in Chicago, Illinois: 2000. Soc. Sci. Res. 2007, 36, 1042–1064. [Google Scholar] [CrossRef]
  46. Fu, W.J.; Zhao, K.L.; Zhang, C.S.; Tunney, H. Using Moran’s I and geostatistics to identify spatial patterns of soil nutrients in two different long-term phosphorus-application plots. J. Plant Nutr. Soil Sci. 2011, 174, 785–798. [Google Scholar] [CrossRef]
  47. Li, H.; Duan, P.; Guo, H. Evaluation of Regional Ecological Livable Degree and Its Influencing Factors: A Case Study of Xi’an. Ecol. Econ. 2019, 35, 80–85. [Google Scholar]
  48. Cui, H.; Fang, H.Z.; Tian, Y.Y.; Zheng, W.L.; Li, W.Z.; Tian, W.G. Evaluation of livability of Wuhan under ecological construction and analysis of its spatial pattern. Sustainability 2022, 14, 11283. [Google Scholar] [CrossRef]
  49. Drago, C. The analysis and the measurement of poverty: An interval-based composite indicator approach. Economies 2021, 9, 145. [Google Scholar] [CrossRef]
  50. Gatto, A.; Drago, C. Measuring and modeling energy resilience. Ecol. Econ. 2020, 172, 106527. [Google Scholar] [CrossRef]
  51. Saisana, M.; Saltelli, A.; Tarantola, S. Uncertainty and sensitivity analysis techniques as tools for the quality assessment of composite indicators. J. R. Stat. Soc. Ser. A Stat. Soc. 2005, 168, 307–323. [Google Scholar] [CrossRef]
  52. Greco, S.; Ishizaka, A.; Tasiou, M. On the methodological framework of composite indices: A review of the issues of weighting, aggregation, and robustness. Soc. Indic. Res. 2019, 141, 61–94. [Google Scholar] [CrossRef]
  53. Joint Research Centre-European Commission. Handbook on Constructing Composite Indicators: Methodology and User Guide; OECD Publishing: Paris, France, 2008. [Google Scholar]
Figure 1. The methodological framework of the study.
Sustainability 15 15964 g001
Figure 2. Location of the study area.
Sustainability 15 15964 g002
Figure 3. Original indicators.
Sustainability 15 15964 g003
Figure 4. Changes in suitability for ecological livability of green spaces in the central Yunnan urban agglomeration.
Sustainability 15 15964 g004
Figure 5. Spatial distribution of suitability for ecological livability of green spaces in the central Yunnan urban agglomeration.
Sustainability 15 15964 g005
Figure 6. Changes in the suitability for ecological livability of green spaces in the central Yunnan urban agglomeration according to the three target layers: economic development (a); social life (b); and the ecological environment (c).
Sustainability 15 15964 g006
Figure 7. Spatial-distribution map of suitability for ecological livability of green spaces in the central Yunnan urban agglomeration according to the three target layers: economic development (a); social life (b); and the ecological environment (c).
Sustainability 15 15964 g007
Figure 8. Local autocorrelation of suitability for ecological livability of green spaces in the central Yunnan urban agglomeration.
Sustainability 15 15964 g008
Figure 9. Changes in indicator suitability during 2010–2020: economic development (a), social life (b), and the ecological environment (c).
Sustainability 15 15964 g009
Table 1. Weights of the evaluation indicators for the ecological livability of green spaces in the central Yunnan urban agglomeration.
Target LayerStandardized LayerIndex LayerIndex Weights
Economic developmentEconomic strengthGDP0.108
Per capita financial income0.046
Per capita disposable income of rural residents0.045
Per capita disposable income of urban residents0.028
General public budget revenue0.084
Economic structureProportion of tertiary industry0.015
Tourism revenue as a proportion of GDP0.103
Social investment in fixed assets as a proportion of GDP0.060
Social lifeSocial securityUrban registered unemployment rate0.002
Population structureUrbanization rate0.019
Rate of natural population growth0.025
Ecological environmentGreening levelGreen coverage in built-up areas0.005
Green-space ratio in built-up areas0.009
Per capita public green area0.055
Forest coverage0.025
Climate environmentAnnual rainfall0.032
Annual average temperature0.024
Number of annual sunshine0.008
Environmental pollutionAir-quality excellence rate0.003
Sewage treatment rate0.020
Rate of harmless trash disposal0.005
Green-space land useFarmland area as a proportion of land-use area0.034
Water bodies as a proportion of land-use area0.184
Grassland as a proportion of land-use area0.034
Forest as a proportion of land-use area0.028
Table 2. Green-space eco-livability scores of 49 districts and counties in the central Yunnan urban agglomeration and the degree of change in their scores, 2010–2020.
District/CountyScoreChange in Score
2010201520202010–20152015–20202010–2020
Wuhua0.258 0.366 0.412 0.108 0.046 0.154
Panlong0.253 0.342 0.423 0.089 0.081 0.170
Guandu0.312 0.415 0.459 0.103 0.044 0.147
Xishan0.418 0.495 0.545 0.077 0.050 0.127
Chenggong0.360 0.399 0.420 0.039 0.021 0.060
Jinning0.270 0.325 0.342 0.055 0.017 0.072
Dongchuan0.186 0.199 0.225 0.013 0.026 0.039
Anning0.264 0.297 0.390 0.033 0.093 0.126
Songming0.196 0.220 0.241 0.024 0.021 0.045
Fumin0.191 0.221 0.250 0.030 0.029 0.059
Shilin0.265 0.251 0.267 −0.014 0.016 0.002
Yiliang0.187 0.229 0.253 0.042 0.024 0.066
Xundian0.182 0.198 0.187 0.016 −0.011 0.005
Luquan0.172 0.193 0.208 0.021 0.015 0.036
Qilin0.198 0.272 0.316 0.074 0.044 0.118
Zhanyi0.184 0.205 0.233 0.021 0.028 0.049
Malong0.237 0.208 0.241 −0.029 0.033 0.004
Xuanwei0.182 0.211 0.252 0.029 0.041 0.070
Huize0.182 0.208 0.247 0.026 0.039 0.065
Luliang0.193 0.198 0.258 0.005 0.060 0.065
Fuyuan0.168 0.190 0.226 0.022 0.036 0.058
Luoping0.206 0.234 0.253 0.028 0.019 0.047
Shizong0.188 0.196 0.223 0.008 0.027 0.035
Hongta0.231 0.275 0.308 0.044 0.033 0.077
Jiangchuan0.350 0.340 0.355 −0.010 0.015 0.005
Chengjiang0.499 0.397 0.476 −0.102 0.079 −0.023
Huaning0.214 0.212 0.224 −0.002 0.012 0.010
Tonghai0.242 0.248 0.303 0.006 0.055 0.061
Yimen0.193 0.238 0.253 0.045 0.015 0.060
Eshan0.188 0.201 0.227 0.013 0.026 0.039
Xinping0.192 0.241 0.264 0.049 0.023 0.072
Yuanjiang0.185 0.210 0.229 0.025 0.019 0.044
Chuxiong0.225 0.264 0.303 0.039 0.039 0.078
Shuangbai0.192 0.211 0.207 0.019 −0.004 0.015
LuFeng0.212 0.223 0.268 0.011 0.045 0.056
Wuding0.258 0.212 0.238 −0.046 0.026 −0.020
Yuanmou0.299 0.226 0.274 −0.073 0.048 −0.025
Yongren0.241 0.204 0.234 −0.037 0.030 −0.007
Dayao0.201 0.202 0.255 0.001 0.053 0.054
Yao’an0.211 0.184 0.221 −0.027 0.037 0.010
Mouding0.240 0.222 0.225 −0.018 0.003 −0.015
Nanhua0.207 0.190 0.232 −0.017 0.042 0.025
Mengzi0.227 0.239 0.270 0.012 0.031 0.043
Gejiu0.202 0.228 0.253 0.026 0.025 0.051
Kaiyuan0.183 0.247 0.288 0.064 0.041 0.105
Mile0.174 0.241 0.300 0.067 0.059 0.126
Luxi0.220 0.234 0.266 0.014 0.032 0.046
Jianshui0.252 0.233 0.270 −0.019 0.037 0.018
Shiping0.169 0.227 0.266 0.058 0.039 0.097
Table 3. Change in the global Moran’s I for the suitability for ecological livability of green spaces in the central Yunnan urban agglomeration from 2010 to 2020.
YearGlobal Moran’s IZ-Valuep-Value
20100.3501794.4130190.000010
20150.5340966.3933200.000000
20200.4758895.6753920.000000
Disclaimer/Publisher’s Note: The statements, opinions and data contained in all publications are solely those of the individual author(s) and contributor(s) and not of MDPI and/or the editor(s). MDPI and/or the editor(s) disclaim responsibility for any injury to people or property resulting from any ideas, methods, instructions or products referred to in the content.

