Article

Exploring Virtual Water Network Dynamics of China’s Electricity Trade: Insights into the Energy–Water Nexus

College of Water Resources and Architectural Engineering, The Northwest A&F University, Yangling 712100, China
*
Author to whom correspondence should be addressed.
These authors contributed equally to this work.
Sustainability 2023, 15(22), 15977; https://doi.org/10.3390/su152215977
Submission received: 16 October 2023 / Revised: 11 November 2023 / Accepted: 13 November 2023 / Published: 15 November 2023
(This article belongs to the Special Issue Environmental Sustainability in Natural and Engineering Systems)

Abstract

:
The escalating challenges regarding the sustainable utilization of coupled energy and water resources require the implementation of synergistic management. Electricity-related virtual water flows could result in the transfer of freshwater vulnerability and environmental inequalities. Aiming to systematically characterize its holistic patterns, network structure and formation mechanisms, we constructed a virtual water network for electricity trade in China based on provincial lifecycle water footprints; portrayed the statistical features, structural stability and interregional equilibrium using Complex Network Analysis (CNA); and introduced the Quadratic Assignment Procedure (QAP) to gain socio-environmental insights into the driving factors. The results show that the virtual water transferred with China’s interprovincial electricity trade increased from 851.24 million m3 to 3441.58 million m3 from 2006–2020. Eastern, developed provinces with a high electricity demand have effectively relieved their water stress by expanding import sources, but the transfer of water resource benefits from western exporting regions (especially in the arid northern provinces) is irreversible. The current electricity market forces reflect the scarcity of energy and capital factors in the context of China’s interprovincial trade, but not the scarcity of water resources. Consequently, we proposed integrated management strategies including strengthening sectoral collaboration, optimizing energy-use structures and establishing ecological compensation mechanisms to build a more water-efficient future power system.

1. Introduction

Population growth, economic development and urbanization expansion are intensifying the global competition for water and energy [1]. Traditional management modes neglect the complex interconnections and potential conflict between the two resources in production and consumption processes, thus bringing challenges to the scientific formulation of policy. The “energy–water nexus” is an innovation of the IRM (Integrated Resources Management) paradigm [2,3], which aims to establish a cross-sectoral decision-making perspective to meet the challenges of freshwater and energy shortages and guarantee the sustainable development of society. Electrification is a critical path for the low-carbon transformation of the energy structure [4]. Stress on regional water resources imposed by electricity capacity expansion [5] and the vulnerability of power generation systems to climate hydrological variability [6] have attracted increasing attention globally. In China, the spatial distribution of fossil fuels and freshwater resources is severely imbalanced, resulting in particularly severe cross-sectoral risks for energy and water systems. On one hand, the water withdrawal linked to electricity generation for large coal power bases in arid catchment areas (e.g., the Eastern Yellow River Basin and the Northwest River Basin) causes high baseline water stresses, which triggers a series of environmental risks such as groundwater depletion and ecological degradation [7]. On the other hand, climate change impacts on freshwater availability and water temperatures could threaten thermal power efficiency in northern China [8]. In view of the escalating “electricity–water” conflict, it is crucial to examine the water-use characteristics of electricity and to promote positive interactions between the resources.
“Water footprint” is a multidimensional metric that has been widely applied in lifecycle analyses to quantify a product’s water use [9]. In order to assess the direct and indirect water footprint of electricity production, existing studies have accounted for water withdrawals, consumption and discharge for thermal power [10,11,12] (including coal, oil and gas) and renewable energy [13,14,15] (including hydropower, nuclear, wind solar and biomass) in different geographic locations. The water footprint of power production can quantify its impact on the local water pressure. With the introduction of the virtual water concept [16,17], which measures the water resources embodied in commodity trade, scholars have started to pay attention to substituting local resource utilization using external resource services [18]. Research has been conducted on the national level [19], grid level [20] and provincial level [21] to quantify the virtual water volume in the electricity trade and evaluate its impact on water scarcity. For instance, Chini et al. [22] investigated blue and gray water flows in the U.S. electric grid. Liao et al. [23] quantified the virtual water volume of electricity consumed for final demand. Zhang et al. [24] explored the virtual scarce water transfer adjusted by the water stress index (WSI), and found that long-distance electricity transmission will expand the scale of scarce water outflow from Northwest China. Virtual water networks for electricity provide an assessment framework for understanding the spatial transfer of water resources in the electricity supply chain. Current research mainly focuses on examining the direct water footprint in the power generation phase [19,20,22,24,25,26,27]. Associating water footprint, including upstream water use, with electricity demand is necessary to cover the full lifecycle and assign responsibility for water use [28].
Moreover, simply quantifying the virtual water volume and direction may ignore hidden information in the network (e.g., locational relationships and geographic features). Network theory has been introduced into virtual water research. Guo et al. [20] used Ecological Network Analysis (ENA) to track virtual water transfers between six power grids in China and evaluated the overall network efficiency and the importance of each sub-grid. By constructing closed networks to simulate the flow of material and energy in the ecosystem, ecological network theory can analyze the maturity of the metabolic system and the ecological hierarchy of the compartments [29]. However, the ENA method still has some limitations in examining networks’ structures, functions and dynamic behavior. Compensating for these shortcomings, Complex Network Analysis (CNA) has developed into a popular cross-discipline and plays an important role in measuring network properties and simulating optimal network structures. Recent studies have analyzed the structural evolution [30,31], topological characteristics [32,33] and structural stability [34,35] of global and sub-national food virtual water trade networks based on CNAs. This study quantitatively analyzes the statistical patterns, structural stability and interregional equilibrium of the virtual water network for electricity trade in China from both topological and weighted network perspectives based on CNA. In this way, we can establish a refined understanding of the spatial feedback of the “electricity–water” nexus and provide a basis for logical electricity and water resource regulation.
In order to make link and flow predictions for future food-related virtual water networks, Lü and Zhou [36] developed a network similarity algorithm to model topological networks. The gravity model has also been widely used for virtual water driver identification and network flow modeling [37]. However, research on the spatial formation mechanisms of virtual water networks for electricity trade is currently inadequate. The logarithmic Mean Divisia Index (LMDI) [38] and Structural Decomposition Analysis (SDA) [39] are the main methods used in the existing literature to investigate the drivers of the evolution of electricity-related virtual water flows over time. These two methods are limited when analyzing socio-environmental factors, as the drivers they examine depend on the virtual water accounting formula. The Quadratic Assignment Procedure (QAP) is a method to investigate the driving factors of trade networks depending on relational data (mutual relationships between nodes in the network) [40]. Based on the matrix substitution test, the QAP can solve the problem of multicollinearity between independent variables that cannot be handled by the traditional OLS and provides a new perspective for analyzing the spatial formation of a virtual water network.
Aiming to better understand the impact of the electricity-related virtual water trade on water scarcity and associated environmental inequalities, in this study, we constructed virtual water networks for electricity trade in China from 2006 to 2020. The CNA was used to determine the network structural characteristics and the QAP was introduced to explore the driving factors. Based on the existing literature, our work adds to previous research by: (1) Accounting for the lifecycle water footprint of electricity over the long term from both production and consumption perspectives, which may help to cover the complete lifecycle and regulate the responsibility of the consumption side; (2) Portraying the structural characteristics of the virtual water network based on the CNA, which provides a basis for revealing locational relationships and guaranteeing network stability; (3) Analyzing the socio-environmental driving factors of the virtual water flow from a relational perspective, which has policy implications for evaluating the transfer of water pressure from the consumer side to the generation side.

2. Materials and Methods

Based on the principles outlined above, Figure 1 illustrates the research process and integration of analytical tools into the process. These methods are explained in more detail below.

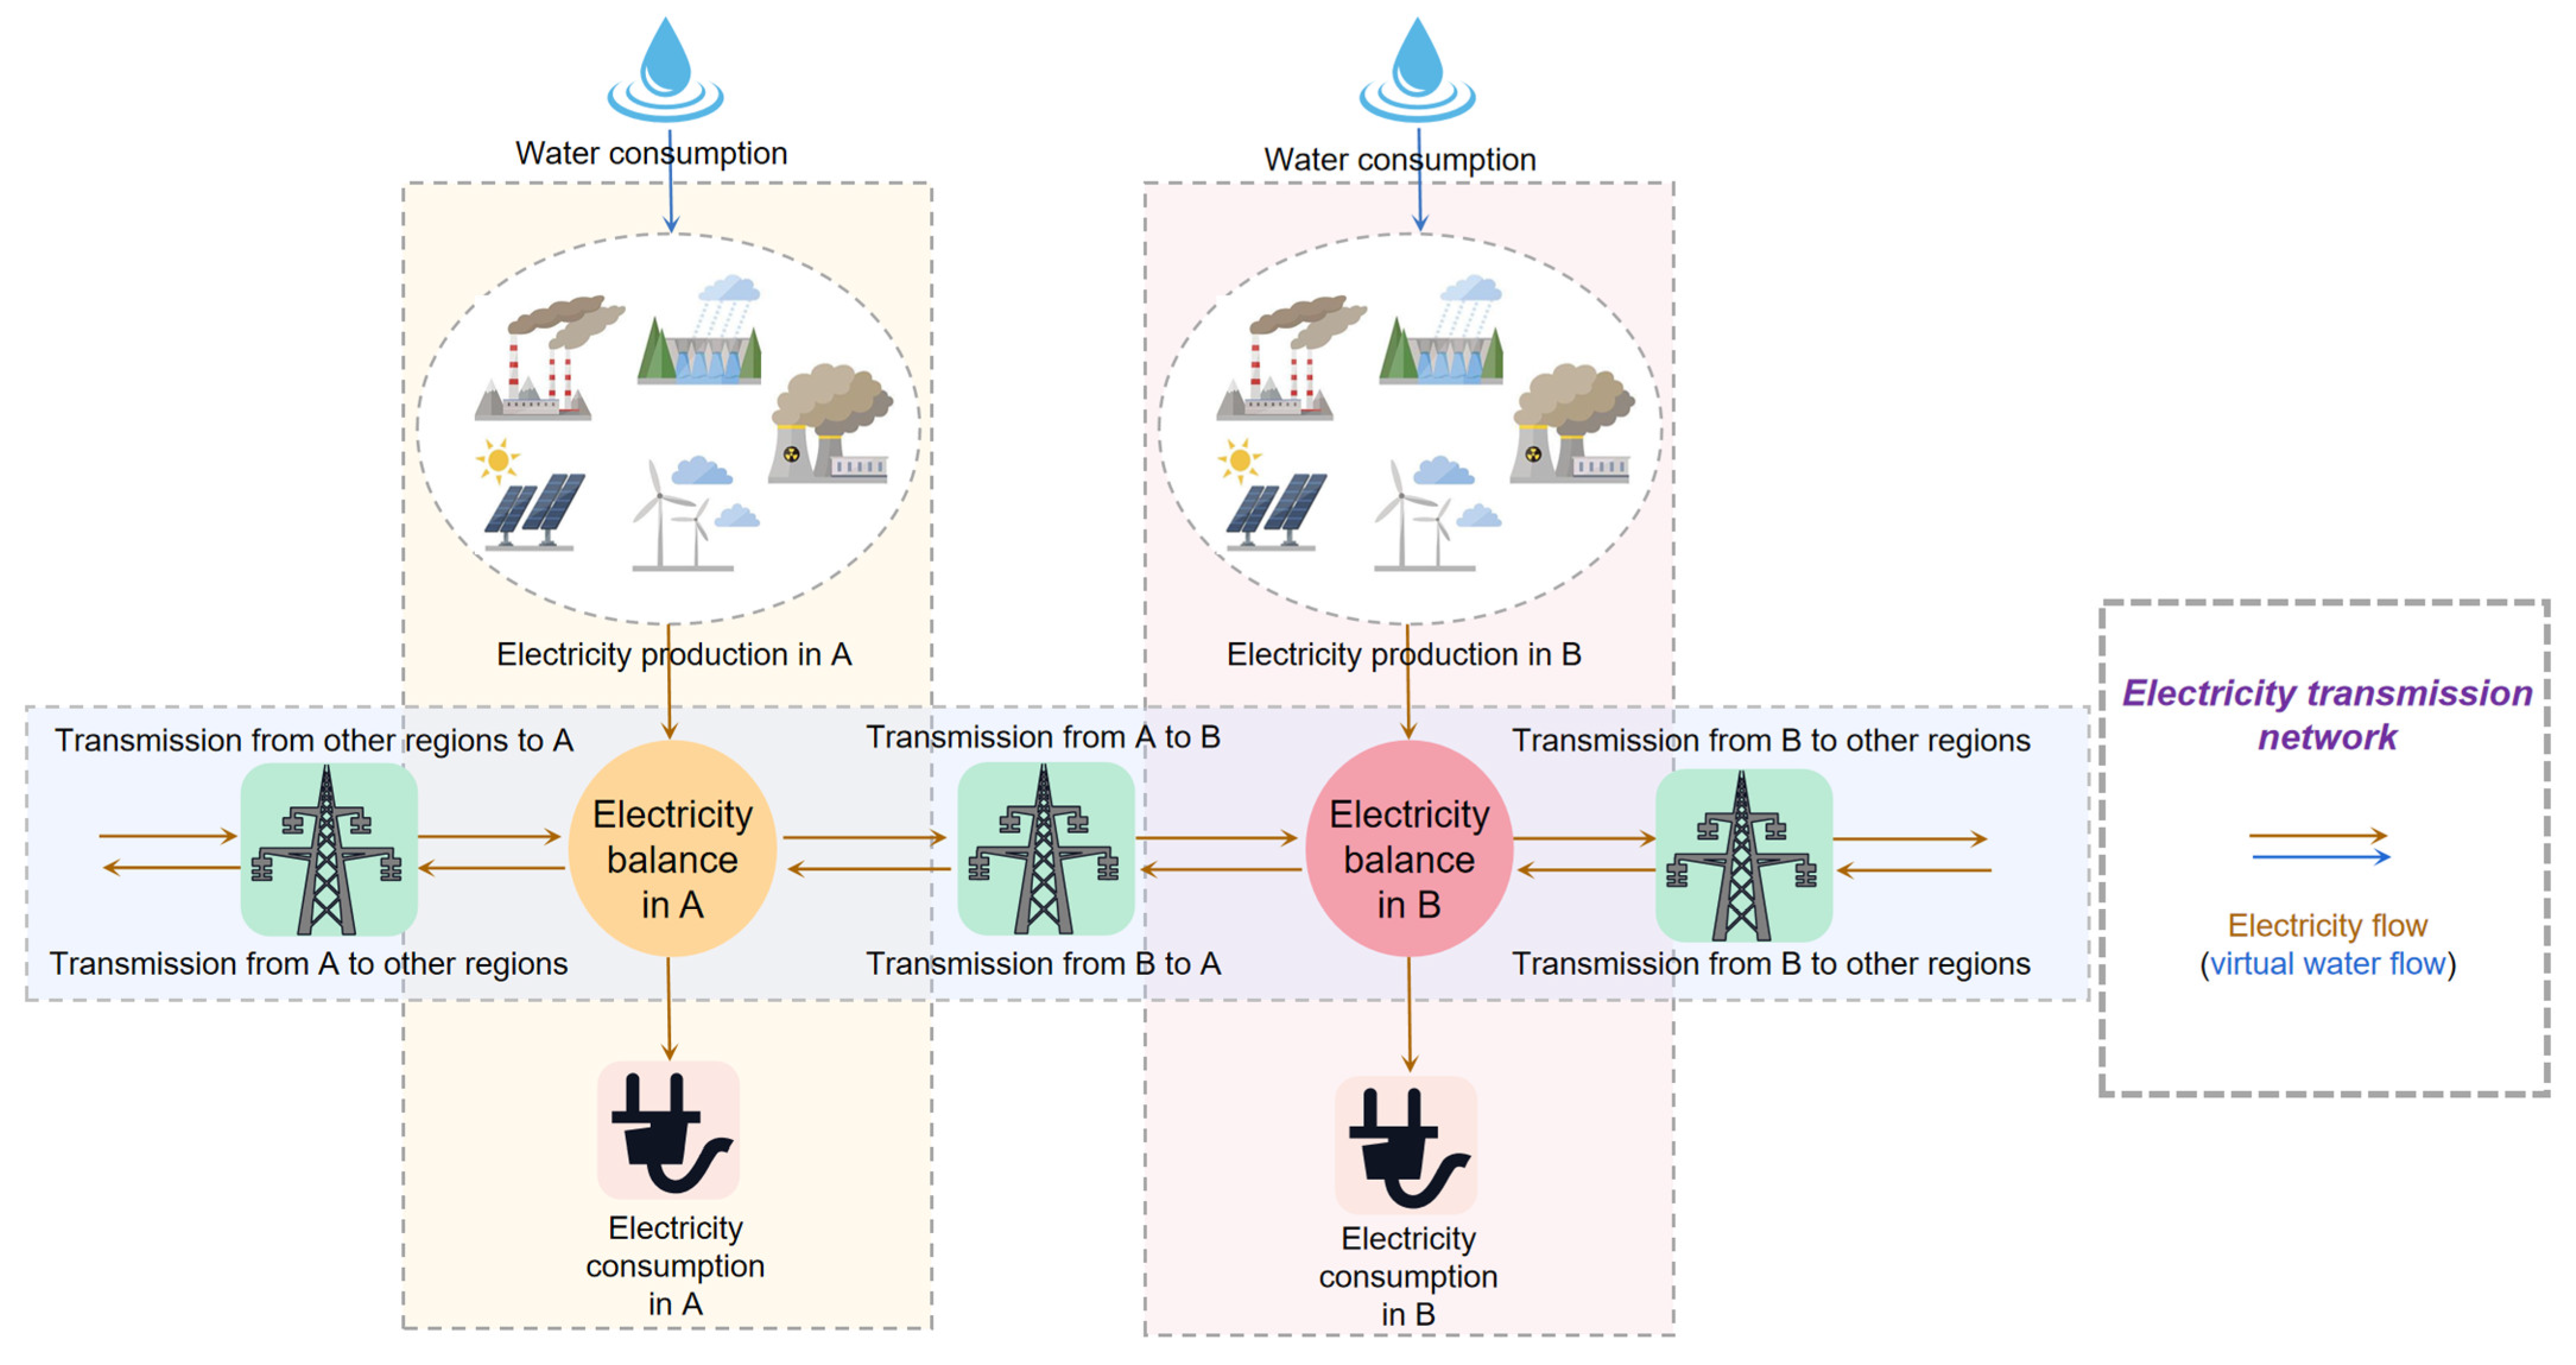
2.1. Quantifying Virtual Water Embodied in the Electricity Trade

Similar to the study of Zhu et al. [41], we assume that different types of electricity are proportionally mixed when supplying local consumers or other grids, and therefore we assess the electricity-related water footprint of each province based on its share of generation from different primary energy sources. In this paper, we take into account five main power generation technologies (thermal, hydropower, nuclear, wind and solar), which constitute more than 95% of China’s total electricity generation [42]. The hybrid water footprint related to electricity generation of province i in year y can be calculated by the following equation:
g f i y = m = 1 5 g f i , m y ω i , m y
ω i , m y = g i , m y g i y
where g i , m y represents the generation of the “m” type of electricity technology of province i in year y, ω i , m y is the proportion of g i , m y to the total generation of province i, and g f i , m y represents the lifecycle water footprint of the “m” type of electricity technology.
Based on the lifecycle water footprint of each province related to electricity generation and interprovincial electricity trade data, we simulated the interconnected network from electricity generators to electricity users with the node flow model [24] (Figure 2). As shown in Equation (3), virtual water is embodied in the balance of electricity inflow and outflow of each province. In other words, the water consumption of local electricity generation plus the virtual water inflow of imported electricity equals the virtual water outflow when supplying electricity to local consumers and exporting electricity to other provinces.
g i g f i + j , j i t j i c f j = ( t i i + j , j i t i j ) c f i
where g i is the total amount of electricity generated in province i. t i j is the electricity transmitted from province i to province j. g f i is calculated from Equation (1) and c f i is the virtual water footprint on the consumption side of province i.
Equation (3) can be transformed into:
G ^ G F = T C F
where G ^ is the diagonal formation of G ( G = [ g 1 , g 2 , , g n ] T ). Vector G F = [ g f 1 , g f 2 , , g f n ] T and vector C F = [ c f 1 , c f 2 , , c f n ] T . C F can be calculated by Equation (5):
C F = T 1 G ^ G F
The virtual water flow of power trade from province i to province j can be calculated as:
v w i j = t i j c f i

2.2. Portraying the Structural Characteristics of the Virtual Water Network Based on CNA

Based on the topological abstraction of realistic complex systems in complex network theory, a series of statistical metrics, such as node degree, degree distribution and degree correlation, are proposed to scientifically characterize the network’s structure [33]. We constructed a weighted directed virtual water network ( V W D ) with provinces as nodes, electric flow paths as edges and virtual water quantities ( v w i j ) as the edge weights. In addition, we simplified V W D to obtain the corresponding unweighted directed network (also known as the adjacency matrix: A D ) [33]. If a trade connection exists between province i and province j, then a i j = 1 ; otherwise, a i j = 0 . On this basis, the node degree and degree correlation were applied to assess the characteristics of A D , and the node strength and strength correlation were applied to assess the characteristics of V W D [43].
The out-degree of node i ( k i o u t ) in a directed network is the number of provinces to which province i exports virtual water. The in-degree of node i ( k i i n ) is the number of provinces from which node i imports virtual water. The out-degree and in-degree of a node can be represented by the elements of A D :
k i o u t = j = 1 N a i j , k i i n = j = 1 N a j i
Similarly, the out-strength of node i ( s i o u t ) is the amount of virtual water exported from province i, and the in-strength of node i ( s i i n ) is the amount of virtual water imported to province i. The out-strength and in-strength of a node can be represented by the elements of VWD:
s i o u t = j = 1 N v w i j , s i i n = j = 1 N v w j i
Networks with the same degree distribution may have different properties and behaviors. To further investigate the higher-order topological features of virtual water network, we applied the average nearest-neighbor degree ( k n n , i ) to portray the degree correlation [33]. k n n , i identifies all neighbors of node i, then sums the respective degrees of the neighbors and finally performs normalization according to the degrees of node i. The k n n , i of a directed network can be classified as k n n , i o u t , o u t , k n n , i o u t , i n , k n n , i i n , o u t , k n n , i i n , i n . The first element in the superscript determines the neighborhood of node i, and the second element marks the direction of neighbor’s node degree (Equation (9)).
{ k n n , i o u t , o u t = 1 k i o u t j V i o u t a i j k j o u t k n n , i o u t , i n = 1 k i o u t j V i o u t a i j k j i n k n n , i i n , o u t = 1 k i i n j V i i n a j i k j o u t k n n , i i n , i n = 1 k i i n j V i i n a j i k j i n
Konar et al. [33] extended the concept of degree correlation to weighted networks (Equation (10)). On this basis, we measured the connectivity between regions in the context of virtual water volume differences.
{ k n n , i o u t , o u t = 1 s i o u t j V i o u t v w i j k j o u t k n n , i o u t , i n = 1 s i o u t j V i o u t v w i j k j i n k n n , i i n , o u t = 1 s i i n j V i i n v w j i k j o u t k n n , i i n , i n = 1 s i i n j V i i n v w j i k j i n

2.3. Identifying Driving Factors of Virtual Water Flow Based on the QAP

The QAP is a way to analyze the association between two matrices (two relationships) in social network science. Since the individual observations of relational data are not independent of each other, parameter estimation and statistical tests cannot be performed via traditional statistical procedures. The QAP is a randomized test method based on permutations that can address this problem. The principles of QAP correlation and regression analyses are similar and are detailed in previous studies [40,44].
From the perspective of trade theory, a variety of factors jointly influence the production, consumption and trade of electricity, which in turn determines the virtual water flows embodied in electricity trade. The gravity model, which combines regional attributes and relational characteristics that influence bilateral flows, is a powerful tool to analyze virtual water trade drivers [45]. The gravity model suggests that trade flows are shaped by the source’s supply conditions, the target’s demand conditions and market reachability [46]. In view of this, we selected electricity generation characteristics, electricity consumption characteristics and the existence of direct grid connection between two provinces as independent variables affecting the virtual water flow [47]. Moreover, virtual water was first proposed as a strategy based on the Heckscher–Ohlin–Vanek (HOV) theory that international trade is shaped by the comparative advantages of countries’ factor endowments, and by default the virtual water embodied in trade transfers from water-abundant countries to water-scarce countries [48]. However, many recent global and subnational scale studies highlight that the relative abundance of water resource factors does not dominate virtual water flow [49,50]. In order to explore the influence of water resource elements of each province on virtual water network, we used the water stress index (WSI) proposed by Pfister et al. [51,52] to measure water stress (Equation (11)) and the water resources per capita to measure water resource endowment. Subsequently, we performed QAP correlation and regression to explore the driving factors of virtual water flow. The definitions of the influencing factors are shown in Table 1.
W S I = 1 1 + e 6.4 W T A ( 1 0.01 1 )
In this paper, the virtual water transfer matrix is set as the dependent variable ( V W ), and since we are examining the spatial formation of the virtual water network, bilateral flows can be regarded as reflecting interprovincial connections [47], V W i j = V W j i = v w i j + v w j i , V W i i = 0 . The independent variables PG, GS, FT, EC, G, U, WSI and WRE are represented by the absolute value matrix of interprovincial differences. The QAP regression model is illustrated by the following equation:
V W = f ( P G , G S , F T , E C , G , U , G C , W S I , W R E )

2.4. Data Sources

This paper quantifies the changes in water consumption associated with electricity trade between 30 provincial administrative regions in China from 2006 to 2020. Hong Kong, Macau, Taiwan and Tibet are not included in the study due to lack of data.
We collected water intensity data for all electricity generation technologies (including thermal, hydro, nuclear, wind and solar) from the study of Wang et al. [53], in which the lifecycle water footprints of different electricity technologies were estimated at the provincial level, considering both direct water consumption for electricity generation and indirect water consumption for upstream supply chains (fuel extraction, infrastructure development, etc.). In fact, water footprint accounting is highly reliant on boundary setting, and there are relatively large differences in electricity water footprints estimated by different studies. A Mixed-Unit Input–Output (MUIO) analysis [53] can avoid the cut-off error caused by systematic boundary setting in the bottom-up assessment methodology, improve the price inhomogeneity of the monetary input–output model, and has a relatively explicit physical meaning.
In addition, we collected data on electricity generation, generation structure and electricity consumption from the China Electricity Yearbook [54,55,56,57,58,59,60,61,62,63,64,65,66,67,68]. Electricity transmission data used in this paper were obtained from the China Electricity Council [69,70,71,72,73,74,75,76,77,78,79,80,81,82,83]. Most of the electricity transmission data are reported at the provincial level and can be used directly. For some data reported on the provincial grid to sub-national grid levels, we disaggregated them to the interprovincial level based on the electricity consumption share of each province in the corresponding sub-national grid.
The provincial data required for QAP analyses were collected from the following sources: (1) GDP per capita (gross domestic product) and urbanization rate were obtained from the China Statistical Yearbook [84,85,86,87,88,89,90,91,92,93,94,95,96,97,98]. (2) The average feed-in tariffs for differently fueled power generation enterprises were collected from the China Electricity Yearbook [54,55,56,57,58,59,60,61,62,63,64,65,66,67,68]. (3) The water resource per capita in each province was obtained from the China Environmental Statistics Yearbook [99,100,101,102,103,104,105,106,107,108,109,110,111,112,113]. (4) The average WSI in each province was calculated from the watershed level database provided by Pfister et al. [51,52].

3. Results

3.1. Impact of Water Consumption for Electricity Production on Regional Water Stress

The water consumption of the power industry reached 15.93 billion m3 in 2020, increasing 1.32-fold compared to 2006. Hydropower consumed the largest amount of water at 8.33 billion m3, followed by thermal power at 7.39 billion m3, while nuclear power, wind power and solar power together consumed only 1.27% of the total water. As shown in Figure 3, water stress in the northern region (average WSI value of 0.73) is generally higher than that in the southern region (average WSI value of 0.20). Due to the severe regional imbalance between socio-economic development and natural resources, water scarcity conflicts are prominent in the eastern urban agglomerations, such as Beijing–Tianjin–Hebei (WSI value of 1) and the Yangtze River Delta.
Indirect water consumption in the upstream stage of thermal power accounted for 25.1%, and the determinant of direct water consumption for electricity generation is the cooling technology. In the northern region, the largest thermal power lifecycle water footprint is 2.96 m3/MWh in Beijing (90.7% for recirculating cooling) and the smallest is 1.23 m3/MWh in Shanxi (60.79% for dry cooling). Large thermal power bases are mainly distributed in North and Northwest China where water resources are scarce, but coal reserves are abundant. The top three provinces with the largest WSI-weighted scarce water consumption were Xinjiang (870.50 Mm3), Shandong (668.56 Mm3) and Inner Mongolia (585.58 Mm3). Thermal power capacity expansion poses a great challenge to local water resources and the ecological carrying capacity.
The lifecycle water footprint of hydropower was the largest at 15.25 m3/MWh and 17.69% of hydropower generation consumed 52.31% of water resources. However, more than 60% of hydropower dams are present in the Yangtze and Southwest China basins, where the climate is humid and the impact on water resource occupancy is comparatively small. For example, the top three provinces in hydropower generation (Sichuan, Yunnan and Hubei) consumed 91.50 Mm3, 22.19 Mm3 and 22.66 Mm3 of scarce water, respectively, much less than that of the arid northern provinces dominated by thermal power.

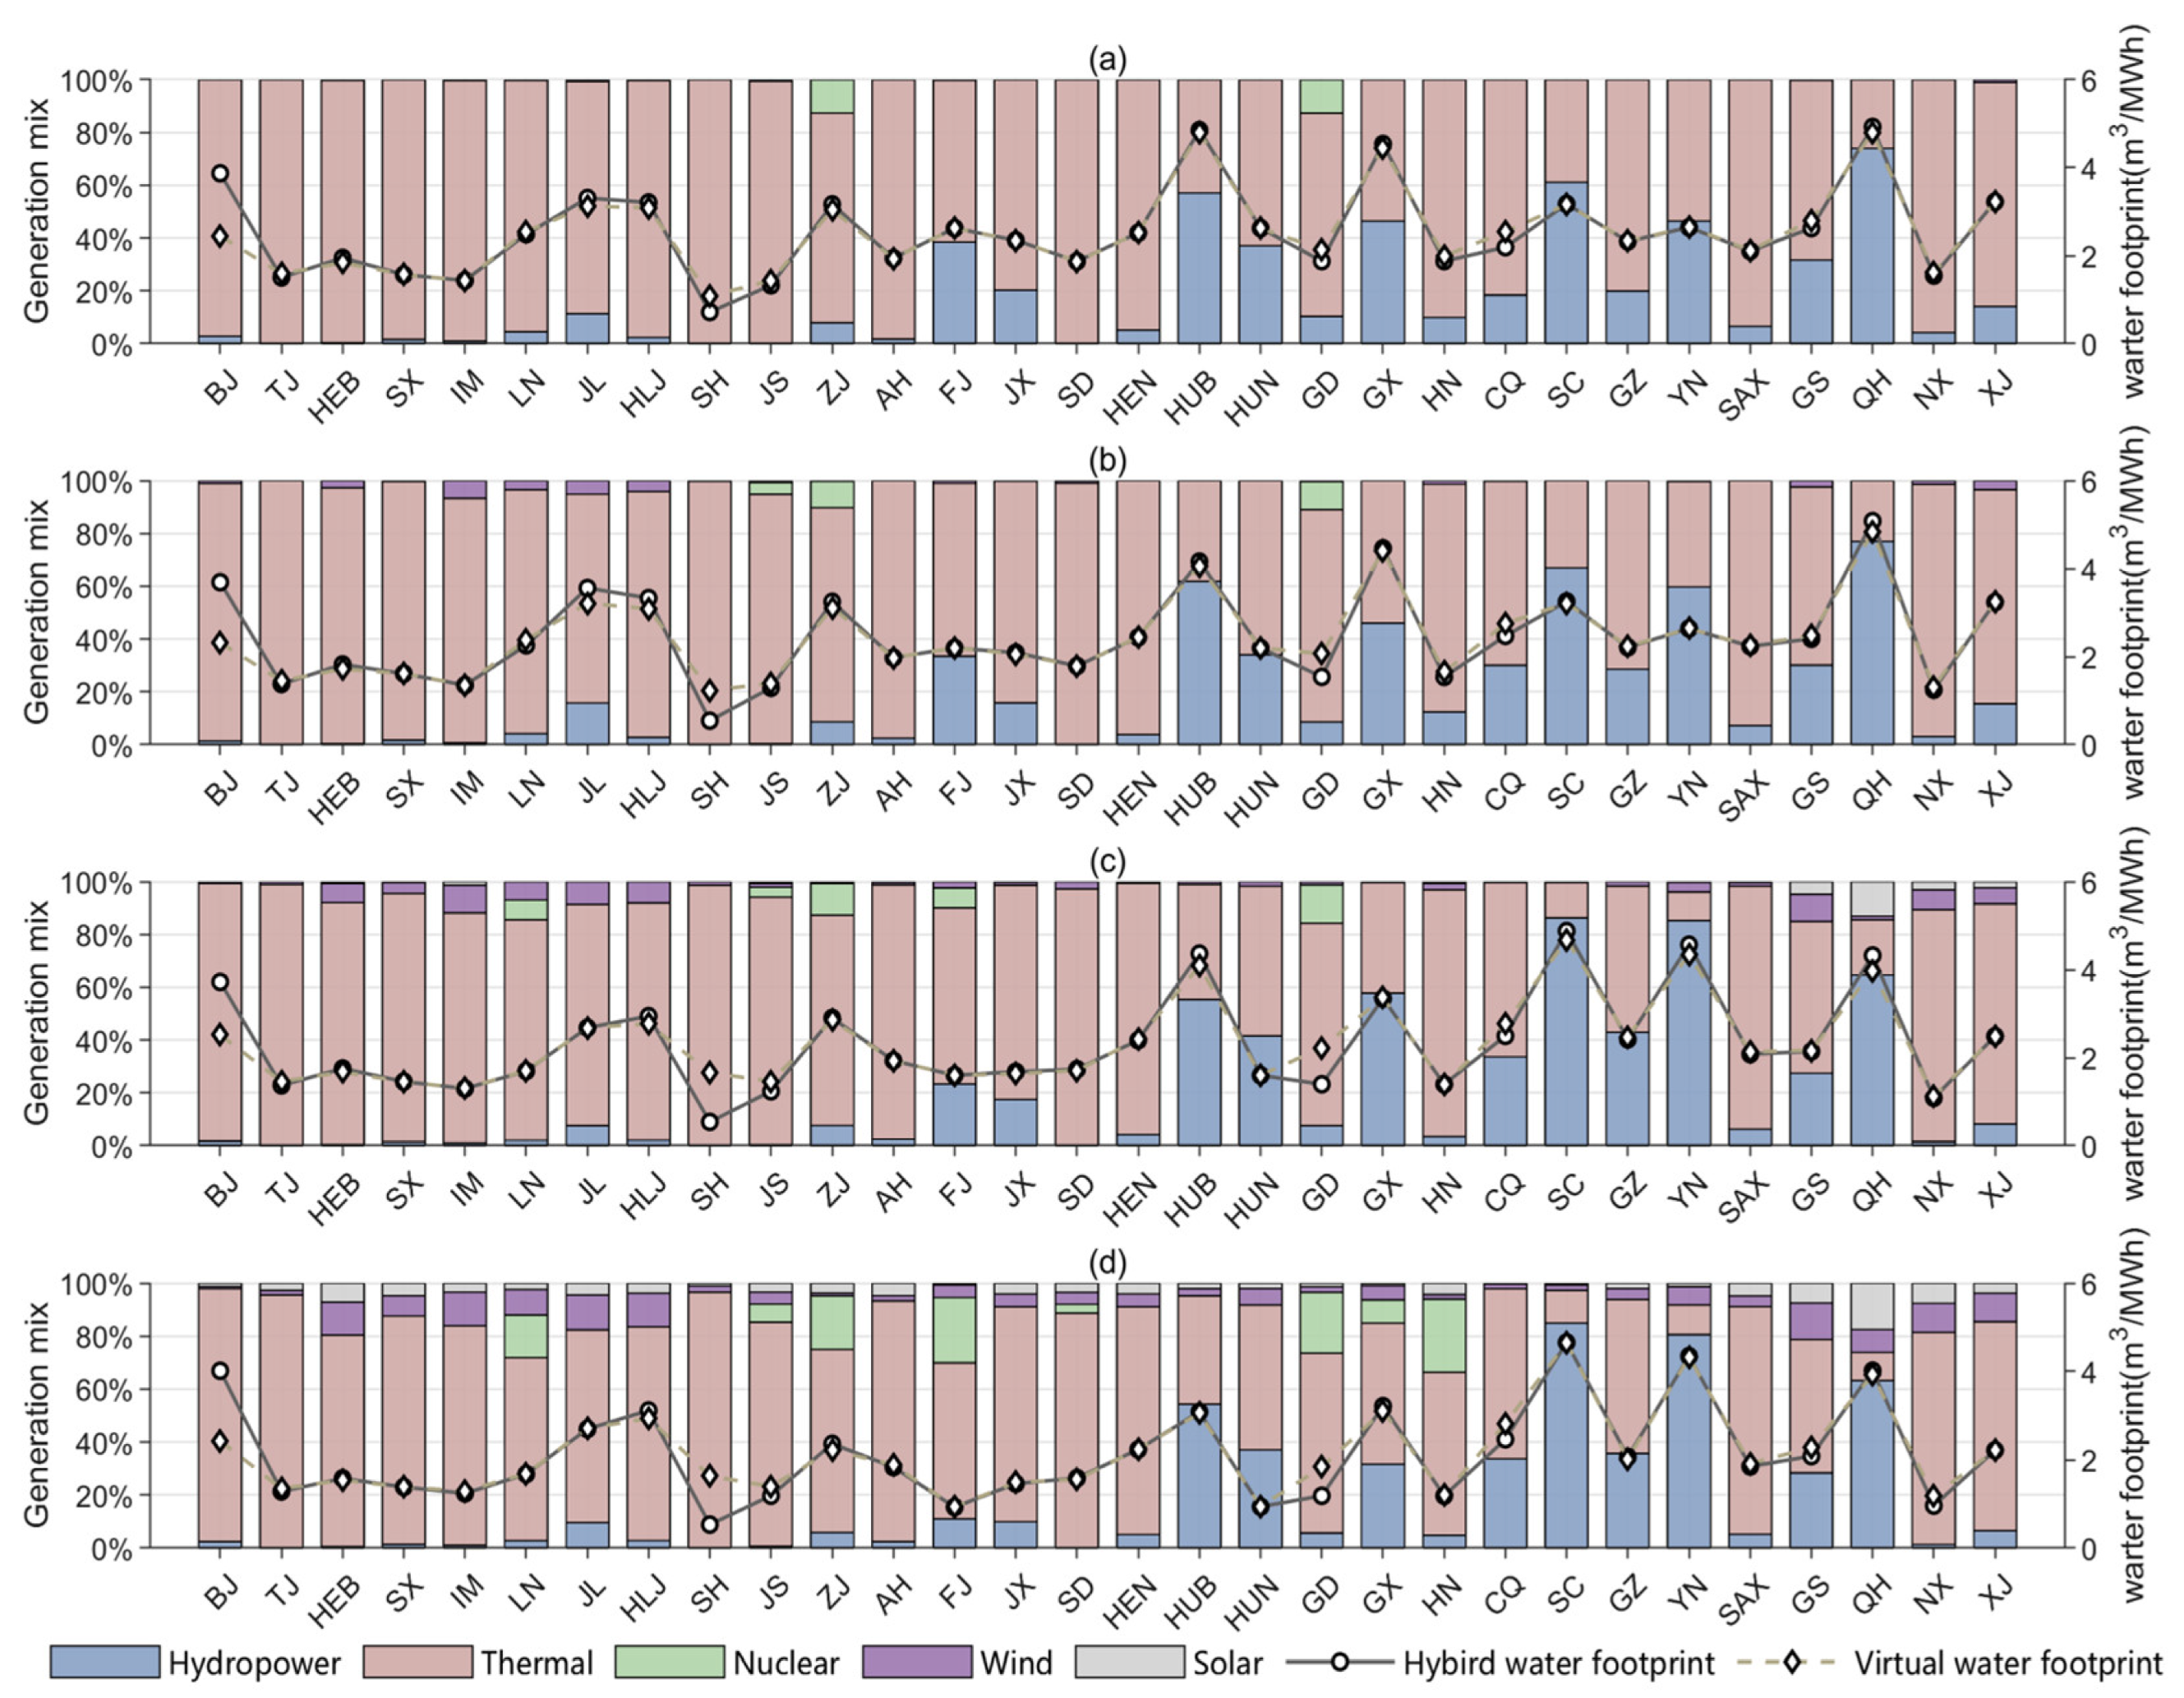
3.2. Hybrid Water Footprint and Virtual Water Footprint of Electricity

The hybrid water footprint of each province was mainly influenced by the generation structure. As illustrated in Figure 4, provinces with higher hydropower share had a relatively large hybrid water footprint, such as Sichuan (4.65 m3/MWh), Yunnan (4.34 m3/MWh) and Qinghai (4.02 m3/MWh). In addition, certain eastern provinces with a flat topography had a much larger hydropower water footprint than western provinces [114] with a low hydropower share but a large hybrid water footprint, e.g., Beijing (4.01 m3/MWh) and Heilongjiang (3.12 m3/MWh).
Compared to hybrid water footprints, virtual water footprints represent the relative contribution of each province along the trade path to the total footprint [115]. For example, Beijing’s virtual water footprint was much smaller than its hybrid water footprint because 61.5% of Beijing’s electricity demand comes from Hebei (1.58 m3/MWh), Shanxi (1.38 m3/MWh) and Inner Mongolia (1.23 m3/MWh). The national electricity structure has experienced a substantial transformation during the period studied. Wind and solar capacity expansions in the northwest grid have led to a reduction in the water footprint of relevant provinces. For instance, Xinjiang’s clean energy generation increased 3.18-fold, resulting in Henan’s (its electricity importer) virtual water footprint declining from 2.52 m3/MWh to 2.24 m3/MWh.

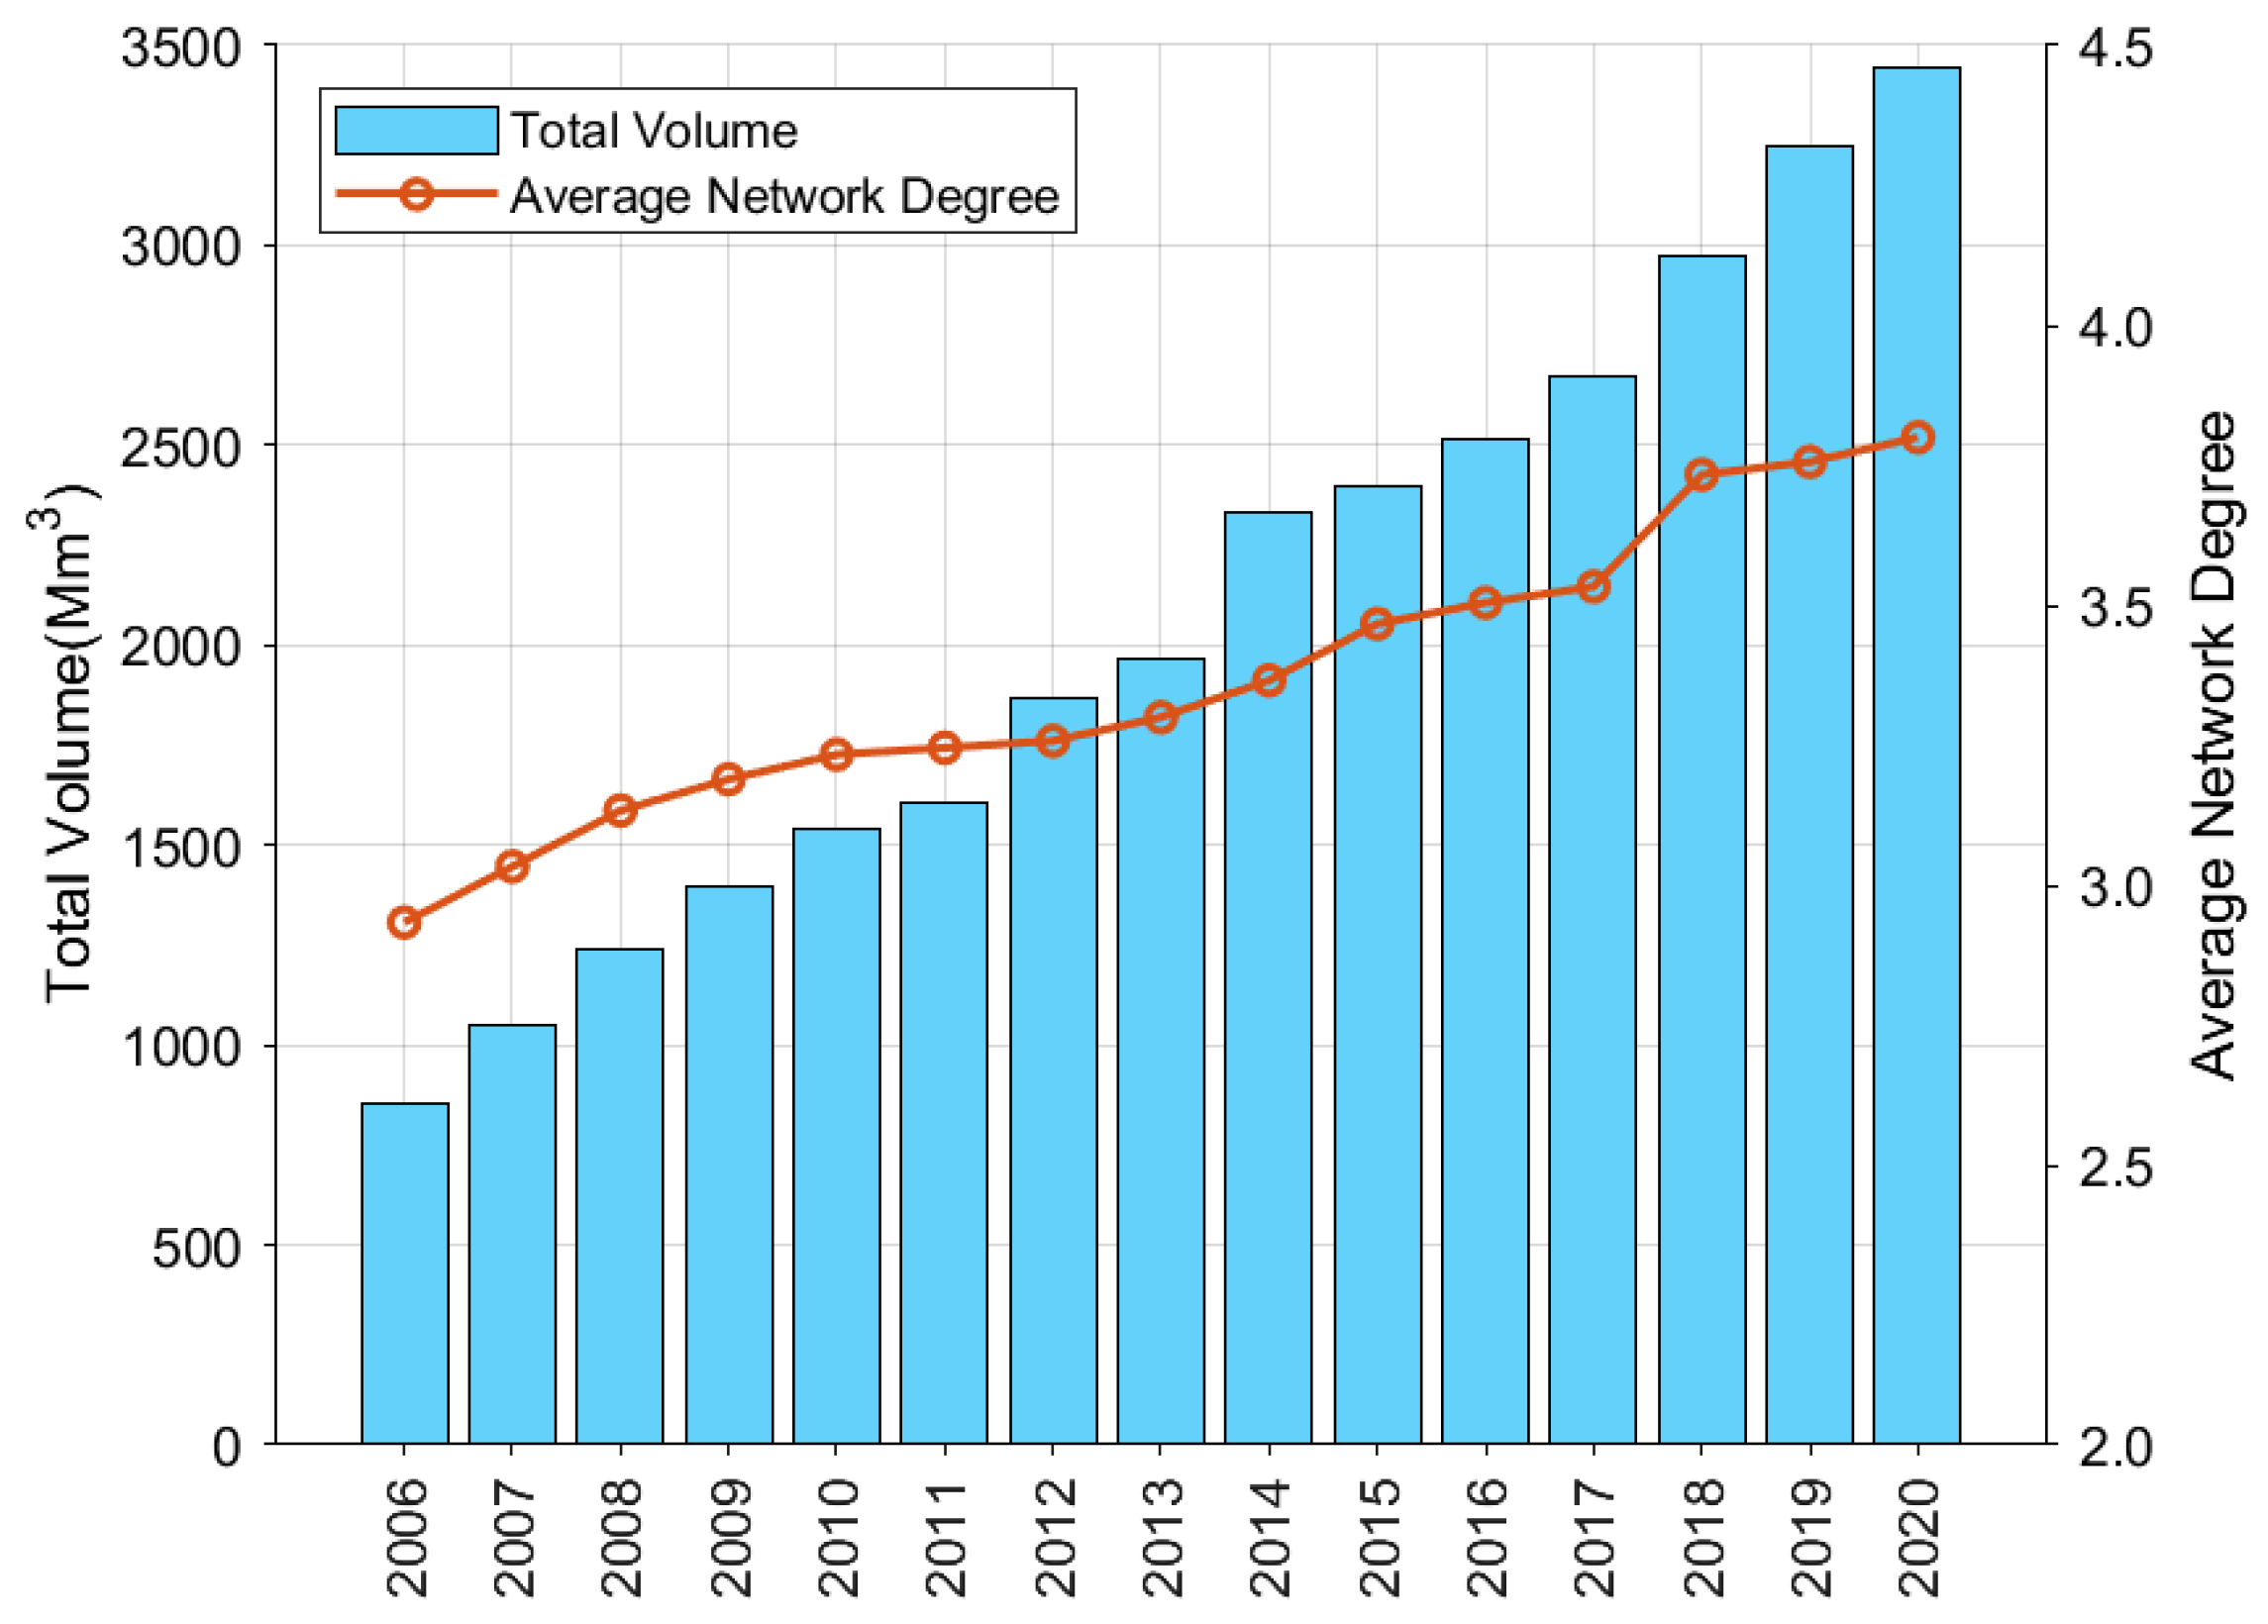
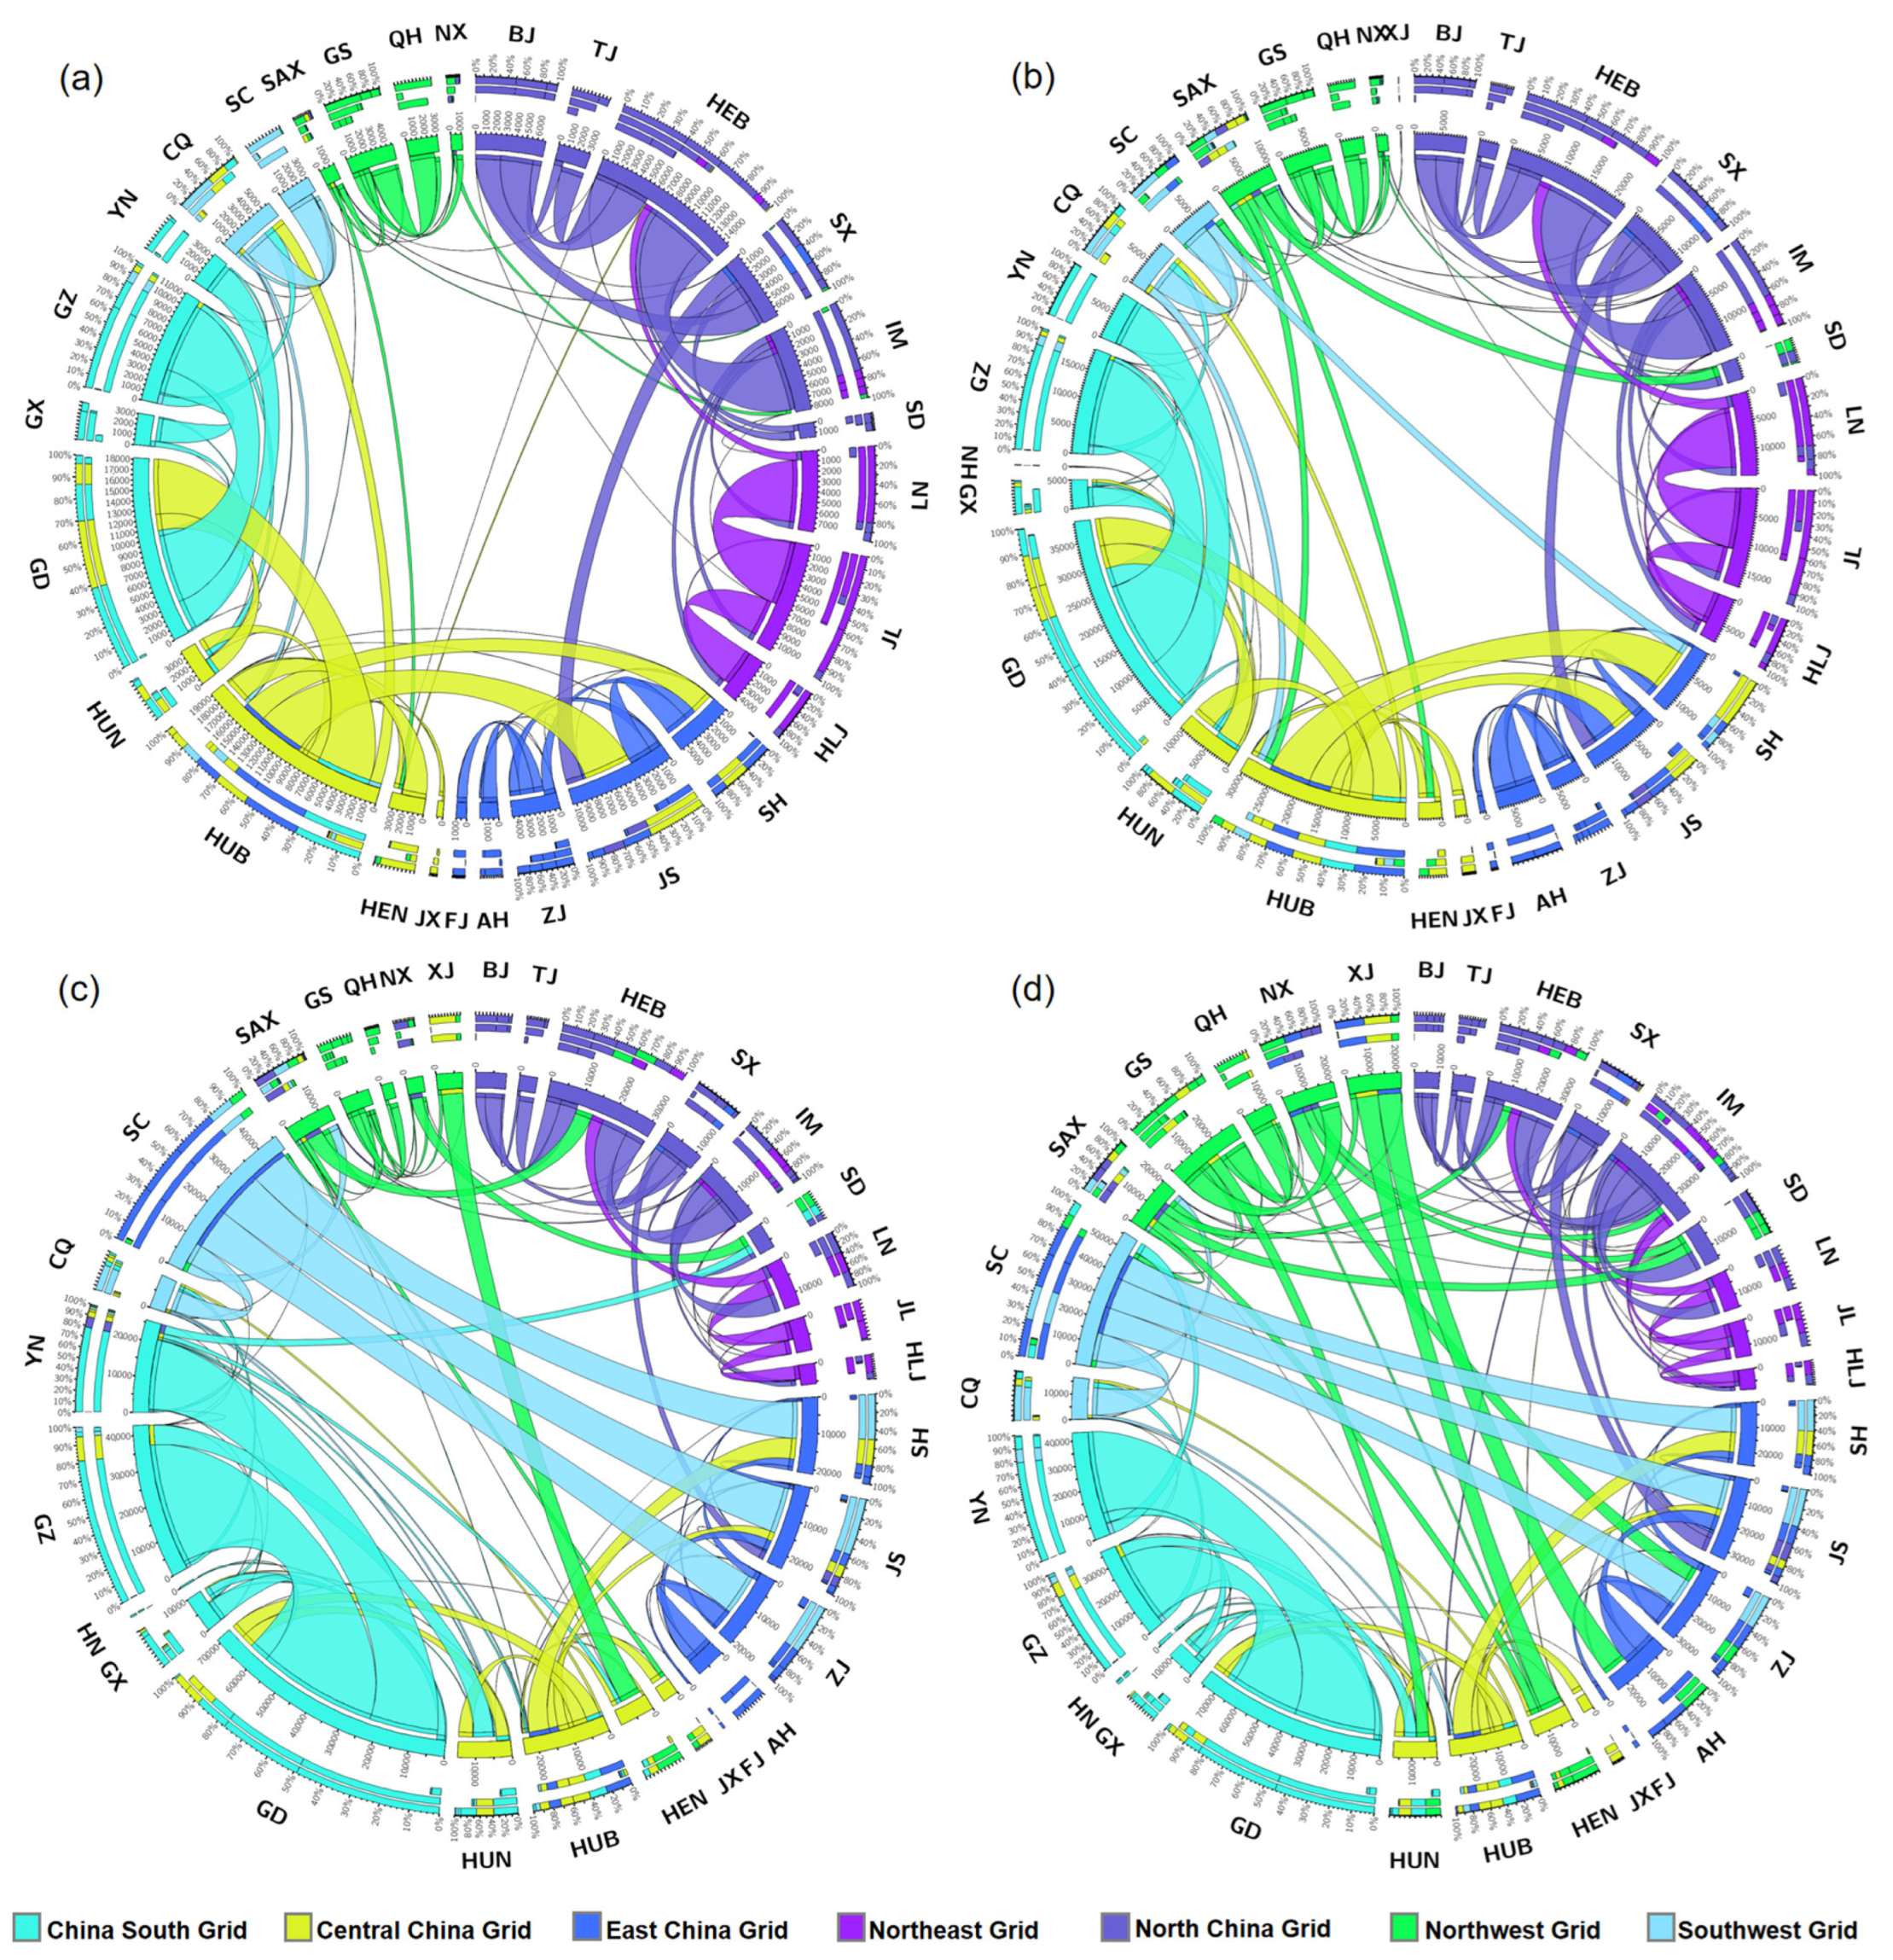
3.3. Evolution of Virtual Water Flow for Interprovincial Electricity Trade

Based on the node flow model, we constructed virtual water transfer networks for interprovincial electricity trade from 2006 to 2020. With the expansion of the cross-regional interconnected power grid, the mean number of electricity trade partners (network average degree) grew from 2.9 to 3.8 for each province during the study period (Figure 5). The total virtual water volume rose from 851.24 Mm3 to 3441.58 Mm3, associated with a 3.63-fold increase in the interprovincial electricity transmission capacity. Furthermore, we visualized the virtual water network (Figure 6) with the Circos tool to analyze its structural evolution. The flexibility of virtual water network links for electricity trade is relatively small due to the limitations of the grid infrastructure [53], with little change in the overall trade structure. The three major paths of virtual water transfer were Hubei and Sichuan to the Yangtze River Delta, Guizhou and Yunnan to Guangdong, and Inner Mongolia and Shanxi to Beijing–Tianjin–Hebei.
The change in virtual water flows over time was mainly due to the growth of the interprovincial electricity transmission capacity. During the 12th Five-Year Plan period (2011–2015), Sichuan’s hydropower development accelerated significantly, with 359.73 Mm3 of virtual water transferred to the East China grid in 2015. During the “13th Five-Year Plan” period (2016–2020), the exported electricity from the northwest grid grew by a factor of 2.4 and the total virtual water outflow increased from 252.65 Mm3 to 766.65 Mm3.
On the whole, for China’s electricity trade, the virtual water flowed from west to east, which was inconsistent with the spatial distribution of water resources in China (Figure 7). In 2020, for example, Inner Mongolia (246.57 Mm3), Xinjiang (206.25 Mm3) and Ningxia (120.91 Mm3) had the largest virtual scarce water exports, and Xinjiang to Anhui (94.45 Mm3), Xinjiang to Henan (89.79 Mm3), Inner Mongolia to Hebei (62.88 Mm3), and Ningxia to Zhejiang (55.42 Mm3) were the paths with the largest virtual scarce water flows. The virtual water outflow from exporting regions not only increased the pressure on local surface and groundwater, but also intensified intersectoral competition for water use, especially for the northern provinces with high WSIs.

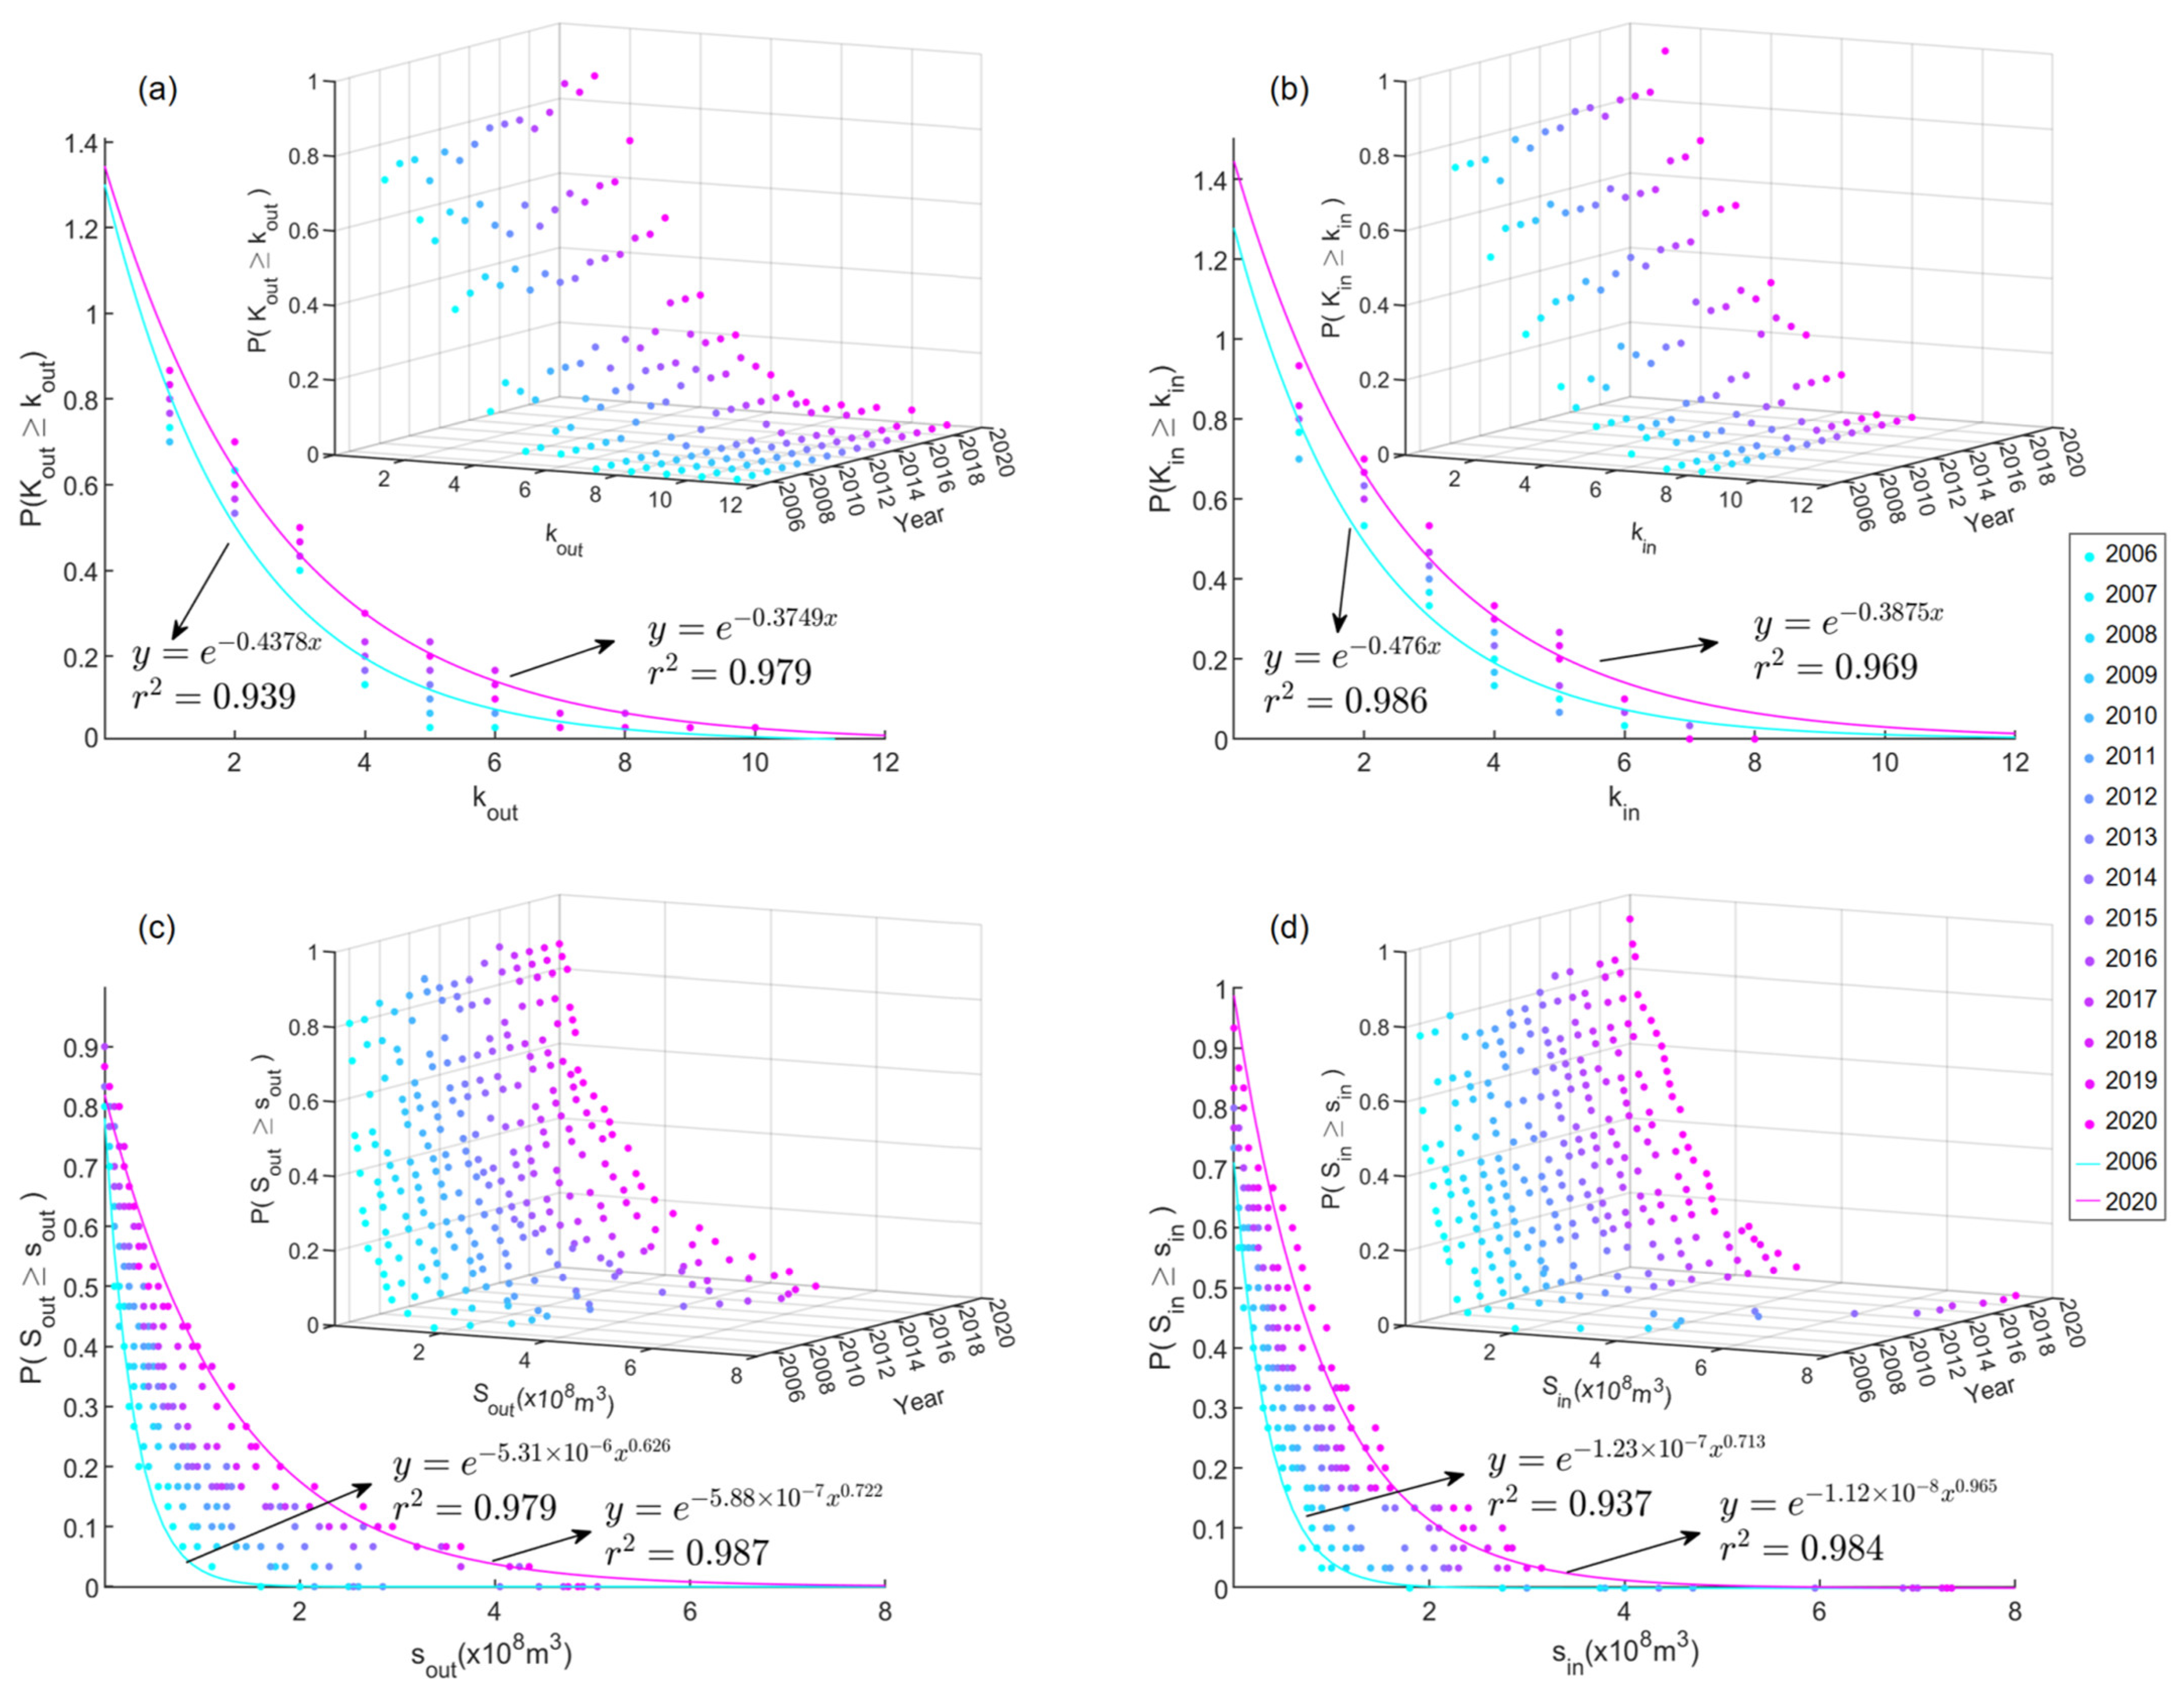
3.4. Cumulative Degree Distributions of the Topological Network

The node degree is the primary measurement of node influence in a topological network, the node out-degree ranges from 1 to 11 (average out-degree is 3.3), and the node in-degree ranges from 1 to 7 (the average in-degree is 2.9). We plotted the cumulative degree distributions ( P k ) from 2006 to 2020 based on A D (Figure 8a,b). The number of electricity trading partners follows an exponential distribution, P k e k / κ . As we can see, the in-degree distribution has a finer tail than the out-degree distribution [33]. The spatial distribution of China’s primary energy resources is imbalanced; thus, provinces with a surplus of electricity tend to export to multiple electricity-deficient provinces, while provinces with a low self-sufficiency tend to import from several specific provinces.

3.5. Cumulative Strength Distribution of the Weighted Network

Weights had strongly enhanced the heterogeneity of the topological network, and the virtual water volume varies substantially between different regions. For example, the two paths with the most virtual water transfers, Yunnan to Guangdong (341.82 Mm3), and Guizhou to Guangdong (287.79 Mm3), had 9.93% and 8.36% of the total network flow in 2020, respectively. As shown in Figure 8c,d, the strength distribution follows a stretched exponential distribution [33], P s e ( λ s ) α , where α ( 0 , 1 ) . This “heavy-tailed distribution” implied that small, tightly connected cores exist in the network, and localized crisis perturbations may be transmitted to the macroscopic network system through a few providers shared by most provinces [35,116]. α o u t is smaller than α i n , and P s o u t declines more slowly than P s i n with a heavier tail. If the virtual water volume of electricity-exporting provinces changes drastically due to unfavorable events (climate change, equipment failures, etc.), normal socio-economic activities in the importing provinces may be disturbed by changes in the water supply, especially in Beijing–Tianjin–Hebei and the Yangtze River Delta, which are highly dependent on external resources.
The change in node strength with node degree follows a power law relationship (Figure 9). s o u t ( k o u t ) k o u t β and s i n ( k i n ) k i n β , which is similar to the characteristics of the European electricity trading virtual water network [19]. This power law relationship suggests that the volume of electricity-related virtual water exchange is growing much faster than the number of trading partners, and active nodes with plenty of electricity interconnections with other provinces participate in virtual water transfers in a highly non-linear manner. In addition, the function of the virtual water exchange volume and trade connectivity varies depending on the trade direction. The slope of the import relationship increases over time. Provinces with a high electricity demand, such as Zhejiang, Jiangsu and Guangdong, have introduced considerable quantities of virtual water by expanding their import sources, which has effectively alleviated their local water pressure. In contrast, the slope of the export relationship decreases over time, suggesting that power exporters have reached the limit of the number of export partners to increase virtual water exports [33].

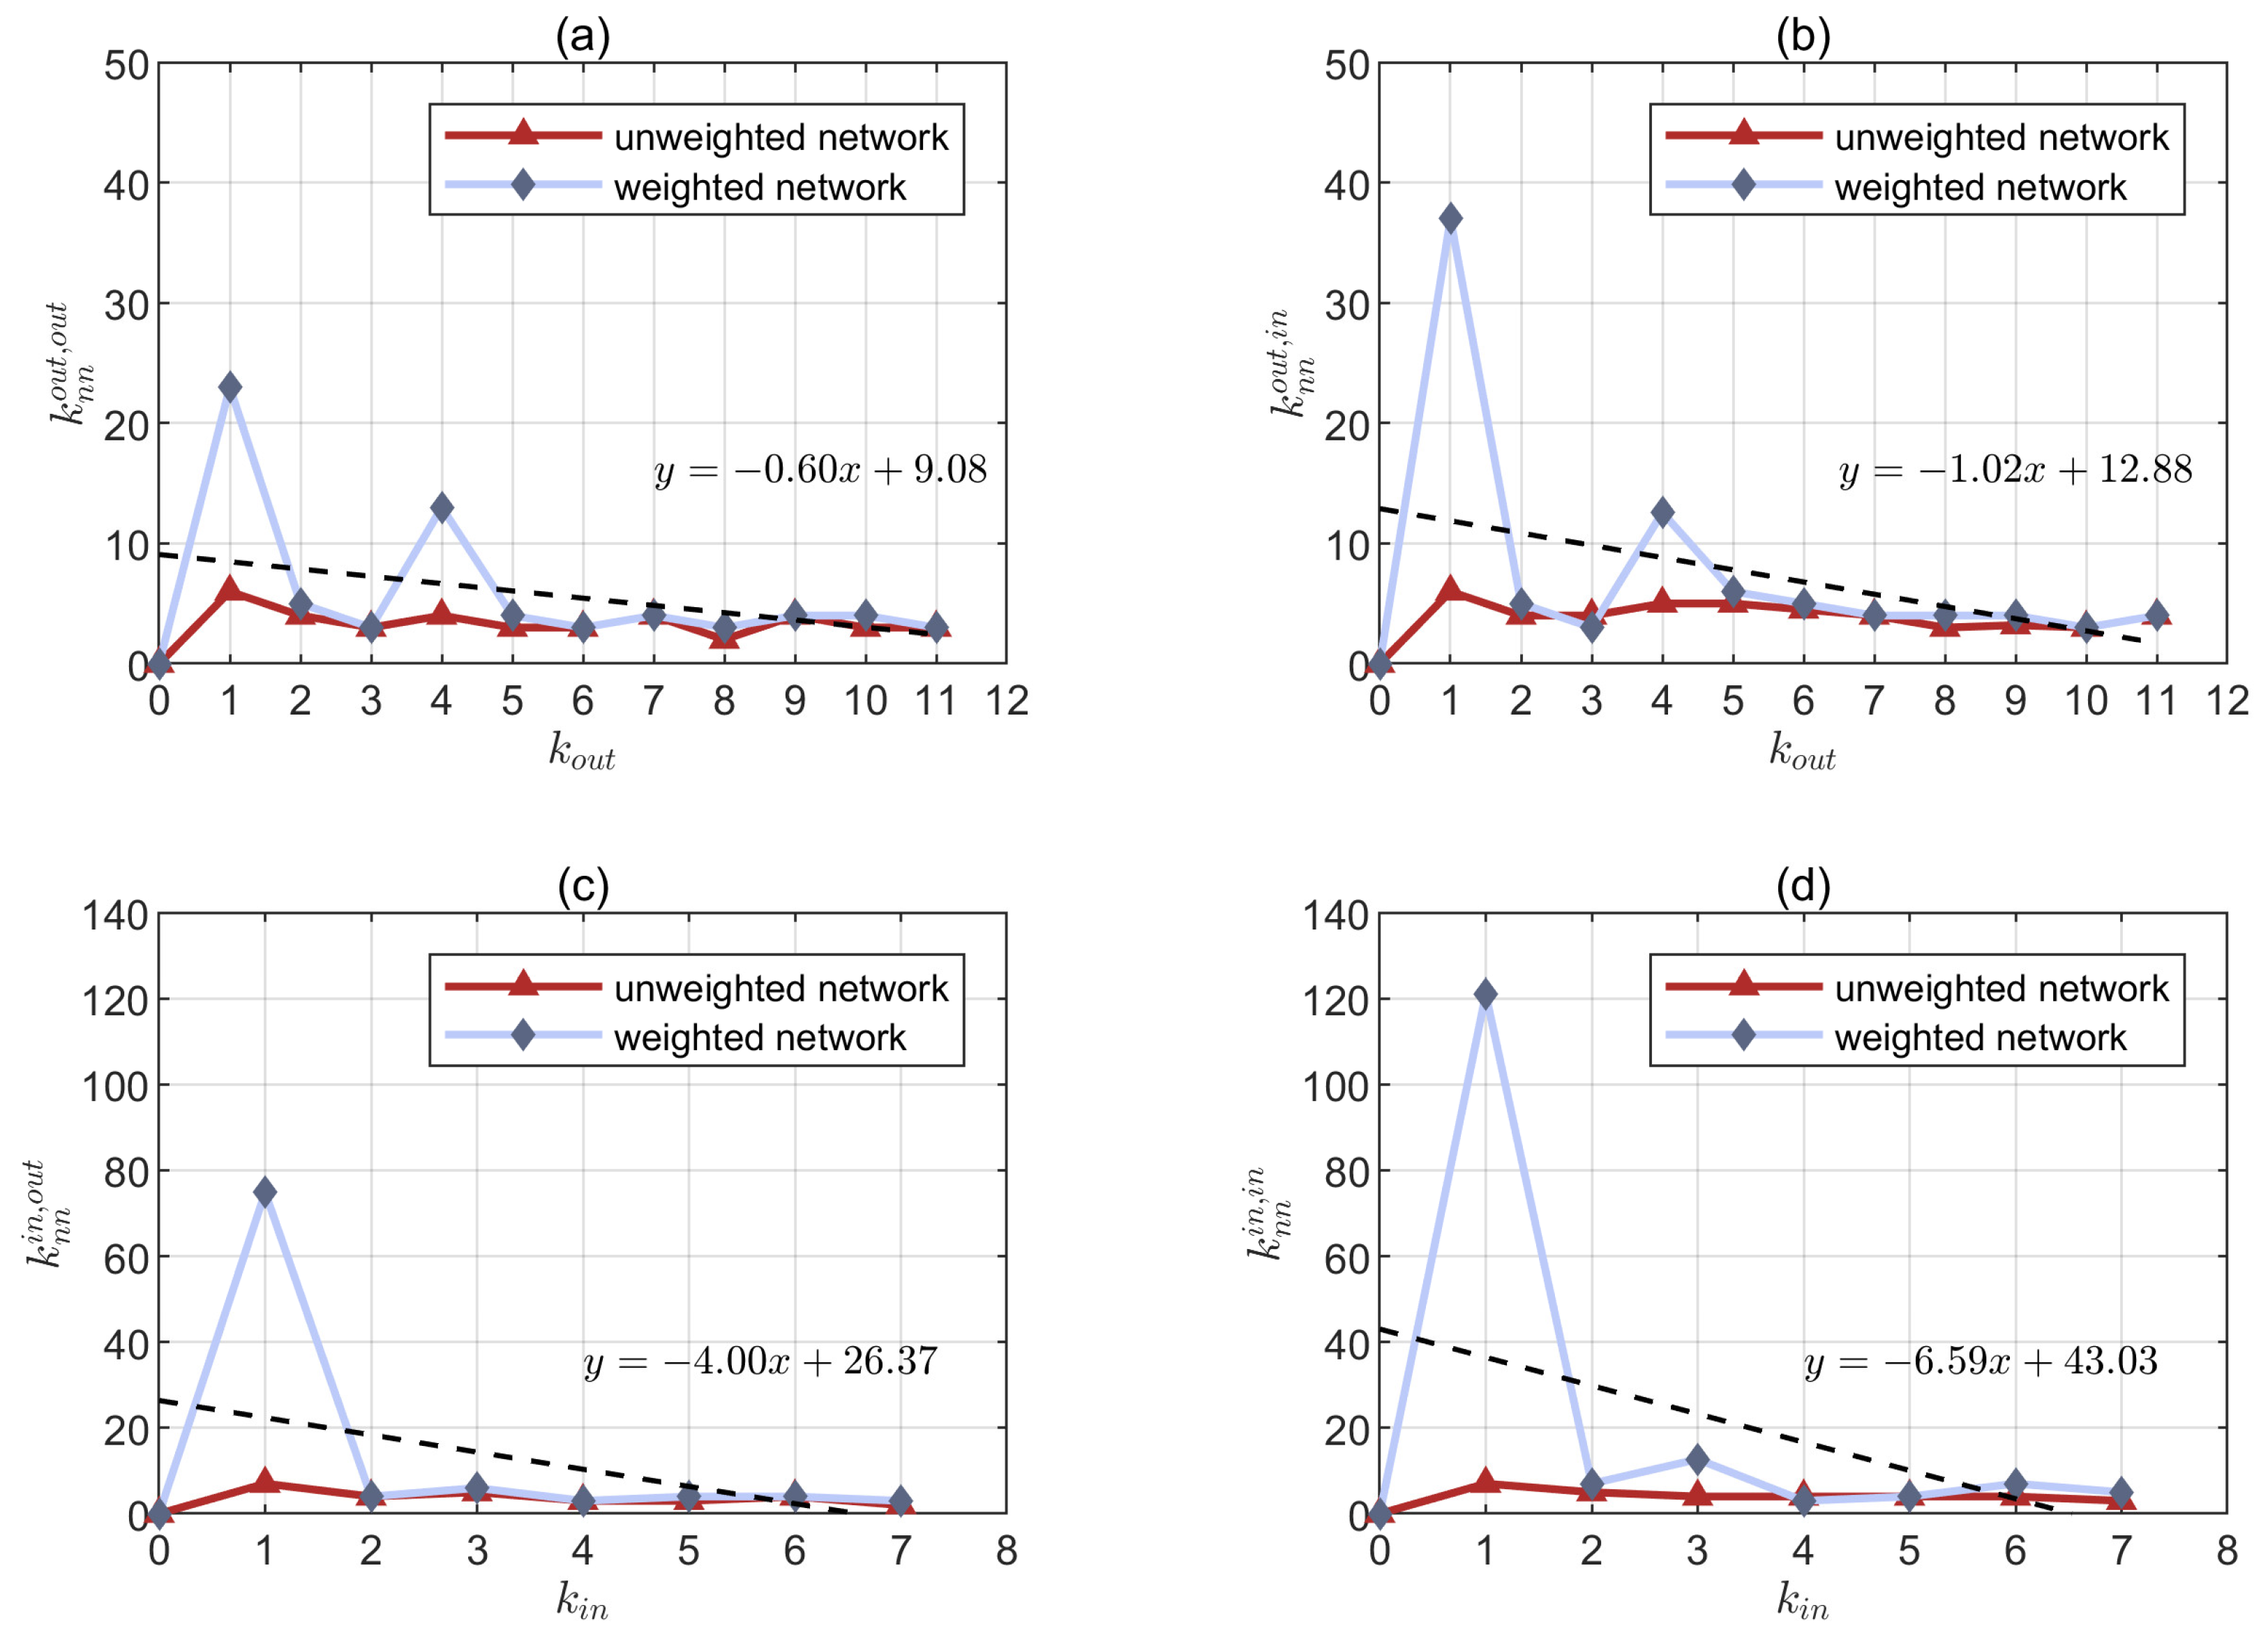
3.6. Degree Correlation of the Node Degree and Node Strength

Generally speaking, both k n n ( k ) and k n n ( k ) display a decreasing trend, which implies that the topological network and the weighted network are both disassortative [33] (Figure 10). The weighted attributes of the nodes did not change the network’s connection tendency; that is, nodes with a large virtual water volume tend to connect to nodes with a small virtual water volume. This suggests potential systemic risks, in that small interferences may affect overall water resource reallocation and disturb the water supply of importing regions [116]. In addition, k n n is larger than k n n , indicating that regions with large virtual water volumes are more likely to connect to regions with multiple trading partners [33]. In general, the national architecture of the virtual water network is one of interprovincial connections and has a tendency towards aggregation, whereby provinces with an active virtual water exchange are more closely linked in the trade.

3.7. Driving Factors of the Virtual Water Network

In order to investigate the formation mechanism of the virtual water network for electricity trade, first we conducted the QAP correlation analysis (see Supplementary Materials for the results) and excluded the power generation level (PG) and water resource endowment (WRE) variables, which were not significantly correlated with the network. Then, we selected the remaining seven variables as independent variables and performed QAP regression every two years. The standardized regression coefficients and significant probabilities shown in Table 2 were obtained by randomly substituting the data 2000 times in UCINET 6.0 software.
The coefficient of clean energy generation proportion is constantly negative and the test is significant at the 5% level in two years, indicating that smaller differences in clean energy generation proportion between provinces are more favorable for virtual water trade formation. Provinces with a high share of clean energy tend to have specific advantages in terms of natural resources, industrial systems and land area, and provinces with similar values of these conditions are clustered in different sub-grids, such as the Songliao clean energy base of the northeast grid (which mainly develops wind and photovoltaic energy). This explains the virtual water flows within the sub-grid to a certain extent. The coefficient of feed-in tariff is positive and passes the significance test in most years, suggesting that two provinces with differences in feed-in tariffs (power generation costs) are more likely to form power deals and promote virtual water trading.
Grid connection is significant at the 1% level and has a large coefficient, suggesting that direct grid connections are an important influencing factor for virtual water network formation. The western region of China is rich in energy resources but has an insufficient consumption capacity, while the eastern and central regions are relatively deficient in resources but have high energy demands. However, the traditional energy delivery methods of transporting coal by rail and road may be hampered by the insufficient transportation capacity and high environmental costs. Therefore, the Government continues to expand the scale of cross-provincial interconnected power grids to balance the supply and demand, forming a virtual water flow channel.
The three variables representing the characteristics of electricity consumption all passed significant tests and had positive coefficients, with GDP per capita and urbanization rate significant at the 10% level and total electricity consumption imported at the 1% level, indicating that the interprovincial differences in total electricity consumption are highly positively correlated with the virtual water trade volume. This is because developed provinces with a higher GDP per capita have faster industrialization processes and higher demands for electricity in energy-intensive industrial sectors. At the same time, differences in urbanization rates lead to a higher electricity consumption in the tertiary sector and in residences in the developed provinces as well. On this basis, developed regions with a higher electricity consumption import electricity from less developed regions with excess capacity to meet consumption demand, thus driving virtual water transfers.
Neither the WSI nor water resources endowment passed the significance test, suggesting that regional differences in both water stress and water resources endowment do not affect virtual water network formation. This corroborates Song et al.’s [117] argument that the industrial layout, rather than water resources, determines the direction of domestic virtual water flows, providing an explanation for the unsustainable virtual water outflow path in the northern region.

4. Conclusions

In this paper, we have evaluated the spatial transfer of water resources in China’s interprovincial electricity trade network and determined the structural characteristics of the virtual water network in conjunction with complex network theory. The equilibrium and correlation of regions in the network provide valuable references for cost sharing and benefit distribution of water resources. On this basis, we identified the driving factors of virtual water flow based on the QAP and gained socio-environmental insights into the formation of the virtual water spatial flow patterns. By investigating the cross-boundary impacts of electricity trading on freshwater vulnerability in the context of the energy–water nexus, this research can support investment decisions for more water-efficient power plants and transmission lines.
The current power plant sites are not compatible with local water stresses; thermal power capacity expansion has greatly exacerbated the water pressure in coal-rich Northern and Northwestern China. Hydroelectric resources exploitation in the southwest basin has alleviated water shortages to a certain extent for power industry development. However, hydropower is still not an efficient water utilization solution compared to wind power (0.097 m3/MWh) and photovoltaic power (0.16 m3/MWh), which have a small lifecycle water footprint. In recent years, hydropower shortages due to dry runoff in the southwest basin, superimposed on electricity load surges resulting from extreme high temperatures, have put pressure on the dispatch and operation of power grids. But as we can see, the rapid development of wind power and photovoltaics in the northwest grid has effectively reduced the water footprints of local and recipient provinces.
With the construction and operation of the West–East Electricity Transmission Project, coal, wind and solar power from the North China and Northwest grids is delivered to the Beijing–Tianjin–Hebei urban agglomeration, and hydropower from the southwest grid is delivered to the Yangtze River Delta (Jiangsu, Zhejiang and Shanghai) and Guangdong. It is worth noting that electricity-related virtual water transfers are intensifying freshwater shortages in the exporting regions. The current spatial virtual water flow pattern is unsustainable, especially for the northwest region with a high WSI, which deserves our attention in the context of coordinated energy and water resources utilization.
Compared to previous research based on the ENA method [20,21], CNA theory revealed the overarching network characteristics as well as the equilibrium and connectivity tendencies of different regions. It captured the non-linear relationship between the node strength and node degree, which follow a power law distribution. Eastern provinces with a high electricity demand introduced considerable amounts of virtual water by expanding their import sources. In addition, the characterization of network resilience by degree distribution and degree correlation contributed to the discussion on potential water security risks associated with high trade connectivity [62]. On one hand, water-scarce cities could conserve water resources by importing water-intensive electricity products, while, on the other hand, networks may foster the propagation of unfavorable shocks to trading regions due to cascading effects. The fat-tailed distribution of node strengths and the disassortativity of the weighted network confirm that local shocks that constrain the electricity production may affect the overall water resource reallocation and disturb the water supply of the importing regions. Therefore, cross-regional coordination of energy and water management policies is needed to reduce the vulnerability of virtual water systems to negative shocks which would otherwise propagate to a large number of provinces.
The QAP analysis indicated that virtual water transfer network formation is mainly influenced by differences in provincial electricity consumption characteristics and direct grid connections, and is independent of regional differences in water stress and water endowment. The current electricity market forces reflect the scarcity of energy and capital factors in the context of China’s interprovincial trade, but do not reflect the scarcity of water resources. As a result of resource-intensive economic development and urbanization expansion, eastern coastal cities have exacerbated the water scarcity in northern exporting provinces by outsourcing virtual water to less-developed regions that have abundant energy resources and lower generation costs.

5. Policy Implications

Based on the analysis of the network structure and the identification of driving factors, we discovered that the “electricity–water” conflict caused by interprovincial electricity trading can be attributed to the following two aspects. First, the long-term imbalance of China’s regional development due to urban polarization and resource endowment differences has driven the western provinces to deliver natural resources to the eastern provinces at the expense of their own ecological benefits. Second, the management of water and electricity resources belongs to two separate departments, and the policy and legal “segregation” brought about by this sub-sectoral management mode has caused uncoordinated resources exploitation and utilization. In order to properly address the serious issue of water resource constraints and develop a sustainable power system, in this paper we propose the following comprehensive management strategies. Firstly, a shared information database among the energy sector, river basin management agencies and local water administrative authorities needs to be established to overcome regional and industrial barriers and realize collaborative regulation of power and water resources. Secondly, it is necessary to construct a resource-cycling industrial system at the provincial level to optimize the energy-use structure [118] and reduce the dependence on external virtual resources. Thirdly, a cross-regional ecological compensation mechanism should be established. It is imperative for the Government to employ comprehensive compensation tools such as water resource taxes, cross-regional water rights trading and government financial transfers to stimulate consumer-driven policies. In this way, eastern developed provinces can be encouraged to provide funds and technology to less developed regions to alleviate water stress caused by power generation.

Supplementary Materials

The following supporting information can be downloaded at: https://www.mdpi.com/article/10.3390/su152215977/s1, Table S1: Results of QAP correlation analysis; Table S2: Abbreviations of provincial administrative regions and sub-grid divisions.

Author Contributions

Conceptualization, H.L. and X.Z.; methodology, H.L. and X.H.; software, H.L. and X.H.; validation, H.L. and X.H.; formal analysis, H.L.; investigation, H.L. and X.Z.; resources, X.Z.; data curation, H.L. and X.H.; writing—original draft preparation, H.L. and X.H.; writing—review and editing, H.L. and X.H.; visualization, H.L.; supervision, X.Z.; project administration, X.Z. All authors have read and agreed to the published version of the manuscript.

Funding

This research received no external funding.

Institutional Review Board Statement

Not applicable.

Informed Consent Statement

Not applicable.

Data Availability Statement

Data are contained within the article.

Conflicts of Interest

The authors declare no conflict of interest.

References

  1. Figueiredo Pereira de Faria, A.C.; Berchin, I.I.; Garcia, J.; Barbosa Back, S.N.; Andrade Guerra, J.B.S.O.d. Understanding food security and international security links in the context of climate change. Third World Q. 2016, 37, 975–997. [Google Scholar] [CrossRef]
  2. Benson, D.; Gain, A.K.; Rouillard, J.J. Water governance in a comparative perspective: From IWRM to a’nexus’ approach? Water Altern. 2015, 8, 756–773. [Google Scholar]
  3. Bleischwitz, R.; Spataru, C.; VanDeveer, S.D.; Obersteiner, M.; van der Voet, E.; Johnson, C.; Andrews-Speed, P.; Boersma, T.; Hoff, H.; Van Vuuren, D.P. Resource nexus perspectives towards the United Nations sustainable development goals. Nat. Sustain. 2018, 1, 737–743. [Google Scholar] [CrossRef]
  4. Williams, J.H.; DeBenedictis, A.; Ghanadan, R.; Mahone, A.; Moore, J.; Morrow III, W.R.; Price, S.; Torn, M.S. The technology path to deep greenhouse gas emissions cuts by 2050: The pivotal role of electricity. Science 2012, 335, 53–59. [Google Scholar] [CrossRef] [PubMed]
  5. Zhou, Y.; Li, H.; Wang, K.; Bi, J. China’s energy-water nexus: Spillover effects of energy and water policy. Glob. Environ. Chang. 2016, 40, 92–100. [Google Scholar] [CrossRef]
  6. Van Vliet, M.T.; Wiberg, D.; Leduc, S.; Riahi, K. Power-generation system vulnerability and adaptation to changes in climate and water resources. Nat. Clim. Chang. 2016, 6, 375–380. [Google Scholar] [CrossRef]
  7. Zhang, C.; Zhong, L.; Fu, X.; Wang, J.; Wu, Z. Revealing water stress by the thermal power industry in China based on a high spatial resolution water withdrawal and consumption inventory. Environ. Sci. Technol. 2016, 50, 1642–1652. [Google Scholar] [CrossRef] [PubMed]
  8. Zheng, X.; Wang, C.; Cai, W.; Kummu, M.; Varis, O. The vulnerability of thermoelectric power generation to water scarcity in China: Current status and future scenarios for power planning and climate change. Appl. Energy 2016, 171, 444–455. [Google Scholar] [CrossRef]
  9. Hoekstra, A.Y. Human appropriation of natural capital: A comparison of ecological footprint and water footprint analysis. Ecol. Econ. 2009, 68, 1963–1974. [Google Scholar] [CrossRef]
  10. Ali, B.; Kumar, A. Development of life cycle water-demand coefficients for coal-based power generation technologies. Energy Convers. Manag. 2015, 90, 247–260. [Google Scholar] [CrossRef]
  11. Liao, X.; Hall, J.W.; Eyre, N. Water use in China’s thermoelectric power sector. Glob. Environ. Change 2016, 41, 142–152. [Google Scholar] [CrossRef]
  12. Chai, L.; Liao, X.; Yang, L.; Yan, X. Assessing life cycle water use and pollution of coal-fired power generation in China using input-output analysis. Appl. Energy 2018, 231, 951–958. [Google Scholar] [CrossRef]
  13. Feng, K.; Hubacek, K.; Siu, Y.L.; Li, X. The energy and water nexus in Chinese electricity production: A hybrid life cycle analysis. Renew. Sustain. Energy Rev. 2014, 39, 342–355. [Google Scholar] [CrossRef]
  14. Meldrum, J.; Nettles-Anderson, S.; Heath, G.; Macknick, J. Life cycle water use for electricity generation: A review and harmonization of literature estimates. Environ. Res. Lett. 2013, 8, 015031. [Google Scholar] [CrossRef]
  15. Jin, Y.; Behrens, P.; Tukker, A.; Scherer, L. Water use of electricity technologies: A global meta-analysis. Renew. Sustain. Energy Rev. 2019, 115, 109391. [Google Scholar] [CrossRef]
  16. Allan, J.A. Fortunately there are substitutes for water otherwise our hydro-political futures would be impossible. Priorities Water Resour. Alloc. Manag. 1993, 13, 26. [Google Scholar]
  17. Allan, J.A. Overall perspectives on countries and regions. In Water in the Arab World: Perspectives and Prognoses; Rogers, P., Lydon, P., Eds.; Harvard University Press: Cambridge, MA, USA, 1994; pp. 65–100. [Google Scholar]
  18. Djehdian, L.A.; Chini, C.M.; Marston, L.; Konar, M.; Stillwell, A.S. Exposure of urban food–energy–water (FEW) systems to water scarcity. Sustain. Cities Soc. 2019, 50, 101621. [Google Scholar] [CrossRef]
  19. Chini, C.M.; Stillwell, A.S. The changing virtual water trade network of the European electric grid. Appl. Energy 2020, 260, 114151. [Google Scholar] [CrossRef]
  20. Guo, R.; Zhu, X.; Chen, B.; Yue, Y. Ecological network analysis of the virtual water network within China’s electric power system during 2007–2012. Appl. Energy 2016, 168, 110–121. [Google Scholar] [CrossRef]
  21. Zhang, Y.; Hou, S.; Chen, S.; Long, H.; Liu, J.; Wang, J. Tracking flows and network dynamics of virtual water in electricity transmission across China. Renew. Sustain. Energy Rev. 2021, 137, 110475. [Google Scholar] [CrossRef]
  22. Chini, C.M.; Djehdian, L.A.; Lubega, W.N.; Stillwell, A.S. Virtual water transfers of the US electric grid. Nat. Energy 2018, 3, 1115–1123. [Google Scholar] [CrossRef]
  23. Liao, X.; Zhao, X.; Hall, J.W.; Guan, D. Categorising virtual water transfers through China’s electric power sector. Appl. Energy 2018, 226, 252–260. [Google Scholar] [CrossRef]
  24. Zhang, C.; Zhong, L.; Liang, S.; Sanders, K.T.; Wang, J.; Xu, M. Virtual scarce water embodied in inter-provincial electricity transmission in China. Appl. Energy 2017, 187, 438–448. [Google Scholar] [CrossRef]
  25. Wang, R.; Zimmerman, J.B.; Wang, C.; Font Vivanco, D.; Hertwich, E.G. Freshwater vulnerability beyond local water stress: Heterogeneous effects of water-electricity nexus across the continental United States. Environ. Sci. Technol. 2017, 51, 9899–9910. [Google Scholar] [CrossRef] [PubMed]
  26. Chu, C.; Ritter, W.; Sun, X. Spatial variances of water-energy nexus in China and its implications for provincial resource interdependence. Energy Policy 2019, 125, 487–502. [Google Scholar] [CrossRef]
  27. Xi, S.; Zhang, Y.; Liu, J.; Zhang, C.; Zhang, K.; Wang, J. Evolution of interprovincial virtual water flows along with electricity transmission and its impact on water scarcity in China. J. Clean. Prod. 2021, 322, 128957. [Google Scholar] [CrossRef]
  28. Wang, L.; Fan, Y.V.; Varbanov, P.S.; Alwi, S.R.W.; Klemeš, J.J. Water footprints and virtual water flows embodied in the power supply chain. Water 2020, 12, 3006. [Google Scholar] [CrossRef]
  29. Fang, D.; Chen, B. Ecological network analysis for a virtual water network. Environ. Sci. Technol. 2015, 49, 6722–6730. [Google Scholar] [CrossRef]
  30. Carr, J.A.; D’Odorico, P.; Laio, F.; Ridolfi, L. On the temporal variability of the virtual water network. Geophys. Res. Lett. 2012, 39, L06404. [Google Scholar] [CrossRef]
  31. Dalin, C.; Suweis, S.; Konar, M.; Hanasaki, N.; Rodriguez-Iturbe, I. Modeling past and future structure of the global virtual water trade network. Geophys. Res. Lett. 2012, 39, GL053871. [Google Scholar] [CrossRef]
  32. Konar, M.; Dalin, C.; Hanasaki, N.; Rinaldo, A.; Rodriguez-Iturbe, I. Temporal dynamics of blue and green virtual water trade networks. Water Resour. Res. 2012, 48, 1–11. [Google Scholar] [CrossRef]
  33. Konar, M.; Dalin, C.; Suweis, S.; Hanasaki, N.; Rinaldo, A.; Rodriguez-Iturbe, I. Water for food: The global virtual water trade network. Water Resour. Res. 2011, 47, WR010307. [Google Scholar] [CrossRef]
  34. Liang, X.; Long, A.; Yu, J. The Structural Characteristics of the Virtual Water Trade Network of the China’s Major Crops. Water 2022, 14, 4083. [Google Scholar] [CrossRef]
  35. Sartori, M.; Schiavo, S. Connected we stand: A network perspective on trade and global food security. Food Policy 2015, 57, 114–127. [Google Scholar] [CrossRef]
  36. Lü, L.; Zhou, T. Link prediction in complex networks: A survey. Phys. A Stat. Mech. Its Appl. 2011, 390, 1150–1170. [Google Scholar] [CrossRef]
  37. Tuninetti, M.; Tamea, S.; Laio, F.; Ridolfi, L. To trade or not to trade: Link prediction in the virtual water network. Adv. Water Resour. 2017, 110, 528–537. [Google Scholar] [CrossRef]
  38. Zhang, C.; He, G.; Zhang, Q.; Liang, S.; Zipper, S.C.; Guo, R.; Zhao, X.; Zhong, L.; Wang, J. The evolution of virtual water flows in China’s electricity transmission network and its driving forces. J. Clean. Prod. 2020, 242, 118336. [Google Scholar] [CrossRef]
  39. Zhang, Y.; Hou, S.; Liu, J.; Zheng, H.; Wang, J.; Zhang, C. Evolution of virtual water transfers in China’s provincial grids and its driving analysis. Energies 2020, 13, 328. [Google Scholar] [CrossRef]
  40. Zhang, C.; Fu, J.; Pu, Z. A study of the petroleum trade network of countries along “The Belt and Road Initiative”. J. Clean. Prod. 2019, 222, 593–605. [Google Scholar] [CrossRef]
  41. Zhu, X.; Guo, R.; Chen, B.; Zhang, J.; Hayat, T.; Alsaedi, A. Embodiment of virtual water of power generation in the electric power system in China. Appl. Energy 2015, 151, 345–354. [Google Scholar] [CrossRef]
  42. Zhang, Y.; Hou, S.; Liu, J.; Zheng, H.; Fang, J.; Wang, J. The impacts of interprovincial electricity transmission on China’s water crisis: Mitigate or aggravate. J. Clean. Prod. 2020, 266, 121696. [Google Scholar] [CrossRef]
  43. Barrat, A.; Barthelemy, M.; Pastor-Satorras, R.; Vespignani, A. The architecture of complex weighted networks. Proc. Natl. Acad. Sci. USA 2004, 101, 3747–3752. [Google Scholar] [CrossRef]
  44. Schultz, J.V.; Hubert, L. A nonparametric test for the correspondence between two proximity matrices. J. Educ. Stat. 1976, 1, 59–67. [Google Scholar] [CrossRef]
  45. Tamea, S.; Carr, J.; Laio, F.; Ridolfi, L. Drivers of the virtual water trade. Water Resour. Res. 2014, 50, 17–28. [Google Scholar] [CrossRef]
  46. Fracasso, A. A gravity model of virtual water trade. Ecol. Econ. 2014, 108, 215–228. [Google Scholar] [CrossRef]
  47. Han, Y.; Xing, W.; Hao, H.; Du, X.; Liu, C. Interprovincial Metal and GHG Transfers Embodied in Electricity Transmission across China: Trends and Driving Factors. Sustainability 2022, 14, 8898. [Google Scholar] [CrossRef]
  48. Zhao, X.; Li, Y.; Yang, H.; Liu, W.; Tillotson, M.; Guan, D.; Yi, Y.; Wang, H. Measuring scarce water saving from interregional virtual water flows in China. Environ. Res. Lett. 2018, 13, 054012. [Google Scholar] [CrossRef]
  49. Zhao, D.; Hubacek, K.; Feng, K.; Sun, L.; Liu, J. Explaining virtual water trade: A spatial-temporal analysis of the comparative advantage of land, labor and water in China. Water Res. 2019, 153, 304–314. [Google Scholar] [CrossRef]
  50. Afkhami, M.; Bassetti, T.; Ghoddusi, H.; Pavesi, F. Virtual Water Trade: The Implications of Capital Scarcity. 2020; 3166874. Available online: https://papers.ssrn.com/sol3/papers.cfm?abstract_id=3166874 (accessed on 12 November 2023).
  51. Pfister, S.; Koehler, A.; Hellweg, S. Assessing the environmental impacts of freshwater consumption in LCA. Environ. Sci. Technol. 2009, 43, 4098–4104. [Google Scholar] [CrossRef] [PubMed]
  52. Pfister, S.; Saner, D.; Koehler, A. The environmental relevance of freshwater consumption in global power production. Int. J. Life Cycle Assess. 2011, 16, 580–591. [Google Scholar] [CrossRef]
  53. Wang, L.; Wang, Y.; Lee, L.-C. Life cycle water consumption embodied in inter-provincial electricity transmission in China. J. Clean. Prod. 2020, 269, 122455. [Google Scholar] [CrossRef]
  54. Editorial Board. China Electric Power Yearbook; Electric Power Press: Beijing, China, 2006. [Google Scholar]
  55. Editorial Board. China Electric Power Yearbook; Electric Power Press: Beijing, China, 2007. [Google Scholar]
  56. Editorial Board. China Electric Power Yearbook; Electric Power Press: Beijing, China, 2008. [Google Scholar]
  57. Editorial Board. China Electric Power Yearbook; Electric Power Press: Beijing, China, 2009. [Google Scholar]
  58. Editorial Board. China Electric Power Yearbook; Electric Power Press: Beijing, China, 2010. [Google Scholar]
  59. Editorial Board. China Electric Power Yearbook; Electric Power Press: Beijing, China, 2011. [Google Scholar]
  60. Editorial Board. China Electric Power Yearbook; Electric Power Press: Beijing, China, 2012. [Google Scholar]
  61. Editorial Board. China Electric Power Yearbook; Electric Power Press: Beijing, China, 2013. [Google Scholar]
  62. Editorial Board. China Electric Power Yearbook; Electric Power Press: Beijing, China, 2014. [Google Scholar]
  63. Editorial Board. China Electric Power Yearbook; Electric Power Press: Beijing, China, 2015. [Google Scholar]
  64. Editorial Board. China Electric Power Yearbook; Electric Power Press: Beijing, China, 2016. [Google Scholar]
  65. Editorial Board. China Electric Power Yearbook; Electric Power Press: Beijing, China, 2017. [Google Scholar]
  66. Editorial Board. China Electric Power Yearbook; Electric Power Press: Beijing, China, 2018. [Google Scholar]
  67. Editorial Board. China Electric Power Yearbook; Electric Power Press: Beijing, China, 2019. [Google Scholar]
  68. Editorial Board. China Electric Power Yearbook; Electric Power Press: Beijing, China, 2020. [Google Scholar]
  69. China Electricity Council. Annual Compilation of Statistics of Power Industry; China Electricity Council: Beijing, China, 2006. [Google Scholar]
  70. China Electricity Council. Annual Compilation of Statistics of Power Industry; China Electricity Council: Beijing, China, 2007. [Google Scholar]
  71. China Electricity Council. Annual Compilation of Statistics of Power Industry; China Electricity Council: Beijing, China, 2008. [Google Scholar]
  72. China Electricity Council. Annual Compilation of Statistics of Power Industry; China Electricity Council: Beijing, China, 2009. [Google Scholar]
  73. China Electricity Council. Annual Compilation of Statistics of Power Industry; China Electricity Council: Beijing, China, 2010. [Google Scholar]
  74. China Electricity Council. Annual Compilation of Statistics of Power Industry; China Electricity Council: Beijing, China, 2011. [Google Scholar]
  75. China Electricity Council. Annual Compilation of Statistics of Power Industry; China Electricity Council: Beijing, China, 2012. [Google Scholar]
  76. China Electricity Council. Annual Compilation of Statistics of Power Industry; China Electricity Council: Beijing, China, 2013. [Google Scholar]
  77. China Electricity Council. Annual Compilation of Statistics of Power Industry; China Electricity Council: Beijing, China, 2014. [Google Scholar]
  78. China Electricity Council. Annual Compilation of Statistics of Power Industry; China Electricity Council: Beijing, China, 2015. [Google Scholar]
  79. China Electricity Council. Annual Compilation of Statistics of Power Industry; China Electricity Council: Beijing, China, 2016. [Google Scholar]
  80. China Electricity Council. Annual Compilation of Statistics of Power Industry; China Electricity Council: Beijing, China, 2017. [Google Scholar]
  81. China Electricity Council. Annual Compilation of Statistics of Power Industry; China Electricity Council: Beijing, China, 2018. [Google Scholar]
  82. China Electricity Council. Annual Compilation of Statistics of Power Industry; China Electricity Council: Beijing, China, 2019. [Google Scholar]
  83. China Electricity Council. Annual Compilation of Statistics of Power Industry; China Electricity Council: Beijing, China, 2020. [Google Scholar]
  84. National Bureau of Statistics. China Statistical Yearbook; China Statistics Press: Beijing, China, 2006.
  85. National Bureau of Statistics. China Statistical Yearbook; China Statistics Press: Beijing, China, 2007.
  86. National Bureau of Statistics. China Statistical Yearbook; China Statistics Press: Beijing, China, 2008.
  87. National Bureau of Statistics. China Statistical Yearbook; China Statistics Press: Beijing, China, 2009.
  88. National Bureau of Statistics. China Statistical Yearbook; China Statistics Press: Beijing, China, 2010.
  89. National Bureau of Statistics. China Statistical Yearbook; China Statistics Press: Beijing, China, 2011.
  90. National Bureau of Statistics. China Statistical Yearbook; China Statistics Press: Beijing, China, 2012.
  91. National Bureau of Statistics. China Statistical Yearbook; China Statistics Press: Beijing, China, 2013.
  92. National Bureau of Statistics. China Statistical Yearbook; China Statistics Press: Beijing, China, 2014.
  93. National Bureau of Statistics. China Statistical Yearbook; China Statistics Press: Beijing, China, 2015.
  94. National Bureau of Statistics. China Statistical Yearbook; China Statistics Press: Beijing, China, 2016.
  95. National Bureau of Statistics. China Statistical Yearbook; China Statistics Press: Beijing, China, 2017.
  96. National Bureau of Statistics. China Statistical Yearbook; China Statistics Press: Beijing, China, 2018.
  97. National Bureau of Statistics. China Statistical Yearbook; China Statistics Press: Beijing, China, 2019.
  98. National Bureau of Statistics. China Statistical Yearbook; China Statistics Press: Beijing, China, 2020.
  99. National Bureau of Statistics. China Environmental Statistical Yearbook; China Statistics Press: Beijing, China, 2006.
  100. National Bureau of Statistics. China Environmental Statistical Yearbook; China Statistics Press: Beijing, China, 2007.
  101. National Bureau of Statistics. China Environmental Statistical Yearbook; China Statistics Press: Beijing, China, 2008.
  102. National Bureau of Statistics. China Environmental Statistical Yearbook; China Statistics Press: Beijing, China, 2009.
  103. National Bureau of Statistics. China Environmental Statistical Yearbook; China Statistics Press: Beijing, China, 2010.
  104. National Bureau of Statistics. China Environmental Statistical Yearbook; China Statistics Press: Beijing, China, 2011.
  105. National Bureau of Statistics. China Environmental Statistical Yearbook; China Statistics Press: Beijing, China, 2012.
  106. National Bureau of Statistics. China Environmental Statistical Yearbook; China Statistics Press: Beijing, China, 2013.
  107. National Bureau of Statistics. China Environmental Statistical Yearbook; China Statistics Press: Beijing, China, 2014.
  108. National Bureau of Statistics. China Environmental Statistical Yearbook; China Statistics Press: Beijing, China, 2015.
  109. National Bureau of Statistics. China Environmental Statistical Yearbook; China Statistics Press: Beijing, China, 2016.
  110. National Bureau of Statistics. China Environmental Statistical Yearbook; China Statistics Press: Beijing, China, 2017.
  111. National Bureau of Statistics. China Environmental Statistical Yearbook; China Statistics Press: Beijing, China, 2018.
  112. National Bureau of Statistics. China Environmental Statistical Yearbook; China Statistics Press: Beijing, China, 2019.
  113. National Bureau of Statistics. China Environmental Statistical Yearbook; China Statistics Press: Beijing, China, 2020.
  114. Liu, J.; Zhao, D.; Gerbens-Leenes, P.; Guan, D. China’s rising hydropower demand challenges water sector. Sci. Rep. 2015, 5, 11446. [Google Scholar] [CrossRef] [PubMed]
  115. Wang, L.; Van Fan, Y.; Jiang, P.; Varbanov, P.S.; Klemes, J.J. Virtual water and CO2 emission footprints embodied in power trade: EU-27. Energy Policy 2021, 155, 112348. [Google Scholar] [CrossRef]
  116. Distefano, T.; Riccaboni, M.; Marin, G. Systemic risk in the global water input-output network. Water Resour. Econ. 2018, 23, 28–52. [Google Scholar] [CrossRef]
  117. Song, J.; Yin, Y.; Xu, H.; Wang, Y.; Wu, P.; Sun, S. Drivers of domestic grain virtual water flow: A study for China. Agric. Water Manag. 2020, 239, 106175. [Google Scholar] [CrossRef]
  118. Jin, Y.; Tang, X.; Feng, C.; Höök, M. Energy and water conservation synergy in China: 2007–2012. Resour. Conserv. Recycl. 2017, 127, 206–215. [Google Scholar] [CrossRef]
Figure 1. The overall method flow chart of this study.
Sustainability 15 15977 g001
Figure 2. Diagram of the node flow model.
Sustainability 15 15977 g002
Figure 3. Distribution of electricity-related water consumption and average WSI at the provincial level in 2020. The circles in the legend represent the relative size of total water consumption of five electricity technologies.
Sustainability 15 15977 g003
Figure 4. Power generation structure and electricity water footprint of each province in (a) 2006, (b) 2010, (c) 2015, (d) 2020.
Sustainability 15 15977 g004
Figure 5. Basic characteristics of virtual water transfer networks. (1) Total volume of virtual water flows over time, (2) Average network degree (mean trade partners) over time.
Sustainability 15 15977 g005
Figure 6. Interprovincial virtual water transfer network of power trade in: (a) 2006, (b) 2010, (c) 2015, (d) 2020 (unit: 104 m3). The ribbon directly connected to the inner ring indicates exported virtual water, while the ribbon with a gap in the inner ring indicates imported virtual water.
Sustainability 15 15977 g006
Figure 7. The spatial flow pattern of virtual water in the electricity trade in 2020 (virtual water transfer within the power sub-grid is not represented).
Sustainability 15 15977 g007
Figure 8. Cumulative distribution of virtual water networks of interprovincial electricity trade in China from 2006 to 2020. The two-dimensional graph is projected from the three-dimensional graph of: (a) Out-degree of nodes, (b) In-degree of nodes, (c) Out-strength of nodes, (d) In-strength of nodes.
Sustainability 15 15977 g008
Figure 9. Power law relationship between node out-strength and node out-degree in: (a) 2006, (b) 2010, (c) 2015, (d) 2020; and power law relationship between node in-strength and node in-degree in: (e) 2006, (f) 2010, (g) 2015, (h) 2020.
Sustainability 15 15977 g009
Figure 10. Degree correlation of the virtual water network. (a) Out–out degree correlation. (b) Out–in degree correlation. (c) In–out degree correlation. (d) In–in degree correlation.
Sustainability 15 15977 g010
Table 1. Definitions and abbreviations of influencing factors.
Influencing FactorVariableDefinitionAbbreviation
Provincial difference in power generation characteristicPower generation levelTotal power generationPG
Power generation structureProportion of clean energy generation to total power generationGS
Feed-in tariffAverage feed-in tariff for different fuel types of power generation enterprisesFT
Provincial difference in power consumption characteristicElectricity consumption levelTotal electricity consumptionEC
Economic levelGDP per capitaG
Urbanization rateThe proportion of urban population to total populationU
Grid connectionGrid connectionIf there is a grid connection between provinces, the matrix element is 1, otherwise it is 0GC
Provincial difference in regional water resource characteristicWater stress levelWater stress indexWSI
Water resources endowmentAvailable water resources per capitaWRE
Table 2. Results of the QAP regression analysis.
Influencing Factors20062008201020122014201620182020
GS−0.332657 **−0.545052 ***−0.436939 **−0.478496 ***−0.427853 ***−0.248762 **−0.211531 **−0.197434 **
(0.030)(0.004)(0.012)(0.005)(0.003)(0.043)(0.048)(0.049)
FT0.061977 *0.0506300.0579330.067415 *0.070265 **0.068169 **0.062194 *0.062825 *
(0.058)(0.193)(0.112)(0.076)(0.046)(0.044)(0.056)(0.055)
EC0.379534 ***0.714432 ***0.499279 ***0.537274 ***0.538273 ***0.360563 ***0.312596 ***0.260871 ***
(0.003)(0.000)(0.001)(0.000)(0.000)(0.003)(0.003)(0.004)
G0.112497 *0.148755 *0.117264 *0.104144 *0.138066 *0.132860 *0.114162 *0.080671 *
(0.071)(0.065)(0.070)(0.086)(0.063)(0.062)(0.070)(0.082)
U0.071545 *0.121849 *0.104692 *0.112419 *0.138432 *0.139316 *0.132733 *0.107902 *
(0.086)(0.077)(0.086)(0.071)(0.063)(0.064)(0.061)(0.083)
GC0.645077 ***0.570127 ***0.629303 ***0.618124 ***0.589643 ***0.549056 ***0.559202 ***0.608854 ***
(0.000)(0.000)(0.000)(0.000)(0.000)(0.000)(0.000)(0.000)
WSI0.0075890.0076080.0076070.0076230.0076120.0075670.0075460.007512
(0.439)(0.433)(0.433)(0.419)(0.421)(0.441)(0.443)(0.447)
Observations870870870870870870870870
R20.4360.3740.4180.4090.4000.3610.3560.400
Adj-R20.4320.3690.4140.4050.3960.3570.3510.396
Notes: * Significance < 0.1 at the 10% level; ** Significance < 0.05 at the 5% level; *** significance < 0.01 at the 1% level.
Disclaimer/Publisher’s Note: The statements, opinions and data contained in all publications are solely those of the individual author(s) and contributor(s) and not of MDPI and/or the editor(s). MDPI and/or the editor(s) disclaim responsibility for any injury to people or property resulting from any ideas, methods, instructions or products referred to in the content.

