Article

Improvement of the Soil and Water Assessment Tool Model and Its Application in a Typical Glacial Runoff Watershed: A Case Study of the Qarqan River Basin, China

1
School of Water Resources and Hydropower Engineering, North China Electric Power University, Beijing 102206, China
2
Nanjing Institute of Geography and Limnology, Chinese Academy of Sciences, Nanjing 210008, China
*
Author to whom correspondence should be addressed.
Sustainability 2023, 15(22), 16046; https://doi.org/10.3390/su152216046
Submission received: 20 August 2023 / Revised: 11 October 2023 / Accepted: 8 November 2023 / Published: 17 November 2023

Abstract

:
The composition of runoff in the basins located in the arid region of Northwest China is complex. How to better simulate and analyze the hydrological process and runoff situation of the basin through hydrological models is the key to the effective management of the regional water resources. This study focused on the Qarqan River Basin in Xinjiang, which is a typical river originating from glaciers and crucial for maintaining the oasis ecology in the downstream Tarim River. Based on the original SWAT model, a SWAT-Gla model containing a new glacier module was constructed according to the characteristics of the basin. After simulating, parameter calibration, and verification of the models, it was found that during the calibration period (1975–2009) and verification period (2010–2019), the R2, NSE, and PBIAS results of the SWAT-Gla model were much better than the original SWAT model. Moreover, SWAT-Gla could also simulate the runoff much better, especially in the peak and recession parts of the hydrograph compared with the original SWAT model. It was found that SWAT-Gla could better describe the runoff process in the basin where glacier recharge was the main component of runoff. Further, the analysis revealed that over the past 50 years, glacier and snowmelt water contributed to approximately 80% of the total basin recharge, which predominantly occurred from March to September. The volume of glacier meltwater exhibited a strong correlation with temperature, with both demonstrating an upward trend. The simulation found that in terms of groundwater, the groundwater recharge in the Qarqan River was relatively stable, stabilizing at 13% over the past 30 years, and groundwater recharge was mainly distributed in spring and summer, accounting for about 95% in total. Overall, we observed an increasing trend in the replenishment of glacial meltwater in both the surface runoff and groundwater in the basin. Therefore, it is essential to pay more attention to the future changes in water resources in the basin to ensure the sustainable development of water resources.

1. Introduction

Hydrological models serve as crucial tools for analyzing hydrological processes, planning regional water use, and meeting basin demands [1,2,3,4,5,6]. In recent years, the Soil and Water Assessment Tool (SWAT), which is a hydrological model developed by the United States Agricultural Research Center, has gained global recognition for its effectiveness in long-term runoff simulation in large- and medium-sized basins. It has been extensively researched in different regions, such as the Yangtze River Basin and the Yellow River Basin in China [7,8,9]. However, since the SWAT model itself does not involve the process of glacier melting, most of the recent research and application of the SWAT model by scholars has mainly focused on the role of precipitation-induced runoff, with less emphasis on other processes, particularly the principle and process of glacier meltwater recharge runoff [10].
As a result, its application in basins with a significant component of glacier melting runoff is relatively limited, and the standalone simulation performance of SWAT on glacier meltwater recharge runoff is subpar [11,12,13,14].
Due to its special geographical position and climatic conditions, the river basins in the arid region of Northwest China primarily receive their runoff from both precipitation and the melting of glaciers and snow. The latter, in fact, often plays a more dominant role [15,16]. For instance, in the Yarkant River Basin in Xinjiang, the contribution of glaciers and snowmelt to the basin’s runoff exceeds 70% [17,18,19]. In the context of global warming, the increase in temperature is becoming more obvious, and the contribution of glacier meltwater to runoff is also becoming apparent. At the same time, research showed that the change in the size and volume of snowfall and glaciers in the basin will also cause a change in the hydrological regime in the region, such as the Qarqan River Basin located at the northern foot of the Kunlun Mountains, which has been in a state of glacial retreat since the late 1990s, with the glacial area shrinking at an average rate of 0.9 km2 per year. This has resulted in the basin’s annual maximum flow and total flood volume both demonstrating an upward trend [11].
The Qarqan River is located in the southeastern part of the Tarim Basin and is one of the nine source rivers of the Tarim River, which is the longest inland river in China. It is not only an important part of the Tarim River Basin ecosystem but also one of the lifelines of the oasis downstream of the Tarim River, maintaining the green corridor in the eastern part of the Taklamakan Desert, together with the Tarim River. The Qarqan River is not only an important river for maintaining socio-economic development but also an important backup water source for the construction of the Qingxin (Golmud, Qinghai Province to Korla, Xinjiang) Railway and the development of potassium salt in Lop Nur. The stable water supply in the upper reaches of the basin not only ensures the ecological environment of the Altun Mountain National Nature Reserve and the social and economic stability of the oasis area in the middle reaches but also the cornerstone of the improvement of the ecological environment of the tail lake in the lower reaches and the continuous prosperity of the Silk Road Economic Belt. It is of great significance for the stability and development of remote minority areas.
However, the Qarqan River, as an important water resource supporting and guaranteeing the development of this region, is under severe strain due to climate change and excessive resource exploitation. Moreover, economic growth consistently escalates the volume of water consumption, where the shortage of water resources has become an important factor restricting the development of this region, and the difference between water supply and demand is very prominent [20,21,22,23,24]. Despite its importance, due to the remote geographical location, scarcity of sites, and the complex river runoff condition, there is currently less research and clarification on the composition of runoff in the Qarqan River Basin. Therefore, it is crucial to explore and analyze the composition and changes of runoff in the Qarqan River Basin for the rational use of regional water resources and ecological environment protection. When simulating the runoff of the Qarqan River Basin, due to its upper reaches originating from glaciers, it is necessary to focus on the important role of glacial meltwater in its runoff recharge in the basin. This study, therefore, aimed to develop a material-balanced glacial meltwater module based on the original SWAT model. This will enhance the simulation of the runoff process in the glacial meltwater area, enabling a more accurate analysis of the composition and changes of runoff in the basin from a physical perspective. The insights gleaned from this research will provide valuable information for the effective management of regional water resources and the protection of the ecological environment.
The Qarqan River, which is nestled in the southeastern region of the Tarim Basin, is one of the nine tributaries that feed into the Tarim River, which is China’s longest inland waterway. This river is not merely a geographical feature; it is a vital component of the Tarim River Basin ecosystem and a lifeline for the oasis downstream of the Tarim River. Together with the Tarim River, the Qarqan River sustains the verdant corridor in the eastern part of the Taklamakan Desert.

2. Materials and Methods

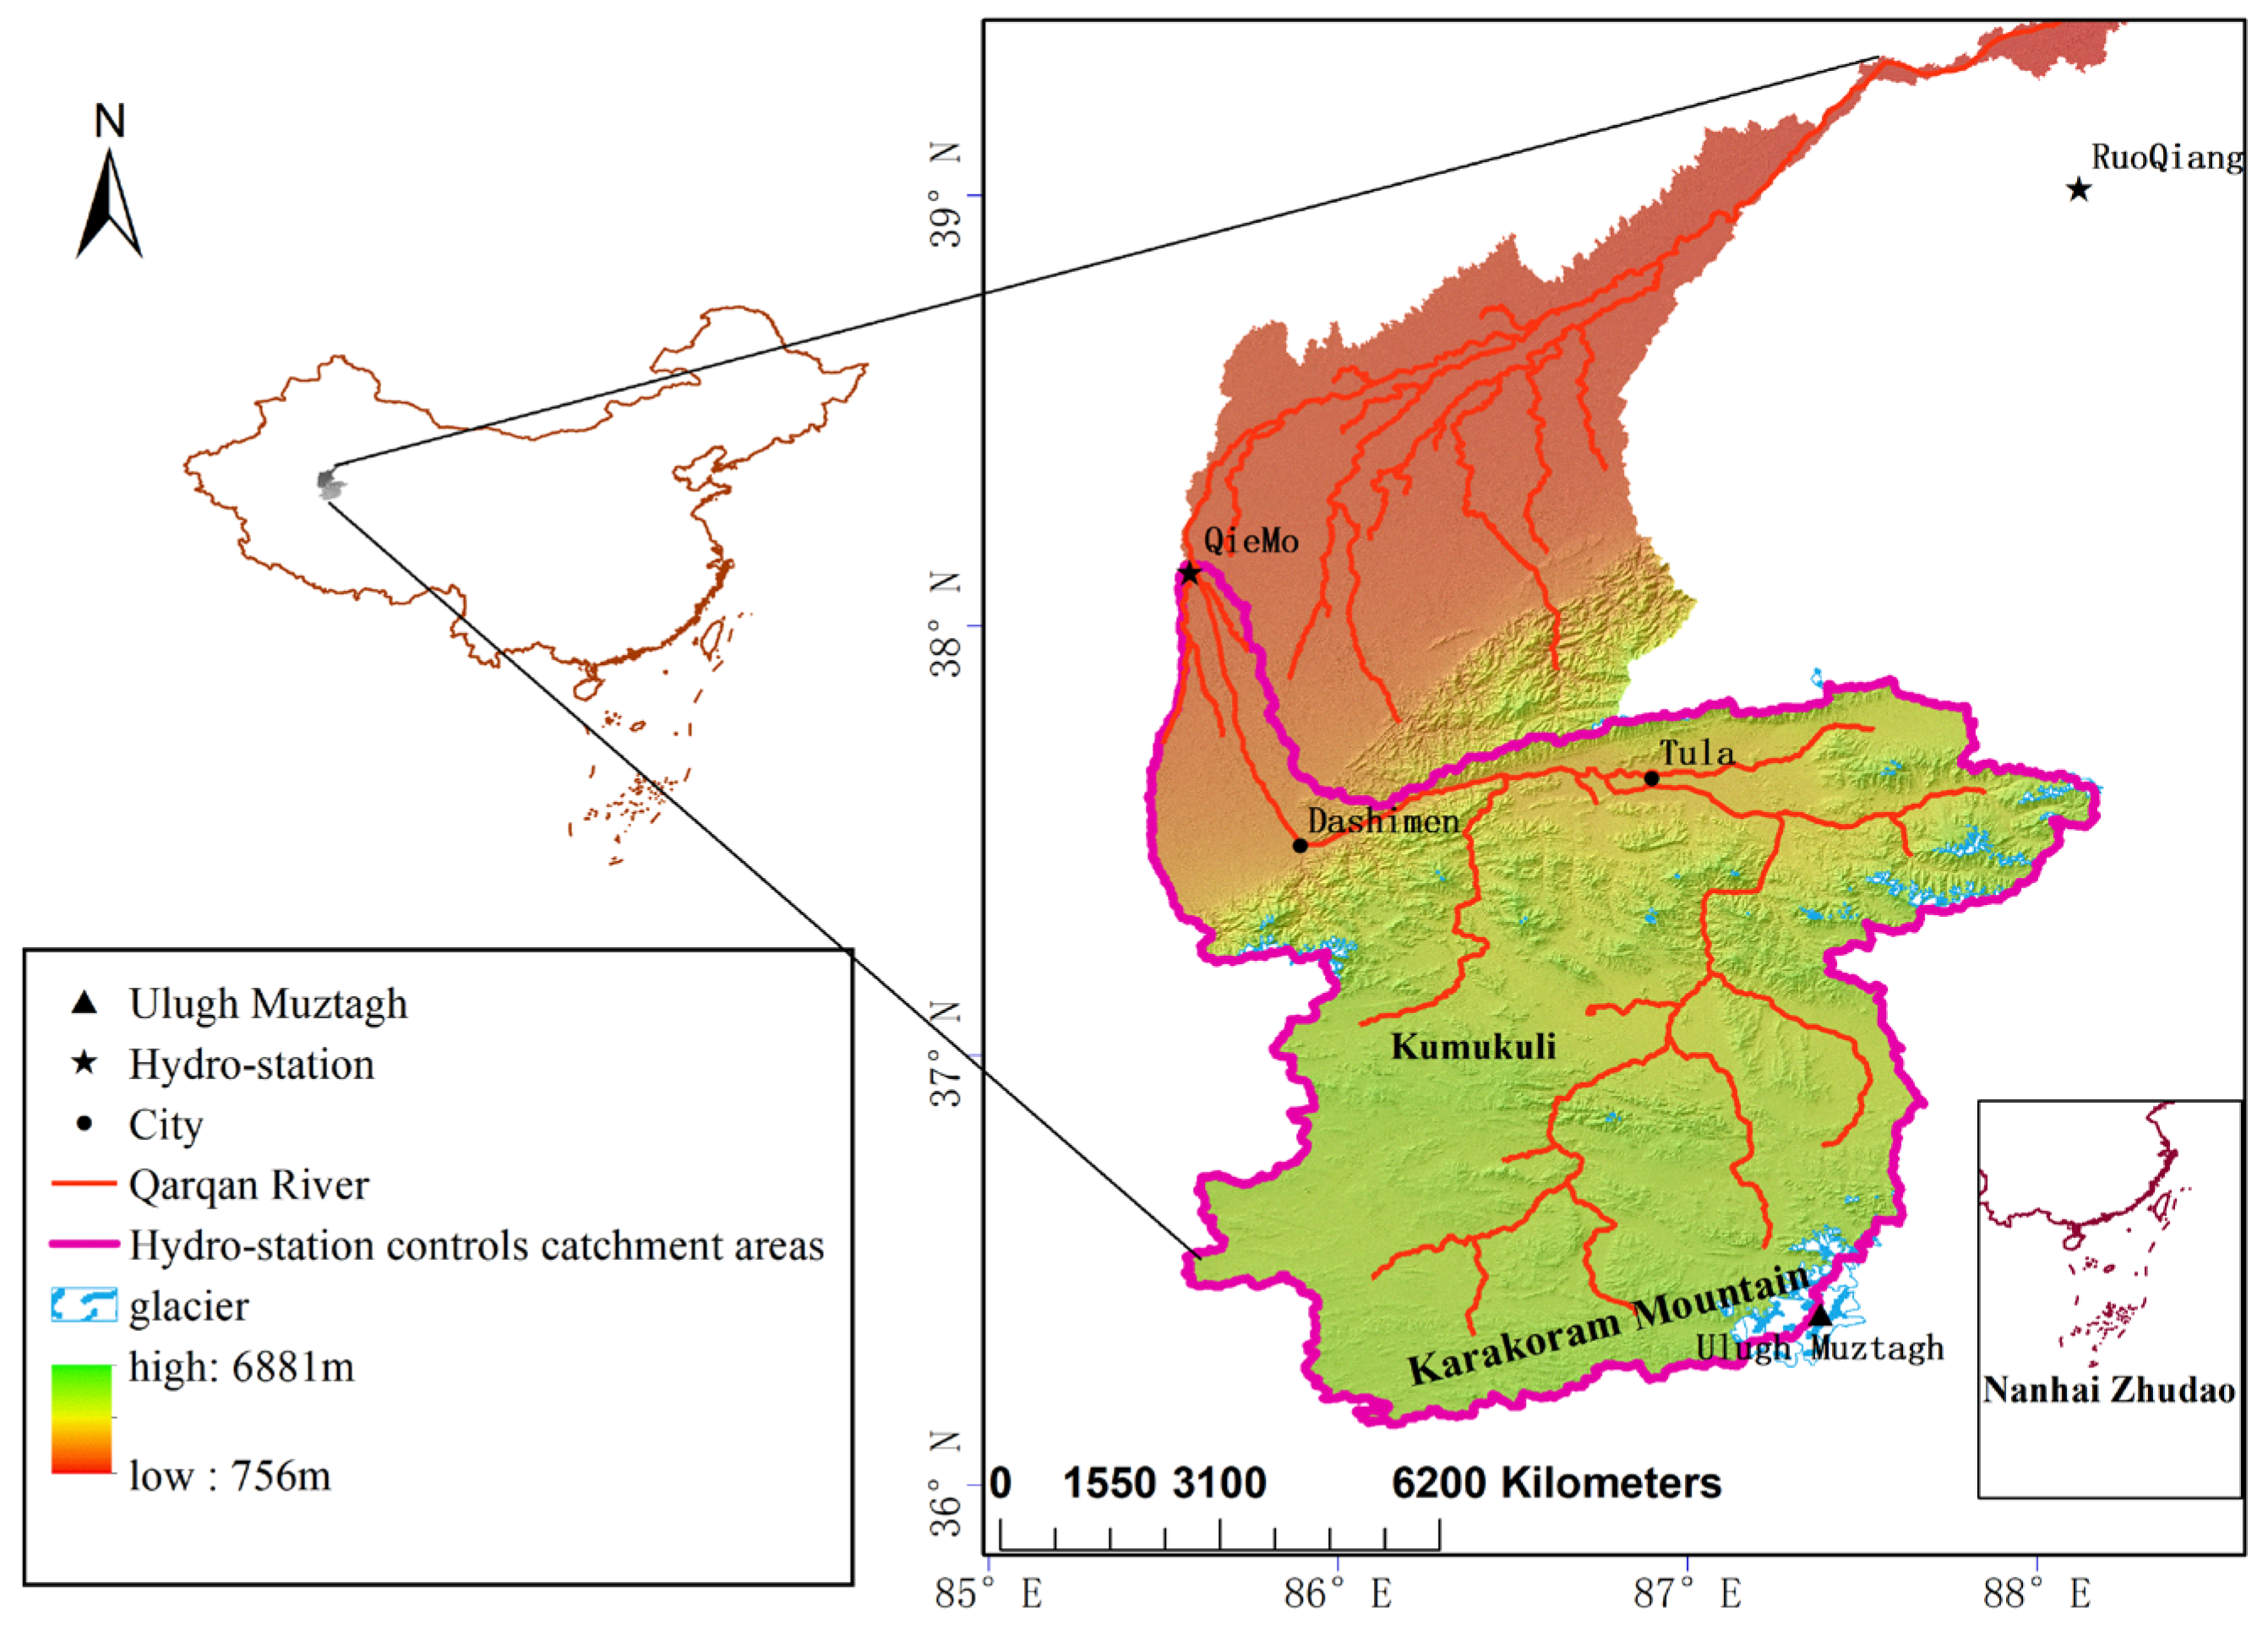
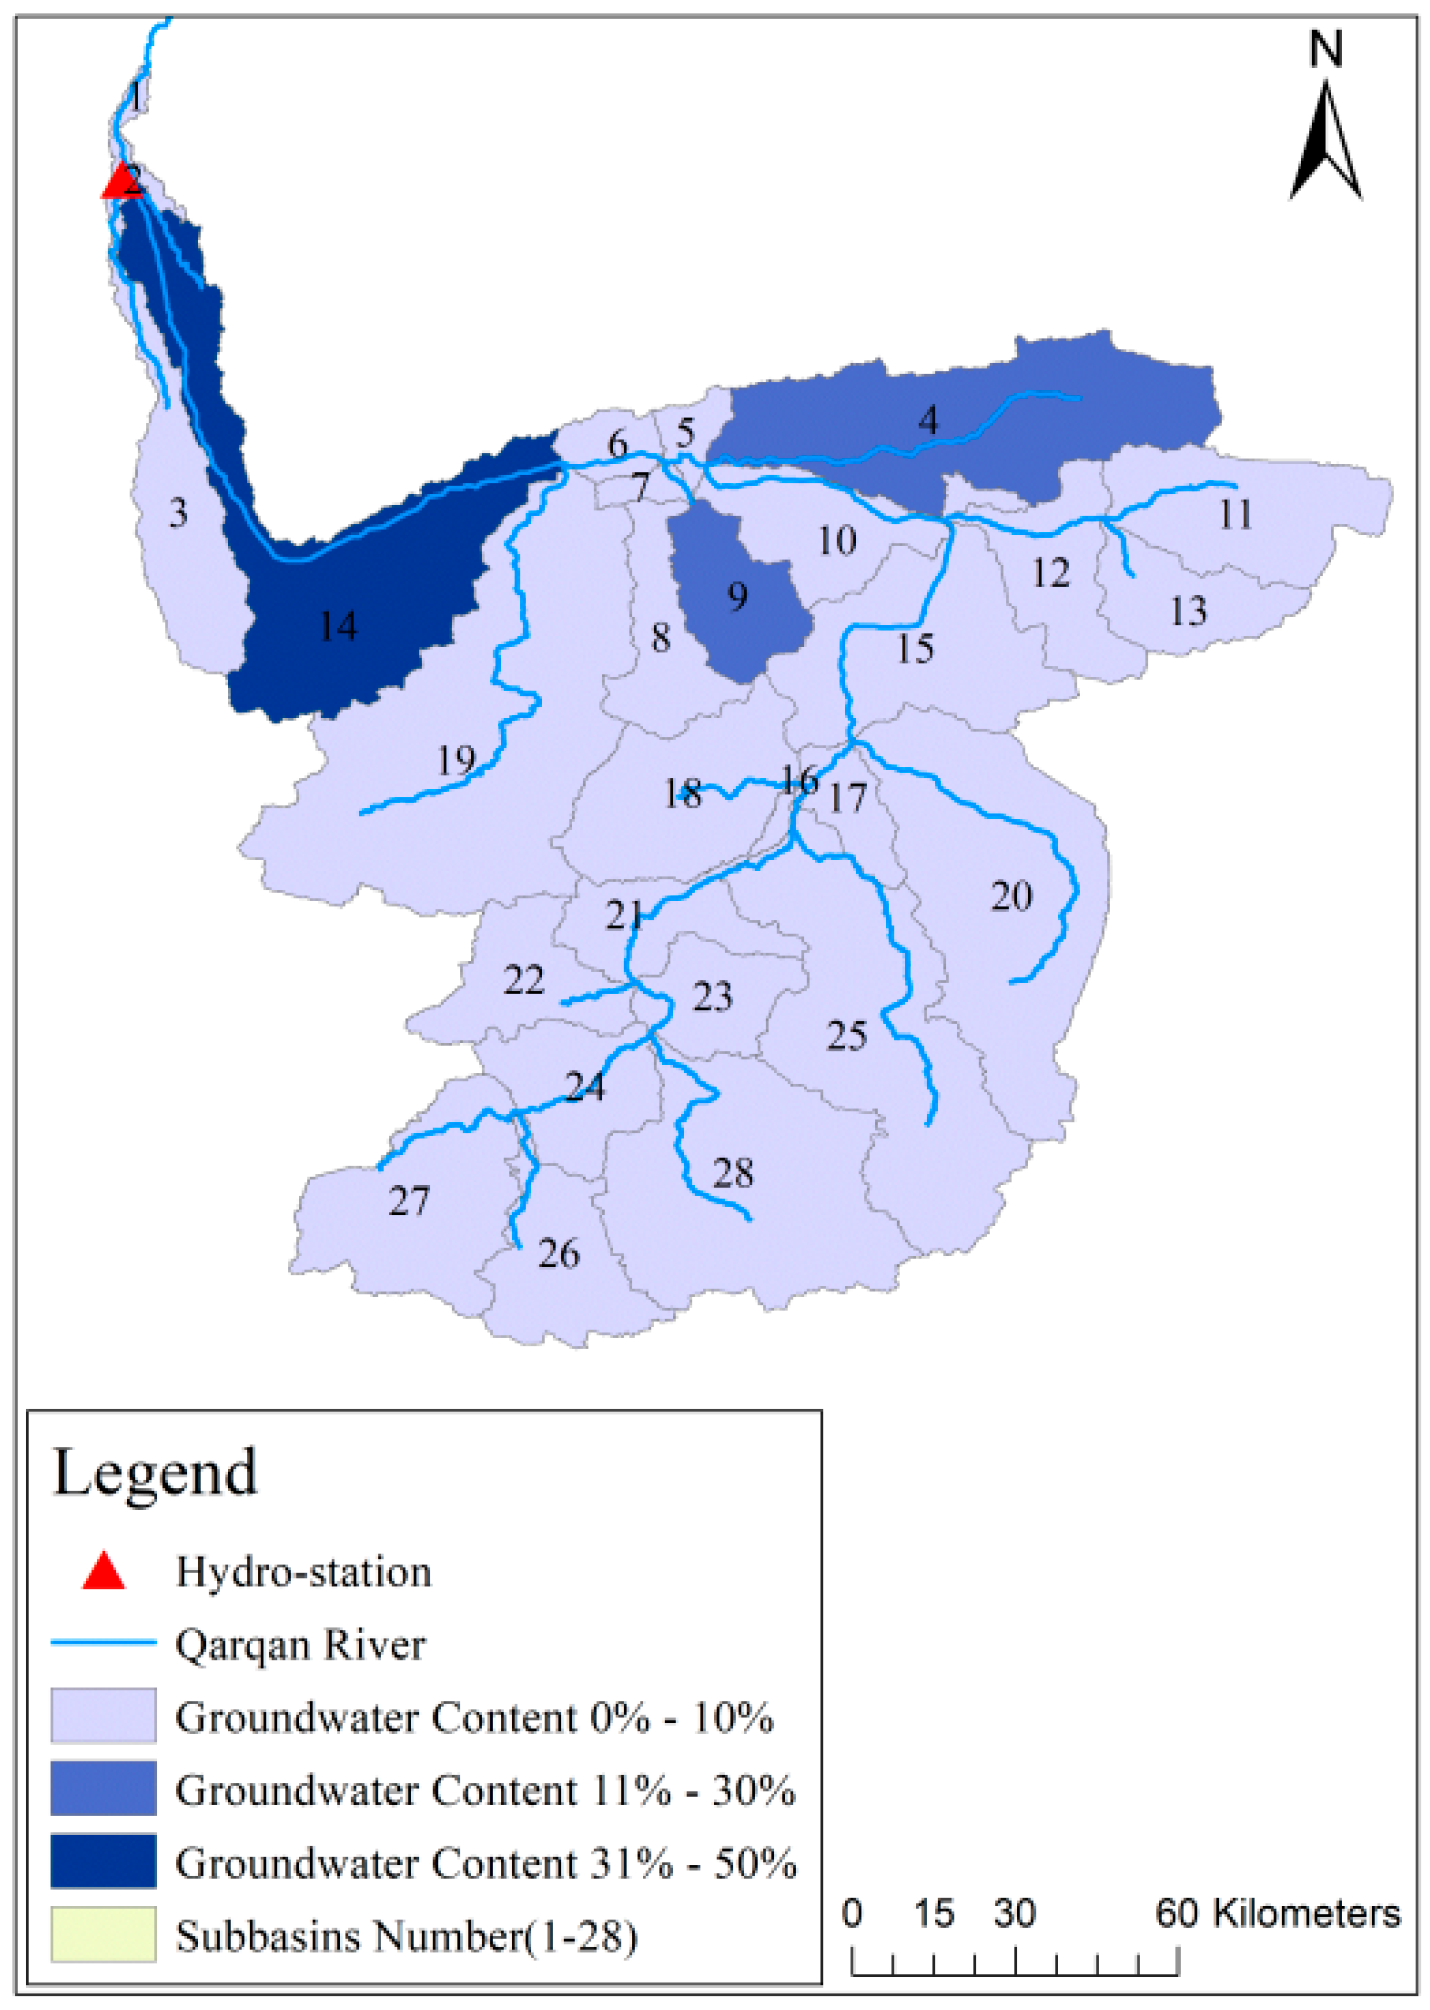
2.1. Study Area Overview

The Qarqan River Basin is located in Qiemo County, Bayingolin Mongol Autonomous Prefecture, Xinjiang, and is the largest river system in the Kunlun Mountains and the Altun Mountains. Geographically, the basin lies between 85°30′–87°15′ east longitude and 36°30′–39°15′ north latitude. The topography of the Qarqan River Basin is characterized by high elevations in the south and lower ones in the north. The river originates from the Muztagh Ata Peak on the north slope of the Kunlun Mountains, passes through Qiemo County, and finally ends in Taitema Lake. The mountainous section is about 353 km long, and the catchment area of the basin is about 25,000 square kilometers. There is only one hydrological station in the Qarqan River Basin, namely, the Qiemo Hydrological Station, with an annual precipitation of only 18.9 mm. Specifically, there are a total of 1330 glaciers that have developed in the basin, covering an area of about 1081.37 km2 (the percent of the catchment that is glacierized is around 4%). Studies showed that most of the runoff replenishment in the basin mainly relies on the snow and ice meltwater of glaciers from upstream. The water volume during the spring and summer flood season accounts for about 74% of the annual runoff, while the runoff during the dry season accounts for about 26%, making it a typical research area replenished by snow and ice meltwater [24]. The research area is shown in Figure 1. The main meteorological and hydrological characteristics of the Qarqan River Basin are similar to most of the basins in Xinjiang, such as a lack of precipitation; obvious changes in runoff in different seasons; and complex runoff composition, not only from precipitation but also glacier meltwater, snowmelt, groundwater recharge, etc. Therefore, studying and analyzing the hydrological processes in this area will further help in studying other basins in Xinjiang. At present, there is less research on the runoff in the Qarqan River Basin, and thus, this study took the Qarqan River Basin as the research object and constructed an improved SWAT model with the addition of a glacier meltwater module to simulate the runoff in the basin.

2.2. Data Materials

2.2.1. DEM

In this study, the DEM digital elevation data of the research area was downloaded through the Geospatial Data Cloud (http://www.gscloud.cn/ accessed on 20 August 2023). More specifically, the GDEMV2 30M resolution digital elevation dataset was selected, and GIS was used to convert the DEM data to the WGS_1984_UTM_Zone_45N geographic projection. The DEM elevation of the research area is shown in Figure 1.

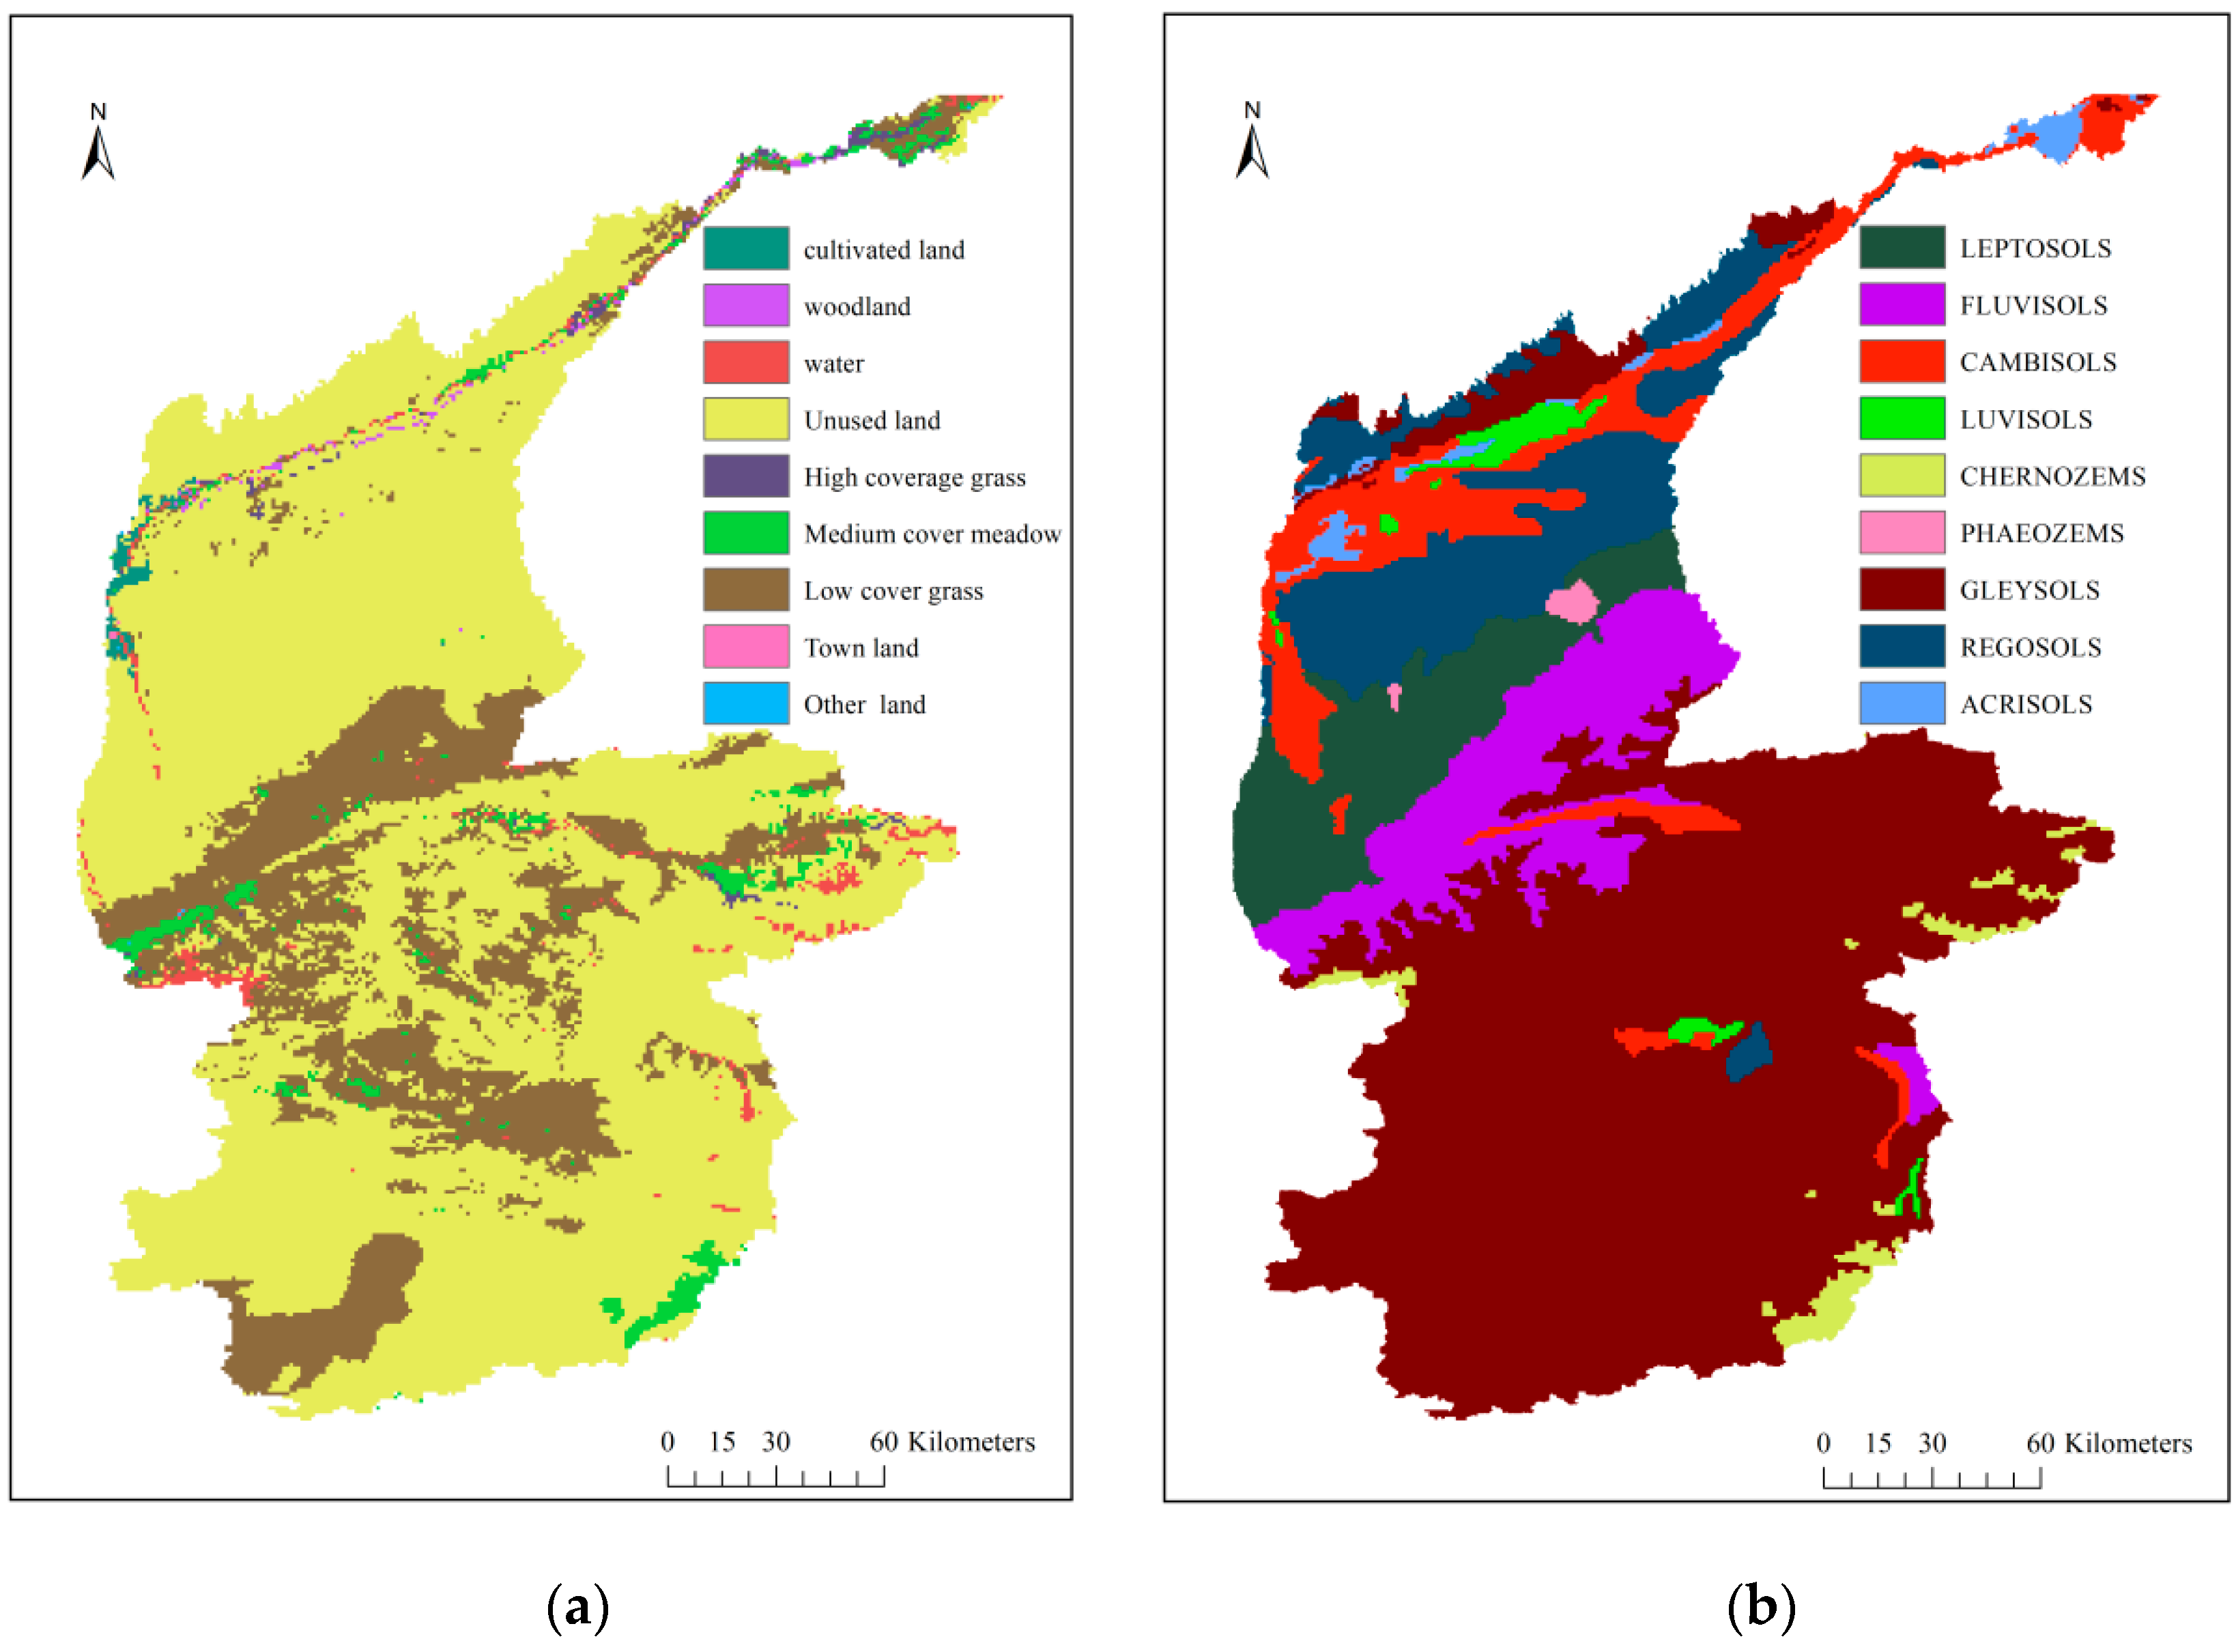
2.2.2. Land Use and Soil Data

This study used the remote sensing monitoring data of China’s current land use from the Resource and Environmental Science Data Center of the Chinese Academy of Sciences (http://www.resdc.cn/data.aspx?DATAID=184/ accessed on 20 August 2023). The land use data of the research area is shown in Figure 2a.
The soil data used in this study were selected and processed from the World Soil Database (Harmonized World Soil Database v1.2|FAO SOILS PORTAL|Food and Agriculture Organization of the United Nations). SPAW 6.02 software (SPAW (Soil-Plant-Air-Water)|Model Item|OpenGMS (njnu.edu.cn/ accessed on 20 August 2023)) was used here to calculate the soil parameters required by the SWAT model, and the soil database of the Qarqan River Basin was established as shown in Figure 2b.

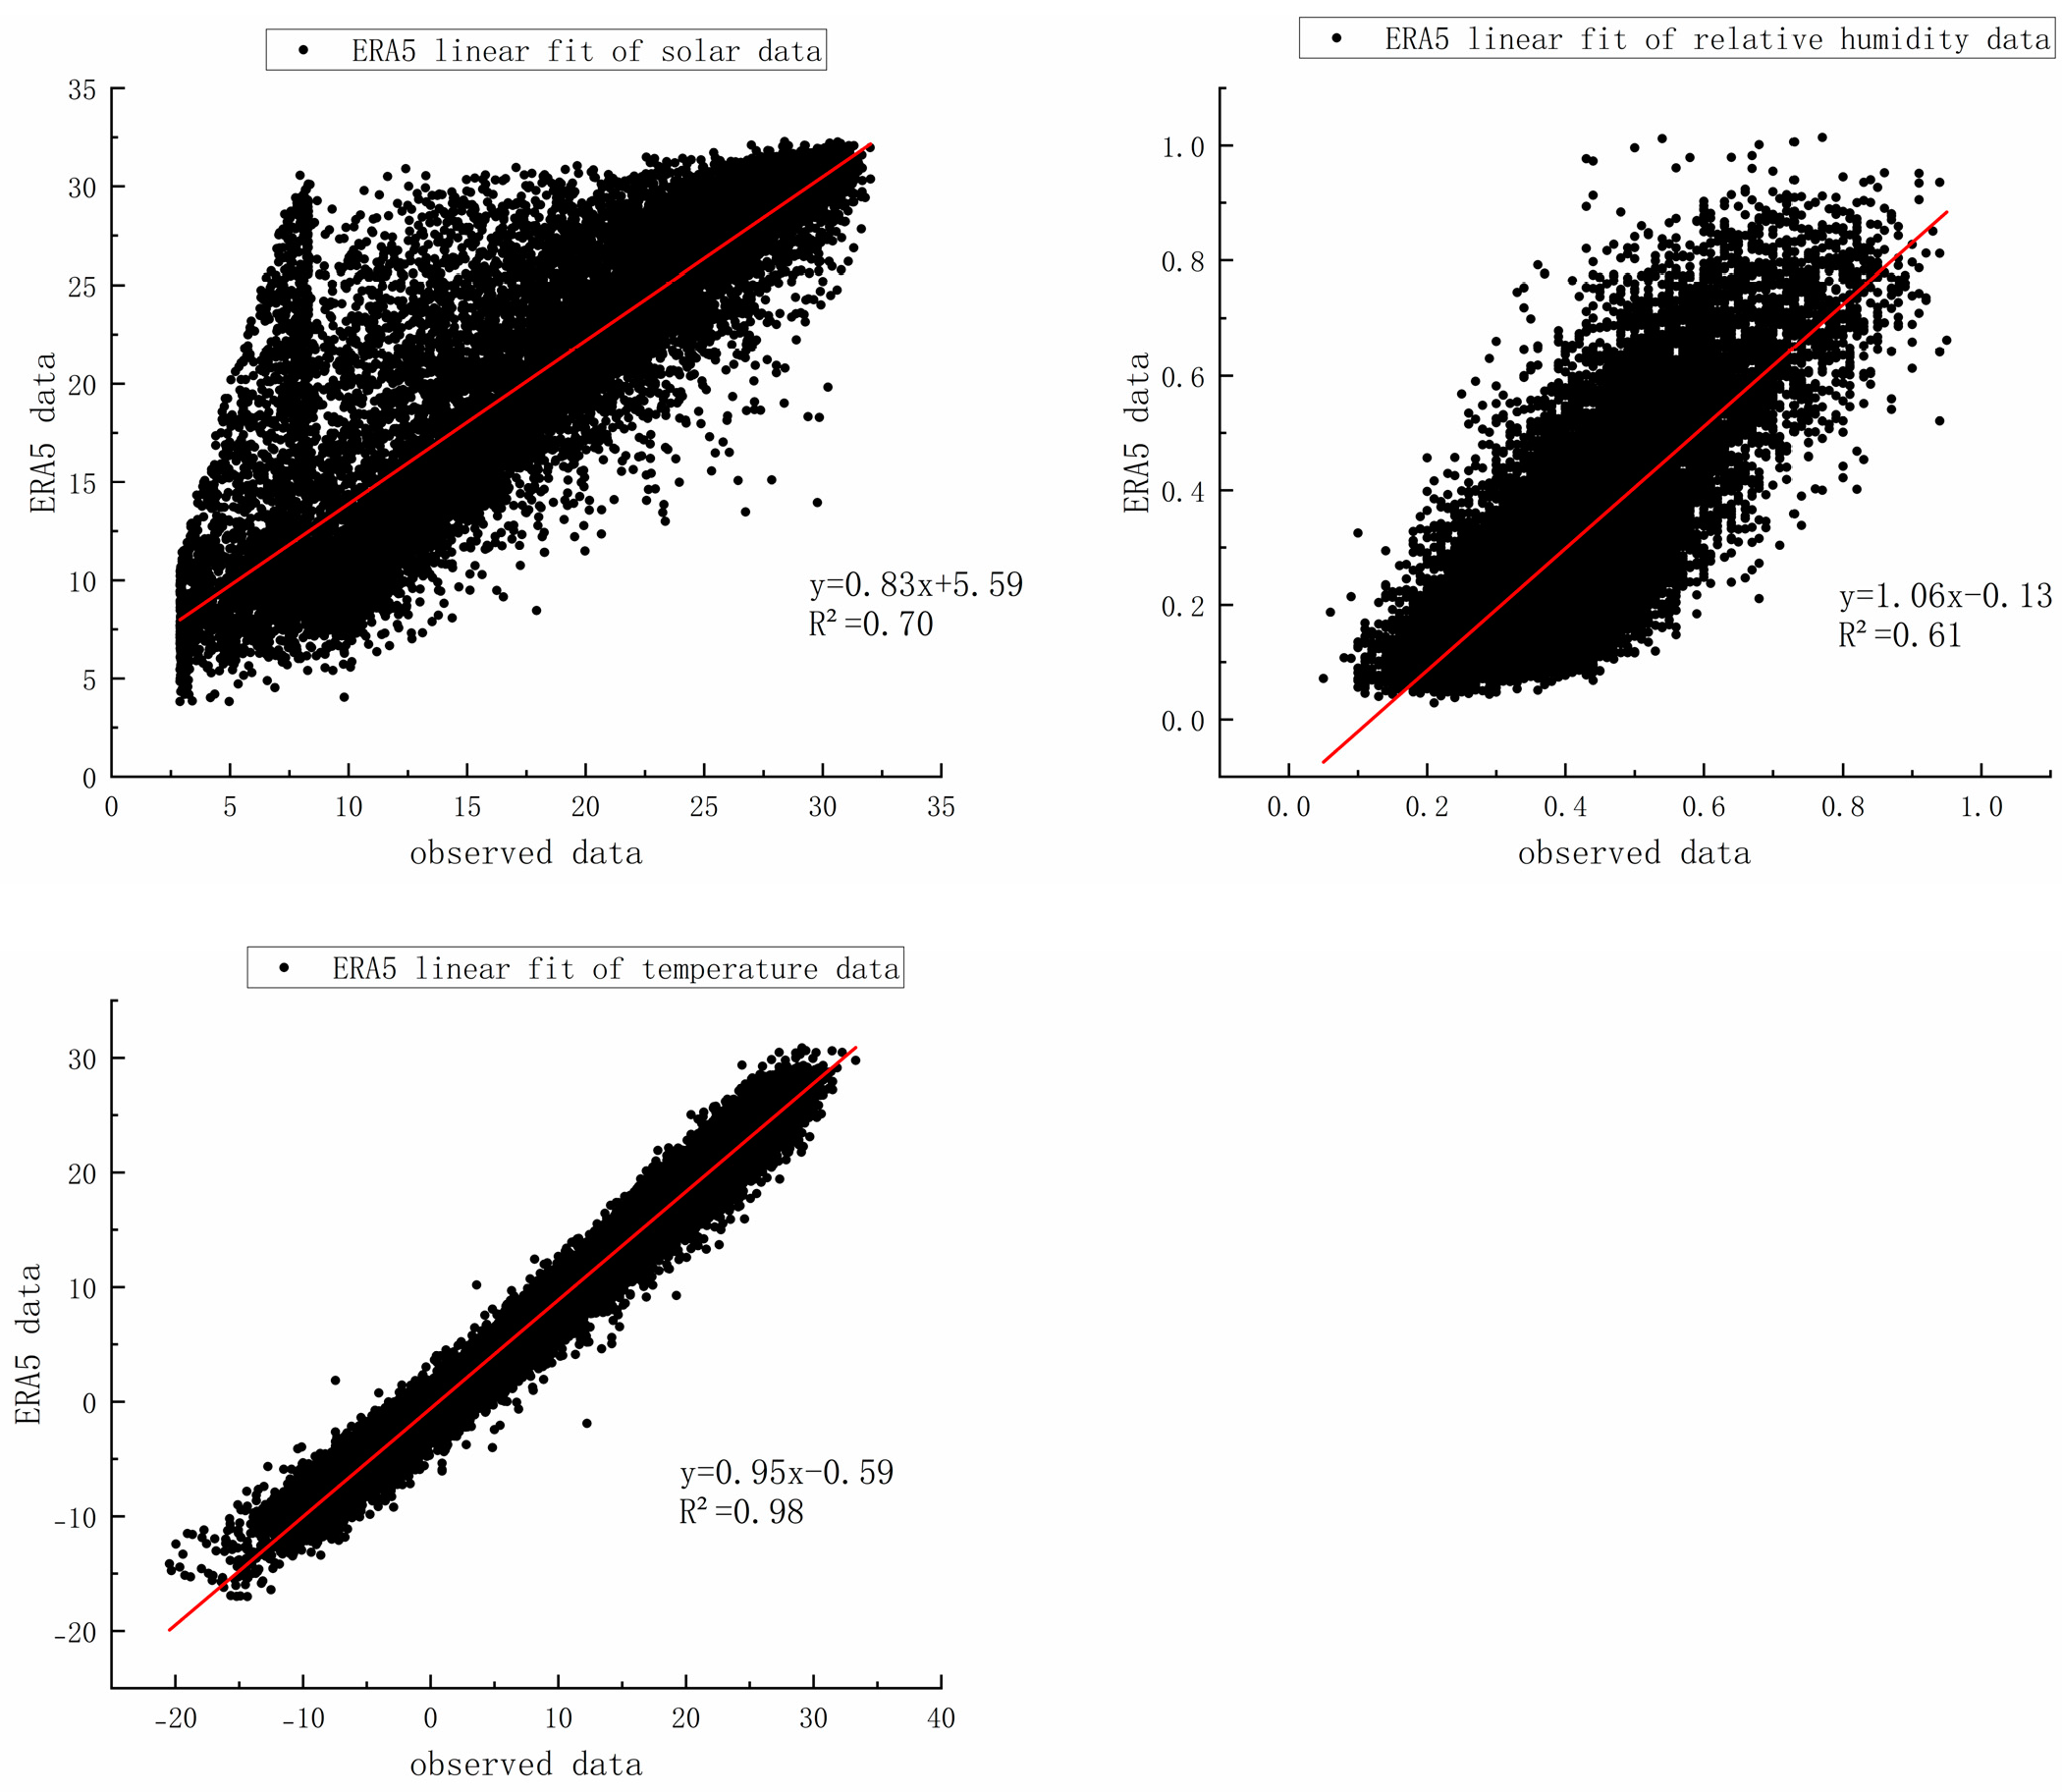
2.2.3. Meteorological Data

The hydrological and meteorological observation data of the Qarqan River Basin are relatively scarce. The only hydrological station in the basin with long-term observation data is the Qiemo Hydrological Station. Therefore, this study selected the observed daily precipitation and wind speed data from the Qiemo Hydrological Station from 1970 to 2019. The data was collected from the Chinese National Surface Meteorological Station Basic Meteorological Elements Daily Value Dataset (V3.0).
Since the model requires input data of temperature, solar radiation, and relative humidity, this study selected the ERA5-land reanalysis dataset provided by the European Centre for Medium-Range Weather Forecasts (ECWMF). The ERA5 dataset has been extensively employed in runoff simulations and has demonstrated commendable performances, as evidenced by numerous studies [25,26,27,28,29,30,31].
The spatial resolution of the ERA5 dataset is 0.1° × 0.1°, and there are a total of 462 grid points within the Qarqan River Basin. A comparison between the observed solar radiation, relative humidity, and temperature data from the Qiemo station and the corresponding meteorological data from the proximate ERA5 data revealed a strong correlation between them. This correlation was further underscored by the linear correlation plots of solar radiation, relative humidity, and temperature between the Qiemo station and ERA5, as illustrated in Figure 3, which demonstrates their robust linear relationship.
In summary, the meteorological data used to drive the hydrological model in this study are shown in Table 1.

2.2.4. Glacier Data

The glacier dataset chosen for this study was derived from the First and Second Glacier Catalog Data, which was released by GLIMS via the National Glacier, Permafrost, and Desert Science Data Center. The data set is provided by Cold and Arid Regions Sciences Data Center at Lanzhou(www.ncdc.ac.cn/ accessed on 15 July 2023). The First Glacier Catalog Data was primarily constructed from aerial survey maps circa 1987, while the Second Glacier Catalog Data was based on remote sensing images captured between 2007 and 2013 [32,33,34]. Considering that there is less human activity intervention in the upstream part of the research area, this study used the First Glacier Catalog Data for the calibration period (1975–2009) and the Second Glacier Catalog Data for the verification period (2010–2019).

2.3. Setting Up SWAT-Gla Model Based on Original SWAT

The SWAT (Soil and Water Assessment Tool) model, which is renowned for its high computational efficiency and robust applicability, is capable of performing long-time-series continuous simulations. It was developed by the Agricultural Research Service (ARS) of the United States Department of Agriculture (USDA) in the 1990s, building upon the SWRBB (Simulator for Water Resources in Rural Basins) model [32,35,36]. In this study, to enhance the accuracy of the original SWAT model in simulating glacier basin runoff, a glacier melt module based on material balance was integrated into the original SWAT model. This modified version was referred to as the SWAT-Gla model in this study.
At present, the research on glacial material balance is mainly divided into two types: the energy–material model and the degree-day factor model [37,38,39,40,41,42,43,44,45]. The former is grounded in the principle of energy balance, while the latter is a conceptual statistical parameter model based on temperature. Despite the degree-day factor model being a semi-empirical model, it requires fewer parameters and is easier to obtain, making it more widely applied in the field [44,45]. Hock [46] and others have utilized the classic degree-day model to calculate glacier melting, which is deemed an effective method for addressing glacial melting in areas with insufficient data. At the same time, some scholars believe that all energy items in the energy balance will affect the material balance process, and thus, they try to add energy flux with radiation variables to the degree-day factor, which also improves the accuracy of the model simulation by 40% [47,48]. On this basis, this study constructed a glacier sub-module based on the degree-day factor model, incorporated a solar radiation item, and considered the dynamic changes of the glacial area, making it more congruent with the physical process. The specific process is shown in Section 2.3.1, Section 2.3.2, Section 2.3.3, Section 2.3.4 and Section 2.3.5.

2.3.1. Glacial Volume Calculation

The initial glacial volume is estimated based on the glacial area [48]:
V g l a = ( A g l a ) 1.35
where A g l a is the initial glacial area ( k m 2 ) and V g l a and is the initial glacial volume ( k m 3 ).
Then, the initial glacial water equivalent W g   ( m m ) is calculated:
W g = ρ V g l a A g l a
In this article, ρ = 900   k g / m 3 is the density of ice [49].

2.3.2. Calculation of the Daily Melting of the Glacier

The formula for calculating the daily melt of each HRU glacier in the study is as follows [9,50]:
M = C O V × [ G m f a c × T a v G m t m p + S R F × 1 α G ] , i f   T a v > G m t m p 0 , i f   T a v G m t m p
Gmfac ( m m / ( ° C · d ) is the glacial melting factor affected by temperature, and the specific calculation formula is as follows:
G m f a c = G m f m x + G m f m n 2 + G m f m x G m f m n 2 × sin 2 π 365 d n 81
The meanings of the parameters in this formula are as follows:
COV: the proportion of the glacier area to the total area of the sub-basin; Gmfmx ( m m / ( ° C · d ) ): the glacial melting factor affected by temperature on 21 June; Gmfmn ( m m / ( ° C · d ) ): the glacial melting factor affected by temperature on 21 December; Gmtmp ( ° C ): the critical temperature of glacier melting; SRF: radiation empirical parameter; α : surface albedo, which was found by considering that different areas of the glacier, underlying surface, slope direction, etc., have a great impact on the albedo [45], and thus, for the convenience of calculation, this study extracted the daily albedo data in the ERA5 dataset, calculated the average daily albedo in the sub-basin where the glacier was located, and used it as the daily glacial albedo for calculation; G( W / m 2 ): the daily solar radiation; T a v   ° C : the daily average temperature; d n : the daily ordinal number.

2.3.3. Calculate the Daily Accumulation of the Glacier

For summer accumulation-type glaciers, due to precipitation, both the accumulation and melting of the glacier occur in the warm season, and the accumulation in the cold season is less. This study took into account the possibility of glacial accumulation resulting from factors such as temperature, and acknowledged the seasonal and progressive nature of glacial accumulation, as indicated in reference [51]. Consequently, the formula used in this study to calculate glacial accumulation is as follows:
F = β W s
β = β 0 1 + sin 2 π 365 t 81
where F is the daily glacial accumulation amount. W s is the snow equivalent (mm), which can be obtained from the SWAT model, and β 0 is the glacial accumulation coefficient. t is the daily ordinal number.

2.3.4. Dynamic Glacial Volume Calculation

According to the principle of glacial material balance, the change rate of glacial water equivalent is related to the change in the glacial material [51]. The updated glacial water equivalent satisfies the following equation:
W g W g = 1 f M + F
where M ( m m ): glacial melt, f : the proportion of glacial meltwater refreezing, F ( m m ): glacial material accumulation, W g ( m m ) : the daily equivalent of glacial water, and W g ( m m ) : the glacial water equivalent of the day after W g .
The updated glacial area and volume can be obtained according to Equations (1) and (2):
A g l a = W g ρ 2.86
V g l a = ( A g l a ) 1.35
The updated glacier data is substituted into the previous part for the calculation to obtain the new glacial melt.

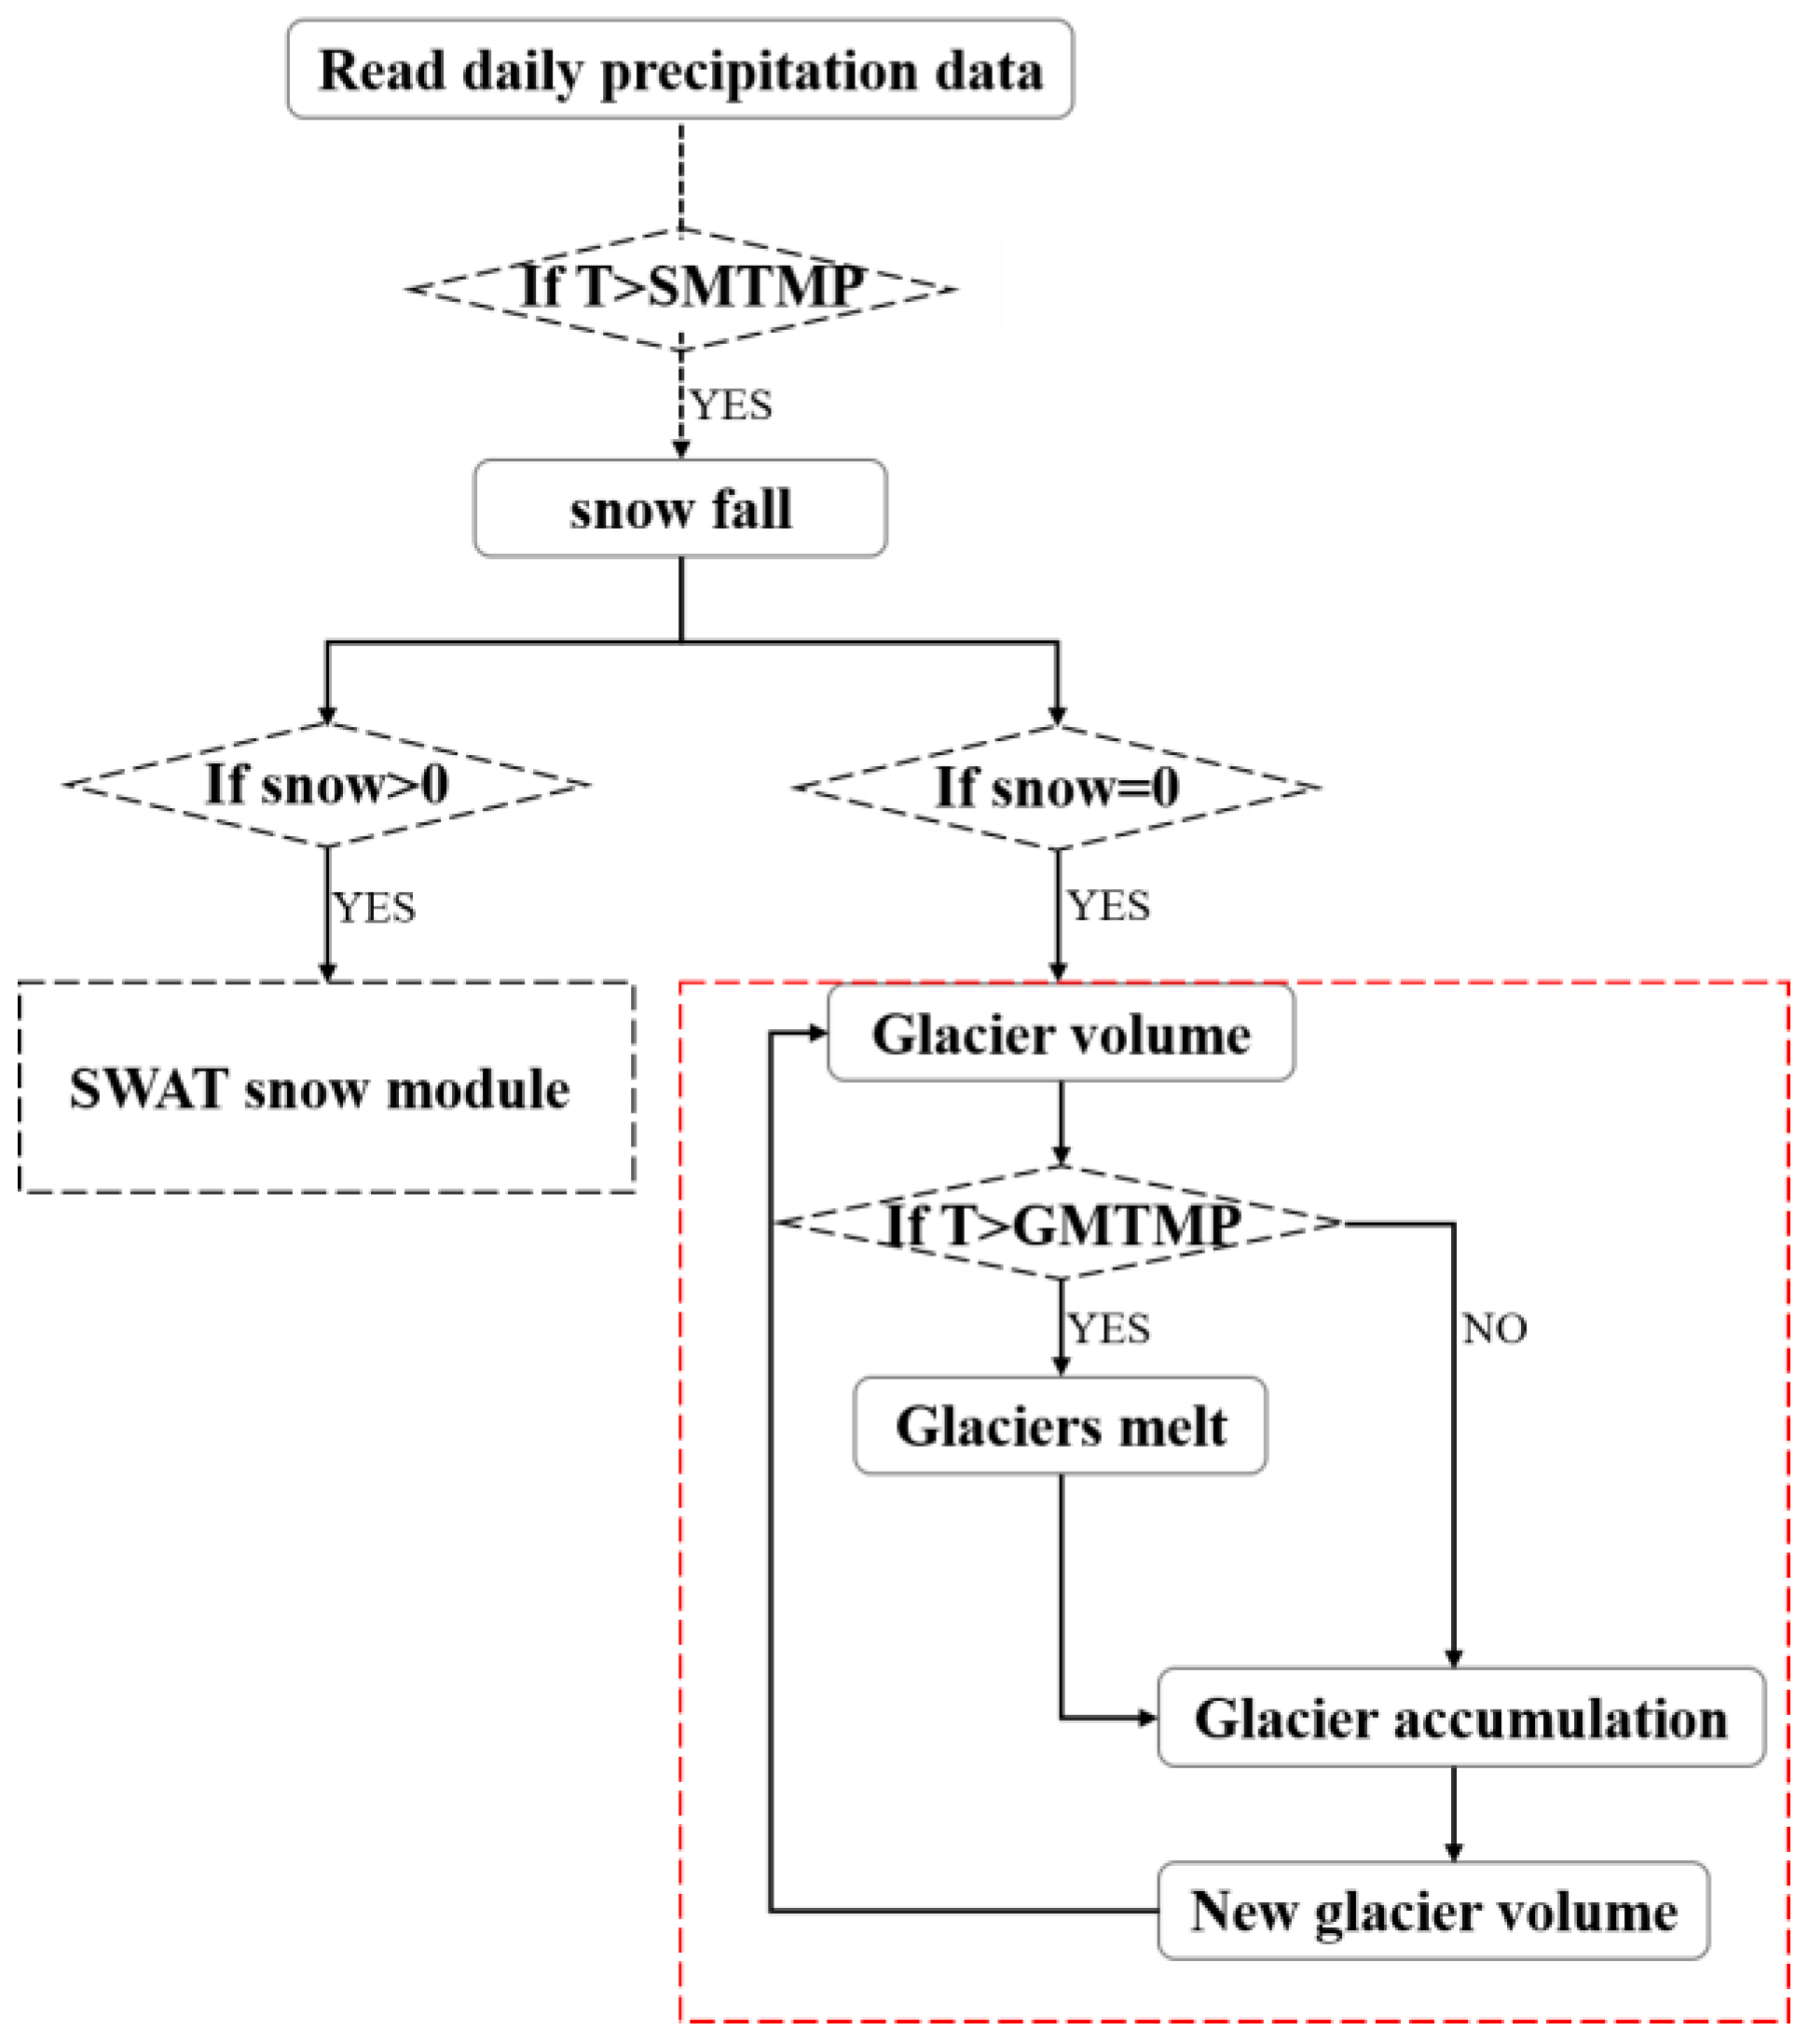
2.3.5. Establishing the SWAT-Gla Model

The SWAT model was constructed using the Fortran language. Therefore, this study employed Visio Studio 2022 to recompile the SWAT source code. Initially, data such as the glacial area is read from the “simulate.f” file. Subsequently, the aforementioned Equations (1)–(9) are written into the “snom.f” file, following the snow-melting code. The final step involves replacing the original “swat.exe” with the newly generated “swat.exe”. The structure of the glacier module is depicted in Figure 4.

3. Results

3.1. Sensitivity Analysis of SWAT-Gla Model Parameters

In this study, the monthly runoff data from the Qiemo station from 1970 to 2019 were selected for model parameter calibration and verification. The period from 1970 to 1974 was the model warm-up period, 1975–2009 was the model calibration period, and 2010–2019 was the model verification period. Figure 5 provides a visual representation of the sub-basin generated during the study. The model parameters and glacier module parameters employed in this research are outlined in Table 2. These parameters were chosen in accordance with the research conducted by J. G. Arnold, which introduced the principle of the SWAT model and its parameters in detail, as referenced in source [52].
Next, the t-test method was used to perform a sensitivity analysis on the simulated parameters of the SWAT-Gla model [32]. The sensitivities of the above parameters are shown in Figure 6. Among them, the absolute value of t-Stat indicates the sensitivity of the parameter, a larger absolute value signifies a higher degree of sensitivity. From the figure, the top five parameters with the strongest sensitivity were SRF, GMTMP, GMFMX, CN2, and SOL_Z in order.
SRF, which serves as the coefficient of the solar radiation item within the glacier module, has a direct impact on the daily glacial melt instigated by radiation. GMTMP, which is the threshold temperature for glacial melting, acts as the determining factor for whether the glacier undergoes melting on any given day. GMFMX, which represents the glacial melting factor on 21 June, influences the value of the glacial degree-day factor, subsequently affecting the volume of glacial melt. CN2, which is the SCS runoff curve coefficient, functions as a comprehensive indicator of the condition of the underlying surface. A larger CN2 value implies a lower permeability of the underlying surface, which, in turn, leads to an increase in the production of surface runoff. SOL_Z, which denotes the depth of the soil layer, suggests that a larger value corresponds to a greater storage depth of groundwater.
The above sensitive parameters further indicate that the replenishment of glacial meltwater constitutes a significant portion of the runoff in the Qarqan River. ALPHA_BF and ALPHA_BNK, which are parameters used for simulating groundwater, have an impact on the volume of water replenished to the sub-basin. SOL_Z, which is the assumed soil layer depth in the SWAT model, influences the depth of groundwater storage. CH_N2 and CN2, which represent the Manning coefficient of the river channel and the SCS runoff curve number, respectively, primarily affect the peak and magnitude of the flow within the river channel, as referenced in source [53]. These parameters play a crucial role in understanding and predicting the behavior of the river flow.

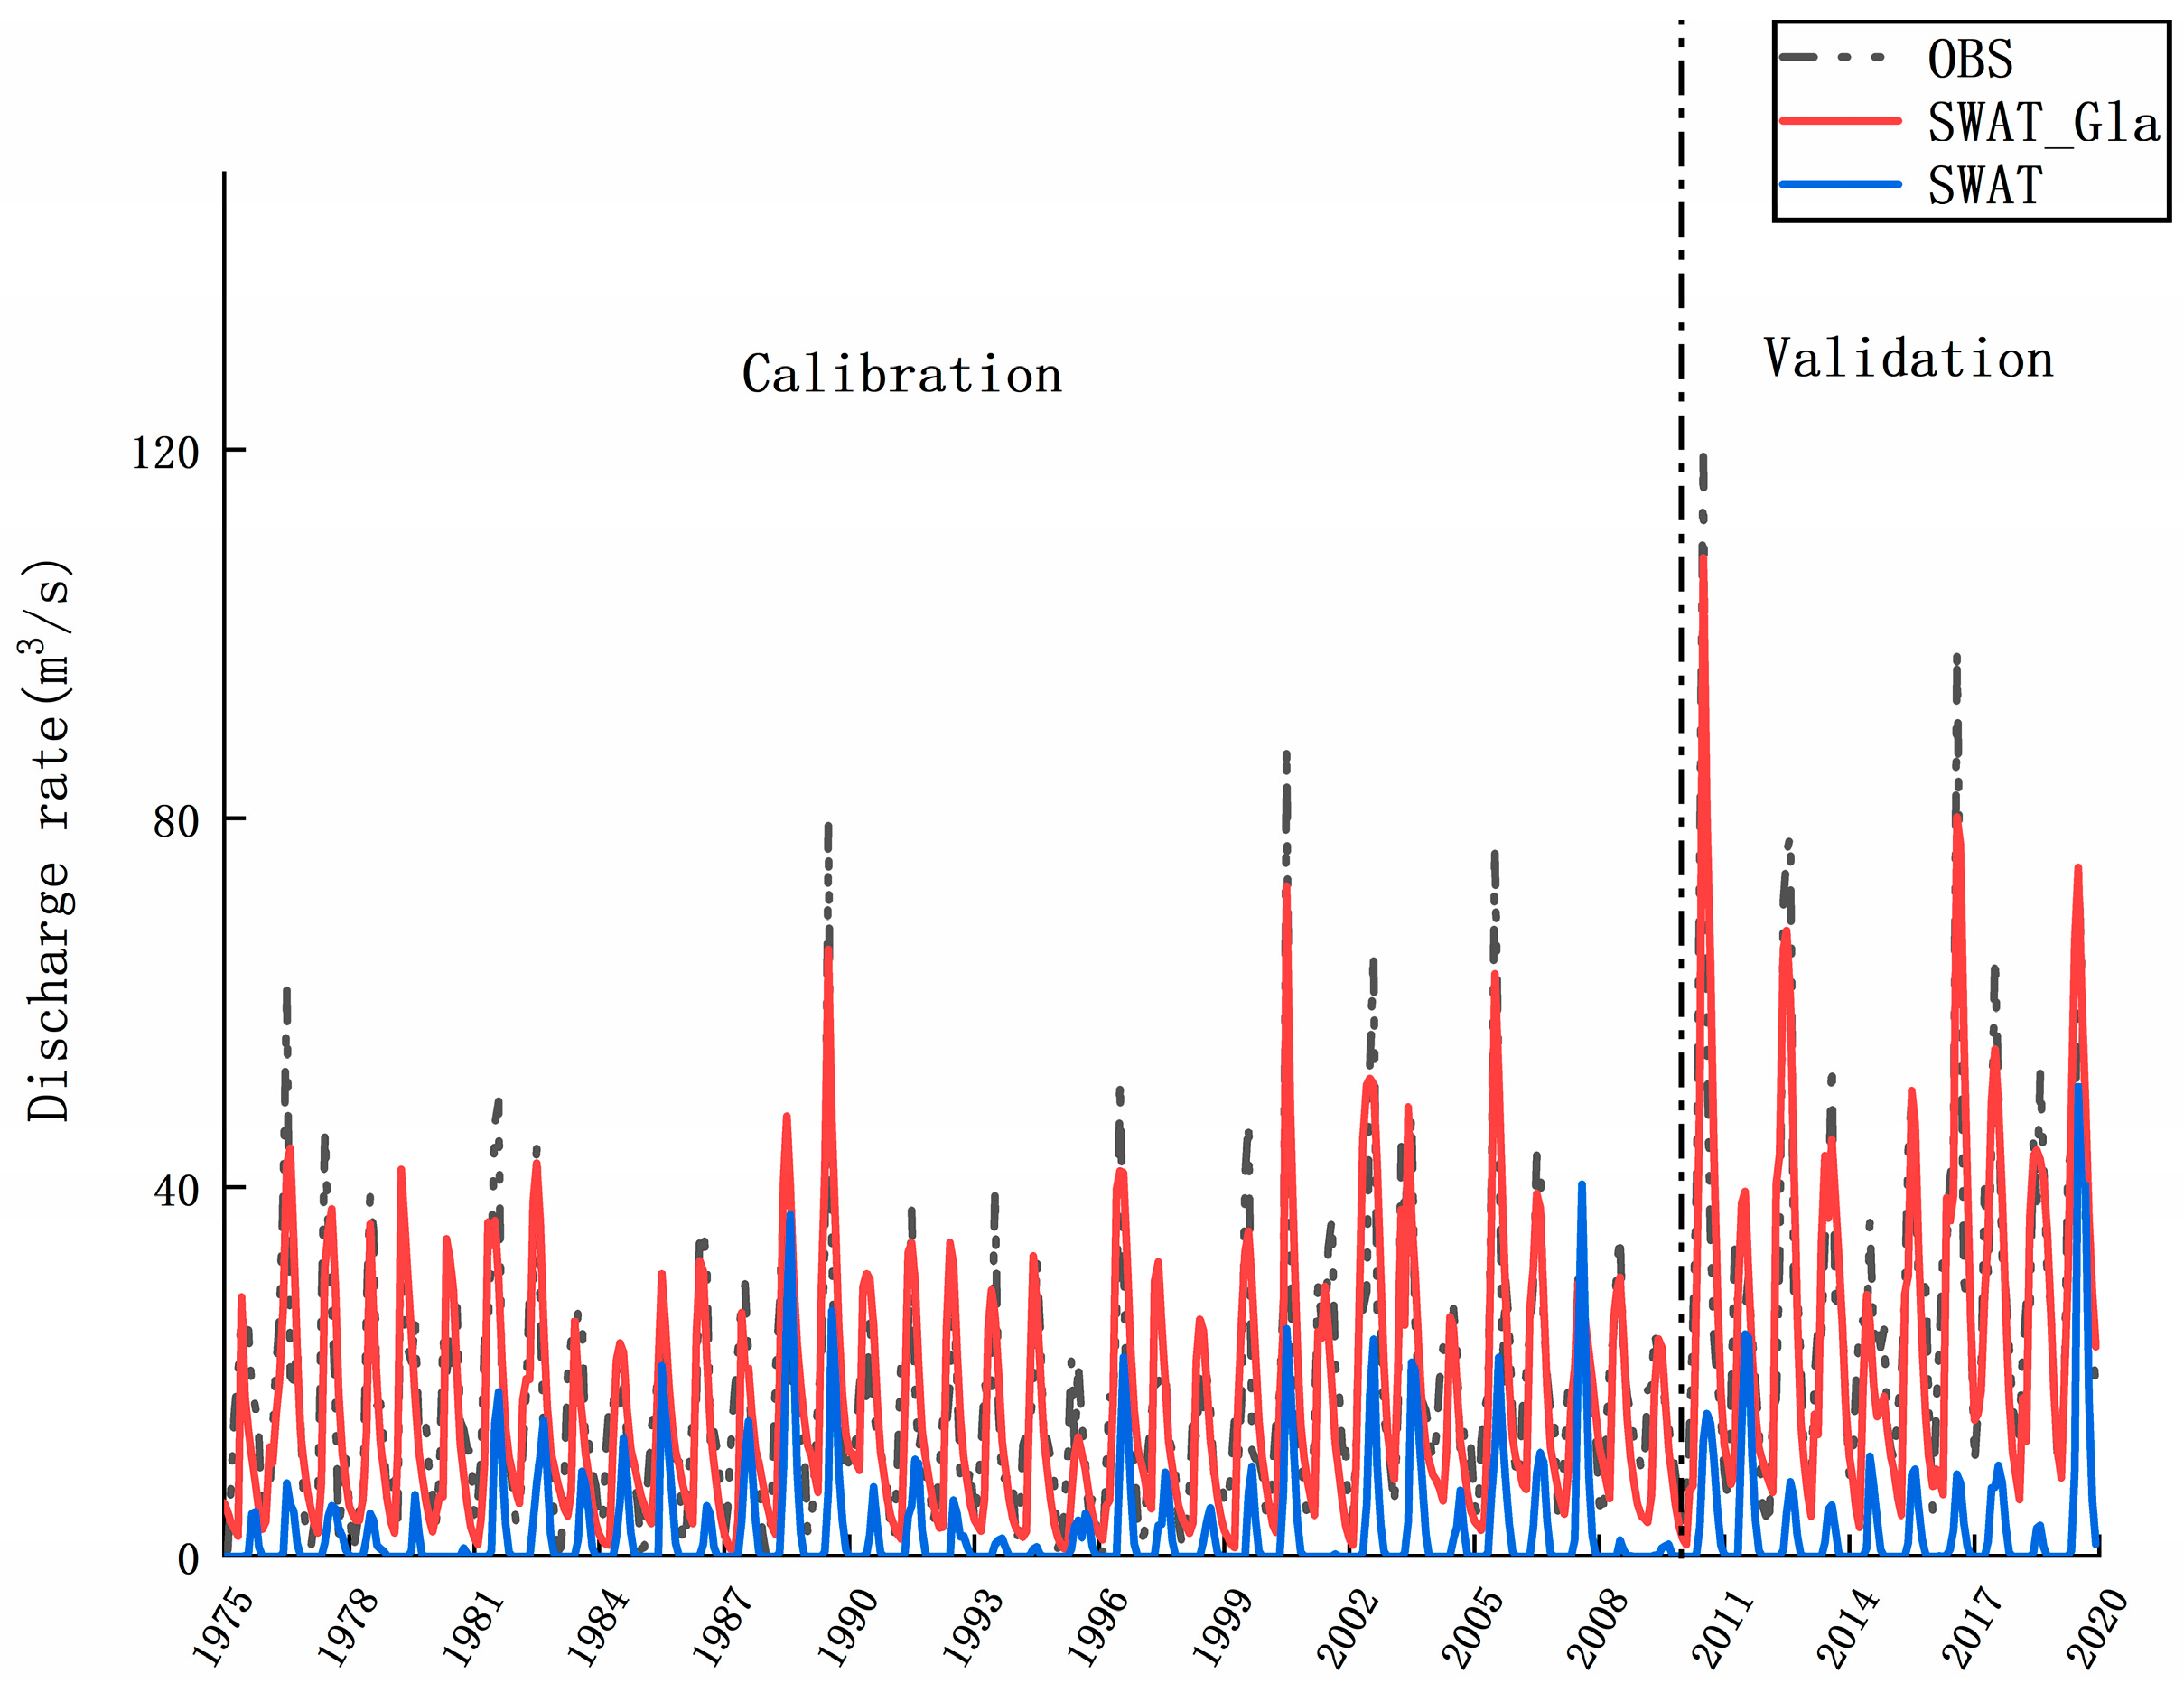
3.2. Comparison of SWAT and SWAT-Gla Simulation Results

This study used SWAT-CUP to calibrate the simulation results of SWAT and SWAT-Gla models. The measured runoff data was utilized for verification purposes. The calibration and validation results of the SWAT and SWAT-Gla models are shown in Figure 7. This figure provides a clear and concise overview of the performance of both models, allowing for a straightforward comparison and analysis of their respective results.
Upon comparing the simulation results of the SWAT and SWAT-Gla models, it was found that the average measured runoff during the calibration period was 16.63 m3/s, and the simulated values of SWAT and SWAT-Gla were 2.73 m3/s and 15.86 m3/s, respectively, with error rates of 84.6% and 4.6%. The average measured runoff during the validation period was 29.52 m3/s, and the simulated values of SWAT and SWAT-Gla were 3.89 m3/s and 28.36 m3/s, respectively, with error rates of 86.8% and 3.9%. These results clearly demonstrate the superior accuracy and reliability of the SWAT-Gla model in comparison with the SWAT model.
Further comparison of the seasonal runoff simulation results before and after model improvement (Table 3) showed that the runoff simulated by SWAT was mainly concentrated in summer (62.4%) and autumn (36.8%), and only 0.4% in spring. Although the runoff simulated by SWAT-Gla was also concentrated in summer and autumn, the proportion of spring runoff increased significantly, accounting for 17.8%. This distribution was more reflective of the actual situation within the basin, demonstrating the enhanced accuracy and realism of the SWAT-Gla model.
Further comparison of the hydrographs of the SWAT and SWAT-Gla models, as depicted in Figure 7, revealed that the peak discharge and recession part of the runoff simulated using the SWAT-Gla model aligned more closely with the observed data than the original SWAT model simulation. Specifically, the discrepancy between the runoff simulated by the SWAT model and the measured monthly runoff ranged mostly between 10.0 m3/s and 107.0 m3/s. More than one-third of the months exhibited a difference of over 20 m3/s, and the difference in annual peak flow varied between 20 m3/s and 107.0 m3/s. This resulted in a substantial overall simulation error. In stark contrast, the differences between the simulated monthly runoff from the SWAT-Gla model and the observed data were consistently below 10.0 m3/s for the majority of the time. The difference in annual peak runoff was also significantly reduced, ranging between 0.8 m3/s and 19.5 m3/s.
These findings clearly demonstrate that the SWAT-Gla model, which was enhanced with the improved glacier module, was capable of simulating the actual runoff situation in the Qarqan River Basin with a higher degree of accuracy. This improved model provided a more reliable tool for understanding and predicting the hydrological behavior of the basin.
Furthermore, this study used the coefficient of determination R2, Nash coefficient NSE, root-mean-square error, and percentage bias PBIAS to evaluate the simulation results of the SWAT and SWAT-Gla models. The expressions of R2, NSE, and PBIAS [54] are as follows:
R 2 = [ i = 1 n O i O ¯ S i S ¯ i = 1 n O i O ¯ 2 i = 1 n S i S ¯ 2 ] 2
N S E = 1 i = 1 n O i S i 2 i = 1 n O i O ¯ 2
P B I A S = i = 1 n O i S i 2 × 100 i = 1 n Q i o b s
In these formulas, O i is the observed value; S i is the model simulated value; O ¯ and S ¯ are the average values of the observed and simulated values, respectively; and n is the number of observed values. The correlation coefficient R2 is obtained through the linear regression equation, which reflects the correlation between the measured value and the simulated value. A higher R2 value, approaching 1, signifies a stronger correlation between the observed values and the simulated values. This indicates a more accurate representation of the relationship between the two sets of data.
When the Nash–Sutcliffe efficiency (NSE) equals 1, it signifies a perfect match between the simulated and measured values. If the NSE falls within the range of 0.50 to 0.65, the model’s performance is deemed satisfactory. An NSE value between 0.65 and 0.75 indicates a good model evaluation. However, an NSE value less than 0.5 suggests that the model’s simulation is not reliable. The percent bias (PBIAS) reflects the cumulative deviation between the simulated and measured values. The optimal PBIAS value is 0, which suggests that the model can simulate the total water volume with high accuracy. A PBIAS value greater than 0 indicates an overestimation by the model, while a value less than 0 signifies an underestimation. If the PBIAS value falls within the range of −10% to +10%, the model’s performance can be considered excellent, as per references [54,55,56,57,58,59].
The specific runoff simulation evaluation metrics for both the SWAT and SWAT-Gla models are presented in Table 4 below. From the data, it can be observed that during the calibration period (1975–2009) of the model, the coefficient of determination (R2) for the original SWAT model stood at 0.34, the Nash–Sutcliffe efficiency (NSE) was −0.35, and the percent bias (PBIAS) exceeded 30%. However, with the addition of the glacier module in the SWAT-Gla model, there was a noticeable improvement in all evaluation aspects. The coefficient of determination (R2) during the calibration period increased to 0.65, the Nash–Sutcliffe efficiency (NSE) rose to 0.60, and the percent bias (PBIAS) diminished to 4.6%. These figures clearly indicate that the SWAT-Gla model outperformed the original SWAT model in all evaluation aspects.
During the validation period (2010–2019), the coefficient of determination (R2) for the original SWAT model was a mere 0.24, the Nash–Sutcliffe efficiency (NSE) was −1.85, and the percent bias (PBIAS) exceeded 30%. However, in the SWAT-Gla model, the coefficient of determination during the validation period rose to 0.75, the Nash–Sutcliffe efficiency (NSE) increased to 0.72, and the percent bias (PBIAS) dropped to 3.9%. These figures indicate that the SWAT-Gla model outperformed the original SWAT model in terms of the runoff simulation during the validation period. Therefore, it can be concluded that the SWAT-Gla model successfully simulated runoff in the Qarqan River Basin and could be effectively utilized for basin runoff simulation and analysis.

3.3. Water Resource Analysis in Qarqan River Basin

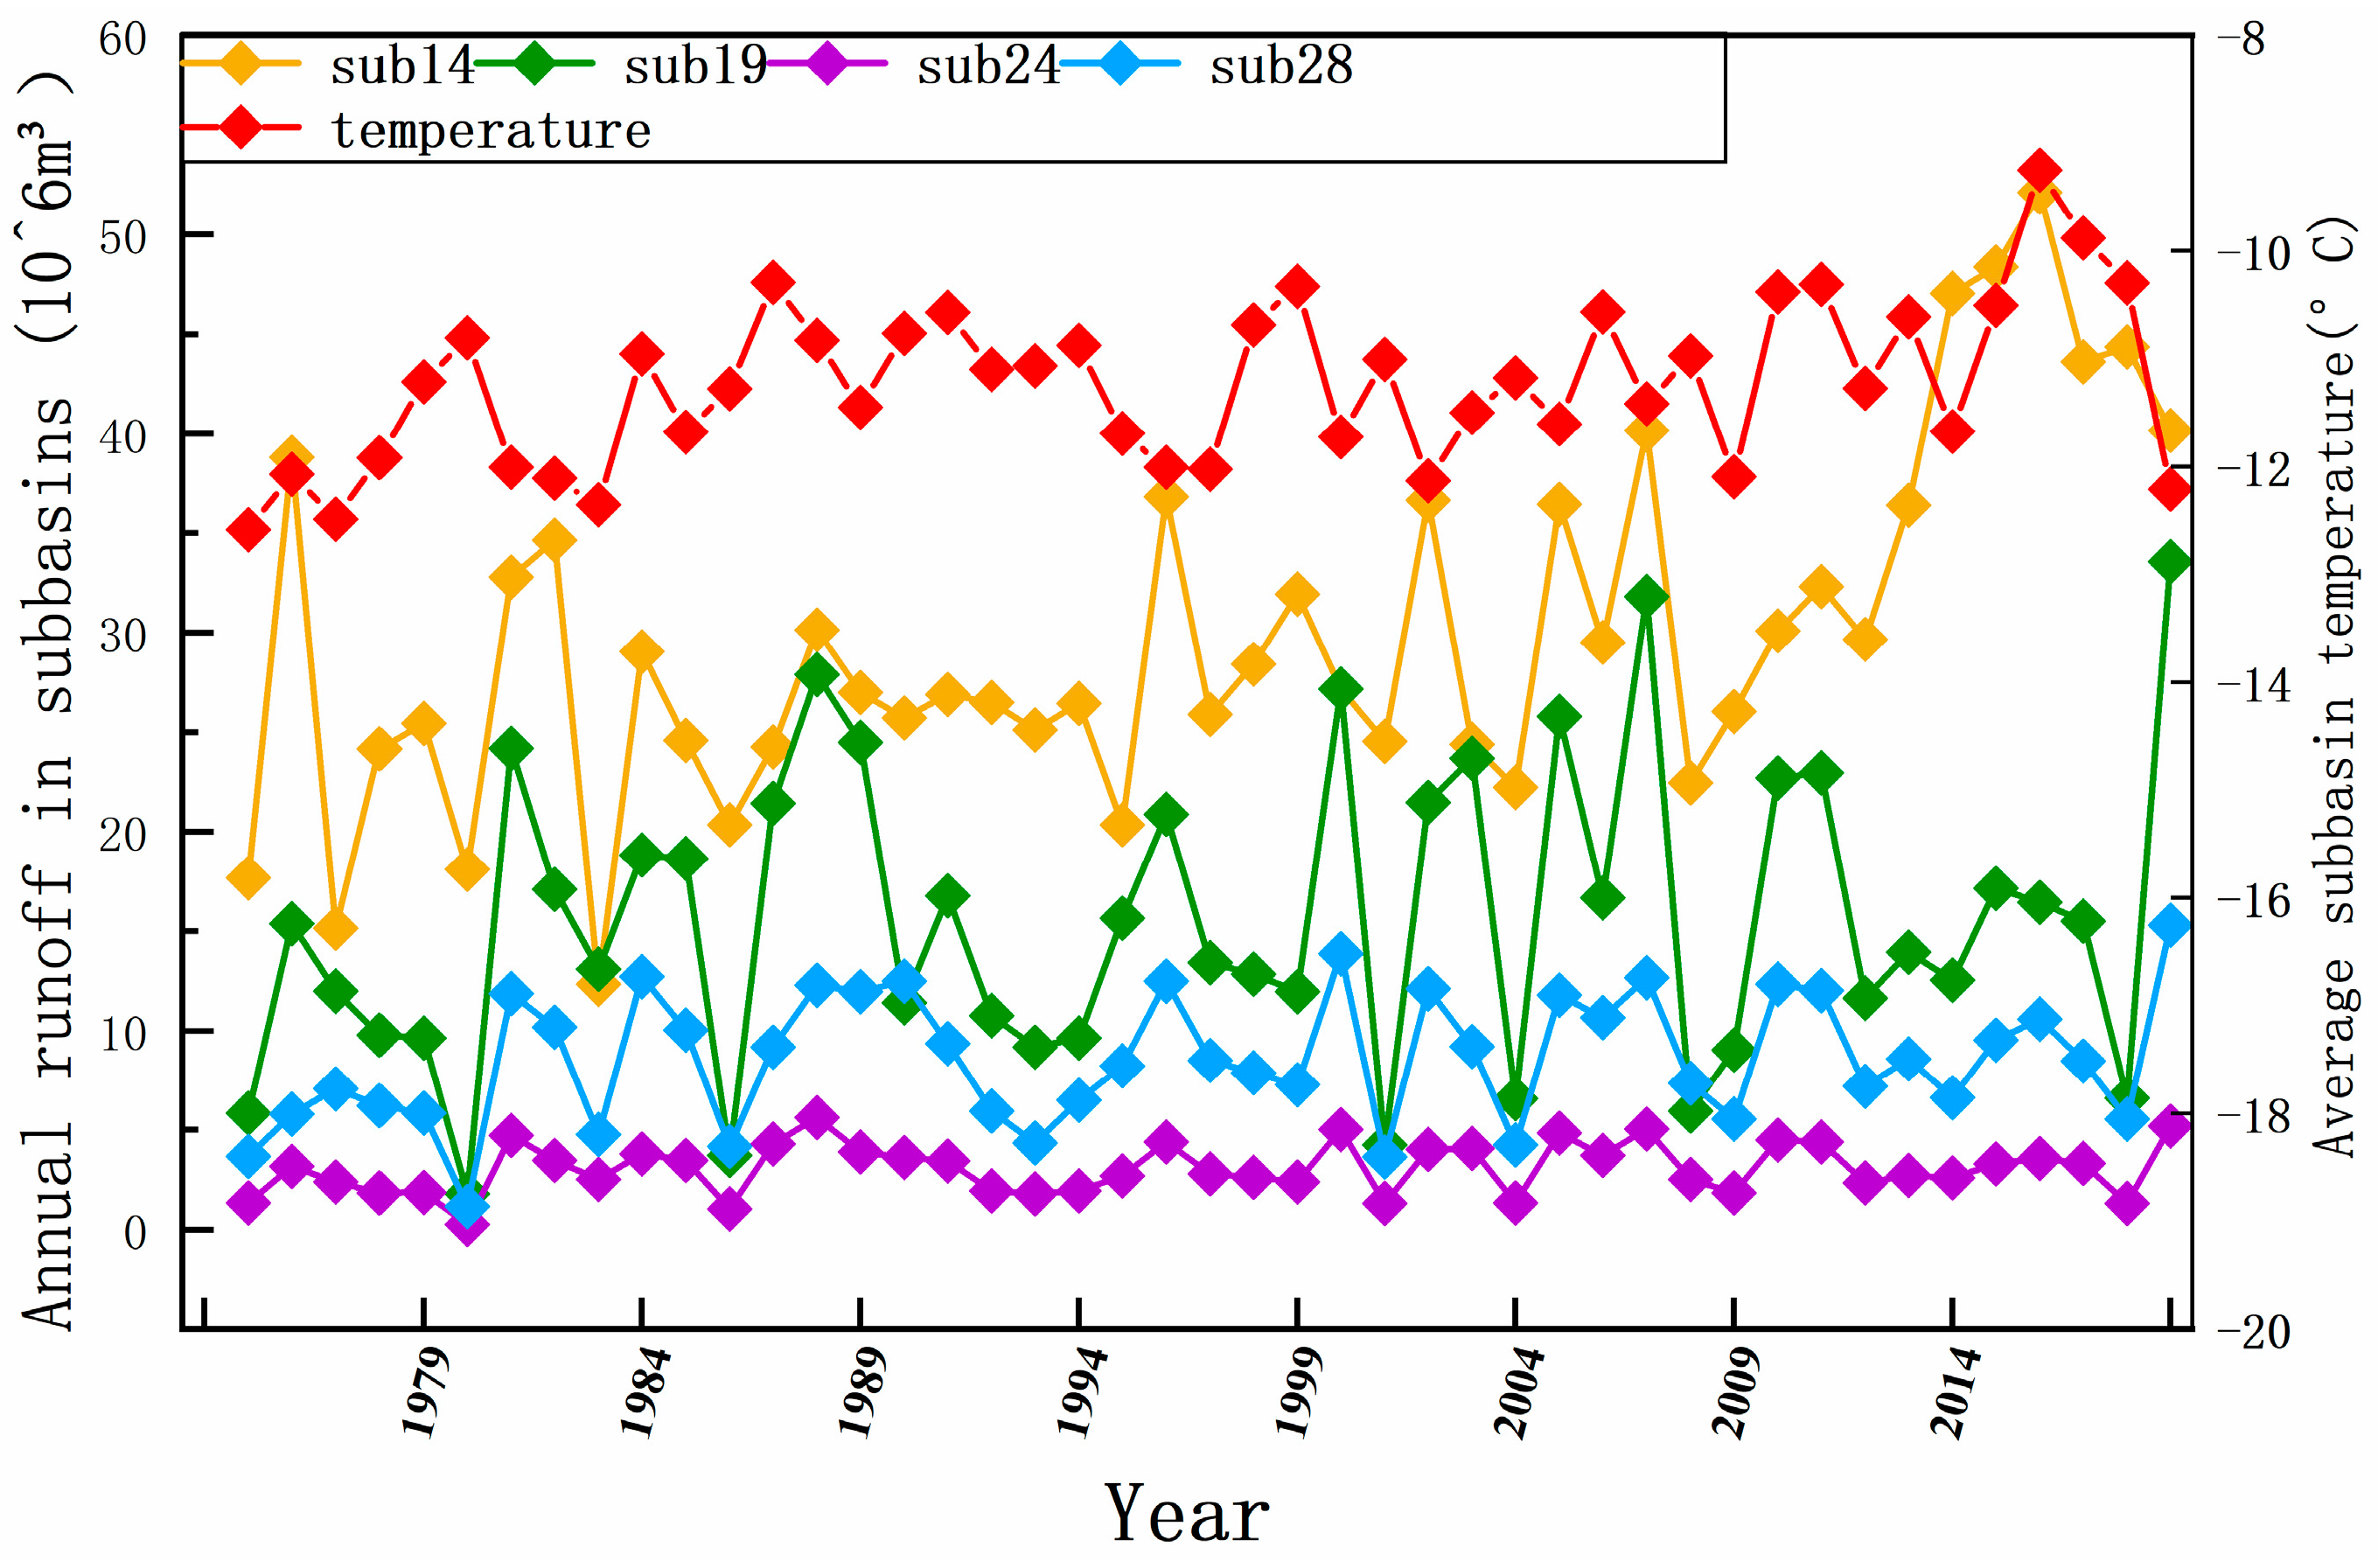
3.3.1. Water Resource Characteristics Analysis

The Qarqan River Basin has many sub-basins, and its total water resources are extremely important for regional development. Therefore, based on the simulation results of the above SWAT-Gla model, the average annual runoff volumes from 1975 to 2019 were extracted for 28 sub-basins in the upper region of the Qarqan River, along with their respective proportions in the total runoff, as shown in Figure 8. It can be observed that sub-basins with higher runoff volumes invariably contained glaciers.
Additionally, four sub-basins with higher runoff—SUB14, SUB19, SUB24, and SUB28—were selected for an in-depth annual runoff analysis. The results of this analysis are illustrated in Figure 9. It can be observed that the annual average runoff volumes of these four sub-basins closely corresponded with the concurrent temperature fluctuations.
To further analyze the proportion of glacial and snowmelt water in the total runoff of the Qarqan River Basin, this study investigated the annual contribution rate of glacial and snowmelt water to the runoff supply within the basin. The contribution rate is defined as the ratio of the runoff generated by glacial and snowmelt water to the total runoff [60,61]. The results, as depicted in Figure 10, reveal that from 1975 to 2019, the average contribution rate of glacial and snowmelt water to the runoff in the basin was 80%, with a fluctuating growth rate of approximately 1 × 10⁷ m3 per year. Concurrently, the average temperature in the glacial region also showed an increasing trend during the same period, with an annual growth rate of approximately 0.025 °C. Therefore, it can be inferred that there was a certain correlation between the amount of glacial and snowmelt water and temperature.

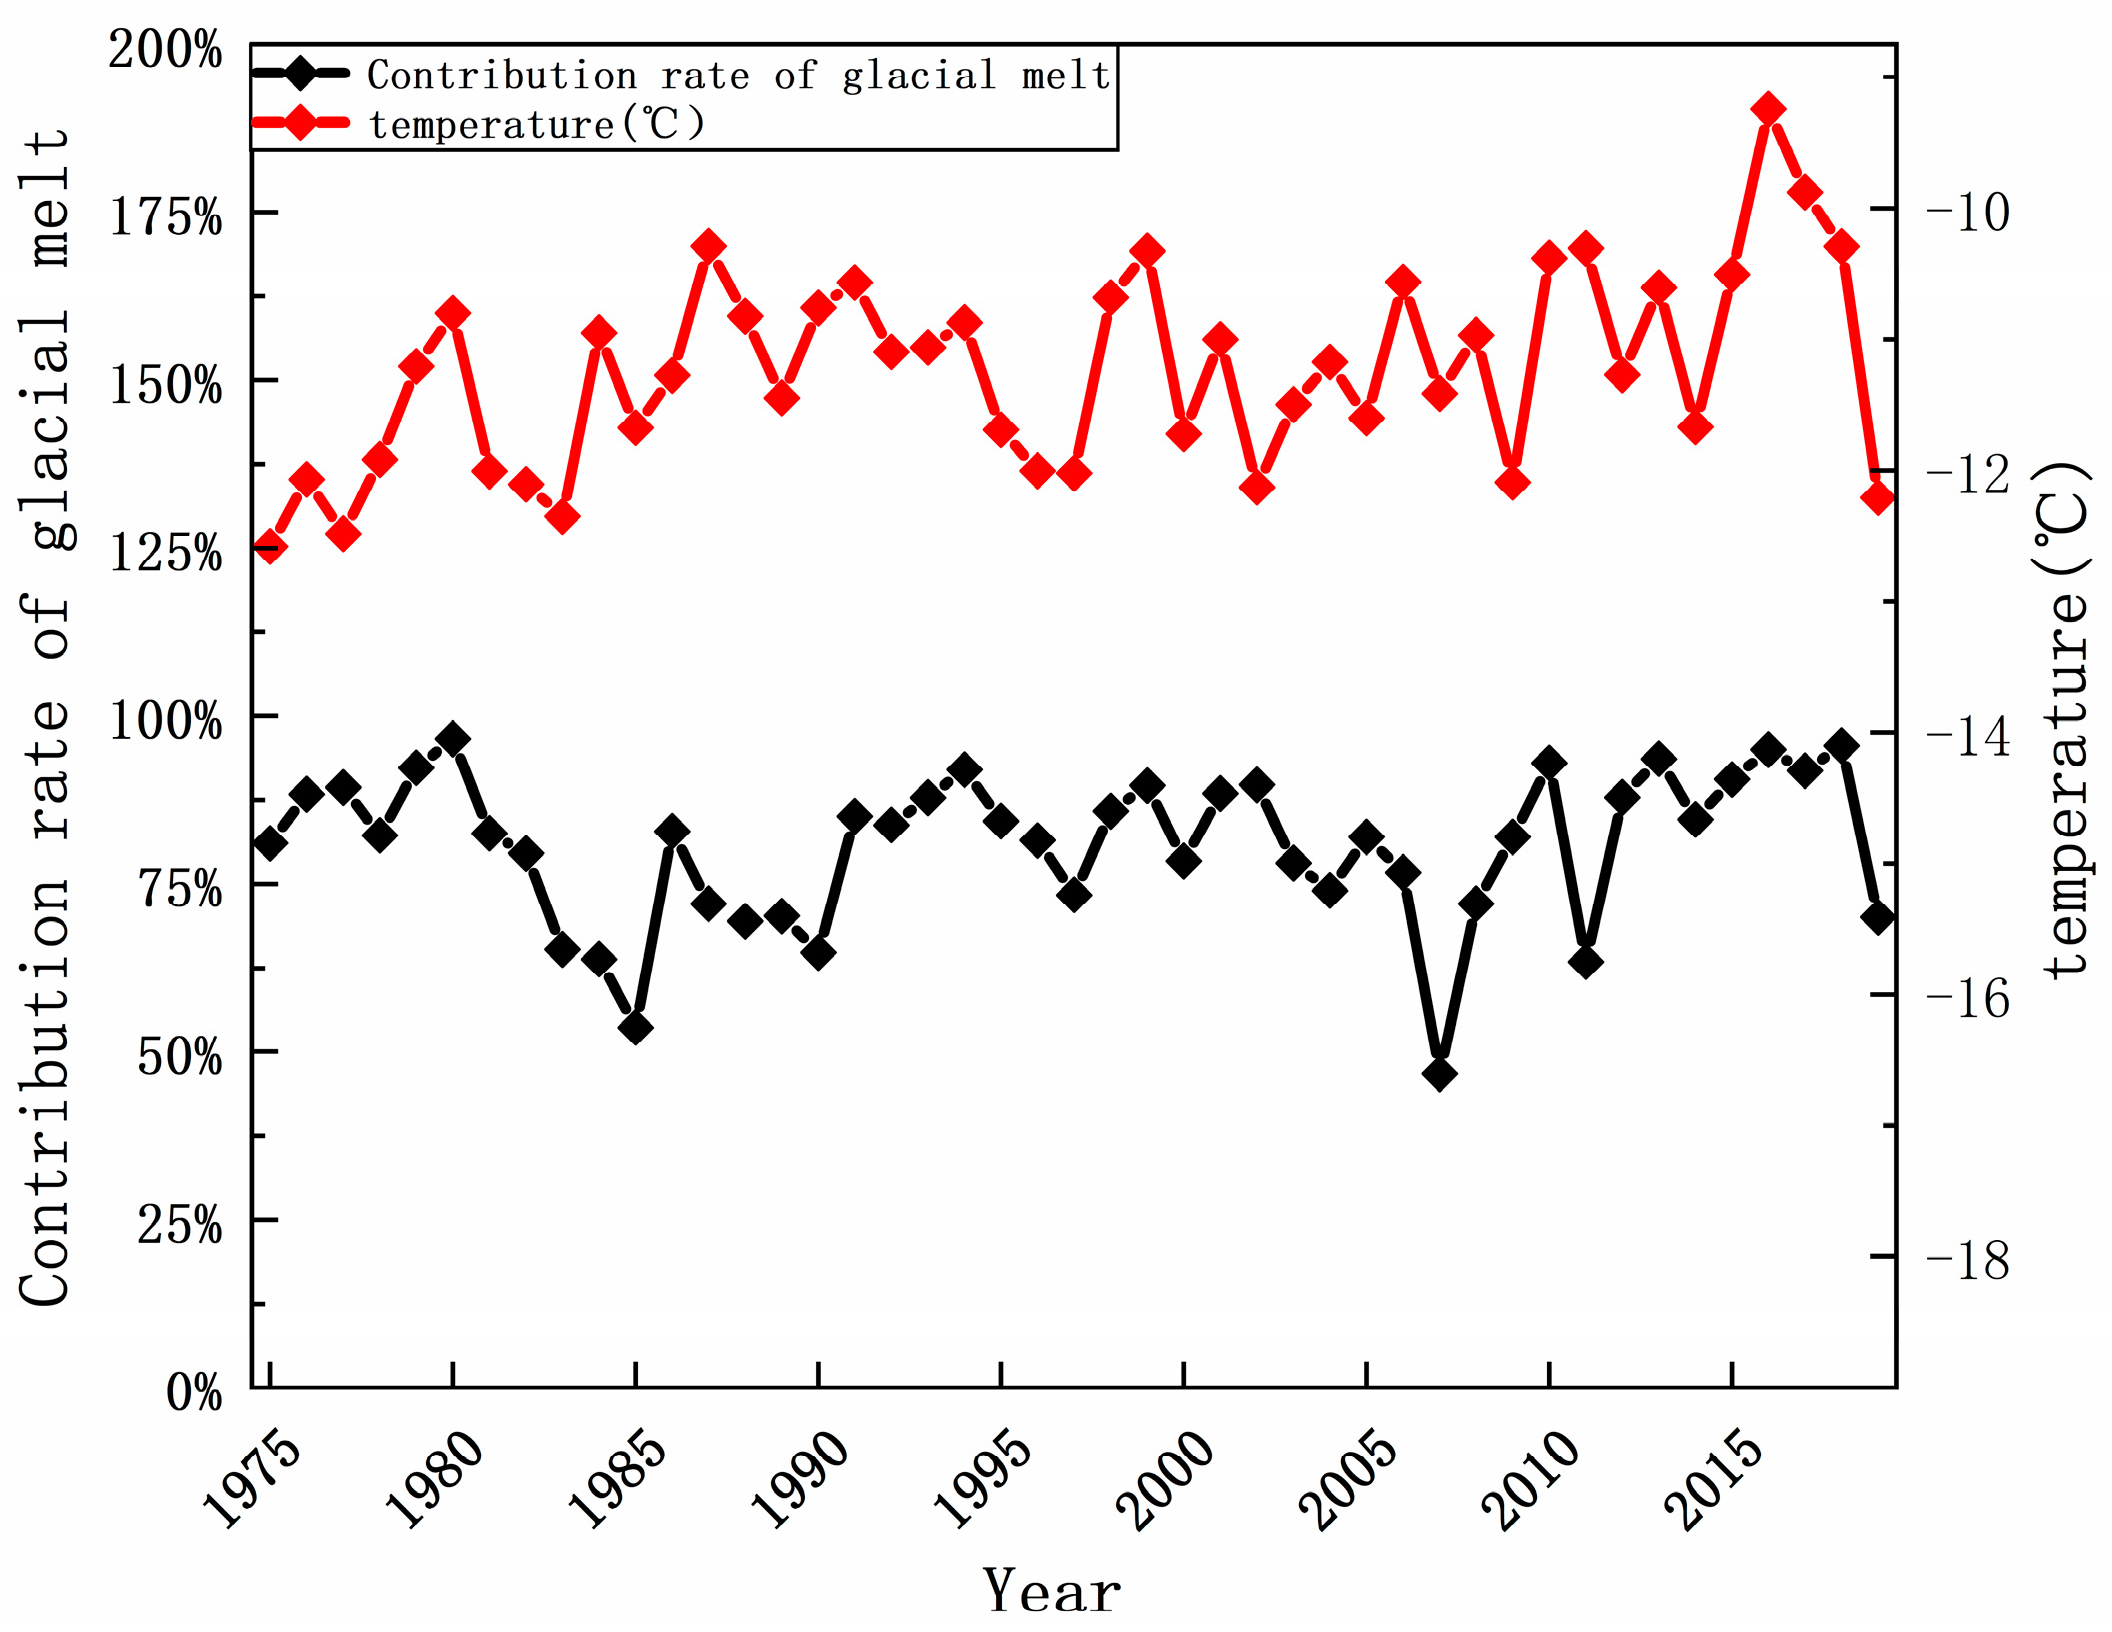
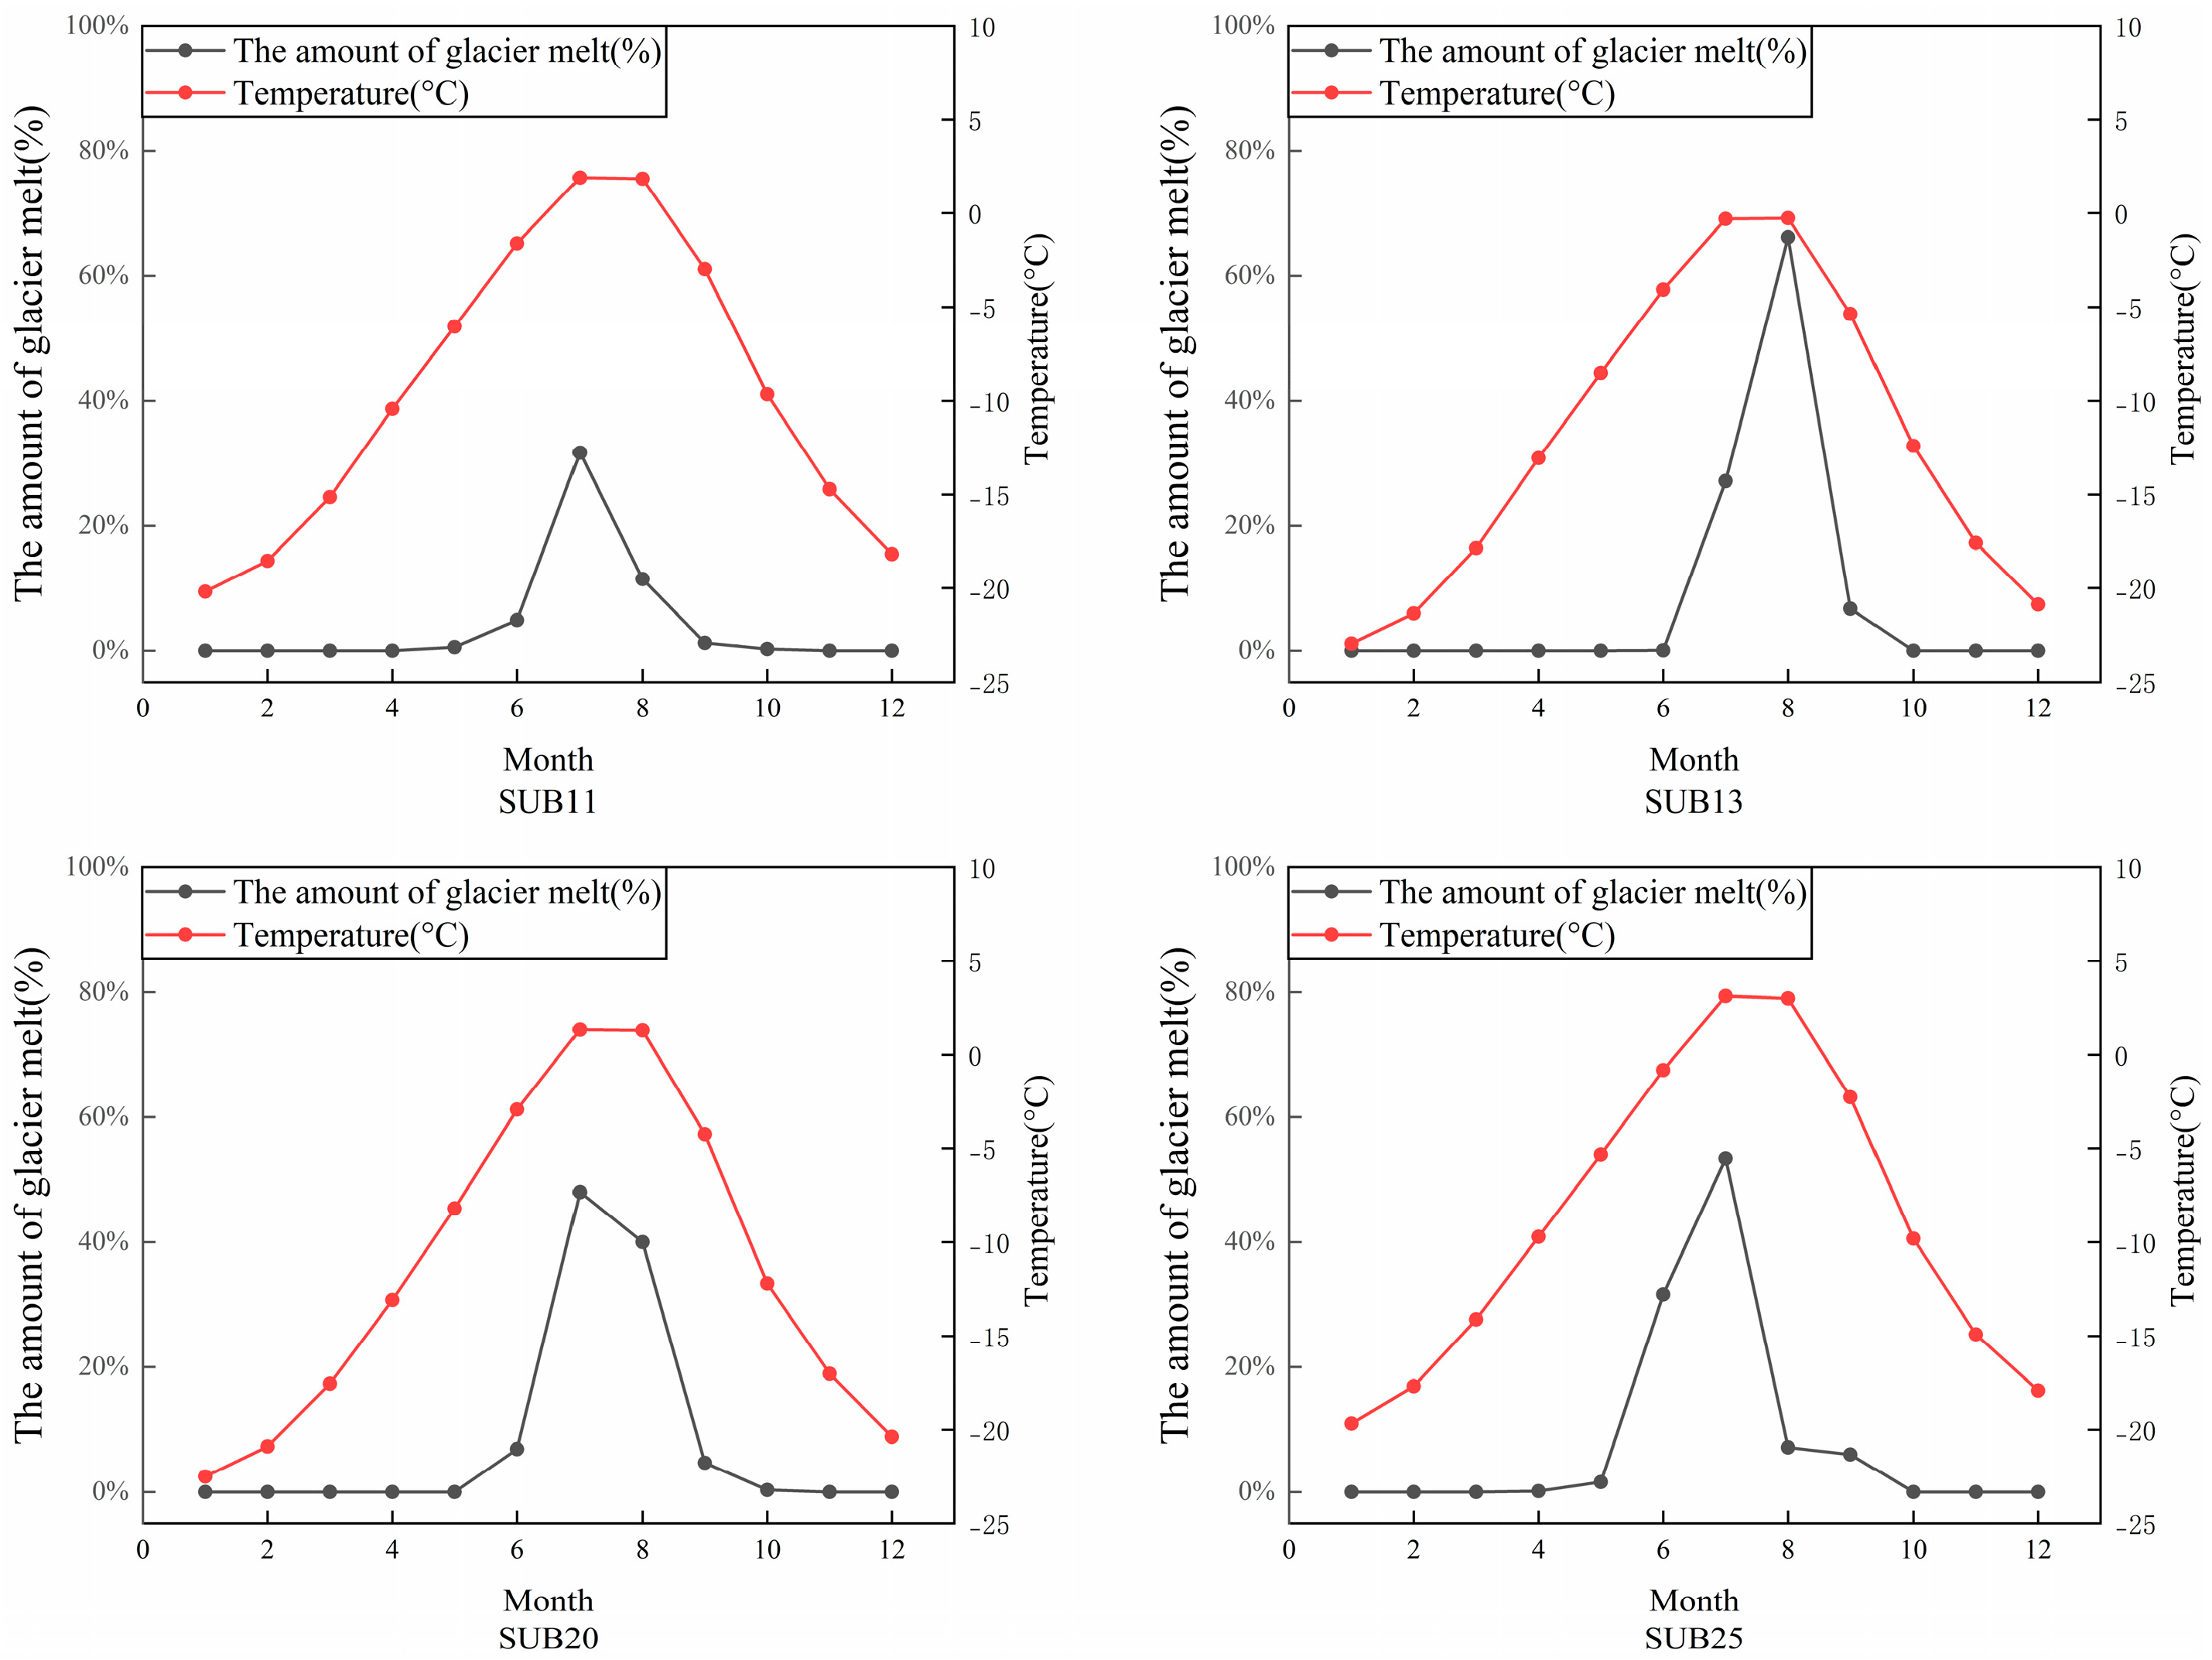
3.3.2. Glacial Meltwater Runoff Characteristics Analysis

Further analysis of the annual distribution pattern of glacial and snowmelt water supply to the runoff within the Qarqan River Basin (as depicted in Figure 11 and Figure 12) revealed a distinct seasonal pattern. It can be observed that the volume of glacial and snowmelt water was relatively low from January to March, accounting for less than 5% of the annual glacial and snowmelt water volume. However, starting in April, the volume of glacial and snowmelt water rapidly increased and reached its peak in July. During the summer and autumn seasons, the volume of glacial and snowmelt water constituted approximately 75% of the annual total. From October onward, the rate of decrease in glacial and snowmelt water volume decelerated, and there was virtually no generation of glacial and snowmelt water during the winter season. Therefore, it can be concluded that the supply process of glacial and snowmelt water in the Qarqan River Basin exhibited significant seasonal characteristics, with the majority of the supply occurring during the warmer months of the year.

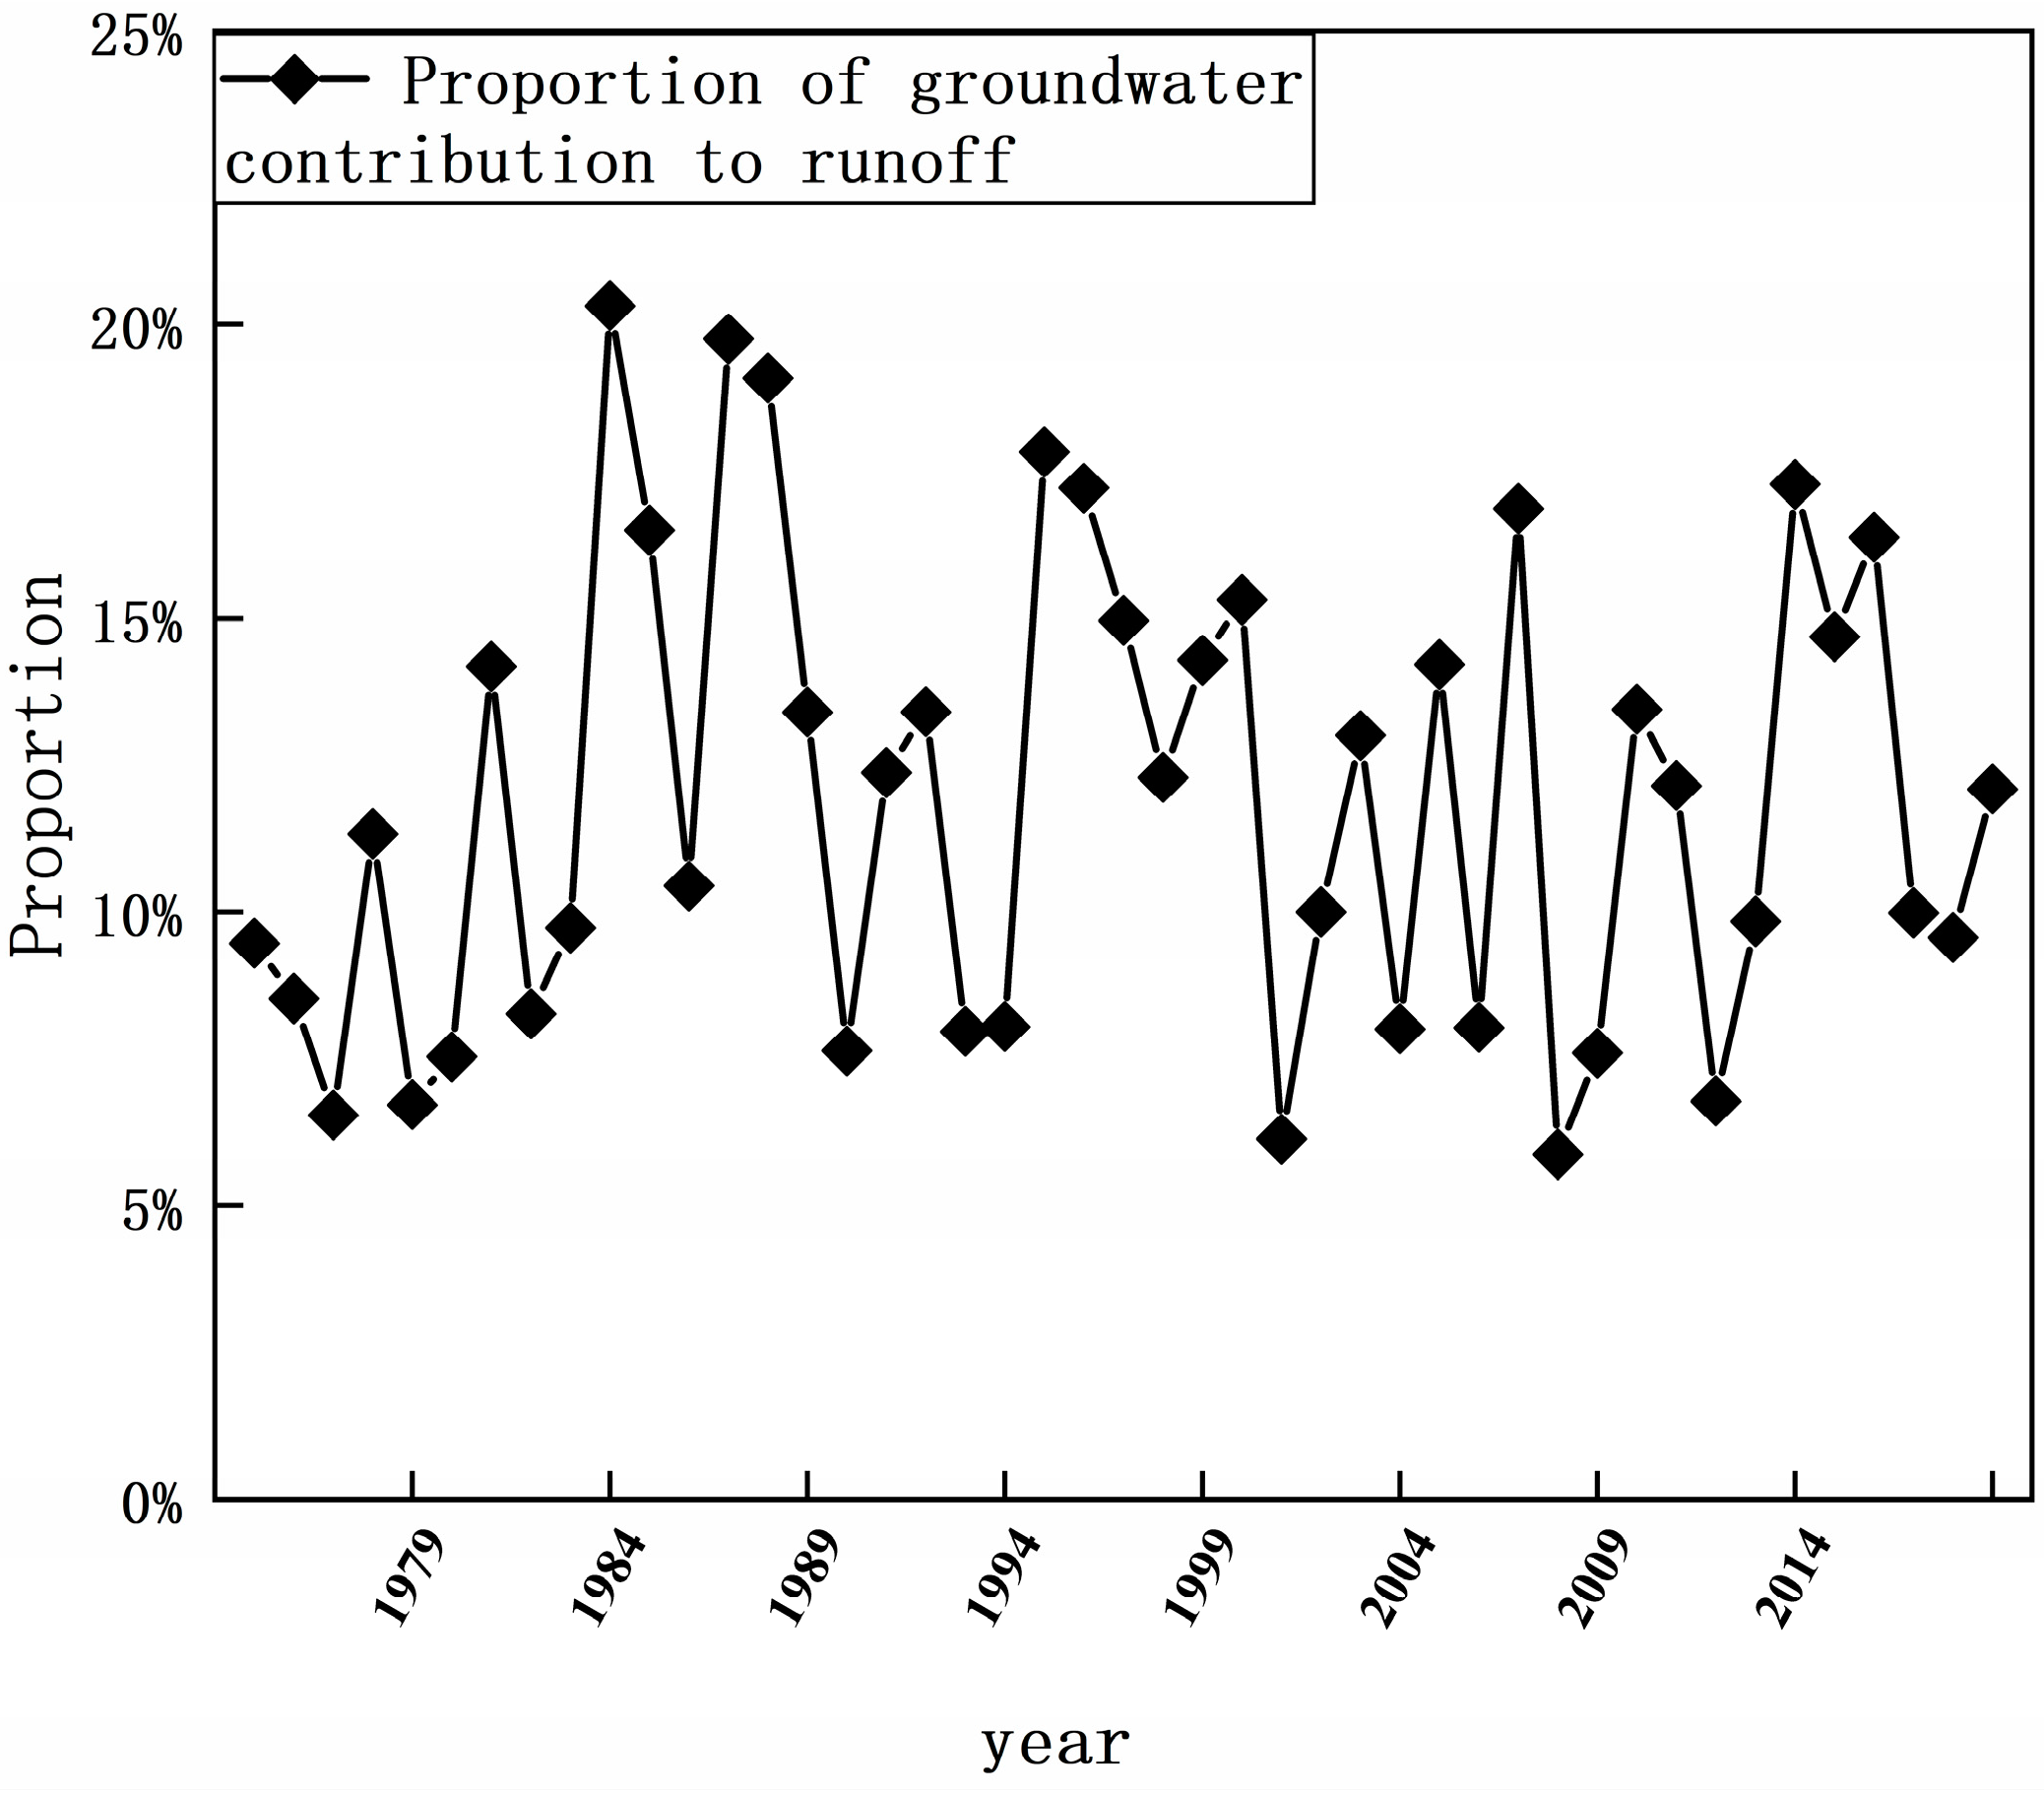
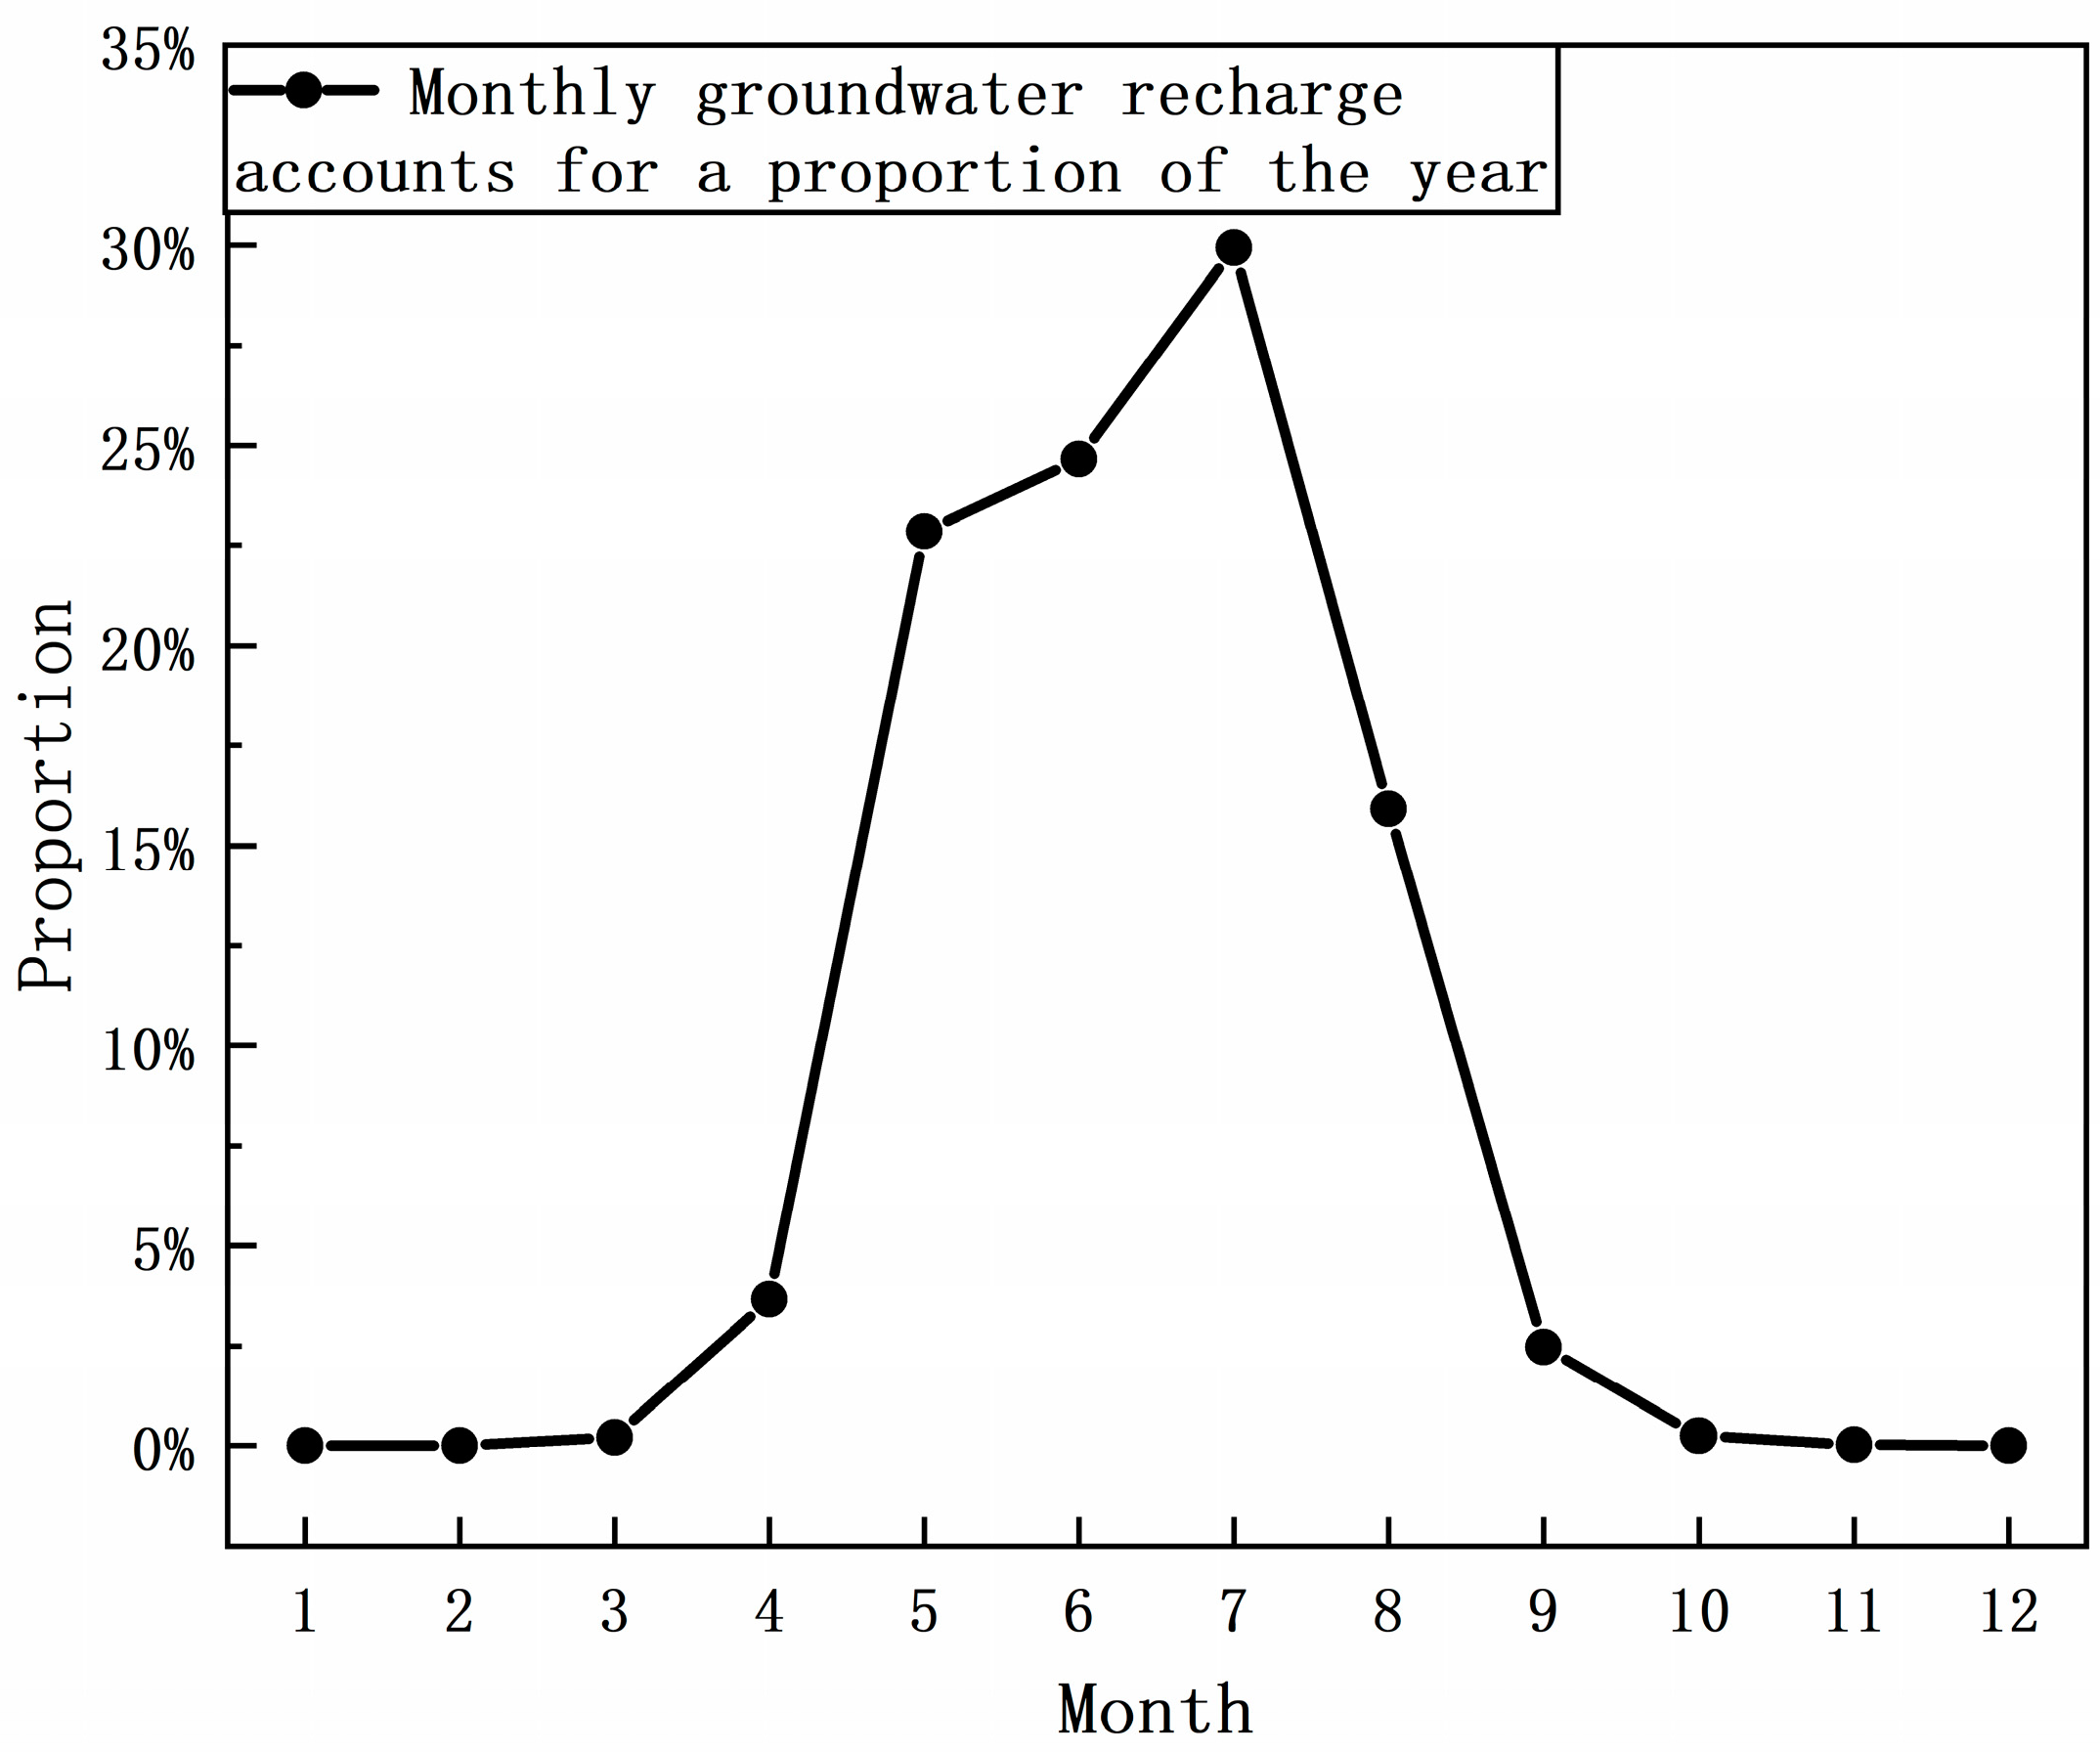
3.3.3. Groundwater Runoff Characteristics Analysis

Relevant research emphatically highlighted the substantial role of Qarqan’s groundwater in contributing to runoff. However, the exact proportion and variations of groundwater within the total runoff were persistently underreported and inadequately verified. This study extracted the contribution rate of groundwater to runoff based on the simulation results of the SWAT-Gla model, as shown in Figure 13. It can be found that from 1975 to 2019, the overall shift in the contribution rate of groundwater recharge in the research area was not significant. However, it exhibited a 1% annual growth trend from 1975 to 1989, and then it remained stable from 1990 to 2019. In summary, the groundwater recharge in the research area maintained relative stability.
The annual distribution and variation of groundwater recharge to runoff in the Qarqan River Basin can be observed in Figure 14. It can be seen that the contribution of groundwater recharge to runoff was relatively low from January to March, but it started to increase significantly from April and reached its peak in July. After that, the groundwater recharge to runoff began to decrease. Overall, groundwater recharge contributed the most to runoff during the spring and summer seasons, accounting for 95% of the total groundwater recharge amount. In contrast, the groundwater recharge contribution to runoff was relatively low during the winter and autumn seasons.
Moreover, the proportion of groundwater content in the total runoff content of the sub-basin was calculated, as shown in Figure 15; it was found that the distribution of groundwater in the Qarqan River in the sub-basin was not completely consistent, most of which was distributed between the middle and lower parts of the basin. Notably, the groundwater contents of the sub-basins sub4, sub9, and SUB14 were higher. When considering the geographical location of the Qarqan River Basin (as shown in Figure 1), it can be observed that sub4 was primarily situated in the middle and north of the Kumukuli Basin, while sub9 and SUB14 were located in the center of the Tula Basin. The total groundwater content of these three sub-basins constituted approximately 85% of the groundwater content of the Qarqan River Basin.

4. Discussion

4.1. Performance of SWAT-Gla Model

This paper presents the construction of a SWAT-Gla model, which incorporates a new glacier module based on the original SWAT model and takes into account the specific characteristics of the basin. Following the calibration of both models, it was observed that the runoff simulated using SWAT-Gla demonstrated excellent performance in all aspects. The average error was significantly reduced from 86.8% to 4.6%. The monthly runoff simulation difference was decreased from over 20 m3/s to less than 10 m3/s, and the peak flow simulation difference for each year was reduced from an average of 60 m3/s to an average of 10 m3/s. These results indicate that SWAT-Gla exhibited superior performance regarding the runoff simulation compared with the original SWAT model.
Simultaneously, it was observed that the simulation of SWAT-Gla was more closely aligned with the measured flow and more accurately reflected the actual conditions of the basin. Therefore, it can be inferred that the glacier module established in this study, which was based on material energy balance and took into account the effects of temperature and solar radiation, as well as the real-time changes in the volume of glaciers in the basin, could accurately simulate the glacier change and melting conditions in the study area.
And overall, the model was compiled using the Fortran language, enabling it to be coupled with other hydrological models. On the other hand, the parameters of SWAT-Gla were primarily obtained through calibration, suggesting that the glacier module established in this study can be applied to other glacier basins for runoff simulation.

4.2. Changes in Glacial Meltwater Resources in the Qarqan River Basin

Through the analysis of the SWAT-Gla model results, this study discovered that glacial and snowmelt runoff constituted the primary portion of the total runoff supply in the watershed, with an average proportion of 80% over multiple years. The sub-basins with higher water production also contained glaciers, and the variation in glacial and snowmelt runoff strongly aligned with temperature changes during the same period. In the study watersheds, the amount of glacial melt began to incrementally increase with the rise in temperature starting from spring, reaching its peak in July when the temperature also hit its annual high. From August onward, as the temperature started to decline, the amount of glacial melt correspondingly decreased. By November, when the temperature fell below 0 °C, the amount of glacial melt also reduced to less than 5% of the annual total.
Given the influence of climate change in recent years, the Qarqan River Basin has undergone substantial warming. Consequently, the glacial and snowmelt runoff in the basin may potentially increase further in the future [23]. At the same time, research indicated that the glaciers in the Qarqan River Basin were in a state of deficit throughout the year, while glacial and snowmelt runoff constituted the primary component of the water supply. This suggests a high likelihood that the basin will face the risk of water shortage due to accelerated glacial melting in the future. Therefore, effective management of water resources in the basin emerges as the most crucial strategy to address this impending crisis [62]. This involves implementing sustainable water management practices, developing contingency plans for potential water shortages, and promoting conservation efforts to mitigate the impacts of climate change.

4.3. Changes in Groundwater Resources in the Qarqan River Basin

The study of the annual changes in groundwater recharge shows the seasons with the most substantial groundwater contributions to runoff were summer and spring, accounting for a significant 95% of the total runoff. In contrast, the contributions during winter and autumn were comparatively minimal, around 5%. The reason for this pattern may have been that there was more glacial meltwater in the summer. The surface runoff generated by this meltwater formed groundwater through infiltration during its downstream flow. When the groundwater converged in the intermountain in the Qarqan River Basin, the multiple springs that formed replenished the runoff in the basin. This understanding of the seasonal variations in groundwater recharge and its relationship with glacial meltwater provides valuable insights for managing water resources in the Qarqan River Basin, particularly in the context of climate change.
Furthermore, this study found that the groundwater resources in the Qarqan River Basin were mainly concentrated around the Kumukuli Basin and the Tula Basin. The reason might be that the groundwater replenishment in the Kumukuli Basin was formed by the combined effects of glacial meltwater and river precipitation on both sides of the Urukusu River that ran through it. Meanwhile, the Tula Basin had a larger glacial area, and the glacial meltwater was transformed into groundwater through infiltration. Therefore, the groundwater replenishment of the Qarqan River in spring mainly came from these two basins.
The current level of groundwater development and utilization in the Qarqan River Basin is relatively low, with only a minor portion of groundwater being used for human and livestock consumption, as well as industrial use [63,64]. However, this study found that the distribution of groundwater resources in the Qarqan River Basin was relatively stable, indicating the potential for further utilization. Therefore, it is worth considering the distribution of groundwater resources obtained from this study. By adhering to the principle of balanced groundwater extraction and replenishment, rational development of groundwater resources can be achieved. This approach would help to alleviate the seasonal water shortage in the downstream oasis ecological area, providing a buffer against water scarcity [65,66]. Moreover, by optimizing the use of stable groundwater resources, the resilience of the Qarqan River Basin to climate change impacts can be enhanced and the sustainability of its water resources for future generations can be ensured.

5. Conclusions

Drawing upon the geographical and climatic characteristics of the Qarqan River Basin, this paper introduces a newly constructed glacier module, namely, the SWAT-Gla model, which is based on the original SWAT. This model was developed by integrating long-term hydrological, meteorological, and glacier observation data from the basin. The SWAT-Gla model was then employed to investigate the composition and changes of runoff in the Qarqan River Basin. The key findings of this study are as follows:
The SWAT-Gla model was shown to be effective in accurately simulating the runoff situation in the Qarqan River Basin. During the calibration period, the model demonstrated an acceptable Nash–Sutcliffe efficiency (NSE) value of 0.60, a coefficient of determination (R2) of 0.65, and a percent bias (PBIAS) of 4.6%. During the validation period, the model showed an improved performance with an NSE value of 0.72, an R2 of 0.75, and a PBIAS of 3.7%. Simultaneously, the runoff simulated by the improved SWAT-Gla model aligned well with the observed data, particularly in terms of the peak discharge and recession part, when compared with the output from the original SWAT model. The overall runoff simulation results were satisfactory. The SWAT-Gla model, with its new glacier module, could better simulate the glacial activities and melting conditions in the study area.
The glacial runoff replenishment process in the Qarqan River Basin exhibited distinct seasonal characteristics. Through the results generated by the SWAT-Gla model, it was found that the annual glacial runoff replenishment in the Qarqan River Basin constituted approximately 80% of the total runoff. This replenishment was closely tied to the basin’s temperature, both of which displayed an increasing trend. The distribution characteristics of the glacier runoff replenishment throughout the year also exhibited a strong correlation with temperature. The majority of glacial meltwater was concentrated in the period from March to September each year, accounting for about 75% of the annual glacier melt. This seasonal pattern of glacial runoff replenishment, driven by temperature variations, underscores the critical role of climate factors in shaping the hydrological dynamics of the Qarqan River Basin. Furthermore, this study found an increasing trend in the contribution of glacial meltwater replenishment to the basin runoff. Consequently, the Qarqan River may face the issue of a decrease in the overall water resource storage due to the reduction in glacial area in the future, posing greater uncertainties and challenges to the existing water resource management and flood control measures.
The groundwater in the Qarqan River Basin also had relatively stable seasonal characteristics for runoff replenishment. According to the preliminary findings from the SWAT_Gla model results, the annual contribution rate of groundwater to runoff in the Qarqan River Basin was 13%, and the groundwater replenishment was relatively stable in recent years. From the perspective of annual distribution, groundwater replenishment was mainly distributed in spring and summer, accounting for about 95%, and less in autumn and winter. From the perspective of regional distribution, groundwater resources were mainly distributed in the northern part of the Kumukuli Basin and the interior of the Tula Basin. These findings also provide new insights and data support for the rational development and utilization of groundwater in the basin.

Author Contributions

Conceptualization, J.D. and Y.W.; methodology, J.D., C.C. and Y.W.; formal analysis, J.D., C.C. and Y.W.; investigation, J.D. and Y.W.; writing—original draft preparation, J.D.; writing—review and editing, J.D., C.C. and Y.W.; visualization, J.D., W.S. and Y.W.; supervision, Y.W. All authors have read and agreed to the published version of the manuscript.

Funding

This research was funded by the Key R&D Project of Guangdong Province, grant number 2020B1111530001, funder: Y.W.; the National Natural Science Foundation of China, grant number 42177065, funder: Y.W.; and the Jiangsu Natural Resources Development Special Fund for Marine Science and Technology Innovation, grant number JSZRHYKJ202205. funder: Wen, Chen.

Institutional Review Board Statement

Not applicable.

Informed Consent Statement

Not applicable.

Data Availability Statement

The data presented in this study are available on request from the corresponding author. The data are not publicly available due to station observation data in the reserach area is somehow confidential, so some site data are not allowed to be open to public. For those data and software can be opened to public, the URL links were shown in the manuscript. Thank you very much for your kind understanding.

Conflicts of Interest

The authors declare no conflict of interest.

References

  1. Pang, J.P.; Xu, Z.X.; Liu, C.M. SWAT Model Application: State-of-the-Art Review. Res. Soil Water Conserv. 2007, 14, 31–35. [Google Scholar]
  2. Zhang, L.M.; Wang, H.; Meng, X.Y. Application of SWAT Model Driven by CMADS in Hunhe River Basin in Liaoning Province. J. North China Univ. Water Resour. Electr. Power (Nat. Sci. Ed.) 2017, 38, 1–9. [Google Scholar]
  3. Xia, J.; Zuo, Q.T. Advances in International Hydrological Science Research. Adv. Earth Sci. 2006, 21, 256–261. [Google Scholar]
  4. Li, C.F.; Gao, J.F.; Cao, H. Impacts of land-use change on water resources Current status and trends of research. Soils 2002, 45, 191–196+205. [Google Scholar] [CrossRef]
  5. Wang, Y.L.; Wang, X.; Yang, Z.F.; Tan, Y.Y. Progress in the Research and Application of Uncertainty Analysis Methods for Hydrological System. Prog. Geogr. 2011, 30, 1167–1172. [Google Scholar]
  6. Perez-Valdivia, C.; Cade-Menun, B.; McMartin, D.W. Hydrological modeling of the pipestone creek watershed using the Soil Water Assessment Tool (SWAT): Assessing impacts of wetland drainage on hydrology. J. Hydrol. Reg. Stud. 2017, 14, 109–129. [Google Scholar] [CrossRef]
  7. Bhatta, B.; Shrestha, S.; Shrestha, P.K.; Talchabhadel, R. Evaluation and application of a SWAT model to assess the climate change impact on the hydrology of the Himalayan River Basin. Catena 2019, 181, 104082. [Google Scholar] [CrossRef]
  8. Wang, X.L.; Luo, Y.; Sun, L.; Shafeeque, M. Different climate factors contributing for runoff increases in the high glacierized tributaries of Tarim River Basin, China. J. Hydrol. Reg. Stud. 2021, 36, 100845. [Google Scholar] [CrossRef]
  9. Fang, G.H.; Yang, J.; Chen, Y.; Li, Z.; Ji, H.; De Maeyer, P. How Hydrologic Processes Differ Spatially in a Large Basin: Multisite and Multiobjective Modeling in the Tarim River Basin. J. Geophys. Res. Atmos. 2018, 123, 7098–7113. [Google Scholar] [CrossRef]
  10. He, K.L. Multi-Source Precipitation Data Fusion and Its Application over the Tibetan Plateau. Master’s Thesis, Xihua University, Chengdu, China, 2022. [Google Scholar]
  11. Sun, R.; Zhang, X.Q. Muskingum Model Parameters Recognition Based on Immune Particle Swarm Algorithm. J. China Hydrol. 2010, 30, 28–32+47. [Google Scholar]
  12. Bliss, A.; Hock, R.; Radić, V. Global response of glacier runoff to twenty-first century climate change. J. Geophys. Res. Earth Surf. 2014, 11, 717–730. [Google Scholar] [CrossRef]
  13. Zhao, H.; Li, H.; Xuan, Y.; Li, C.; Ni, H. Improvement of the SWAT Model for Snowmelt Runoff Simulation in Seasonal Snowmelt Area Using Remote Sensing Data. Remote Sens. 2022, 14, 5823. [Google Scholar] [CrossRef]
  14. Meng, X.Y.; Ji, X.N.; Liu, Z.H.; Xiao, J.C.; Chen, X.; Wang, F. Research on Improvement and Application of Snowmelt Module in SWAT. J. Nat. Resour. 2014, 29, 528–539. [Google Scholar]
  15. Zhang, Q.M. Temporal and Spatial Variation of the Typical Glaciers Activity Analysis with Multi-Source Spaceborne Imagery in Qinghai-Tibet Plateau. Master’s Thesis, China University of Mining & Technology, Xuzhou, China, 2022. [Google Scholar]
  16. Wu, X.J.; Shen, Y.P.; Wang, N.L.; Pan, X.D.; Zhang, W.; He, J.Q.; Wang, G.Y. Coupling the WRF model with a temperature index model based on remote sensing for snowmelt simulations in a river basin in the Altay Mountains, north-west China. Hydrol. Process. 2016, 30, 3967–3977. [Google Scholar] [CrossRef]
  17. Peng, J.J.; Xu, L.P.; Cao, C. Spatio-temporal evolution of glacier landscape pattern in the Yarkant River Basin from1991 to 2017. Acta Ecol. Sin. 2022, 42, 8265–8275. [Google Scholar]
  18. Song, X.Y.; Xu, M.; Li, Z.Z.; Yang, C.D. Study on Variation Characteristics of Extreme Climate and Its Impacts on Runoff in Yarkant Basin. J. China Hydrol. 2023, 43, 52–57. [Google Scholar] [CrossRef]
  19. Wu, Y.N. The Study on Evaluation and Distribution of Ecoenvironmental Sensitivity in the Middle and Lower Reaches of Che’erchen River. Master’s Thesis, Xinjiang University, Urumqi, China, 2008. [Google Scholar]
  20. Zhu, G.; Gao, H.J.; Zeng, G.; Jin, M.S. Variation of Wetland Landscape Pattern and Its Ecological Effects in the Green Corridor of the Arid Inland in Northwest China: A Case Study of the Lower Reaches of the Qarqan River. Remote Sens. Nat. Resour. 2010, 23, 219–223. [Google Scholar]
  21. Abdimijit, A.; Alimujiang, K.; Alishir, K.; Manzira, T. The Cherchen River watershed in Xinjiang: Macroscopic spatiotemporal variation, controlling and driving effects. J. Glaciol. Geocryol. 2015, 37, 480–492. [Google Scholar] [CrossRef]
  22. Liu, Y.S.; Ding, J.Y.; Zhan, Y.; Shangguan, D.H.; Liu, J.; Han, H.D.; Wang, J.; Xie, C.W. Impact of the Glacial Change on Water Resources in the Tarim River Basin. Acta Geogr. Sin. 2006, 61, 482–490. [Google Scholar]
  23. Da, W.; Wang, S.F.; Shen, Y.P.; Chen, A.A.; Mao, W.Y.; Zhang, W. Hydrological response to the climatic changes in the Qarqan River basin at the northern slope of Kunlun Mountains during 1957–2019. J. Glaciol. Geocryol. 2022, 44, 46–55. [Google Scholar] [CrossRef]
  24. Wang, R.H.; Sun, H.B.; Zhao, Z.Y. Analysis on the Mechanism and Driving Forces of Land Use/cover Change in the Qiemo Oasis, Xinjiang. Arid Land Geogr. 2005, 28, 849–855. [Google Scholar] [CrossRef]
  25. Liu, T.T.; Zhu, X.F.; Guo, R.; Xu, K.; Zhang, S.Z. Applicability of ERA5 reanalysis of precipitation data in China. Arid Land Geogr. 2022, 45, 66–79. [Google Scholar]
  26. Meng, X.G.; Guo, J.J.; Han, Y.Q. Preliminarily assessment of ERA5 reanalysis data. J. Mar. Meteorol. 2018, 38, 91–99. [Google Scholar] [CrossRef]
  27. Yao, F.; Yang, X.Q.; Liu, M.J.; Zhang, Y.Q. Performance Evaluation of ERA5 Reanalysis Precipitation Data in the Yangtze River Delta. J. Soil Water Conserv. 2022, 36, 178–189. [Google Scholar] [CrossRef]
  28. Liu, T.T.; Zhu, X.F.; Zhang, S.Z.; Xu, K.; Guo, R. Applicability analysis of ERA5 reanalysis surface air temperature data in China. J. Trop. Meteorol. 2023, 39, 78–88. [Google Scholar] [CrossRef]
  29. Shan, S.; Shen, R.P.; Shi, C.X.; Bai, L.; Sun, S. Evaluation of Land Surface Temperature and 2 m Air Temperature from Five Reanalyses Datasets across North China in Winter. Plateau Meteorol. 2020, 39, 37–47. [Google Scholar] [CrossRef]
  30. Ma, Y.; Liu, J.; Mamtimin, A.; Aihaiti, A.; Xu, L. Validation of FY-4A Temperature Profiles by Radiosonde Observations in Taklimakan Desert in China. Remote Sens. 2023, 15, 2925. [Google Scholar] [CrossRef]
  31. Wei, X.N.; Long, A.H.; Ying, Z.L.; Yu, J.W. Simulation of response of glacier runoff to climate change in the Hotan River Basin. Water Resour. Prot. 2022, 38, 137–144. [Google Scholar] [CrossRef]
  32. Touseef, M.; Chen, L.; Chen, H.; Gabriel, H.F.; Yang, W.; Mubeen, A. Enhancing Streamflow Modeling by Integrating GRACE Data and Shared Socio-Economic Pathways (SSPs) with SWAT in Hongshui River Basin, China. Remote Sens. 2023, 15, 2642. [Google Scholar] [CrossRef]
  33. Wu, L.Z.; Li, X. Dataset of the First Glacier Inventory in China; Cold and Arid Regions Science Data Center at Lanzhou: Lanzhou, China, 2004. [Google Scholar] [CrossRef]
  34. Liu, S.Y.; Guo, W.Q.; Xu, J.L. The second Chinese glacier inventory: Data, methods and results. J. Glaciol. 2015, 61, 357–372. [Google Scholar] [CrossRef]
  35. Huang, T.; Wu, Z.; Xiao, P.; Sun, Z.; Liu, Y.; Wang, J.; Wang, Z. Possible Future Climate Change Impacts on the Meteorological and Hydrological Drought Characteristics in the Jinghe River Basin, China. Remote Sens. 2023, 15, 1297. [Google Scholar] [CrossRef]
  36. Gebeyehu, B.M.; Jabir, A.K.; Tegegne, G.; Melesse, A.M. Subbasin Spatial Scale Effects on Hydrological Model Prediction Uncertainty of Extreme Stream Flows in the Omo Gibe River Basin, Ethiopia. Remote Sens. 2023, 15, 611. [Google Scholar] [CrossRef]
  37. Brock, B.W.; Willis, I.C.; Sharp, M.J.; Arnold, N.S. Modelling seasonal and spatial variations in the surface energy balance of Haut Glacier d’Arolla, Switzerland. Ann. Glaciol. 2000, 31, 53–62. [Google Scholar] [CrossRef]
  38. Chen, J.Z.; Qin, X.; Wu, J.K.; Du, W.T.; Sun, W.J.; Liu, Y.S.; Huang, Z.; Yang, J.H. Simulating the energy and mass balances on the Laohugou Glacier No.12 in the Qilian Mountains. J. Glaciol. Geocryol. 2014, 36, 38–47. [Google Scholar] [CrossRef]
  39. Li, J.J.; Li, J.; Wu, L.X.; Wang, Y.Z.; Guo, L. Simulating surface energy and mass balance of the Puruogangri ice cap during 2012–2014 based on High Asia Refined analysis data. Arid Zone Res. 2021, 38, 919–929. [Google Scholar] [CrossRef]
  40. Li, H.L.; Wang, P.Y.; Li, Z.Q.; Jin, S.; Xun, C.H.; Liang, P.B.; Yue, X.Y.; Yang, M. Study on the energy-mass balance simulation of the east branch of the Urumqi Glacier No.1, Tianshan Mountains. J. Glaciol. Geocryol. 2021, 43, 24–35. [Google Scholar] [CrossRef]
  41. Liu, W.G.; Xiao, C.D.; Liu, J.S.; Wang, J.; Wang, H.; Liu, J.F.; Liu, N.; Zhang, T.; Lin, X.; Deng, S.G. Study of the degree-day factors on the Rongbuk Glacier in the Mt. Qomolangma, Central Himalayas. J. Glaciol. Geocryol. 2014, 36, 1101–1110. [Google Scholar]
  42. Wang, T.X. Manas River Basin Based on Distributed Degree Day Model Study on Glacier Material Balance. Master’s Thesis, Shihezi University, Shihezi, China, 2022. [Google Scholar]
  43. Liu, J.; Zhang, W.; Xia, J.; Shen, Y.P.; Kang, S.C. Study of degree-day model from 2000 to 2016: The main progress and key issues. J. Glaciol. Geocryol. 2017, 39, 801–810. [Google Scholar]
  44. Braithwaite, R.J.; Zhang, Y. Sensitivity of mass balance of five Swiss glaciers to temperature changes assessed by tuning a degree-day model. J. Glaciol. 2000, 46, 7–14. [Google Scholar] [CrossRef]
  45. Fang, X.Y.; Li, Z.Q.; Bernd, W.; Gao, S.; Chen, R.S. Physical energy-balance and statistical glacier melting models comparison and testing for Shiyi Glacier, Heihe River Basin, Qilian M ountains, China. J. Glaciol. Geocryol. 2015, 37, 336–350. [Google Scholar] [CrossRef]
  46. Hock, R. Glacier melt: A review of processes and their modeling. Prog. Phys. Geogr. 2005, 29, 362–391. [Google Scholar] [CrossRef]
  47. William, P.K.; Albert, R.; Remko, U. A simple energy budget algorithm for the snowmelt runoff model. Water Resour. Res. 1994, 30, 1515–1527. [Google Scholar] [CrossRef]
  48. Wang, X.; Luo, Y.; Sun, L.; He, C.; Zhang, Y.; Liu, S. Attribution of runoff decline in the Amu Darya River in Central Asia during 1951–2007. J. Hydrometeorol. 2016, 17, 1543–1560. [Google Scholar] [CrossRef]
  49. Yin, Z.; Feng, Q.; Liu, S.; Zou, S.; Li, J.; Yang, L.; Deo, R.C. The Spatial and Temporal Contribution of Glacier Runoff to Watershed Discharge in the Yarkant River Basin, Northwest China. Water 2017, 9, 159. [Google Scholar] [CrossRef]
  50. Yang, C.; Xu, M.; Fu, C.; Kang, S.; Luo, Y. The Coupling of Glacier Melt Module in SWAT+ Model Based on Multi-Source Remote Sensing Data: A Case Study in the Upper Yarkant River Basin. Remote Sens. 2022, 14, 6080. [Google Scholar] [CrossRef]
  51. Luo, Y.; Arnold, J.; Liu, S.Y.; Wang, X.Y.; Chen, X. Inclusion of glacier processes for distributed hydrological modeling at basin scale with application to a watershed in Tianshan Mountains, northwest China. J. Hydrol. 2013, 477, 72–85. [Google Scholar] [CrossRef]
  52. Arnold, J.G.; Srinivasan, R.; Muttiah, R.S.; Williams, J.R. Large area hydrologic modeling and assessment part I: Model development. JAWRA J. Am. Water Resour. Assoc. 1998, 34, 73–89. [Google Scholar] [CrossRef]
  53. Liu, W. Hydrological Simulation and Runoff Response Analysis Based on SWAT Model: A Case Study of Weihe River in Guanzhong Area. Ph.D. Thesis, Northwest University, Kirkland, WA, USA, 2014. [Google Scholar]
  54. Zuo, D.P.; Xu, Z.X. Distributed Hydrological Simulation Using Swat and Sufi-2 in The Wei River Basin. J. Beijing Norm. Univ. (Nat. Sci.) 2012, 48, 490–496. [Google Scholar]
  55. Moriasi, D.; Arnold, J.; Van Liew, M.W.; Bingner, R.; Harmel, R.; Veith, T. Model evaluation guidelines for systematic quantification of accuracy in watershed simulations. Trans. ASABE 2007, 50, 885–900. [Google Scholar] [CrossRef]
  56. Bennour, A.; Jia, L.; Menenti, M.; Zheng, C.; Zeng, Y.; Asenso Barnieh, B.; Jiang, M. Calibration and Validation of SWAT Model by Using Hydrological Remote Sensing Observables in the Lake Chad Basin. Remote Sens. 2022, 14, 1511. [Google Scholar] [CrossRef]
  57. Liu, J.; Long, A.; Deng, X.; Yin, Z.; Deng, M.; An, Q.; Gu, X.; Li, S.; Liu, G. The Impact of Climate Change on Hydrological Processes of the Glacierized Watershed and Projections. Remote Sens. 2022, 14, 1314. [Google Scholar] [CrossRef]
  58. Senent-Aparicio, J.; Blanco-Gómez, P.; López-Ballesteros, A.; Jimeno-Sáez, P.; Pérez-Sánchez, J. Evaluating the Potential of GloFAS-ERA5 River Discharge Reanalysis Data for Calibrating the SWAT Model in the Grande San Miguel River Basin (El Salvador). Remote Sens. 2021, 13, 3299. [Google Scholar] [CrossRef]
  59. Li, Y.; Wang, W.; Wang, G.; Yu, S. Evaluation and Hydrological Application of a Data Fusing Method of Multi-Source Precipitation Products-A Case Study over Tuojiang River Basin. Remote Sens. 2021, 13, 2630. [Google Scholar] [CrossRef]
  60. Cidan, Y.Z. Evaluation on the Contribution of Snowmelt to Spring Runoff in the Baishan Basin of the Cold Northeast Region. Master’s Thesis, Jilin University, Changchun, China, 2022. [Google Scholar]
  61. Fan, Z.L.; Xu, H.L.; Zhang, P.; Zhao, X.F.; Abudu, M.J.T.; Fu, J.Y. The Qarqan River in Xinjiang and Its Water Resources Utilization. Arid Zone Res. 2014, 31, 20–26. [Google Scholar] [CrossRef]
  62. Abdirahman, H. Sustainable development of groundwater of Cheerchen rever basin in Xinjiang. J. Arid Land Resour. Environ. 2012, 26, 68–75. [Google Scholar] [CrossRef]
  63. Deng, L.J. Study on the Change of Major Hydrological Factors during the Past 50 Years in Che’erchen River Basin. Master’s Thesis, Xinjiang Agricultural University, Urumqi, China, 2008. [Google Scholar]
  64. Lu, Z.L. Study on Optimal Allocation of Agricultural Water Resources in Arid Region—Resources in Arid Region. Master’s Thesis, Xinjiang Agricultural University, Urumqi, China, 2009. [Google Scholar]
  65. Wang, X.J.; Zhang, X.L.; Du, H.R.; Li, X.M. Relationship between urbanization and water use in Tarim River: A case of Bayingolin Mongol Autonomous Prefecture. Arid Land Geogr. 2012, 35, 324–331. [Google Scholar]
  66. Abdirahman, H.; Wahap, H.; Bian, Z.F. The Quantitative analysis of coupling system sustainable development of oasis water resources-ecological environment-economic society. J. Arid Land Resour. Environ. 2010, 24, 26–31. [Google Scholar]
Figure 1. Location of the Qarqan River Basin and hydrological stations.
Sustainability 15 16046 g001
Figure 2. (a) Soil data for the Qarqan River Basin; (b) land-use data for the Qarqan River Basin.
Sustainability 15 16046 g002
Figure 3. Comparison figures of observed data and corresponding ERA5 data.
Sustainability 15 16046 g003
Figure 4. Framework of SWAT-Gla model (T: average temperature of the day;The red box is the Glacier module).
Sustainability 15 16046 g004
Figure 5. Sub-basin delineation distribution map of the Qarqan River Basin.
Sustainability 15 16046 g005
Figure 6. Parameter sensitivity scores in the Qarqan River Basin.
Sustainability 15 16046 g006
Figure 7. Comparison of simulated versus measured monthly streamflow processes; calibration period: January 1975 to December 2009; validation period: January 2010 to December 2019.
Sustainability 15 16046 g007
Figure 8. Proportion of multi-year water production compared with total water production in sub-basins.
Sustainability 15 16046 g008
Figure 9. Relationship between runoff and temperature in SUB14, SUB19, SUB24, and SUB28.
Sustainability 15 16046 g009
Figure 10. Relationship between contribution rate of glacial melt and temperature in Qarqan River Basin.
Sustainability 15 16046 g010
Figure 11. Monthly distribution of glacial meltwater in the Qarqan River Basin.
Sustainability 15 16046 g011
Figure 12. Monthly distribution of glacial meltwater in SUB11, SUB13, SUB20, and SUB25.
Sustainability 15 16046 g012
Figure 13. Relationship between temperature and groundwater recharge contribution rate to runoff in the Qarqan River Basin.
Sustainability 15 16046 g013
Figure 14. Monthly distribution of groundwater recharge in the Qarqan River Basin.
Sustainability 15 16046 g014
Figure 15. Groundwater resources in the Qarqan River Basin.
Sustainability 15 16046 g015
Table 1. Meteorological database data that drove SWAT models of the Qarqan River Basin.
DataData Period (Year)ResolutionSource
Precipitation data1970–2019Qiemo stationDaily precipitation data measured by hydrological stations
Temperature data1970–20190.1° × 0.1°ERA5
Solar radiation data1970–20190.1° × 0.1°ERA5
Wind speed data1970–2019Qiemo stationDaily precipitation data measured by hydrological stations
Relative humidity data1970–20190.1° × 0.1°ERA5
Table 2. Table of hydrological model parameters in the Qarqan River Basin.
ModelParameterDescription
SWAT parametersCN2Data
SOL_KSCS runoff curve number f
ESCOSaturated hydraulic conductivity
SOL_ZSoil evaporation compensation factor
GWQMNDepth from the soil surface to bottom of the layer
ALPHA_BFThreshold depth of water in the shallow aquifer required for return flow to occur
SOL_AWCBaseflow alpha factor
GW_REVAPAvailable water capacity of the soil layer
GW_DELAYGroundwater revap coefficient
CH_K2Groundwater delay
CH_N2Effective hydraulic conductivity in main channel alluvium
SOL_ALBManning’s n value for the main channel
SFTMPMoist soil albedo
SMTMPSnowfall temperature
SMFMXSnow melt base temperature
SMFMNMaximum melt rate for snow during the year
TIMPMinimum melt rate for snow during the year
SWAT-Gla
Extra parameters
GMFMXGlacial melt factors for 21 June
GMFMNGlacial melt factors for 21 December
SRFSolar radiation parameters
GMTMPGlacial melt base temperature
β0Glacial accumulation coefficient
Table 3. Comparison table of observed and simulated four-season flow distribution in the Qarqan River Basin.
SeasonAccounts for Annual Runoff (%)SWAT-GlaSWAT
Spring29.117.80.4
Summer46.647.00.4
Autumn16.925.462.4
Winter7.49.836.8
Table 4. Monthly streamflow calibration and validation results for Qarqan River Basin.
ModelNSER2PBIAS (%)
SWAT (calibration)−0.750.34>30
SWAT (validation)−1.850.24>30
SWAT-Gla (calibration)0.600.654.6
SWAT-Gla (validation)0.720.753.9
Disclaimer/Publisher’s Note: The statements, opinions and data contained in all publications are solely those of the individual author(s) and contributor(s) and not of MDPI and/or the editor(s). MDPI and/or the editor(s) disclaim responsibility for any injury to people or property resulting from any ideas, methods, instructions or products referred to in the content.

