Article

Variation of Stem CO2 Efflux and Estimation of Its Contribution to the Ecosystem Respiration in an Even-Aged Pure Rubber Plantation of Hainan Island

1
College of Ecology and Environment, Hainan University, Haikou 570228, China
2
Rubber Research Institute, Chinese Academy of Tropical Agricultural Sciences, Haikou 571101, China
3
Hainan Danzhou Tropical Agro-Ecosystem National Observation and Research Station, Danzhou 571737, China
4
Hainan Research Academy of Environmental Sciences, Haikou 571127, China
*
Author to whom correspondence should be addressed.
Sustainability 2023, 15(22), 16050; https://doi.org/10.3390/su152216050
Submission received: 6 October 2023 / Revised: 9 November 2023 / Accepted: 14 November 2023 / Published: 17 November 2023

Abstract

:
The stem CO2 efflux (Es) plays an important role in the carbon balance in forest ecosystems. However, a majority of studies focus on ecosystem flux, and little is known about the contribution of stem respiration to ecosystem respiration (Reco) for rubber (Hevea brasiliensis) plantations. We used a portable CO2 analyzer to monitor the rate of Es in situ at different heights (1.5 m, 3.0 m and 4.5 m) in an even-aged rubber plantation from 2019 to 2020. Our results showed that Es exhibited a significant seasonal difference with a minimum value in April and a maximum in September. The mean annual rate of Es at 3.0 m in height (1.65 ± 0.52 μmol·m−2·s−1) was slightly higher than Es at 4.5 m in height (1.56 ± 0.59 μmol·m−2·s−1) and Es at 1.5 m in height (1.51 ± 0.48 μmol·m−2·s−1). No obvious differences in vertical variations were found. An area-based method (Ea) and a volume-based method (Ev) were used to estimate stem respiration at stand levels. One-way ANOVA showed that Ea had no obvious differences in vertical variation (p = 0.62), and Ev indicated differences in vertical variation (p < 0.05). Therefore, the Ea chamber-based measurements at breast height were reasonable and practical extrapolation proxies of stem respiration in an even-aged rubber plantation. With the use of the area-based method, the stem carbon values released from a mature rubber forest were estimated to be 1.214 t C·hm−2·a−1 in 2019 and 1.414 t C·hm−2·a−1 in 2020. Ea/Reco and Ev/Reco showed seasonal changes, with a minimum value in April and a maximum value in December. The leaf area index (LAI) and soil volumetric moisture content (VWC) were the major impact factors of Ea/Reco in an even-aged pure rubber plantation.

1. Introduction

Autotrophic respiration is the key process in gross primary productivity (GPP) of forest ecosystems, which consumes 60% of the total carbon fixed during photosynthesis [1]. Stem respiration can account for 10% to 42% of the total carbon budget of the aboveground portion in a tree, which is equal to or higher than leaf respiration in forests [2]. Therefore, considering the contribution of stem respiration when examining gas exchange in forest ecosystems is important.
The stem CO2 efflux (Es) is a complicated process. The CO2 efflux in tree stems can diffuse radially to the atmosphere or dissolve in the xylem sap and storage within a tree [3]. There is few methods that can directly measure the rate of woody tissue respiration [4,5,6,7]. Previous studies estimated the stand level of stem respiration by expressing the local respiration rate based on stem surface area [8,9,10,11]. However, due to the large vertical variation in the stem respiration rate, completing an estimation with an area-based approach is still uncertain [11,12,13,14]. Other biochemical processes within the trees may cause underestimation or overestimation of stem respiration [15,16,17,18]. Some of the CO2 released by the respiring cells diffuses into the atmosphere, but the amount is often obscured by the simultaneous diffusion of CO2 that has been transported in the xylem from the roots and rhizosphere [19,20,21,22]. The CO2 produced by the respiring cells from the stems and roots diffuses radially out through the bark, but is also transported upward by xylem sap flow [6,23].
Roo et al. [24] found partial refixation of CO2 via photosynthesis within woody tissues. This recycling mechanism can even reuse more than half of the carbon losses in the stem CO2 efflux [19,24,25]. Thus, quantifying the within-stem variation in the respiration rate and its seasonal pattern for each species is important. These processes have been seldom studied in tropical forests, in part due to the complexities of measuring such processes [21], especially in remote and challenging field locations. Therefore, stem respiration estimation and expansion can be simplified in a pure plantation consisting of a single species with uniform planting and management.
Recent research has shown that Es is strongly affected by climatic factors [26,27]. Air temperature (Ta) and humidity are typically considered the most crucial factors, as both impact the respiratory substrate and cell physiological activity [27,28]. In addition to internal sap flow dynamics, many integrated factors regulate CO2 production and diffusion from the stem to the atmosphere, such as species, tree age, diameter, the edge volume and nitrogen content of the trunk [29,30,31]. Likewise, the leaf area index (LAI) plays an important role in the exchange of energy, carbon and water between forests and the atmosphere [32,33,34]. As such, LAI is likely a useful predictor of Es variations at spatial and temporal levels, such as boreal, temperate, and tropical forest [35,36]. The net ecosystem carbon exchange (NEE) represents the carbon balance of the rubber plantation, and previous studies found differences in environmental factors (e.g., average air temperature (Ta), −5 cm soil temperature (Ts), vapor pressure deficit (VPD) and −5 cm soil volume water content (VWC) showed a different intensity with a negative correlation), meaning that the increase in these factors reduces the carbon uptake in rubber plantations [37].
Rubber trees are strategically important and economically valuable agricultural resources that are widely grown in tropical regions. Rubber plantations are man-made forest ecosystems, with fixed carbon (photosynthesis) and released CO2 (respiration) values. They effectively reduce carbon dioxide levels in the atmosphere, and provide a huge ecological carbon sink [38]. On the other hand, tapping for latex is an important aim for planting rubber trees. However, with the increasing demand in rubber and advocating advancements in management and technology, the question of how to sustainably obtain dry rubber and reduce the environmental impact is the aim of sustainable development. Therefore, the scientific and reasonable development of rubber plantations in tropical regions is a major challenge [38,39]. Rubber plantations are one of the most important types of tropical forests in southern China. Currently, rubber plantations occupy a total area of 1.161 × 10⁶ hectares in Yunnan, Hainan and Guangdong Provinces [40]. In this study, our primary goal was to (1) explore the seasonal and spatial patterns of Es, (2) determine the effects of primary integrated factors effect on Es according to the temporal scale, and (3) estimate the stem respiration at stand level through a practical extrapolation proxy and obtain the total contribution of ecosystem respiration.

2. Materials and Methods

2.1. Study Area

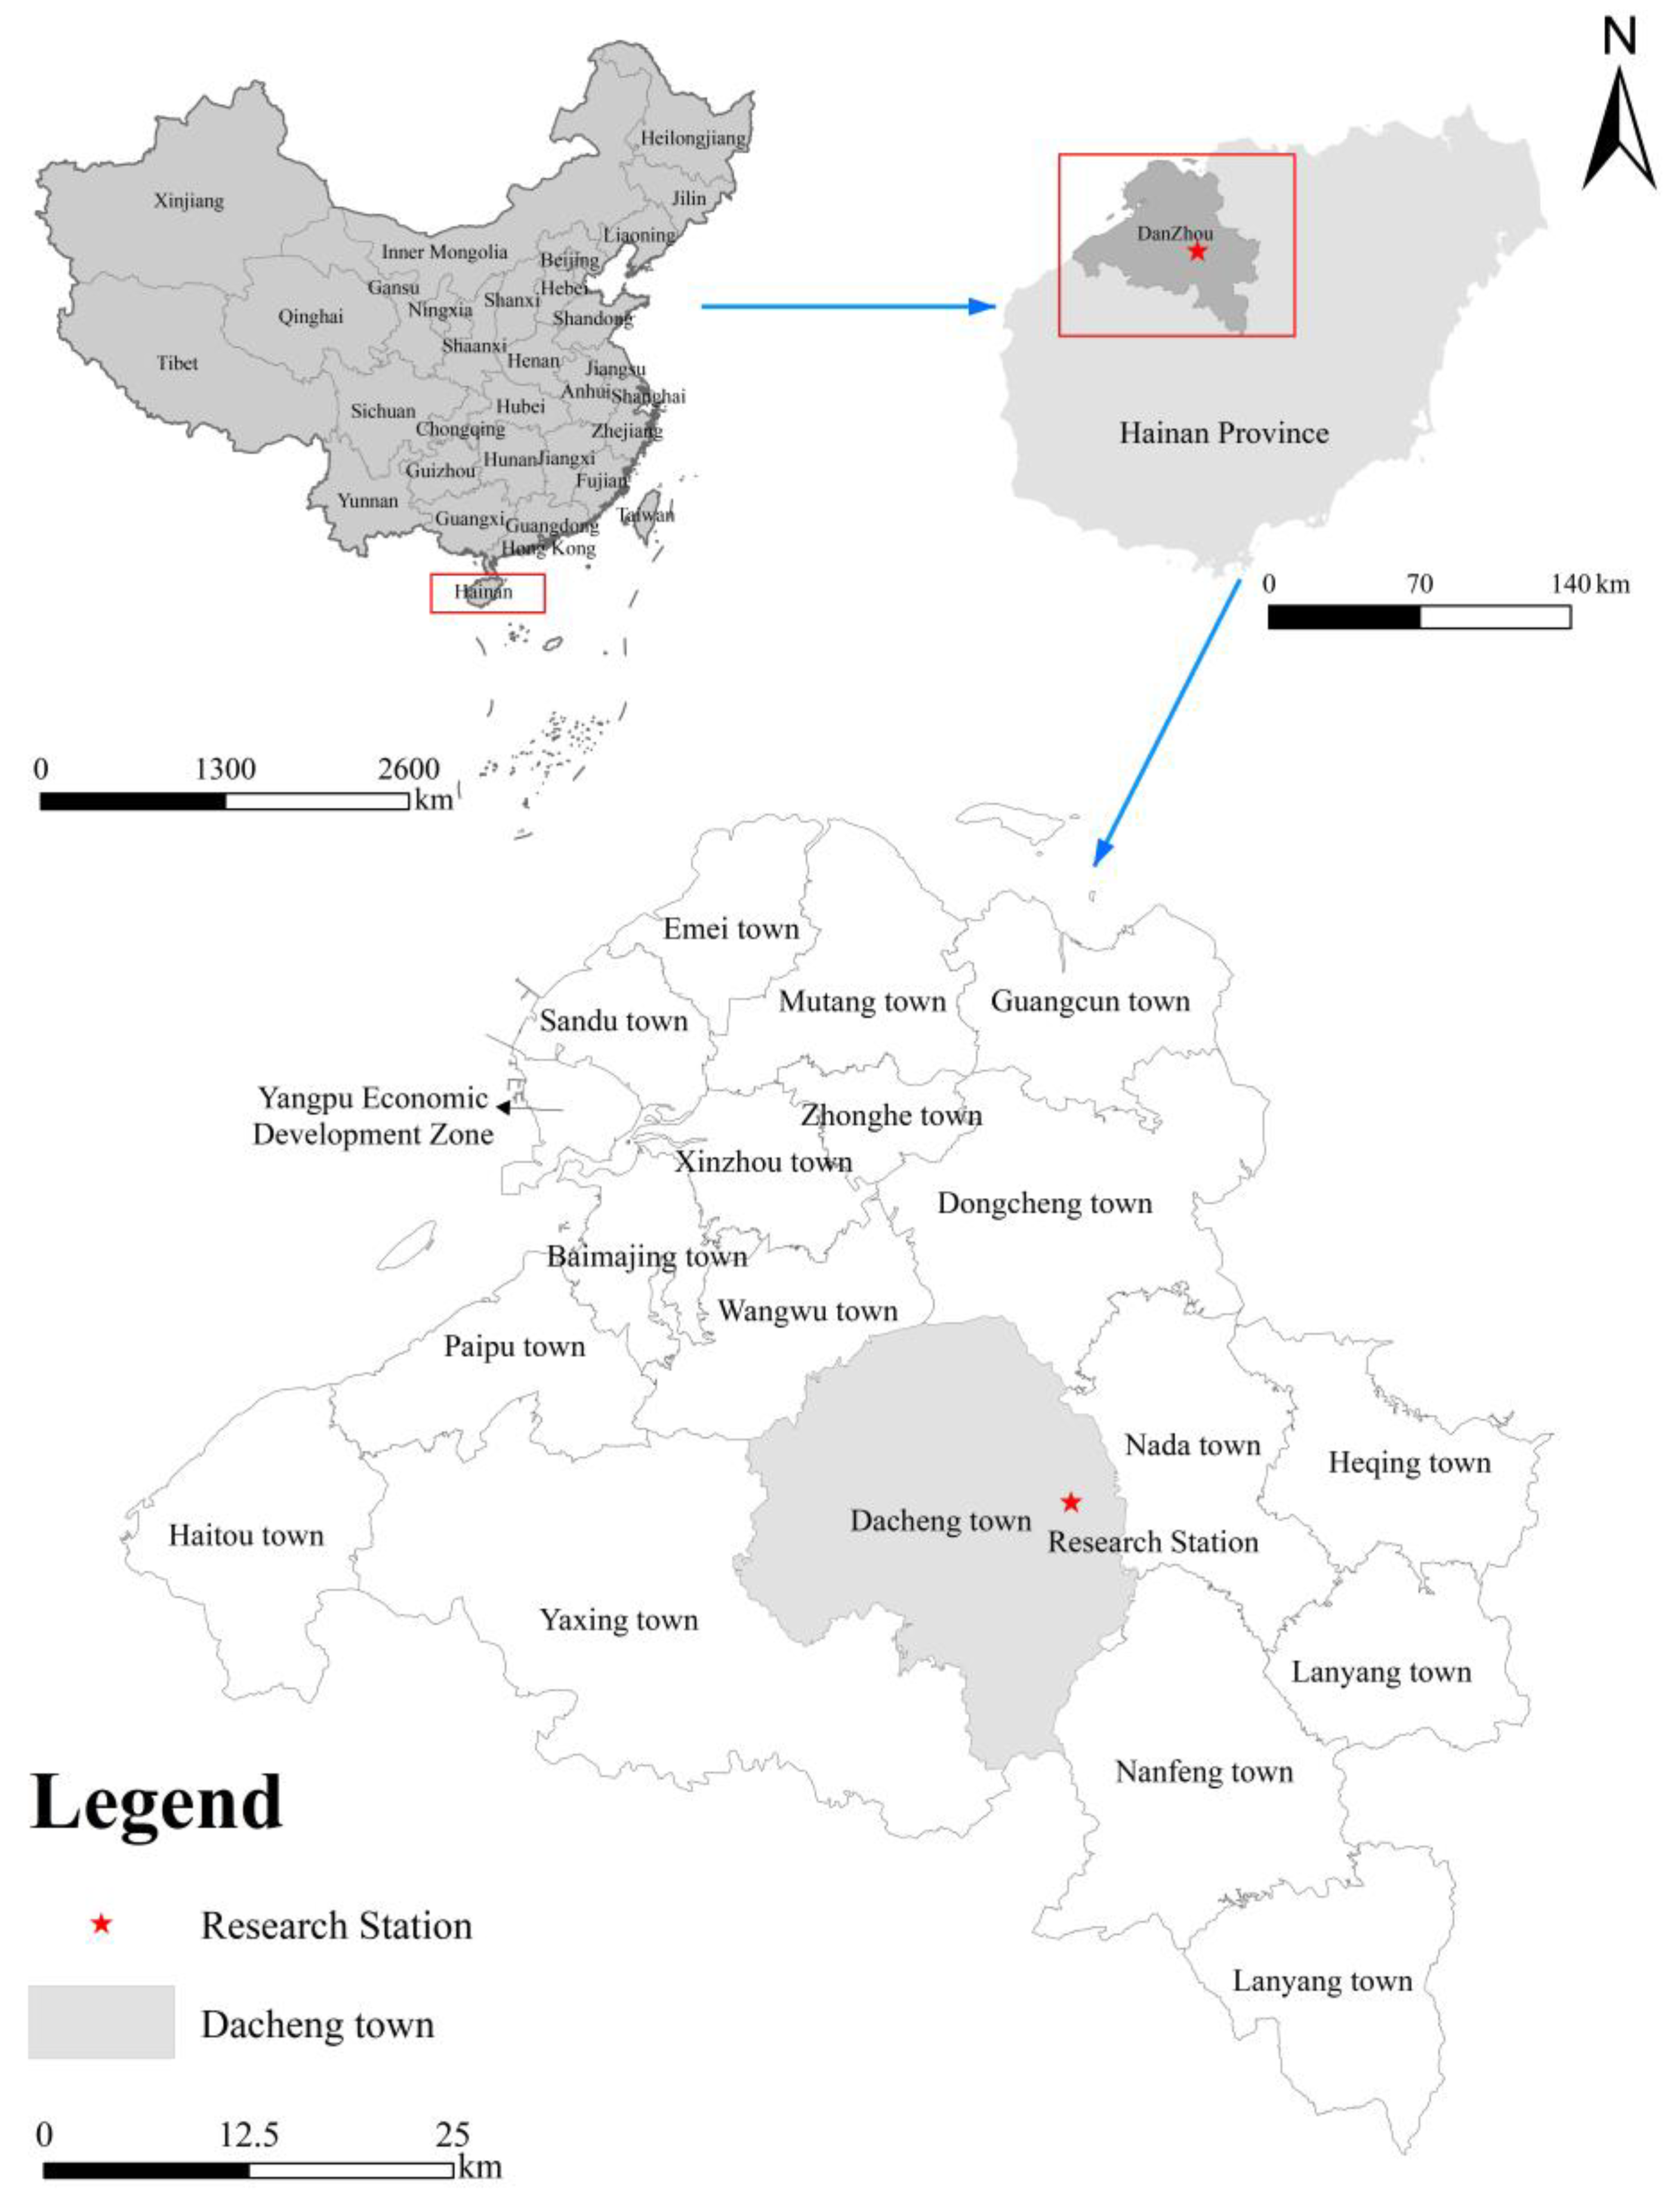
This study was conducted in an even-aged pure rubber plantation of a research and experiment station. It is located in Danzhou Tropical Agro-ecosystem National Observation and Research Station of Hainan Island (19°32′47″ N, 109°28′31″ E, elevation 144 m, Figure 1) in southern China. It has a tropical island monsoon climate with abundant water and heat conditions. Thus, clear seasonality is observed, which we could roughly divide into a dry season (November to next April) and a rainy season (May to October). According to weather station data, the mean annual temperature on this island is 24.1 °C. The multiyear mean annual precipitation is 1607 mm, with around 70% distributed in July, August and September. The relative humidity is as high as 83%. The observed annual solar radiation is 486 kJ per cm2, and the annual sunshine hours are around 2100 h.
The terrain of the site is generally flat. The soil type consists of latosol with a pH varying from 4.59 to 5.93. The mean soil depth is around 1 m and mostly has sandy clay loam. Rubber plantations are widely distributed in this area. The sample trees (PR107) were planted in 2001. The planting density comprises 476 rubber trees per hectare, with tree row distance of 3 m and interrow distance of 7 m. Tapping for latex is an important aim for planting rubber trees. Bark of the rubber tree is partially cut through and is called tapping, with the milky liquid exuding from the wound called latex. In most cases, production commences when a rubber tree is 7 or 8 years old. With the scientific management, the tapping life of rubber can extend to more than 20 years [37,38]. In this study, the sampling trees have been tapped for 12 years (Table 1). Generally, April to November is the annual tapping season, but this is not strict in the case of field work.
The mean height of rubber trees is 17.2 m and the mean canopy of height is 16.0 m. The mean diameter at breast height (DBH) of rubber trees was around 21.0 cm in 2021 (Table 1). Some herbs grow beneath the pure rubber tree stand, such as Cyrtococcum Patens, Eupatorium odoratum L., Urena lobata, Ottochloa nodosa, Elephantopus scaber L., Borrenia Articulalis and Phyllanthus simplex. As a part of the experimental station, a 50 m tall iron tower was established in 2010 for long-term meteorological and flux recordings. Sensors are installed on this tower, as shown in the next section. Previous studies showed that almost 80% of the cumulative turbulent flux footprint was covered by the corresponding rubber plantation [37,38]. The data of the flux tower can truly and effectively represent the flux of the rubber plantation.

2.2. Impacting Factor Measurements

We collected Ta data from the iron tower. The Ts and VWC were measured with a soil thermocouple probe (TCAV-L, Campbell Scientific, Logan, UT, USA) and water content reflectometer (CS616, Campbell Scientific, Logan, UT, USA). The measurements were conducted every 30 min, and the data were controlled and stored in a datalogger (CR1000, Campbell Scientific, USA). Due to technical failures, we missed data in August 2019. Since LAI is a good indicator of canopy photosynthesis and respiration [35,36], we took two LAI measurements a month during fieldwork. The data were measured with a canopy analyzer (LAI-2200C, LI-Cor Inc., Lincoln, NE, USA), which inverted LAI from light transmittance recordings.

2.3. Ecosystem Respiration Measurements

Raw eddy covariance (EC) data processing refers to the method of Wu et al. (2014) for preprocessing rubber plantation flux data [38,39]. Previous studies showed that the quality of the observed data is reliable and can be used for subsequent analysis [38]. We processed the EC data and filled half-hourly gaps. The gap filling refers to the improved marginal distribution sampling method [41]. Even though EC measurements can be run continuously, there are gaps in the collected data in practice, for example, in the technical failures. Thus, we have to impute or gap fill the missing data. The NEE was partitioned into ecosystem respiration (Reco) and GPP. With the use of the nighttime-based flux partitioning algorithm [41], the respiration was estimated from nighttime and extrapolated to daytime. Reco data were obtained from the processed 2019–2020 EC data of the iron tower [37].

2.4. Stem CO2 Efflux Measurements

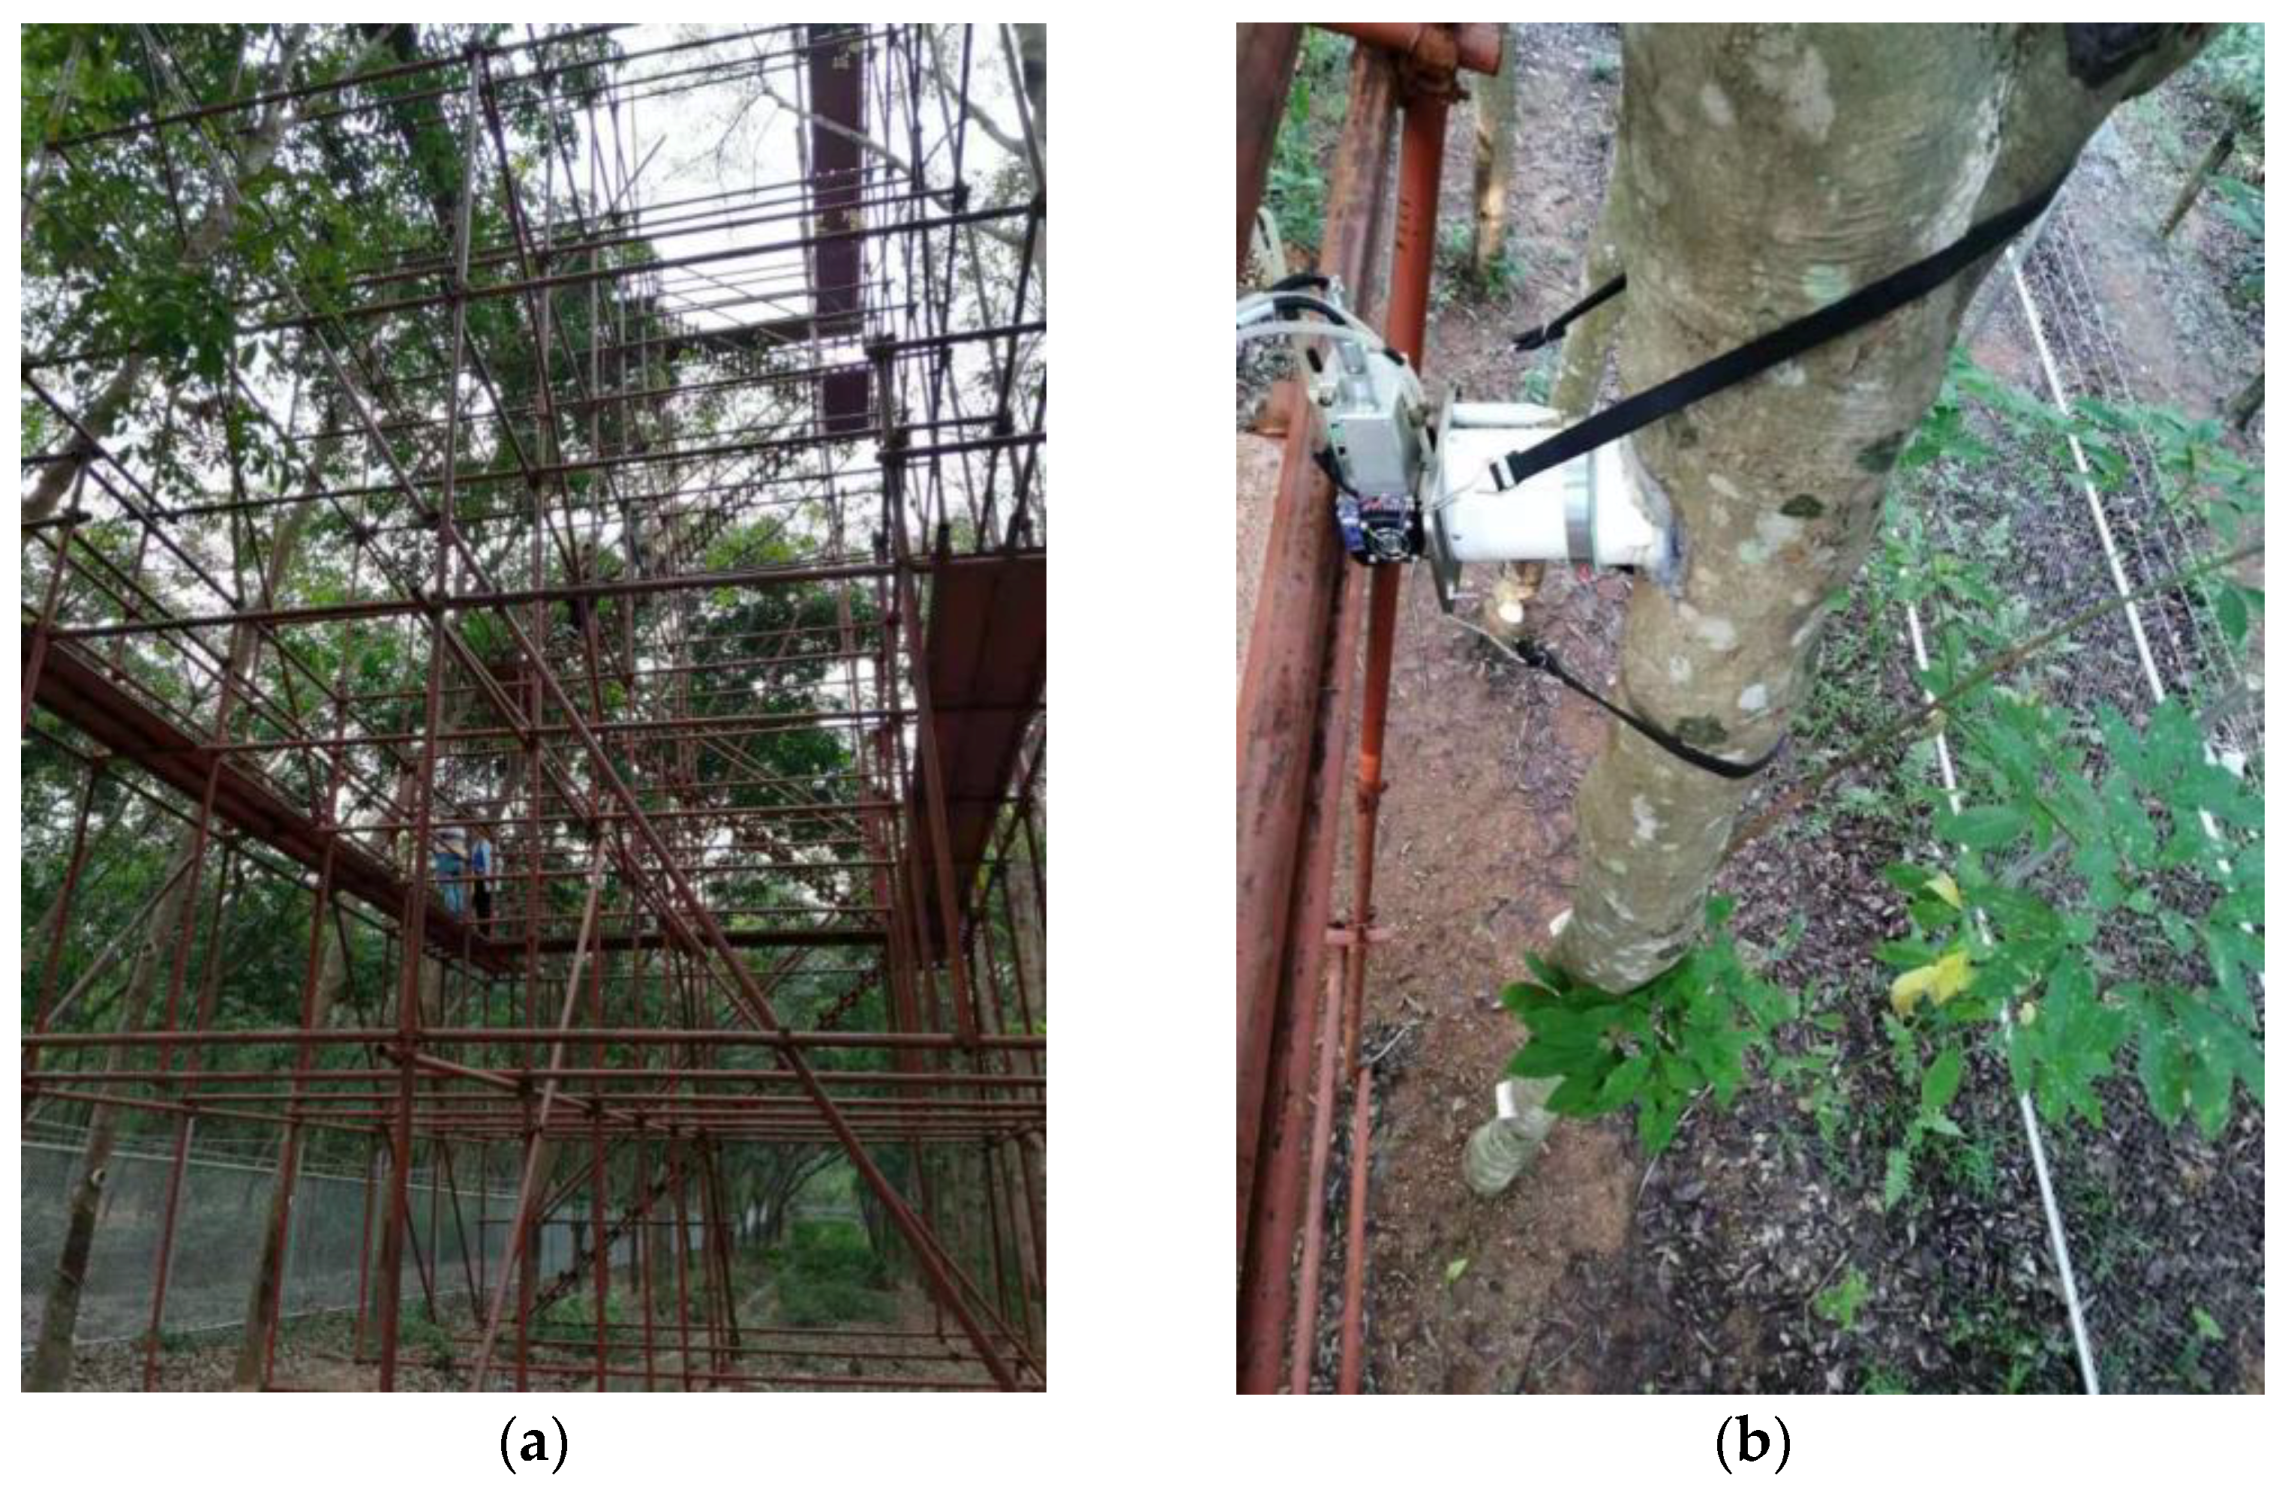
We adopted the LI-6400 (LI-Cor Inc., USA) portable system equipped with 09 soil flux chamber for stem CO2 efflux measurements. All measurements were carried out in the morning (from 8 to 11 a.m.) to avoid the effect of diurnal variation on flux. The stem surface was not flat, which is why we designed self-made polyvinyl chloride (PVC) collars that could match the LI-6400 09 chamber and the stem shape. Glue (100% neutral transparent waterproof silicone) was placed on the connecting location, avoiding the gas outlet. The first field measurement was carried out on 4 October 2018. We discarded the first 3 months’ measurements to avoid disturbance due to the new installation of collars. In general, the measurements were conducted in biweekly intervals, but this is not strict in the case of fieldwork. We designed a height experiment to investigate the vertical variation in the stem CO2 efflux. A 14 m high platform was established to access the top of the canopy (Figure 2a). On this platform, we continuously measured Es at heights of 1.5 m (Es1.5), 3.0 m (Es3.0) and 4.5 m (Es4.5) above ground (Figure 2b). In this experiment, four rubber trees with similar growth conditions were selected (Table 1).

2.5. Two Extrapolation Methods for Estimating Stand Level of Stem CO2 Efflux

The data of area-based method (Ea) and volume-based method (Ev) processing refers to the method of Zhao et al. (2019) for subalpine forest data [42].
Area-based estimation
Assuming the trunk is conical, the stem surface area can be described as follows:
S = π r r 2 + h 2
where S of is stem surface area (m2) and r is half of the diameter at breast height (DBH). The total stem CO2 flux of an individual tree (Ea, µmol·m−2·s−1) is calculated by multiplying Es and S as follows (Equation (2)):
E a = E s × S
Volume-based estimation
The r of Equation (3) is half of DHB (m). The total stem CO2 flux of an individual tree (Ev, µmol·m−3·s−1) is calculated as follows:
E v = E a × 2 π r π r 2 = 2 E a r
Scaling-up stem CO2 efflux at the stand level
The total stem CO2 efflux at an individual tree was scaled up to the stand level by multiplying 476 rubber trees and Ea (or Ev), since 476 trees per hectare were planted in this rubber plantation.

2.6. Statistics

We used Student’s t-test to examine if there were significant differences between different exit treatments in the height experiment. Regression was applied to the dataset to find the controlling factors in temporal variations in the stem CO2 efflux. One-way analysis of variance (ANOVA) was employed to determine the effects of temporal variations in the stem CO2 efflux. Pearson’s correlation analysis verified the relationship between Ea (or Ev) and the impacting factors. The quantitative relationships between Ea (or Ev) and impacting factors were determined and modelled via regression analysis.

3. Results

3.1. Seasonal Variation of Impacting Factors

Figure 3 shows the trend of the impacting factors of our study site. In the observation period, Ts seemed to follow the seasonal variation of Ta, dropping from July to the following January and gradually rising from February to June. The minimum Ts and Ta values usually occurred in the middle of December, and their peaks occurred in June (Figure 3a). In the observation period, the lowest Ta value in 2019 was 14.7 °C, and it was 19.7 °C in 2020, appearing in early December. The maximum value in 2019 was 30.0 °C, appearing in the middle of June, and it was 30.4 °C in 2020. The annual mean value of Ta was 24.77 °C in 2019 and 24.97 °C in 2020. Meanwhile, the minimum value of Ts in 2019 was 15.5 °C, and in 2020, it was 19.2 °C in December. The maximum value in 2019 was 30.0 °C, appearing in early June, and it was 30.4 °C in 2020. The annual mean value of Ts was 24.36 °C in 2019 and 24.25 °C in 2020.
Figure 3b shows the LAI monthly dynamics of the rubber plantation. The LAI showed seasonal variations, dropping sharply from the previous November to February and gradually rising from March to October (Figure 3b). The lowest LAI in 2019 was (1.42 ± 0.72) m2/m2, and it was (2.47 ± 0.46) m2/m2 in 2020, appearing in February. Then, it increased rapidly in March. The maximum LAI in 2019 appeared in early October and was (6.35 ± 0.70) m2/m2, and it was (7.61 ± 0.45) m2/m2 in 2020, appearing in early September. The annual mean value of LAI in 2019 was (5.02 ± 1.09) m2/m2, lower than that in 2020 (5.45 ± 1.44) m2/m2. However, the LAI seemed to follow a VWC seasonal variation in 2020, dropping sharply from the previous December to March and gradually rising from May to October (Figure 3b,c). LAI fluctuated from March to May in 2020, and a meteorological drought event occurred during the field experiment. VWC showed predictable seasonal variations, which declined sharply from November to next April (dry season) and tended to rise and flatten from May to October (wet season) (Figure 3c).

3.2. Seasonal Variation of Stem CO2 Efflux

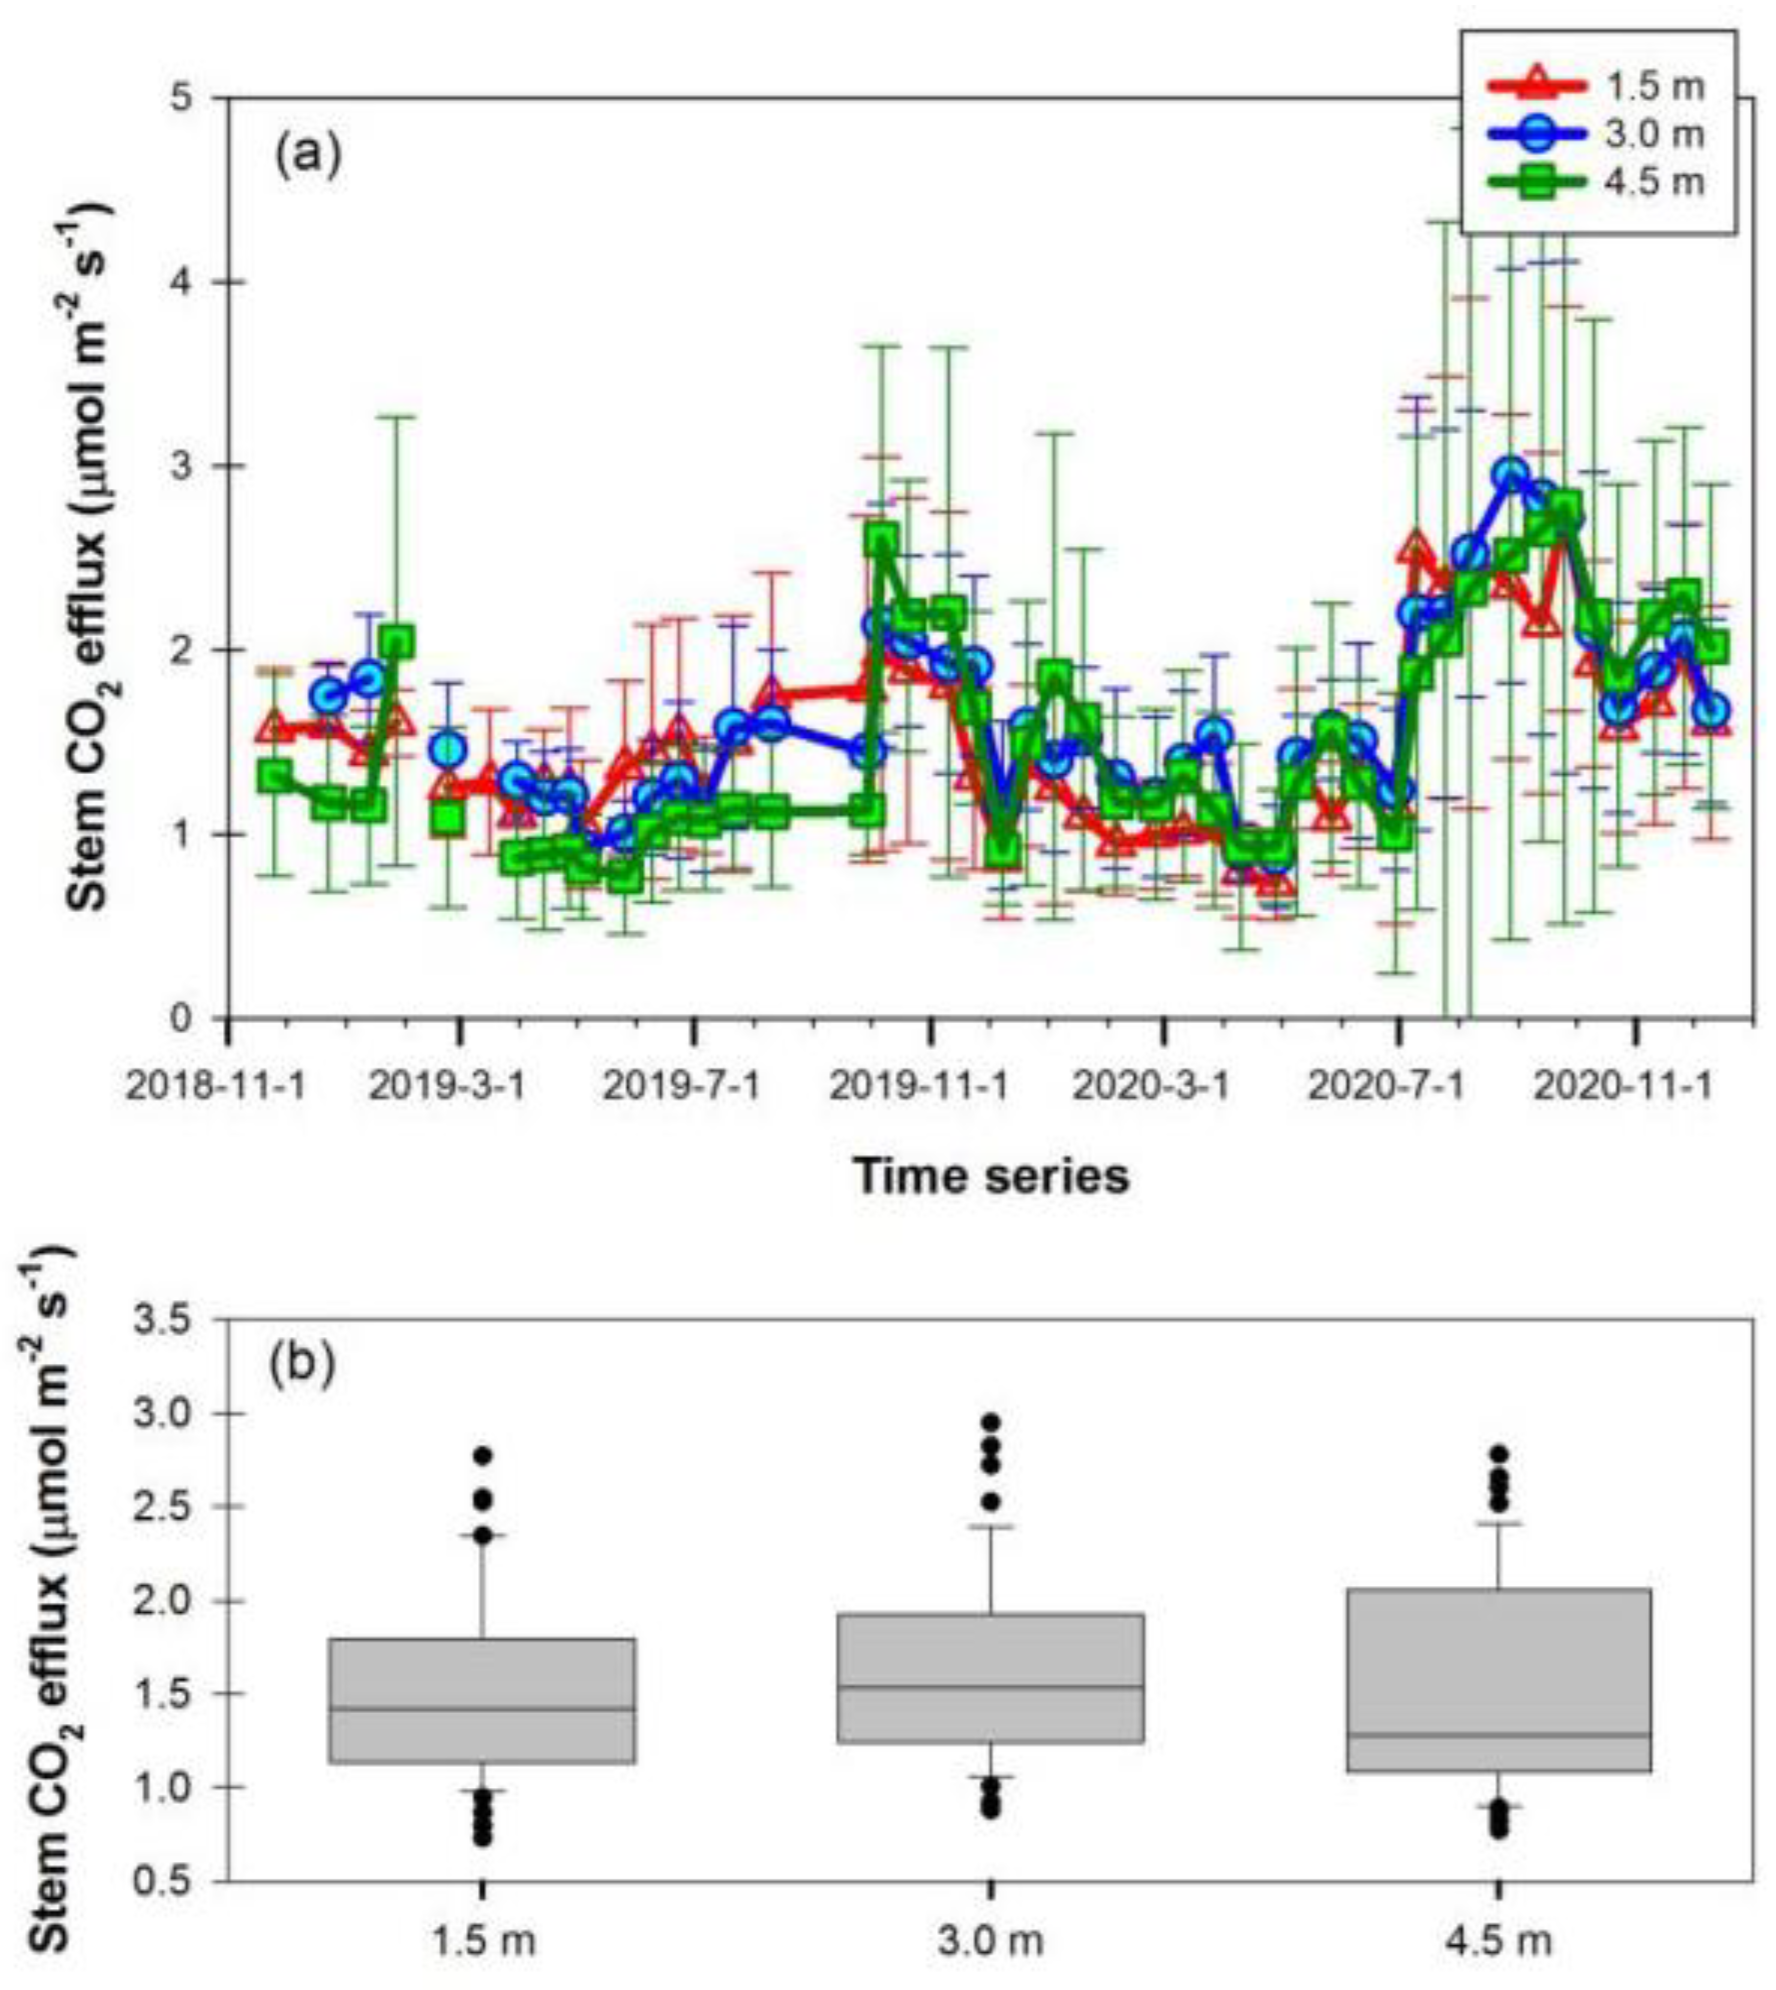
The stem CO2 efflux of height experiments showed obvious seasonal variations (Figure 4a), which declined gradually from October to April and rose from May to September. The minimum CO2 flux rate occurred in the middle of April, and the peak occurred in October. The maximum value of Es4.5 was 2.78 μmol·m−2·s−1, and the minimum value was 0.77 μmol·m−2·s−1. Moreover, the maximum value of Es3.0 was 2.95 μmol·m−2·s−1, and the minimum value was 0.88 μmol·m−2·s−1. The maximum CO2 flux rate of Es1.5 was 2.77 μmol·m−2·s−1, and the minimum value was 0.73 μmol·m−2·s−1. Overall, the mean Es3.0 value of (1.65 ± 0.52) μmol·m−2·s−1 was slightly higher than the mean Es4.5 value of (1.56 ± 0.59) μmol·m−2·s−1 as well as the mean Es1.5 value of (1.51 ± 0.48) μmol·m−2·s−1 (Figure 4b). Compared with the mean stem CO2 efflux, Es3.0 was 5.45% higher than Es4.5 and 8.48% higher than Es1.5. However, we found no relatively obvious differences (p > 0.05) in the CO2 efflux along the stem during this study period.

3.3. Findings on Ea and Ev

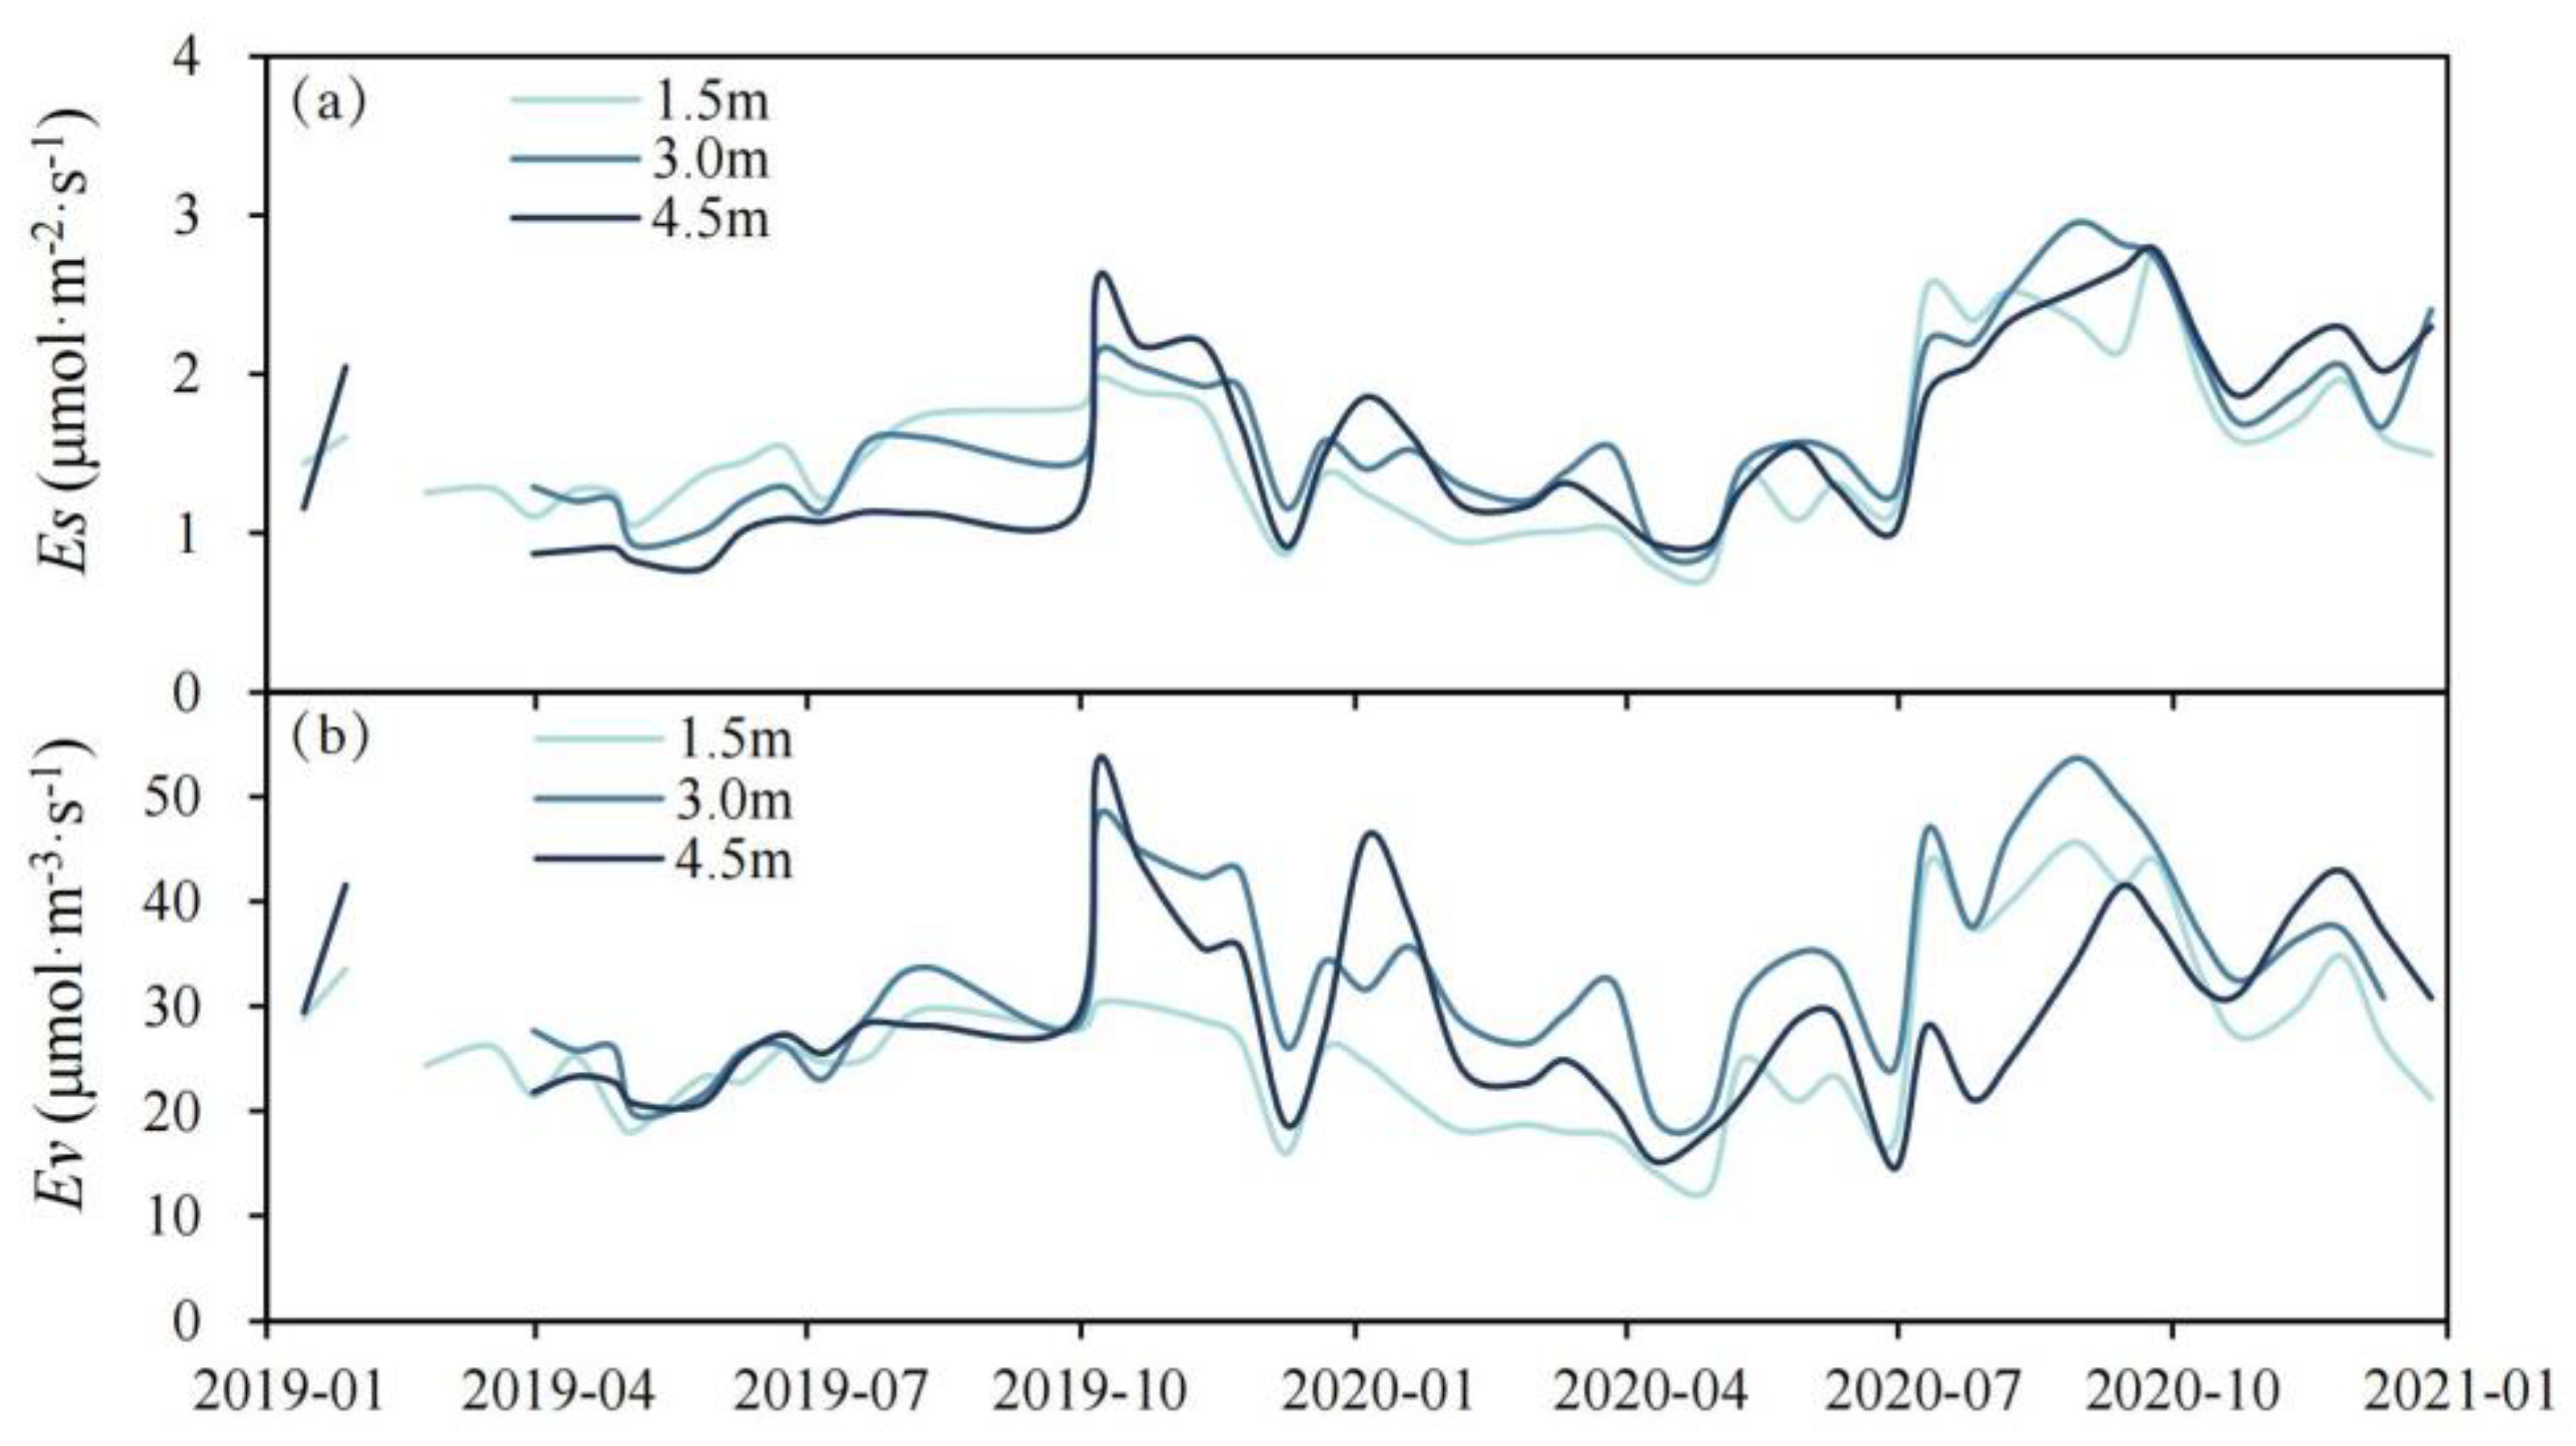
In this study, area-based and volume-based methods were applied to extrapolate the total stem CO2 efflux rate at stand level. The results of the two methods showed obvious seasonal and similar variations, being weaker in the dry season (from November to next April) and stronger in the wet season (from May to October) (Figure 5). The single-factor ANOVA analysis showed that Ea had no obvious differences in vertical variations (p = 0.62). However, the volume-based estimation method Ev indicated differences in vertical variations (p < 0.05). This finding suggests that differences exist between the two estimation methods. Thus, Ea chamber-based measurements at breast height are a reasonable and practical proxy. Therefore, stem surface may be preferred to scaled-up, which are simple and convenient to measure and estimate in the field.

3.4. Correlation between Stem CO2 Efflux and Impacting Factors

Correlation analysis showed that Ea was significantly positively related to VWC (p < 0.01) and LAI (p < 0.01), with coefficients of 0.505 and 0.663, respectively (Table 2). Ea was minimally affected by Ta and Ts, as reflected by the low correlation values (−0.001 and 0.004, respectively). Similarly, Ev was affected minimally by Ta and Ts, with low correlation values (−0.068 and −0.042, respectively). In summary, VWC and LAI were the major impacting factors on the stem CO2 efflux.
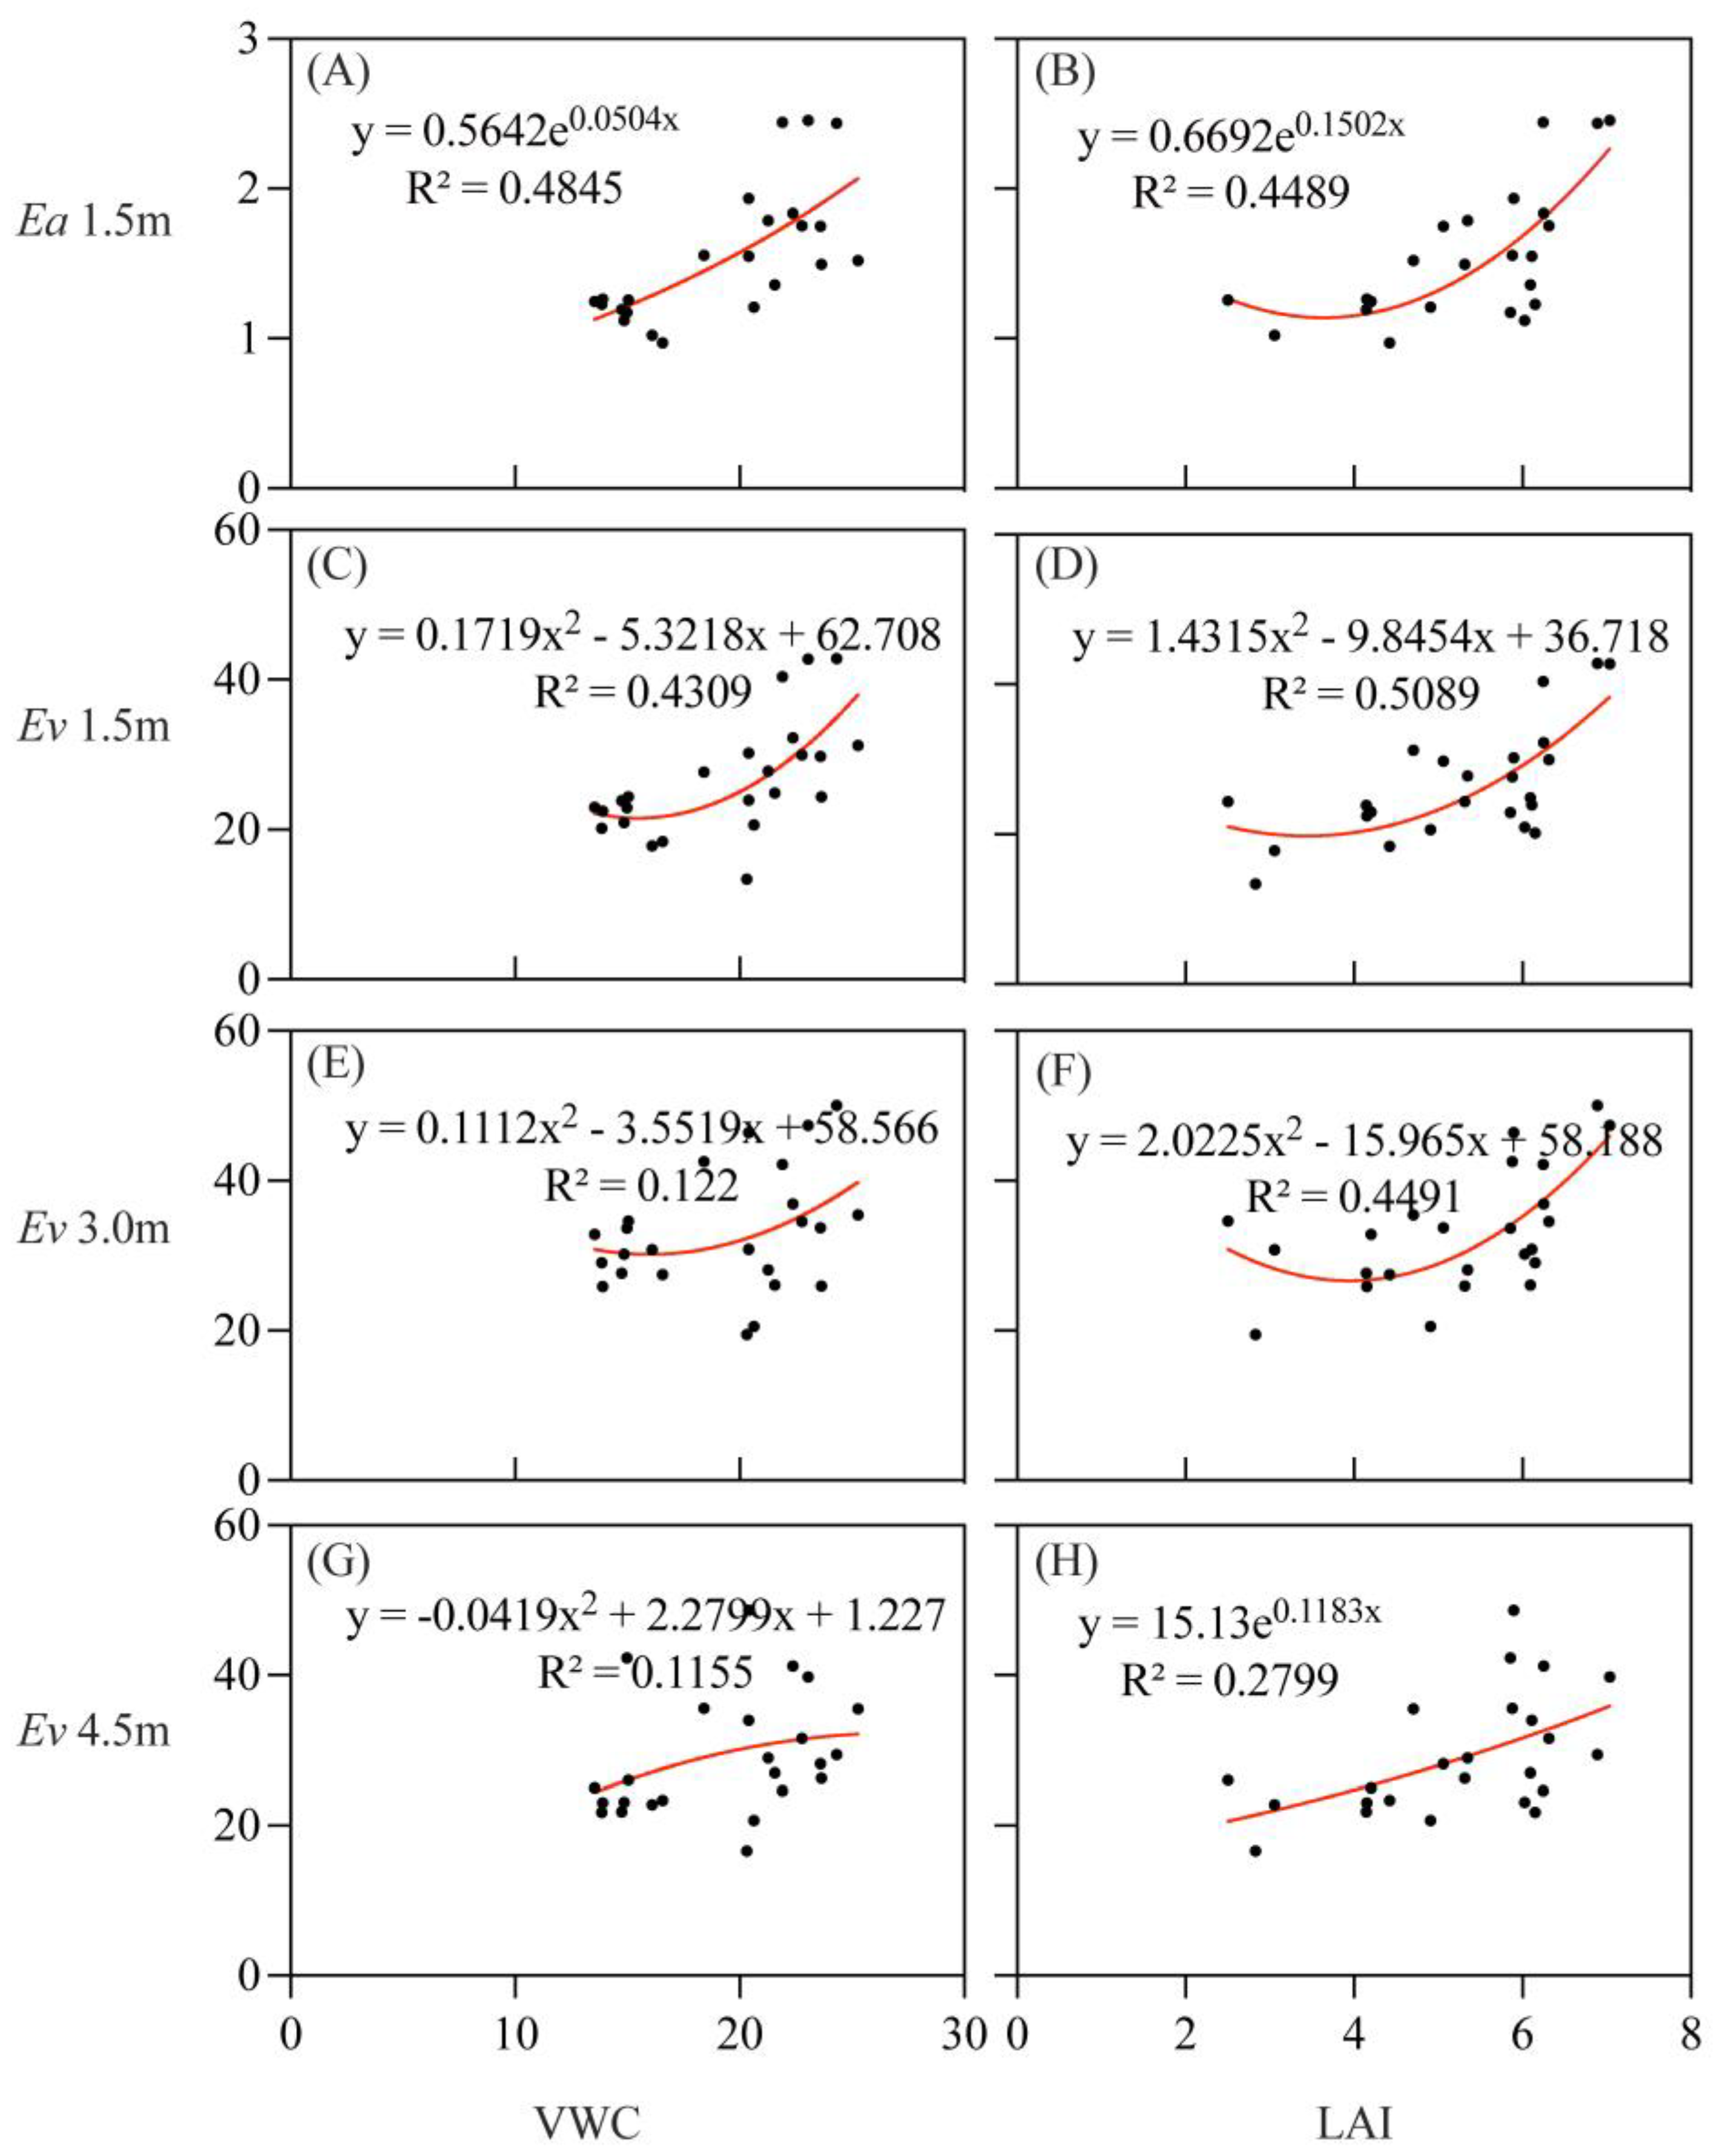
At the same time, we explored whether VWC and LAI had an effect on the CO2 efflux at different heights. The previous section showed that Ea had a small difference at various heights; hence, we only took Ea1.5 into account, while all three heights were considered for Ev. The interpretation of VWC and LAI for Ea and Ev was the highest at 1.5 m. VWC explained 48% of Ea1.5 (Figure 6A) and 43% of Ev1.5 (Figure 6C). Meanwhile, LAI explained 45% of Ea1.5 (Figure 6B) and 50% of Ev1.5 (Figure 6D). In addition, LAI explained 45% of Ev3.0 (Figure 6F). For Ev3.0 and Ev4.5, the interpretation of VWC was very limited (Figure 6E,G), and LAI was a better indicator than VWC overall (Figure 6F,H).

3.5. Correlation between Stem CO2 Efflux and Ecosystem Respiration

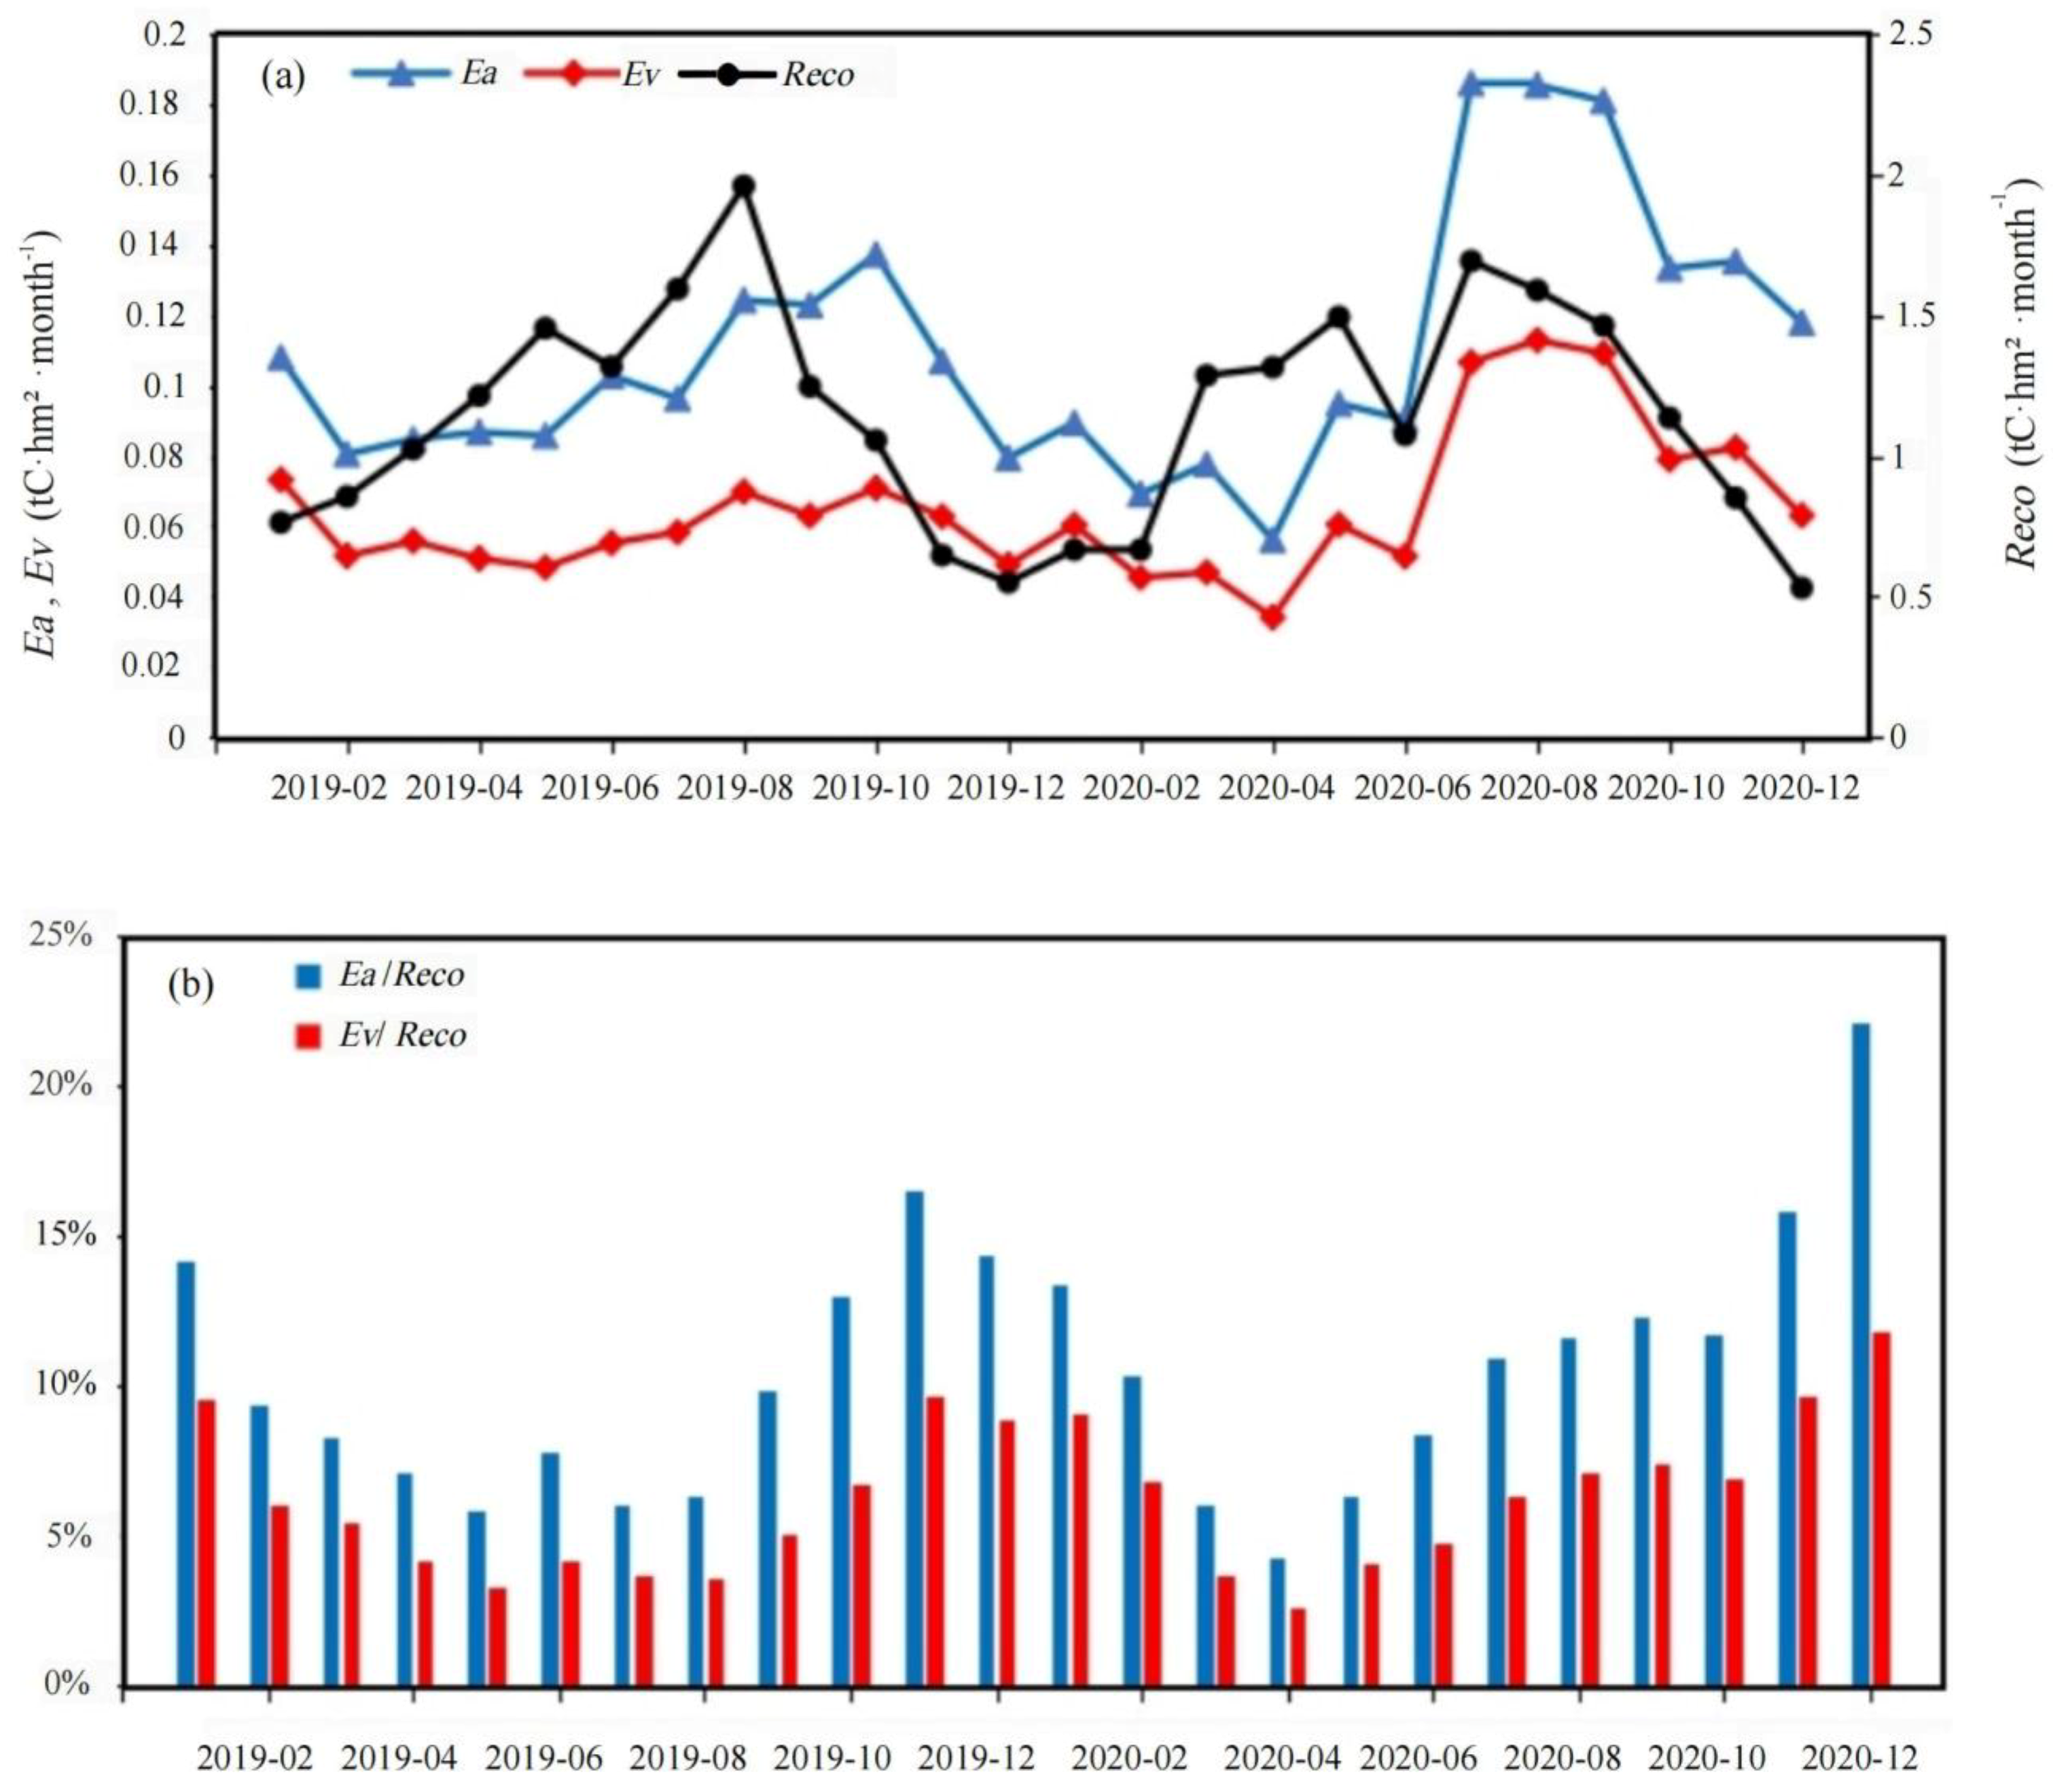
As a reasonable and practical proxy, the area-based method estimated that the annual amount of stem carbon release for a mature rubber forest was 1.214 t C·hm−2a−1 in 2019 and 1.414 t C·hm−2a−1 in 2020. The EC method estimated that the annual total ecosystem respiration (Reco) in the rubber plantation was 13.67 t C·hm−2·a−1 in 2019 and 13.75 t C·hm−2·a−1 in 2020 (Figure 7a) [37]. We estimated that the proportion of the annual stand-level Ea to ecosystem respiration (Ea/Reco ratio) had a mean value of 9.90% in 2019 and 11.14% in 2020. The maximum Ea/Reco ratio value appeared in December 2020 and was 22.16%, and the minimum value appeared in April 2020 and was 4.27%. Meanwhile, the maximum value of Ev/Reco appeared in December 2020 and was 11.87%, and the minimum value of 2.60% appeared in April. The Ea/Reco and the Ev/Reco ratio trends both decreased from April to November and then dropped from December to March (Figure 7b).

4. Discussion

4.1. Seasonal Variations on Stem CO2 Efflux

The Es value was evidently higher in the wet and tapping months from August to October than in the other months. The difference in the CO2 efflux from stems can be explained by a higher sap flow during wet periods. The high concentration of CO2 produced by the respiring cells from stems and roots was transported upward by adequate xylem sap flow during the wet months. Moreover, these differences could be due to human production activity. Rubber trees are an important industrial crop in the tropics. People regularly obtain latex by tapping rubber trees from April to October every year in Danzhou. Thus, the bark of these trees’ trunks is destroyed in the tapping season. Teskey and McGuire (2007) found that removing the resistance to some diffusion barriers in the bark can increase the rate of CO2 outflow significantly [6]. Cerasoli (2009) reported that the barriers between woody tissue and the inner bark restrict the diffusion of the CO2 efflux from the transpiration stream [43].

4.2. Effect of Impacting Factors on Es in Rubber Plantation

In this experiment, we found that LAI and VWC were the major impacting factors on the stem CO2 efflux during the study period. The minimum LAI value appeared at the end of February, which was the deciduous period of rubber trees in Danzhou. Previous studies showed that the LAI of the rubber plantation forest is the lowest in January and February, showing the characteristics of a deciduous forest [44]. The trends of LAI were similar to those of Ts and VWC (Figure 3a–c), which may reflect the annual patterns of growth. The amount of leaf area was controlled by soil moisture, soil temperature and nutrients. Leaf area size and its distribution directly affect many biophysical plant processes, including photosynthesis and respiration, transpiration and precipitation interception [45,46,47]. Thus, LAI is a crucial predictor of Es seasonal variations in rubber plantations, the same as in other forest types [35,36]. Temperature is a vital environmental factor in the stem CO2 efflux [48,49]. In this study, the stem CO2 efflux was minimally affected by Ta and Ts, which was reflected by the low correlation values. This result could be explained by the fact that this site is located on a tropical island and the annual temperature variation is small. In general, lower temperatures and the volume of soil water content may lead to restricted tree growth and transpiration through stomatal closure, and to reduced autotrophic respiration [50,51] and heterotrophic respiration through reduced microbial activity in the soil [52]. We determined that the stem CO2 efflux was higher during the wet season than during the dry season. This condition could be explained by higher substrate supplies [53] and sap flow in the moist period in comparison to the dry season.
Ultimately, our results show a certain correlation between VWC, LAI and Ea, and reveal seasonal variations. However, these findings suggest a complex relationship between the impacting factors and Ea. The relationship we observed in rubber trees appears to be explained by the often-reported Es with seasonal temperature and precipitation variations. The literature on the effect of CO2 on woody tissue respiration is scarce and lacks a consistent mechanistic explanation [54]. This study provides a useful exploration with regard to Es being measured across different parts of the same tree species. These relationships with integrated factors need to be confirmed in the studies of other species.

4.3. Ea/Reco Annual Character in Rubber Plantation

No obvious vertical variations in the stem CO2 efflux in an even-aged pure rubber plantation were found in our study. This finding indicates that the chamber-based measurements at breast height can be used to estimate stem respiration, and scaling up to stand level is a feasible and practical method [43,55]. Previous studies suggested that a volume-based method should be applied for trees with a small DBH (<30 or 40 cm) and that an area-based estimation should be applied for trees with a large DBH (>30 or 40 cm) [42]. The stem CO2 efflux is an excellent indicator of the respiration rate of a tree. According to Salomon et al. (2016), stem respiration is mainly explained by the stem CO2 efflux (>90%) [54]. The volume-based estimation method Ev indicated differences in vertical variations (p < 0.05). Ea chamber-based measurements at breast height are a reasonable and practical proxy. Therefore, stem surface units may be preferred to scaled-up units, which are simple and convenient to measure and estimate in the field. Thus, we suggest applying an area-based estimation method to trees with DBH (<30 cm) to extrapolate the stem CO2 efflux for the whole tree in a pure rubber plantation. This can be simplified for the estimation and expansion of stem respiration.
The area-based method estimated that the annual amount of stem carbon release for a mature rubber forest was 1.214 t C·hm−2·a−1 in 2019 and 1.414 t C·hm−2·a−1 in 2020. Surprisingly, the Ea/Reco ratio value in the cold season (November to January) was higher than in the other months (Figure 7b). Usually, the stem CO2 efflux is weak in the cold season. This is related to a decrease in temperature and precipitation, which causes a significant decrease in soil respiration and heterotrophic respiration. Thus, the Reco value was lower than in the other months. We observed that a low Ea/Reco ratio in the ecosystem appeared from March to June (Figure 7b), which was the deciduous period and the first canopy leaf growth period. The LAI value was low, and the physiological activity of the rubber forest was weak. From 2019 to 2020, the annual variation of the Ev/Reco ratio showed a decrease and then an increase in this rubber plantation. The Ea/Reco ratio in June and July was relatively small, which was related to a high temperature, abundant precipitation, high soil temperature and humidity and vigorous heterotrophic respiration in soil respiration. Thus, the Reco value was higher than in the other months.

5. Conclusions

In this study, our results showed that the stem CO2 efflux exhibited significant seasonal differences with a minimum value in April and a maximum in September. The physiological processes within the trees and external human activities (tapping) may cause a change in stem respiration. Therefore, considering the comprehensive factors of stem respiration when examining gas exchange in forest ecosystems is important. We found that the stem CO2 efflux patterns showed no large vertical variations along the stems. The area-based extrapolation method at breast height can be used to estimate stem respiration and scaling up to stand level is a feasible and practical method. However, the sample trees comprise an even-aged pure plantation and not a complex tropical rainforest. The extrapolation method needs to be verified by expanding the number of samples and forest types in further studies.
The ratio values of the stem CO2 efflux and the respiration of the ecosystem showed seasonal characteristics with a minimum value in April and a maximum value in December in the rubber plantation. In addition, our statistical results imply that VWC and LAI are the factors that affect Es in rubber plantations. However, further studies of the mechanism are required. This is necessary for accurate measurements and estimations of stem respiration at stand levels to be verified. This study will likely improve the understanding of the contribution of each component with regard to the carbon budget in tropical forest ecosystems. Identifying the drivers of this relationship will also be important for fully understanding carbon budget dynamics in these forests.

Author Contributions

B.S. conducted data interpretation and drafted the first version of the manuscript; Z.W. instructed the experiment, provided the site data, conducted the review and supervised the editing of the manuscript; L.D., C.Y. and S.Y. contributed significantly to this experiment and supervised the review of the manuscript. All authors have read and agreed to the published version of the manuscript.

Funding

This study was supported by Hainan Province Science and Technology Special Fund (ZDYF2021SHFZ257); China Agriculture Research System (CARS-33-ZP3).

Institutional Review Board Statement

Not applicable.

Informed Consent Statement

Not applicable.

Data Availability Statement

The data presented in this study are available on request from the corresponding author.

Acknowledgments

We would like to thank Zhenghong Tan for the scientific idea. We would like to thank Guanze Wang, Hao Dong and Fei Quan for their technical assistance on site. We would also like to thank Guoyu Lan and Xiang Zhang for their theoretical guidance and experimental support. We gratefully acknowledge Yang Ding, Xinwei Guo and Murphy Stephen J for their critical reviews.

Conflicts of Interest

The authors declare no conflict of interest.

Abbreviations

AbbreviationsDefinitionUnits
ANOVAOne-way analysis of variance
DBHDiameter at breast heightcm
EaArea-based extrapolation methodμmol·m−3·s−1
EC Eddy covariance
EsStem CO2 effluxμmol·m−2·s−1
EvVolume-based extrapolation methodμmol·m−3·s−1
GPPGross primary productivity
MDSMarginal distribution sampling
NEENet ecosystem carbon exchange
LAILeaf area index m/m
PCVPolyvinyl chloride
RecoEcosystem respiration t C·hm−2·a−1
TaAverage atmospheric temperature°C
TsSoil temperature°C
VPDVapor pressure deficitKpa
VWCVolumetric water content%

References

  1. Ryan, M.G.; Hubbard, R.M.; Clark, D.A.; Sanford, R.L., Jr. Woody—Tissue respiration for Simarouba amara and Minquartia guianensis, two tropical wet forest trees with different growth habits. Oeologia 1994, 100, 213–220. [Google Scholar] [CrossRef] [PubMed]
  2. Ma, Y.; Xiang, W.; Lei, P. Stem respiration and its controlling factors in forest ecosystems. J. Plant Ecol. 2007, 31, 403–412. [Google Scholar]
  3. Fan, H.; McGuire, M.A.; Teskey, R.O. Effects of stem size on stem respiration and its flux components in yellow-poplar (Liriodendron tulipifera L.) trees. Tree Physiol. 2017, 37, 1536–1545. [Google Scholar] [CrossRef]
  4. McGuire, M.A.; Teskey, R.O. Estimating stem respiration in trees by a mass balance approach that accounts for internal and external fluxes of CO2. Tree Physiol. 2004, 24, 571–578. [Google Scholar] [CrossRef]
  5. Bowman, W.P.; Barbour, M.M.; Turnbull, M.H.; Tissue, D.T.; Whitehead, D.; Griffin, K.L. Sap flow rates and sapwood density are critical factors in within- and between-tree variation in CO2 efflux from stems of mature Dacrydium cupressinum trees. New Phytol. 2005, 167, 815–828. [Google Scholar] [CrossRef]
  6. Teskey, R.; McGuire, M. Measurement of stem respiration of sycamore (Platanus occidentalis L.) trees involves internal and external fluxes of CO2 and possible transport of CO2 from roots. Plant Cell Environ. 2007, 30, 570–579. [Google Scholar] [CrossRef] [PubMed]
  7. Angert, A.; Muhr, J.; Negron Juarez, R.; Alegria Muñoz, W.; Kraemer, G.; Ramirez Santillan, J.; Barkan, E.; Mazeh, S.; Chambers, J.Q.; Trumbore, S.E. Internal respiration of Amazon tree stems greatly exceeds external CO2 efflux. Biogeosciences 2012, 9, 4979–4991. [Google Scholar] [CrossRef]
  8. Kinerson, R.S. Relationships between plant surface area and respiration in loblolly pine. J. Appl. Ecol. 1975, 12, 965–971. [Google Scholar] [CrossRef]
  9. Lavigne, M.B.; Franklin, S.E.; Hunt, E.R., Jr. Estimation stem maintenance respiration rates of dissimilar balsam fir stands. Tree Physiol. 1996, 16, 687–695. [Google Scholar] [CrossRef]
  10. Damesin, C.; Ceschia, E.; Foff, N.L.; Ottorini, J.M.; Dufrene, E. Stem and branch respiration of beech: From tree measurements to estimations at the stand level. New Phytol. 2002, 153, 159–172. [Google Scholar] [CrossRef]
  11. Kim, M.H.; Nakane, K.; Lee, J.T.; Bang, H.S.; Na, Y.E. Stem/branch maintenance respiration of Japanese red pine stand. For. Ecol. Manag. 2007, 243, 283–290. [Google Scholar] [CrossRef]
  12. Oohata, S.; Yamakura, T.; Saito, H.; Shidei, T. A study on the vertical distribution of respiratory activity of a 40-year-old stand of Chamecyparis obtusa. Bull. Kyoto Univ. For. 1971, 42, 103–116. [Google Scholar]
  13. Negisi, K. Diurnal fluctuation of CO2 release from the stem bark of standing young Pinus densiflora trees. J. Jpn. For. Soc. 1975, 57, 375–383. [Google Scholar]
  14. Mori, S.; Hagihara, A. Respiration in stems of hinoki (Chamaecyparis obtusa) trees. J. Jpn. For. Soc. 1988, 70, 187–481. [Google Scholar]
  15. McCree, K.J. An equation for the rate of dark respiration of white cover plants grown under controlled conditions. In Prediction and Measurement of Photosynthetic Productivity; Setlik, I., Ed.; Pudoc: Wageningen, The Netherlands, 1970; pp. 221–229. [Google Scholar]
  16. Levy, P.E.; Meir, P.; Allen, S.J.; Jarvis, P.G. The effect of aqueous transport of CO2 in xylem sap on gas exchange in woody plants. Tree Physiol. 1999, 19, 53–58. [Google Scholar] [CrossRef]
  17. McGuire, M.A.; Cerasoli, S.; Teskey, R.O. CO2 fluxes and respiration of branch segments of sycamore (Platanus occidentalis L.) examined at different sap velocities, branch diameters and temperatures. J. Exp. Bot. 2007, 58, 2159–2168. [Google Scholar] [CrossRef]
  18. Saveyn, A.; Steppe, K.; McGuire, M.A.; Lemeur, R.; Teskey, R.O. Stem respiration and carbon dioxide efflux of young Populus deltoides trees in relation to temperature and xylem carbon dioxide concentration. Oecologia 2008, 154, 637–649. [Google Scholar] [CrossRef]
  19. Teskey, R.; Saveyn, A.; Steppe, K.; McGuire, M.A. Origin, fate and significance of CO2 in tree stems. New Phytol. 2008, 177, 17–32. [Google Scholar] [CrossRef]
  20. Aubrey, D.P.; Teskey, R.O. Root-derived CO2 efflux via xylem stream rivals soil CO2 efflux. New Phytol. 2009, 184, 35–40. [Google Scholar] [CrossRef]
  21. Trumbore, S.E.; Angert, A.; Kunert, N.; Muhr, J.; Chambers, J.Q. What’s the flux? Unraveling how CO2 fluxes from trees reflect underlying physiological processes. New Phytol. 2013, 197, 353–355. [Google Scholar] [CrossRef]
  22. Hilman, B.; Angert, A. Measuring the ratio of CO2 efflux to O2 influx in tree stem respiration. Tree Physiol. 2016, 36, 1422–1431. [Google Scholar] [PubMed]
  23. Bloemen, J.; McGuire, M.A.; Aubrey, D.P.; Teskey, R.O.; Steppe, K. Transport of rootrespired CO2 via the transpiration stream impacts aboveground carbon assimilation and CO2 efflux in trees. New Phytol. 2013, 197, 555–565. [Google Scholar] [CrossRef] [PubMed]
  24. Roo, L.D.; Salomón, R.L.; Steppe, K. Woody tissue photosynthesis reduces stem CO2 efflux by half and remains unimpacted by drought stress in young Populus tremula trees. Plant Cell Environ. 2020, 43, 981–991. [Google Scholar] [CrossRef] [PubMed]
  25. Tarvainen, L.; Rntfors, M.; Wallin, G. Vertical gradients and seasonal variation in stem CO2 efflux within a Norway spruce stand. Tree Physiol. 2014, 34, 488–502. [Google Scholar] [CrossRef] [PubMed]
  26. Acosta, M.; Pokorny, R.; Janous, D.; Marek, M.V. Stem respiration of Norway spruce trees under elevated CO2 concentration. Biol. Plant. 2010, 54, 773–776. [Google Scholar] [CrossRef]
  27. Zhao, K.J.; Dong, B.Q.; Jia, Z.K.; Ma, L.Y. Effect of climatic factors on the temporal variation of stem respiration in Larix principis-rupprechtii Mayr. Agric. For. Meteorol. 2018, 248, 441–448. [Google Scholar] [CrossRef]
  28. Yan, Y.P.; Sha, L.Q.; Cao, M. Stem respiration rates of rubber (Hevea brasiliensis) plantations in Xishuangbanna. Acta Ecol. Sin. 2009, 29, 1840–1848. [Google Scholar]
  29. Bowman, W.P.; Turnbull, M.H.; Tissue, D.T.; Whitehead, D.; Griffin, K.L. Sapwood temperature gradients between lower stems and the crown do not influence estimates of stand-level stem CO2 efflux. Tree Physiol. 2008, 28, 1553–1559. [Google Scholar] [CrossRef]
  30. Steppe, K.; Saveyn, A.; McGuire, M.A. Resistance to radial CO2 diffusion contributes to between-tree variation in CO2 efflux of Populus deltoides stems. Funct. Plant Biol. 2007, 34, 785–792. [Google Scholar] [CrossRef]
  31. Yi, J.; Xie, G.; Wang, J.; Lan, G.; Wu, Z.; Yang, C. Stem Respiration of Rubber Tree of Different Strains and Different Girth. J. Anhui Agric. Sci. 2012, 40, 13433–13436. [Google Scholar]
  32. Duursma, R.A.; Kolari, P.; Peramaki, M.; Pulkkinen, M.; Makela, A.; Nikinmaa, E.; Hari, P.; Aurela, M.; Berbigier, P.; Bernhofer, C.H.; et al. Contributions of climate, leaf area index and leaf physiology to variation in gross primary production of six coniferous forests across Europe: A model-based analysis. Tree Physiol. 2009, 29, 621–639. [Google Scholar] [CrossRef] [PubMed]
  33. Bond-Lamberty, B.; Thomson, A. Temperature-associated increases in the global soil respiration record. Nature 2010, 464, 579–582. [Google Scholar] [CrossRef] [PubMed]
  34. Drake, J.E.; Davis, S.C.; Raetz, L.M.; DeLucia, E.H. Mechanisms of age-related changes in forest production: The influence of physiological and successional changes. Glob. Change Biol. 2011, 17, 1522–1535. [Google Scholar] [CrossRef]
  35. Meir, P.; Grace, J. Scaling relationships for woody tissue respiration in two tropical rain forests. Plant Cell Environ. 2002, 25, 963–973. [Google Scholar] [CrossRef]
  36. Meir, P.; Metcalfe, D.B.; Costa, A.C.; Fisher, R.A. The fate of assimilated carbon during drought: Impacts on respiration in Amazon rainforests. Philosophical Transactions of the Royal Society of London. Philos. Trans. R. Soc. B 2008, 363, 1849–1855. [Google Scholar] [CrossRef] [PubMed]
  37. Yang, S.; Yang, C.; Gong, Y.; Zhang, J.; Song, B.; Wu, Z. Phenological Characteristics of Net Ecosystem Carbon Exchange in Hainan Rubber Forest Ecosystem. Chin. J. Trop. Crops 2022, 43, 1288–1296. [Google Scholar]
  38. Wu, Z. Carbon Balance of the Rubber Plantation Ecosystem in Hainan Island. Ph.D. Thesis, Hainan University, Haikou, China, 2013. (In Chinese). [Google Scholar]
  39. Wu, Z.; Tao, Z.; Lan, G.; Wang, J.; Xie, G.; Zhou, Z. The net ecosystem carbon exchange and its environmental factors in a tropical rubber plantation ecosystem in Hainan island. Chin. J. Trop. Crops 2014, 35, 2099–2108. [Google Scholar]
  40. Wang, G. Study on the Dynamics of Rubber Tree’s Non-Structural Carbohydrate and the Effect of Stem Water Storage in Hainan Island. Master’s Thesis, Hainan University, Haikou, China, 2019. [Google Scholar]
  41. Reichstein, M.; Falge, E.; Baldocchi, D.; Papale, D.; Aubinet, M.; Berbigier, P.; Bernhofer, C.; Buchmann, N.; Gilmanov, T.; Granier, A.; et al. On the separation of net ecosystem exchange into assimilation and ecosystem respiration: Review and improved algorithm. Glob. Change Biol. 2005, 11, 1424–1439. [Google Scholar] [CrossRef]
  42. Zhao, G.; Liu, G.; Zhu, W. Estimating individual- and stand-level stem CO2 efux in a subalpine forest: Assessment of diferent extrapolation methods. Trees 2019, 33, 1603–1613. [Google Scholar] [CrossRef]
  43. Cerasoli, S.; McGuire, M.A.; Faria, J.; Mourato, M.; Schmidt, M.; Pereira, J.S.; Chaves, M.M.; Teskey, R.O. CO2 efflux, CO2 concentration and photosynthetic refixation in stems of Eucalyptus globulus (Labill.). J. Exp. Bot. 2009, 60, 99–105. [Google Scholar] [CrossRef]
  44. Chen, B.; Wu, Z.; Yang, C.; Qi, D.; Li, X.; Lan, G.; Xie, G.; Tao, Z.; Sun, R.; Xiao, X. Monthly Dynamics of Leaf Area Index of Rubber Plantation in Danzhou, Hainan Island, China. Chin. J. Trop. Agric. 2015, 35, 1–6. [Google Scholar]
  45. Zheng, G.; Monika, M.L. Retrieving Leaf Area Index (LAI) Using Remote Sensing: Theories, Methods and Sensors. Sensors 2009, 9, 2719–2745. [Google Scholar] [CrossRef]
  46. Wang, Q.; Tenhunen, J.; Dinh, N.Q. Evaluation of seasonal variation of MODIS derived leaf area index at two European deciduous broadleaf forest sites. Remote Sens. Environ. 2005, 96, 475–484. [Google Scholar] [CrossRef]
  47. Yang, J.; He, Y.; Aubrey, D.P.; Zhuang, Q.; Teskey, R.O. Global patterns and predictors of stem CO2 efflux in forest ecosystems. Glob. Change Biol. 2016, 22, 1433–1444. [Google Scholar] [CrossRef] [PubMed]
  48. Amthor, J.S. The role of maintenance respiration in plant growth. Plant Cell Environ. 1984, 7, 561–569. [Google Scholar] [CrossRef]
  49. Stockfors, J. Temperature variations and distribution of living cells within tree stems: Implications for stem respiration modeling and scale-up. Tree Physiol. 2000, 20, 1057–1062. [Google Scholar] [CrossRef]
  50. Epron, D.; Nouvellon, Y.; Roupsard, O.; Mouvondy, W.; Mabiala, A.; Saint-Andre’, L.; Joffre, R.; Jourdan, C.; Bonnefond, J.M.; Berbigier, P. Spatial and temporal variations of soil respiration in a Eucalyptus plantation in Congo. For. Ecol. Manag. 2004, 202, 149–160. [Google Scholar] [CrossRef]
  51. Sotta, E.D.; Veldkamp, E.; Guimaraes, B.R.; Paixao, R.K.; Ruivo, M.L.P.; Almeida, S.S. Landscape and climatic controls on spatial and temporal variation in soil CO2 efflux in an Eastern Amazonian Rainforest, Caxiuana, Brazil. For. Ecol. Manag. 2006, 237, 57–64. [Google Scholar] [CrossRef]
  52. Li, Y.; Xu, M.; Zou, X. Heterotrophic soil respiration in relation to environmental factors and microbial biomass in two wet tropical forests. Plant Soil. 2006, 281, 193–201. [Google Scholar] [CrossRef]
  53. Xu, L.; Baldocchi, D.D.; Tang, J. How soil moisture, rain pulses, and growth alter the response of ecosystem respiration to temperature. Glob. Biogeochem. Cycles 2004, 18, GB4002. [Google Scholar] [CrossRef]
  54. Salomon, R.; Valbuena-Carabana, M.; Gil, L.; McGuire, M.; Teskey, R.; Aubrey, D.; Gonzalez-Doncel, I.; Rodriguez-Calcerrada, J. Temporal and spatial patterns of internal and external stem CO2 fluxes in a sub-Mediterranean oak. Tree Physiol. 2016, 36, 1409–1421. [Google Scholar] [PubMed]
  55. Rodríguez-Calcerrada, J.; Martin-StPaul, N.K.; Lempereur, M.; Ourcival, J.-M.; Rey, M.d.C.d.; Joffre, R.; Rambal, S. Stem CO2 efflux and its contribution to ecosystem CO2 efflux decrease with drought in a Mediterranean forest stand. Agric. For. Meteorol. 2014, 195–196, 61–72. [Google Scholar] [CrossRef]
Figure 1. The geographic location of the research station.
Sustainability 15 16050 g001
Figure 2. Photos of experiments. (a) The platform was established to access the top of the canopy. (b) The PVC collars were set at heights of 1.5, 3.0 and 4.5 m above ground along the tree.
Sustainability 15 16050 g002
Figure 3. Annual variation of (a) temperature (Ts and Ta), (b) LAI and (c) VWC.
Sustainability 15 16050 g003
Figure 4. (a) Annual variation of height experiment. (b) Annual mean value of height experiment.
Sustainability 15 16050 g004
Figure 5. Stem CO2 efflux rate per stem surface area Ea (a) and per stem volume Ev (b) for three height classes in 2019–2020.
Sustainability 15 16050 g005
Figure 6. Relationship of the Ea (μmol m−2 s−1) and Ev (μmol m−3 s−1) with VWC (%) and LAI (m2·m−2). (A) The interpretation of VWC and Ea 1.5 m. (B) The interpretation of LAI and Ea 1.5 m. (C) The interpretation of VWC and Ev 1.5 m. (D) The interpretation of LAI and Ev 1.5 m. (E) The interpretation of VWC and Ev 3.0 m. (F) The interpretation of LAI and Ev 3.0 m. (G) The interpretation of VWC and Ev 4.5 m. (H) The interpretation of LAI and Ev 4.5 m.
Sustainability 15 16050 g006
Figure 7. (a) Annual variations in Es, Ev and Reco. (b) Annual variation in the ratio between two extrapolation methods (Ea and Ev) and Reco.
Sustainability 15 16050 g007
Table 1. Characteristics of four sample rubber trees in the height experiment.
TreeAge (Years)Diameter of 1.5 m Height (cm)Diameter of 3.0 m Height (cm)Diameter of 4.5 m Height (cm)Height (m)Tapped Years
TJ3012020.518.818.116.912
TJ3022019.717.716.116.612
TJ3032022.319.719.318.512
TJ3041921.720.120.017.111
Table 2. Correlation coefficients (r) and P-values between Ea, Ev and impacting factors in 2019–2020.
TaTsVWCLAI
Ear−0.001 **0.004 **0.505 **0.663 **
Evr−0.068 **−0.042 **0.394 **0.56 **
Asterisks indicate the level of significance (* = p < 0.05, ** = p < 0.01).
Disclaimer/Publisher’s Note: The statements, opinions and data contained in all publications are solely those of the individual author(s) and contributor(s) and not of MDPI and/or the editor(s). MDPI and/or the editor(s) disclaim responsibility for any injury to people or property resulting from any ideas, methods, instructions or products referred to in the content.