
Measuring Supply Chain Performance for Khanh Hoa Sanest Soft Drink Joint Stock Company: An Application of the Supply Chain Operations Reference (SCOR) Model

Abstract
:1. Introduction
1.1. Khanh Hoa Salanganes Nest Company and EBN Products
1.2. Objective
1.3. Scope
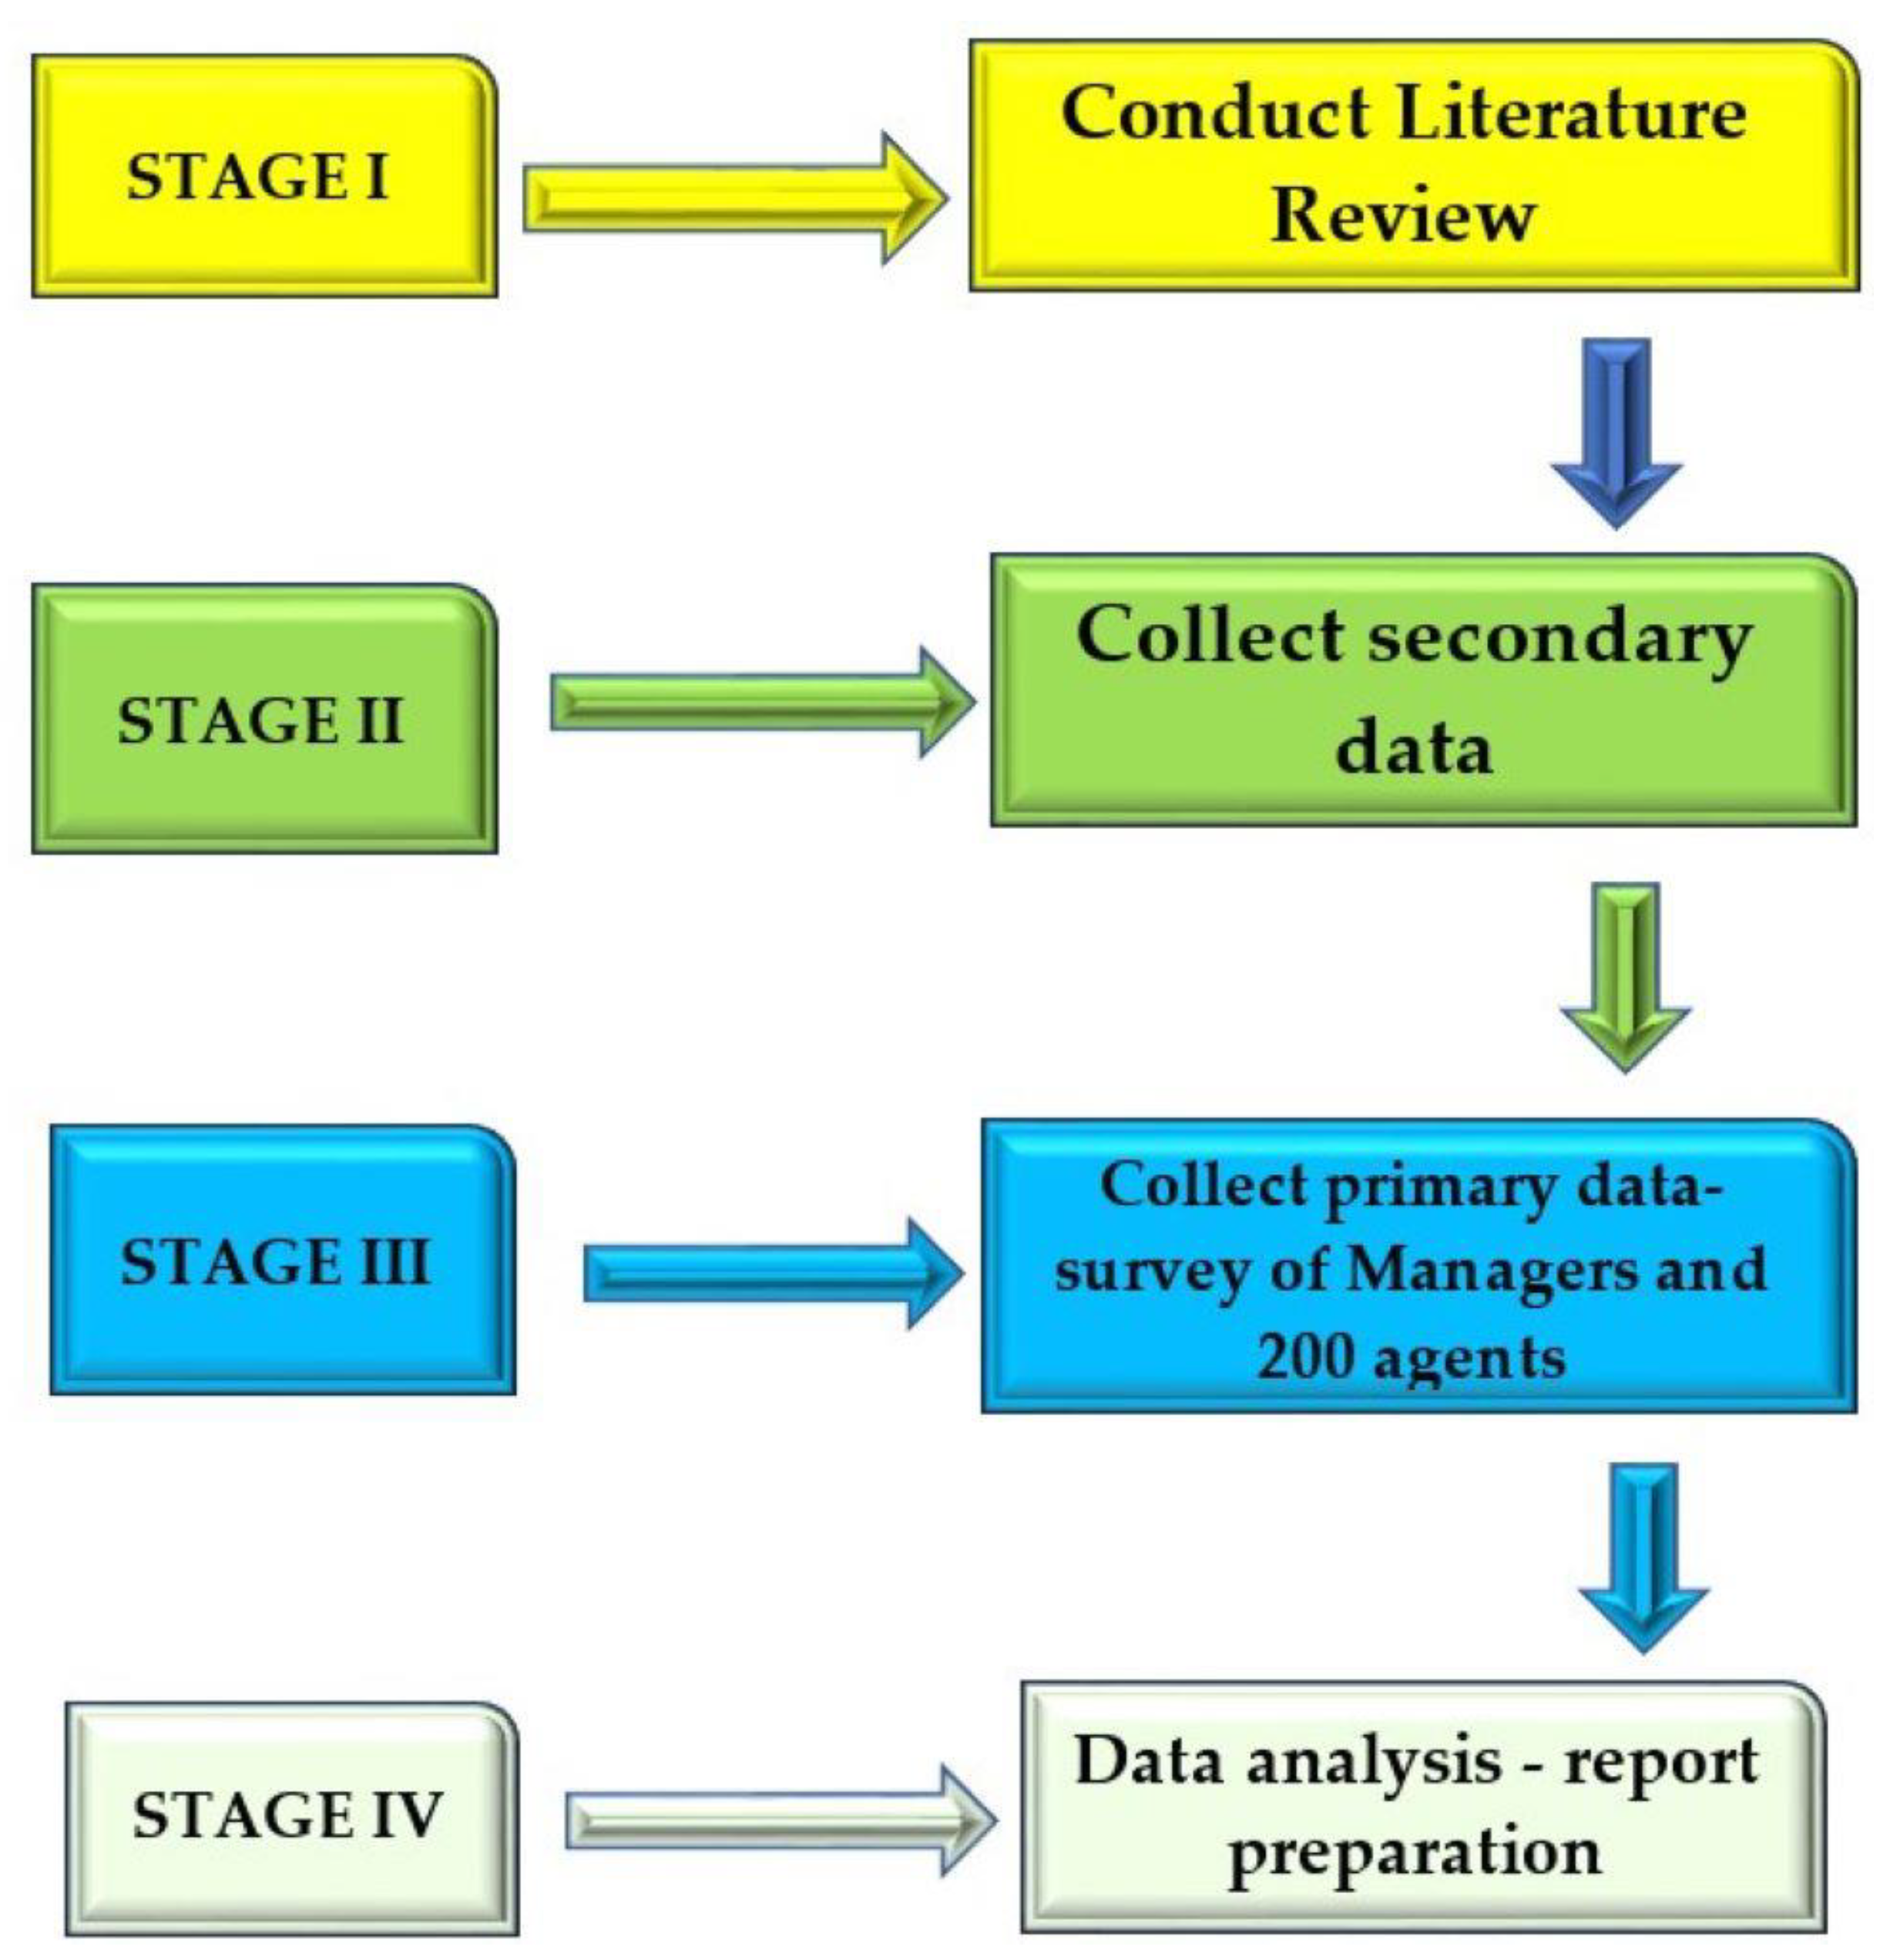
2. Materials and Methods
2.1. Literature Review and Research Overview
2.1.1. What Is SCM?
2.1.2. Measuring SC Performance
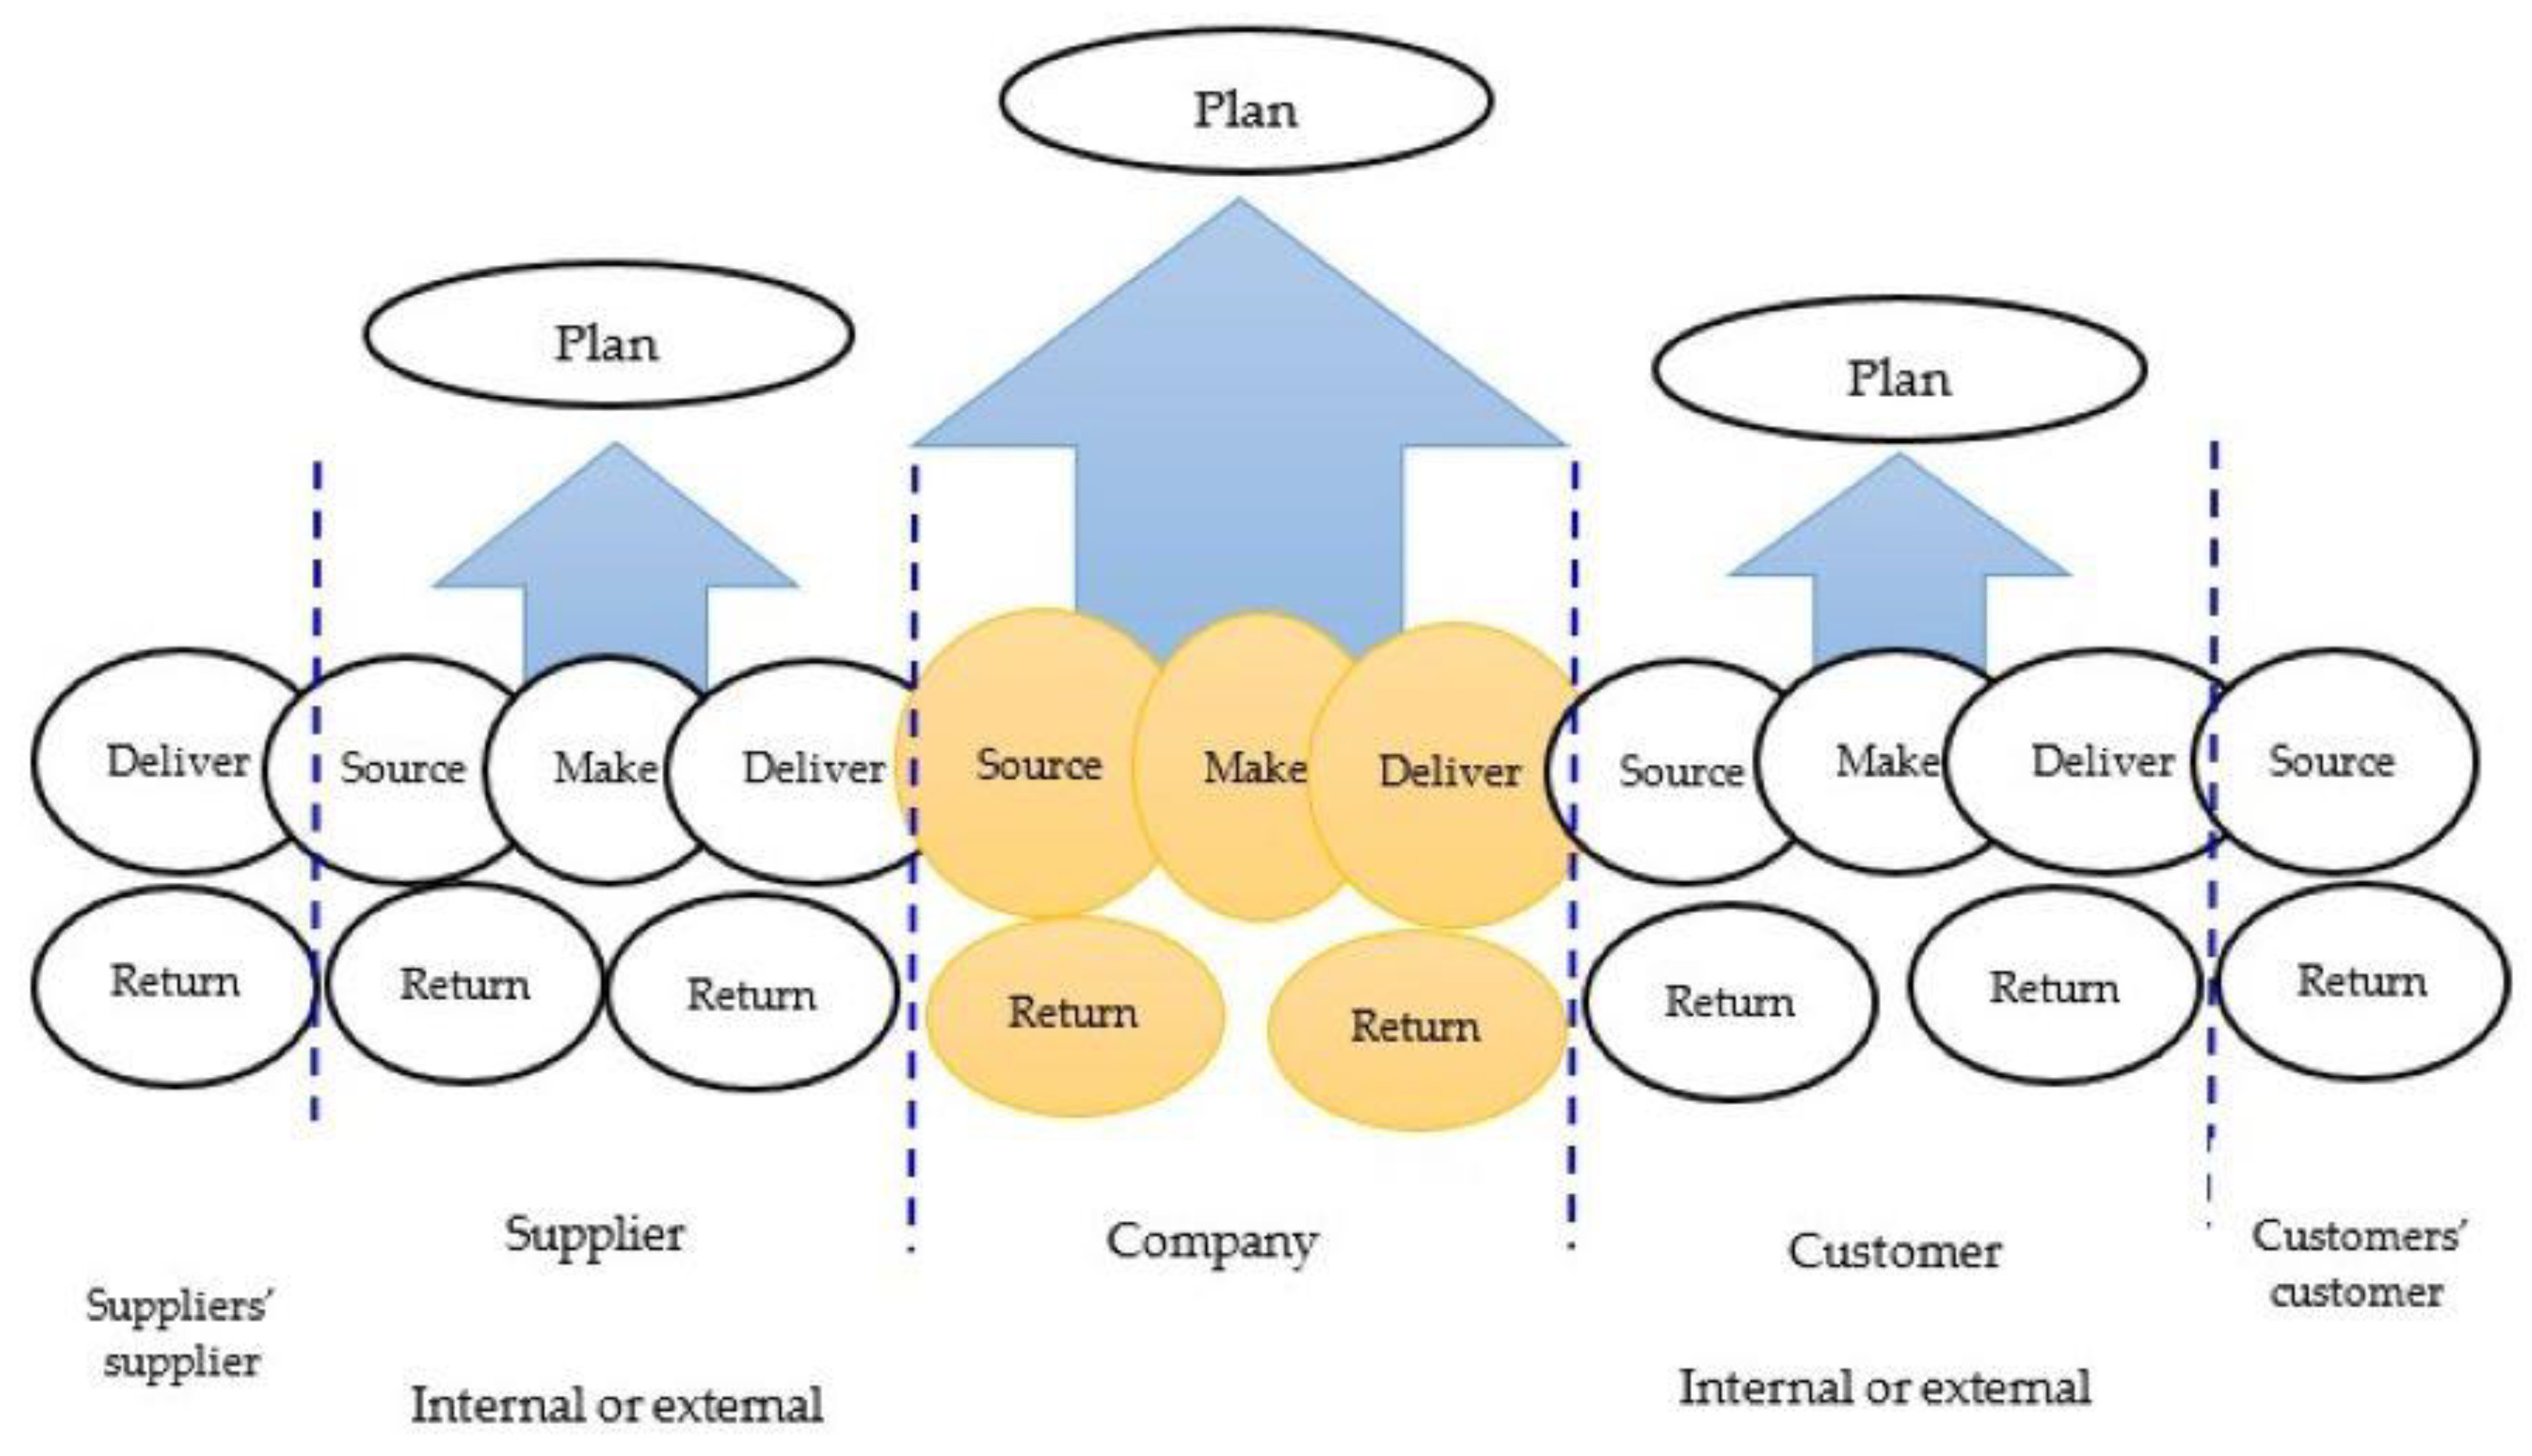
2.1.3. Measuring SCP Using the SCOR Model

3. Research Results and Discussion
3.1. Salangane Nest Product Supply Chain
3.2. Analyzing the Salangane Nest Product SC with the SCOR Model
3.2.1. Plan
3.2.2. Source
3.2.3. Make
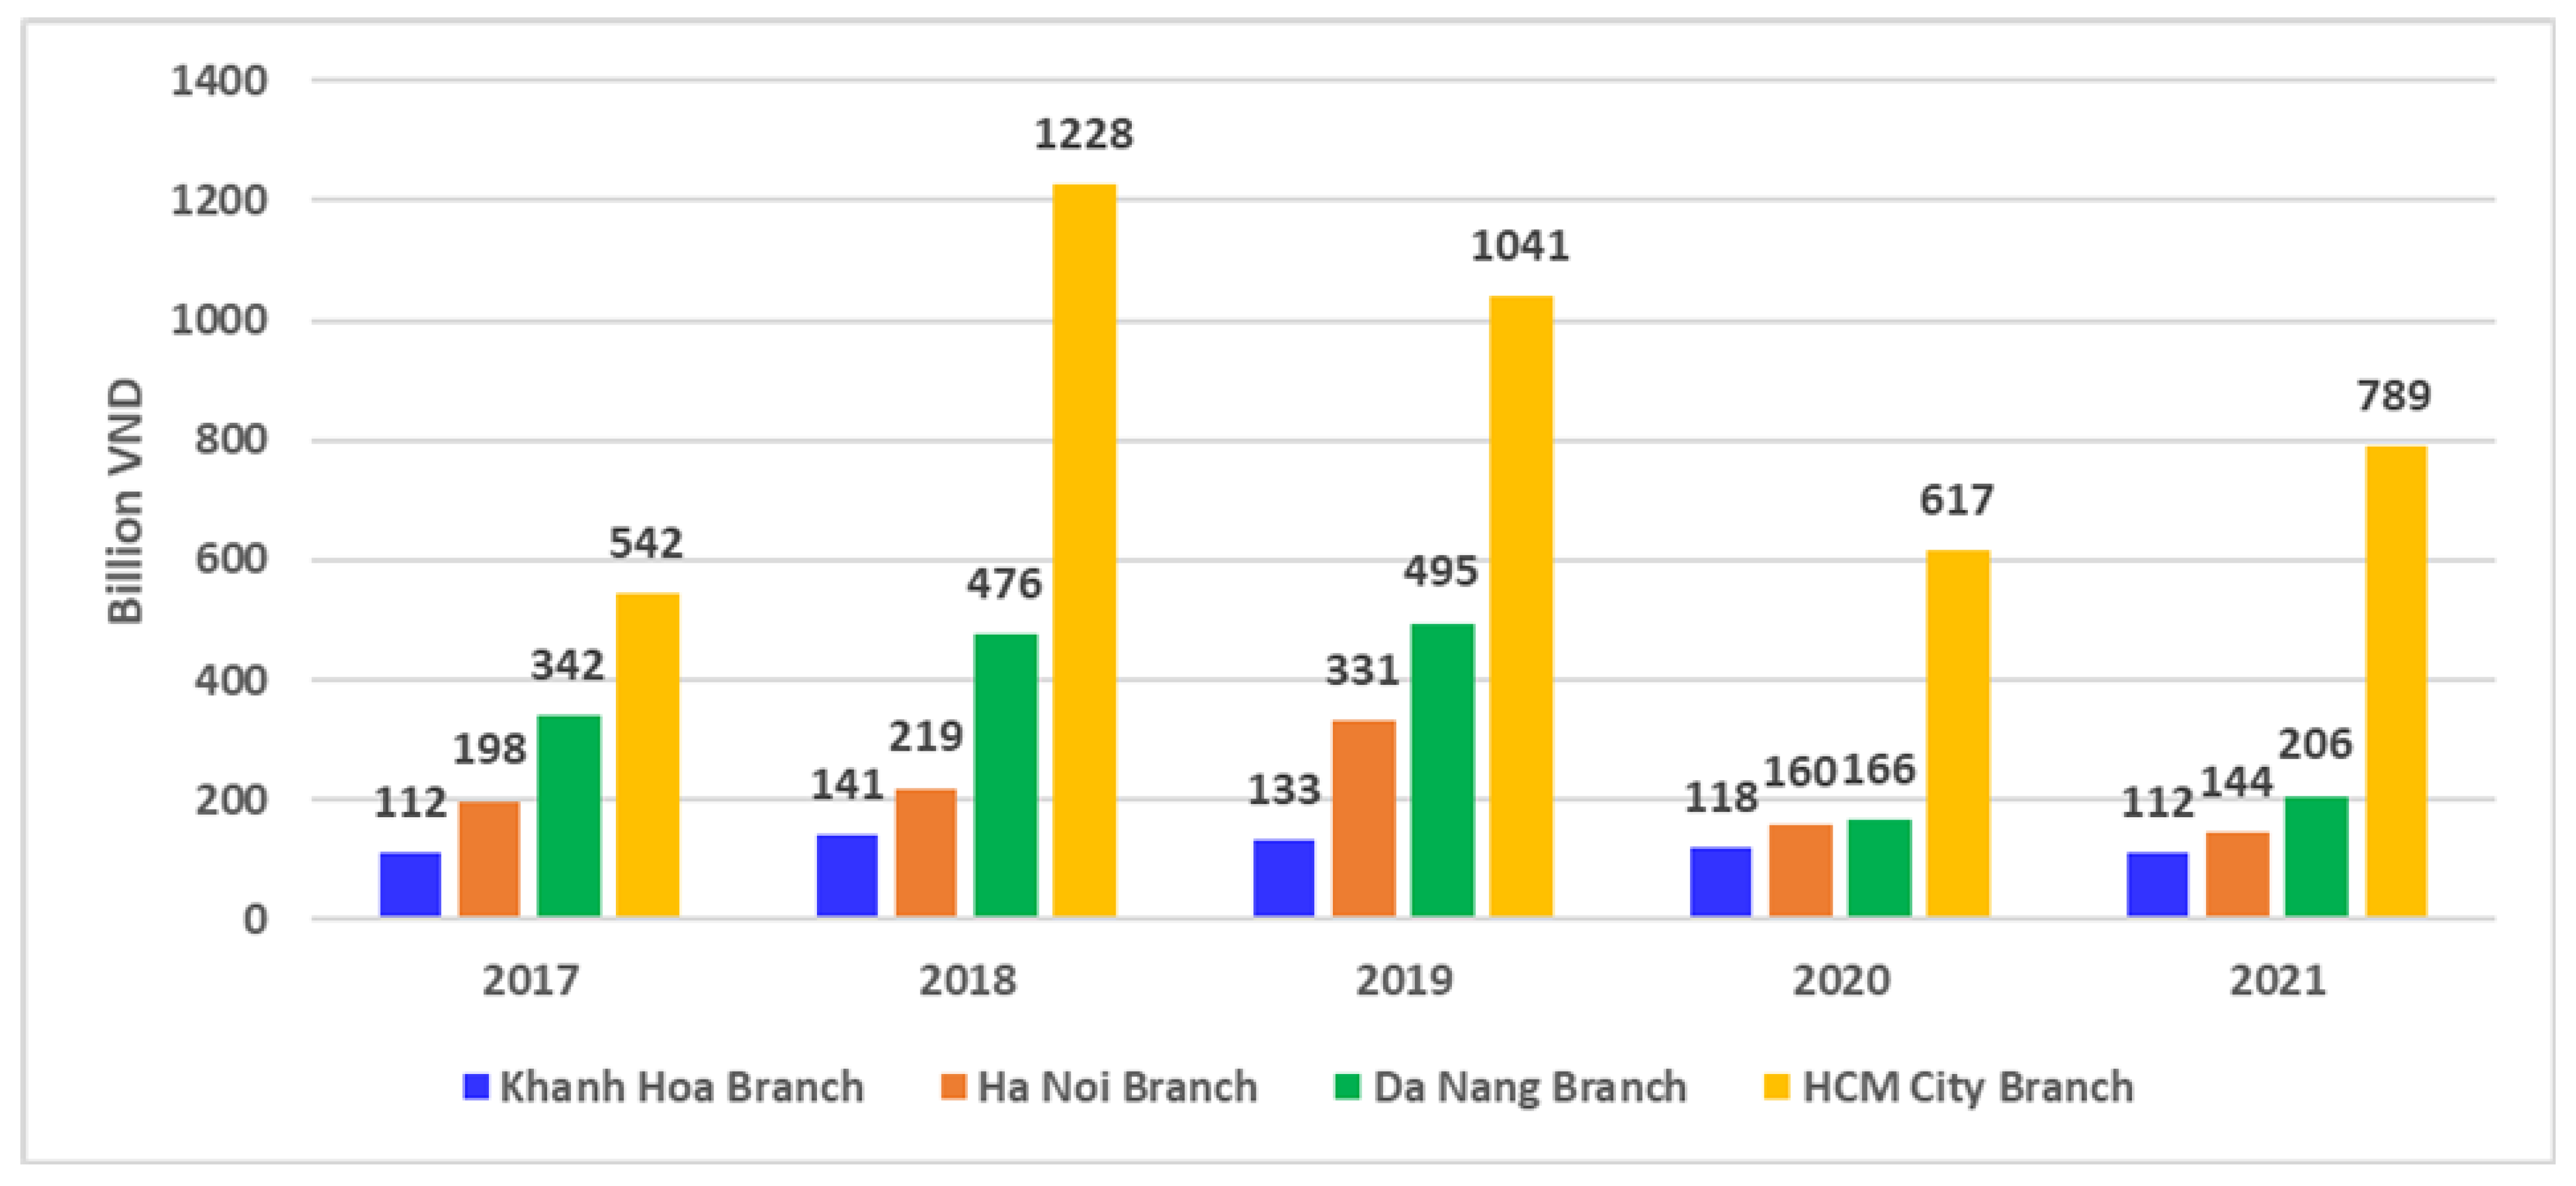
3.2.4. Deliver
3.2.5. Returns
3.3. Measuring the Performance of the Salangane Nest Product SC
3.3.1. Measure Performance through Nonfinancial and Financial Metrics
3.3.2. Measure Performance Based on Customer Surveys
4. Discussion and Conclusions
5. Recommendations
Author Contributions
Funding
Institutional Review Board Statement
Informed Consent Statement
Data Availability Statement
Acknowledgments
Conflicts of Interest
Appendix A


| Items | Unit | 2017 | 2018 | 2019 | 2020 | 2021 | Comment |
|---|---|---|---|---|---|---|---|
| 1. Order fulfillment rate | |||||||
| Total number of deliveries in the year | Times | 4365 | 4626 | 4825 | 3544 | 3347 | The order fulfilment rate was good. The number of orders increased during 2017–2019 and began to decline from 2020. |
| Number of right deliveries | Times | 4365 | 4626 | 4825 | 3544 | 3347 | |
| Number of failed deliveries (domestic and international) | Times | 0 | 0 | 0 | 0 | 0 | |
| 2. The number of supplier contracts | |||||||
| Number of contracts | Contract | 46 | 46 | 50 | 40 | 40 | The number of contracts, the number of deliveries not on time, wrong quality and wrong quantity decreased from 2017 to 2021, and the number of cancellations of contracts increased in 2020. |
| Supplier delivery not on time | Times | 168 | 163 | 160 | 120 | 108 | |
| Supplier delivery of wrong quality | Times | 126 | 122 | 120 | 80 | 72 | |
| Supplier delivery of wrong quantity | Times | 42 | 41 | 40 | 40 | 36 | |
| Cancellation of contract | Times | 0 | 0 | 0 | 10 | 0 | |
| 3. Return on assets | |||||||
| Profit after tax (1) | VND | 198,029,041,364 | 209,591,554,787 | 214,367,845,959 | 174,279,285,612 | 143,876,584,008 | ROA decreased over the years because profit after tax decreased; however, total assets increased. |
| Total assets (2) | VND | 1,089,621,958,754 | 1,184,371,694,298 | 1,275,682,738,113 | 1,429,704,217,840 | 1,486,892,386,553 | |
| Return on total assets ROA (3) = (1)/(2) | % | 18.17 | 17.70 | 16.80 | 12.19 | 9.68 | |
| 4. Working capital turnover | |||||||
| Net revenue (1) | VND | 3,919,077,019,258 | 4,198,692,522,783 | 3,729,688,212,182 | 3,069,641,025,055 | 2,511,224,273,092 | Working capital turnover decreased over the years due to decreasing revenue. |
| Short-term assets (2) | VND | 537,837,398,841 | 557,608,124,829 | 616,956,775,336 | 752,571,689,325 | 782,997,530,758 | |
| Short-term debt (3) | VND | 159,084,805,979 | 168,931,540,872 | 196,086,589,649 | 300,422,682,180 | 289,853,958,754 | |
| Working capital (4) = (2)–(3) | VND | 378,752,592,862 | 388,676,583,957 | 420,870,185,687 | 452,149,007,145 | 493,143,572,004 | |
| Average working capital (5) = (4)/12 | VND | 31,562,716,072 | 32,389,715,330 | 35,072,515,474 | 37,679,083,929 | 41,095,297,667 | |
| Working capital turnover (6) = (1)/(5) | Ratio | 124.17 | 129.63 | 106.34 | 81.47 | 61.11 | |
| 5. Inventory turnover | |||||||
| Cost of goods sold (1) | VND | 2,952,113,655,087 | 3,113,841,166,752 | 2,785,722,618,342 | 2,338,892,926,779 | 1,910,875,521,178 | Inventory turnover decreased due to a decrease in the cost of goods sold. |
| Average Inventory (2) | VND | 160,006,626,155 | 178,589,030,157 | 220,680,189,840 | 233,406,382,189 | 198,983,356,707 | |
| Inventory turnover (3) = (1)/(2) | Ratio | 18.45 | 17.44 | 12.62 | 10.02 | 9.60 | |
| Stock cover day = 365/(3) | Days | 19.78 | 20.93 | 28.91 | 36.42 | 38.01 | |
References
- Arzu, G.; Erkan, T. Supply Chain Performance Measurement: A Literature Review. Int. J. Prod. Res. 2010, 48, 5137–5155. [Google Scholar] [CrossRef]
- Puigjaner, L.; Lainez, J.M. Capturing Dynamics in Integrated Supply Chain Management. Comput. Chem. Eng. 2008, 32, 2582–2605. [Google Scholar] [CrossRef]
- Sobirov, B. The Concept of the Tourist Economic Zone: Case of Uzbekistan. World Sci. News 2018, 98, 34–45. [Google Scholar]
- Gunasekaran, A.; Williams, H.J.; McGaughey, R.E. Performance Measurement and Costing System in New Enterprise. Technovation 2005, 25, 523–533. [Google Scholar] [CrossRef]
- Babenko, V.; Chebanova, N.; Ryzhikova, N.; Rudenko, S.; Birchenko, N. Research into the Process of Multi-Level Management of Enterprise Production Activities with Taking Risks into Consideration. East.-Eur. J. Enterp. Technol. 2018, 1, 4–12. [Google Scholar] [CrossRef]
- Meixell, M.J.; Gargeya, V.B. Global Supply Chain Design: A Literature Review and Critique. Transp. Res. E Logist. Transp. 2005, 41, 531–550. [Google Scholar] [CrossRef]
- Xu, J.; She, S.; Liu, W. Role of Digitalization in Environment, Social and Governance, and Sustainability: Review-Based Study for Implications. Front. Psychol. 2022, 13, 961057. [Google Scholar] [CrossRef]
- Agami, N.; Saleh, M.; Rasmy, M. Supply Chain Performance Measurement Approaches: Review and Classification. J. Organ. Manag. Stud. 2012, 2012, 1. [Google Scholar] [CrossRef]
- Lima-Junior, F.R.; Carpinetti, L.C.R. Quantitative Models for Supply Chain Performance Evaluation: A Literature Review. Comput. Ind. Eng. 2017, 113, 333–346. [Google Scholar] [CrossRef]
- Huang, S.H.; Sheoran, S.K.; Wang, G. A Review and Analysis of Supply Chain Operations Reference (SCOR) Model. Supply Chain Manag. 2004, 9, 23–29. [Google Scholar] [CrossRef]
- Lockamy, A.; McCormack, K. Linking SCOR Planning Practices to Supply Chain Performance: An Exploratory Study. Int. J. Oper. Prod. Manag. 2004, 24, 1192–1218. [Google Scholar] [CrossRef]
- SCC. Supply Chain Operations Reference Model Revision 11.0. 2012. Available online: https://docs.huihoo.com/scm/supply-chain-operations-reference-model-r11.0.pdf (accessed on 30 June 2022).
- Jacobs, F.R.; Chase, R.B.; Lummus, R.R. Operations and Supply Chain Management; McGraw-Hill/Irwin: New York, NY, USA, 2014. [Google Scholar]
- Khan, S.A.R.; Piprani, A.Z.; Yu, Z. Supply Chain Analytics and Post-Pandemic Performance: Mediating Role of Triple—A Supply Chain Strategies. Int. J. Emerg. Mark. 2023, 18, 1330–1354. [Google Scholar] [CrossRef]
- Khan, S.A.R.; Yu, Z. A Systematic Literature Review: Blockchain Technology and Organizational Theories in the Perspective of Supply Chain Management. J. Phys. Conf. Ser. 2021, 1910, 012011. [Google Scholar] [CrossRef]
- Pang, N.T.P.; Imon, G.N.; Johoniki, E.; Kassim, M.A.M.; Omar, A.; Rahim, S.S.S.A.; Hayati, F.; Jeffree, M.S.; Ng, J.R. Fear of COVID-19 and COVID-19 Stress and Association with Sociodemographic and Psychological Process Factors in Cases under Surveillance in a Frontline Worker Population in Borneo. Int. J. Environ. Res. Public Health 2021, 18, 7210. [Google Scholar] [CrossRef] [PubMed]
- Chantler, P.; Wells, D.; Schuchmann, K. Family Apodidae (Swifts). In Handbook of the Birds of the World; Lynx: Barcelona, Spain, 1999; Volume 5, pp. 388–457. [Google Scholar]
- Marcone, M.F. Characterization of the Edible Bird’s Nest the ‘Caviar of the East’. Food Res. Int. 2005, 38, 1125–1134. [Google Scholar] [CrossRef]
- Adebayo, O.M.; Panandam, J.M.; Sugnaseelan, S.; Tan, S.G. Mitochondrial DNA Variability of Edible Bird Nest Swiftlet (Aerodramus fuciphagus) Colonies in Malaysia. Int. J. Sci. Res. Publ. 2020, 10, 49–57. [Google Scholar] [CrossRef]
- Norhayati, M.; Azman, O.; Wan Nazaimoon, W. Preliminary Study of the Nutritional Content of Malaysian Edible Bird’s Nest. Malays. J. Nutr. 2010, 16, 389–396. [Google Scholar]
- Guo, C.T.; Takahashi, T.; Bukawa, W.; Takahashi, N.; Yagi, H.; Kato, K.; Suzuki, Y. Edible Bird’s Nest Extract Inhibits Influenza Virus Infection. Antivir. Res. 2006, 70, 140–146. [Google Scholar] [CrossRef]
- Rahman, M.; Ghazali, P.L.; Lian, C.J.; Basari, N.; Mamat, M.; Foziah, H.; Afthanorhan, A. Suitable ranching practices in successful edible bird nest swiftlet houses in Terengganu. Int. J. Recent Technol. Eng. 2019, 7, 60–64. [Google Scholar]
- Aowphol, A.; Voris, H.K.; Feldheim, K.A.; Harnyuttanakorn, P.; Thirakhupt, K. Genetic Homogeneity Among Colonies of the White-Nest Swiftlet (Aerodramus fuciphagus) in Thailand. Zool. Sci. 2008, 25, 372–380. [Google Scholar] [CrossRef]
- Nag, B.; Han, C.; Yao, D.Q. Mapping Supply Chain Strategy: An Industry Analysis. J. Manuf. Technol. Manag. 2014, 25, 351–370. [Google Scholar] [CrossRef]
- Chopra, S.; Meindl, P. Supply Chain Management Strategy: Planning and Operation; Pearson Prentice Hall: New York, NY, USA, 2007. [Google Scholar]
- Lambert, D.M.; Cooper, M.C. Issues in Supply Chain Management. Ind. Mark. Manag. 2000, 29, 65–83. [Google Scholar] [CrossRef]
- Levi, S.D.; Kaminsky, P.; Levi, E.S. Designing and Managing the Supply Chain: Concepts Strategies and Case Studies; McGraw-Hill Education: New York, NY, USA, 2008. [Google Scholar]
- Kusrini, E.; Rifai, M.A.B.; Miranda, S. Performance Measurement Using Supply Chain Operation Reference (SCOR) Model: A Case Study in a Small-Medium Enterprise (SME) in Indonesia. IOP Conf. Ser. Mater. Sci. Eng. 2019, 697, 012014. [Google Scholar] [CrossRef]
- Shukla, R.K.; Garg, D.D.; Agarwal, D.A. Understanding of Supply Chain: A Literature Review. Int. J. Eng. Sci. Technol. 2011, 3, 2059–2072. [Google Scholar]
- Oubrahim, I.; Sefiani, N. Supply Chain Performance Measurement Systems: Benefits and Drawbacks. Int. J. Latest Eng. Manag. Res. 2022, 7, 24–28. [Google Scholar] [CrossRef]
- Ambe, I.M. Key Indicators for Optimizing Supply Chain Performance: The Case of Light Vehicle Manufacturers in South Africa. J. Appl. Bus. Res. 2014, 30, 277–290. [Google Scholar] [CrossRef]
- Hwang, G.; Han, S.; Jun, S.; Park, J. Operational Performance Metrics in Manufacturing Process: Based on SCOR Model and RFID Technology. Int. J. Innov. Technol. Manag. 2014, 5, 50–55. [Google Scholar] [CrossRef]
- Sutopo, W.; Maryanie, D.I.; Yuniaristanto. Evaluation of Valuable Chain in Palm Oil Industry Based on SCOR Model: A Case Study. Int. J. Logist. Syst. Manag. 2015, 21, 229–244. [Google Scholar] [CrossRef]
- Ikasari, N.; Sutopo, W.; Zakaria, R. Performance Measurement in Supply Chain Using SCOR Model in the Lithium Battery Factory. IOP Conf. Ser. Mater. Sci. Eng. 2020, 943, 012049. [Google Scholar]
- Jagan Mohan Reddy, K.; Neelakanteswara Rao, A.; Krishnanand, L. A Review on Supply Chain Performance Measurement Systems. Procedia Manuf. 2019, 30, 40–47. [Google Scholar] [CrossRef]
- SCC. Supply Chain Operations Reference Model Overview Version 7.0. 2005. Available online: https://www.scpiteam.com/SCOR%207.0%20Overview.pdf (accessed on 12 July 2022).
- Nasab, S. Strategic Orientation in Evaluation of Supply Chain Activities. Manag. Sci. Lett. 2012, 2, 1785–1794. [Google Scholar]
- Otto, A.; Kotzab, H. Does Supply Chain Management Really Pay? Six Perspectives to Measure the Performance of Managing a Supply Chain. Eur. J. Oper. Res. 2003, 144, 306–320. [Google Scholar] [CrossRef]
- Gunasekaran, A.; Patel, C.; McGaughey, R.E. A Framework for Supply Chain Performance Measurement. Int. J. Prod. Econ. 2004, 87, 333–347. [Google Scholar] [CrossRef]
- Khan, M.; Bashar, I.; Minhaj, G.M.; Wasi, A.I.; Hossain, N.U.I. Resilient and Sustainable Supplier Selection: An Integration of SCOR 4.0 and Machine Learning Approach. Sustain. Resilient Infrastruct. 2023, 8, 453–469. [Google Scholar] [CrossRef]
- Es-Satty, A.; Lemghari, R.; Okar, C. Supply Chain Digitalization Overview SCOR Model Implication. In Proceedings of the 13th International Colloquium of Logistics and Supply Chain Management, Fez, Morocco, 2–4 December 2020. [Google Scholar] [CrossRef]
- Ayyildiz, E.; Taskin Gumus, A. Interval-Valued Pythagorean Fuzzy AHP Method-Based Supply Chain Performance Evaluation by a New Extension of SCOR Model: SCOR 4.0. Complex Intell. Syst. 2021, 7, 559–576. [Google Scholar] [CrossRef]
- Erkan, T.E.; Bac, U. Supply Chain Performance Measurement: A Case Study About Applicability of SCOR Model in a Manufacturing Industry Firm. Int. J. Bus. Manag. Stud. 2011, 3, 381–390. [Google Scholar]
- Manay, L.O.R.; Pradas, I.G.; Perez, I.M. Measuring the Supply Chain Performance of the Floricultural Sector Using the SCOR Model and a Multicriteria Decision-Making Method. Horticulturae 2022, 8, 168. [Google Scholar] [CrossRef]
- Huang, S.H.; Sheoran, S.K.; Keskar, H. Computer-Assisted Supply Chain Configuration Based on Supply Chain Operations Reference (SCOR) Model. Comput. Ind. Eng. 2005, 48, 377–394. [Google Scholar] [CrossRef]
- Saleheen, F.; Habib, M.M.; Hanafi, Z. Supply Chain Performance Measurement Model: A Literature Review. Int. J. Supply Chain Manag. 2018, 7, 70–78. [Google Scholar]
- Freitas, A.A.; Carvalho, A.C.P.F. A Tutorial on Hierarchical Classification with Applications in Bioinformatics. In Research and Trends in Data Mining Technologies and Applications; Taniar, D., Ed.; IGI Publishing: Hershey, PA, USA, 2007; pp. 176–209. [Google Scholar]
- Costa, E.P.; Lorena, A.C.; Carvalho, A.C.; Freitas, A.A. A Review of Performance Evaluation Measures for Hierarchical Classifiers. In Evaluation Methods for Machine Learning II: Papers from the AAAI-2007 Workshop; AAAI Press: Washington, DC, USA, 2007. [Google Scholar]
- Kamble, S.S.; Gunasekaran, A.; Ghadge, A.; Raut, R. A Performance Measurement System for Industry 4.0 Enabled Smart Manufacturing System in SMMEs: A Review and Empirical Investigation. Int. J. Prod. Econ. 2020, 229, 107853. [Google Scholar] [CrossRef]
- Gunasekaran, A.; Kobu, B. Performance Measures and Metrics in Logistics and Supply Chain Management: A Review of Recent Literature (1995–2004) for Research and Applications. Int. J. Prod. Res. 2007, 45, 2819–2840. [Google Scholar] [CrossRef]
- Yang, C.C.; Yang, K.J.; Yeh, T.M.; Pai, F.Y. Methods for Determining Areas for Improvement Based on the Design of Customer Surveys. Serv. Ind. J. 2009, 29, 143–154. [Google Scholar] [CrossRef]
- Delipinar, G.E.; Kocaoglu, B. Using SCOR Model to Gain Competitive Advantage: A Literature Review. Procedia Soc. Behav. Sci. 2016, 229, 398–406. [Google Scholar] [CrossRef]
- Trkman, P. The Impact of Business Analytics on Supply Chain Performance. Decis. Support Syst. 2010, 49, 318–327. [Google Scholar] [CrossRef]
- Lima-Junior, F.R.; Carpinetti, L.C.R. Predicting Supply Chain Performance Based on SCOR® Metrics and Multilayer Perceptron Neural Networks. Int. J. Prod. Econ. 2019, 212, 19–38. [Google Scholar] [CrossRef]
- Chehbi-Gamoura, S.; Derrouiche, R.; Damand, D.; Barth, M. Insights from Big Data Analytics in Supply Chain Management: An All-Inclusive Literature Review Using the SCOR Model. Prod. Plan. Control 2020, 31, 355–382. [Google Scholar] [CrossRef]
- Persson, F.; Araldi, M. The Development of a Dynamic Supply Chain Analysis Tool—Integration of SCOR and Discrete Event Simulation. Int. J. Prod. Econ. 2009, 121, 574–583. [Google Scholar] [CrossRef]
- Huang, S.H.; Uppal, M.; Shi, J. A product driven approach to manufacturing supply chain selection. Supply Chain. Manag. Int. J. 2002, 7, 189–199. [Google Scholar] [CrossRef]


| Performance Attributes | Definition | Level 1 Metric | |
|---|---|---|---|
| Customer-facing | Reliability | The performance of the supply chain in delivering: the correct product, to the correct place, at the correct time, in the correct condition and packaging, in the correct quantity, with the correct documentation, to the correct customer. | Delivery performance |
| Fill rates | |||
| Perfect order fulfillment | |||
| Responsiveness | The velocity at which a supply chain provides products to the customer. | Order fulfillment lead time | |
| Agility | The agility of a supply chain in responding to marketplace changes to gain or maintain competitive advantage. | Supply chain response time | |
| Production flexibility | |||
| Internal facing | Costs | The costs associated with operating the supply chain. | Cost of goods sold |
| Total supply chain management costs | |||
| Assets | The effectiveness of an organization in managing assets to support demand satisfaction. This includes the management of all assets: fixed and working capital. | Cash-to-cash cycle time | |
| Inventory days of supply | |||
| Asset turns | |||
| Code | 2017 | 2018 | 2019 | 2020 | 2021 | |||||
|---|---|---|---|---|---|---|---|---|---|---|
| Defective Products | Packaging Cost (USD) | Defective Products | Packaging Cost (USD) | Defective Products | Packaging Cost (USD) | Defective Products | Packaging Cost (USD) | Defective Products | Packaging Cost (USD) | |
| 002 | 207 | 36.05 | 197 | 34.00 | 188 | 31.88 | 207 | 35.15 | 203 | 34.71 |
| 029 | 176 | 30.68 | 168 | 28.94 | 160 | 27.13 | 176 | 29.91 | 172 | 29.54 |
| 700 | 358 | 62.32 | 341 | 58.78 | 325 | 55.12 | 358 | 60.76 | 350 | 60.01 |
| 770 | 397 | 69.03 | 378 | 65.11 | 360 | 61.05 | 396 | 67.30 | 388 | 66.47 |
| 095 | 116 | 30.26 | 110 | 28.54 | 105 | 26.76 | 116 | 29.50 | 113 | 29.14 |
| 096 | 11 | 2.88 | 11 | 2.72 | 10 | 2.55 | 11 | 2.81 | 11 | 2.78 |
| 005 | 61 | 10.55 | 58 | 9.95 | 55 | 9.33 | 61 | 10.28 | 59 | 10.16 |
| 0161 | 138 | 36.02 | 131 | 33.98 | 125 | 31.86 | 138 | 35.12 | 135 | 34.69 |
| Total | 1464 | 277.78 | 1394 | 262.02 | 1328 | 245.69 | 1461 | 270.84 | 1432 | 267.49 |
| Customer-facing | Overview Metrics | SCOR Level 1 Metrics | Unit | Actual | Comments |
| Supply chain reliability | Delivery performance to commit date | % | 100 | The company can delivery all orders from customers (distributors) because of modern equipment machines, materials inventory, and the large plant’s capacity (see Appendix A) | |
| Fill rates | % | 100 | |||
| Responsiveness | Order fulfillment lead times | Days/hours | |||
| Manufacturing lead time | days | 11 | The time it takes to produce is 24 h. For safety and quality, before being accessed to the market, the products are kept in a refrigerated warehouse for 7–10 days to check microbiology and technical quality criteria. | ||
| Flexibility | Supply chain response time | day | |||
| Order fulfillment delivery lead times to Da Nang market | days | 11 + 2 | |||
| Order fulfillment delivery lead times to HCM City market | days | 11 + 2 | |||
| Order fulfillment delivery lead times to Hanoi market | days | 11 + 3.5 | |||
| Order fulfillment delivery lead times at Khanh Hoa market | hours | 11 + 5 | |||
| Production flexibility | days | NA | The demand suddenly increases at the end of the quarter, end of the year, Lunar New Year, and back of the promotion program. This is the safety inventory demand of distributors or agents, not the consumer’s reality need. Due to the large plant’s capacity of two factories, the company always supplies enough products. | ||
| Internal-facing | Cost | Total SCM management costs | % | ||
| Cost of goods sold | % | 75.29 | Appendix A | ||
| Production costs | % | 41.99 | |||
| Assets | Inventory days of supply | days | 28.81 | Appendix A | |
| Cash-to-cash cycle time | days | 43.81 | Including 28.81 days of inventory and 15 accounts receivable days | ||
| Net asset turns (working capital) | turn | 100.54 | Appendix A |
Disclaimer/Publisher’s Note: The statements, opinions and data contained in all publications are solely those of the individual author(s) and contributor(s) and not of MDPI and/or the editor(s). MDPI and/or the editor(s) disclaim responsibility for any injury to people or property resulting from any ideas, methods, instructions or products referred to in the content. |
© 2023 by the authors. Licensee MDPI, Basel, Switzerland. This article is an open access article distributed under the terms and conditions of the Creative Commons Attribution (CC BY) license (https://creativecommons.org/licenses/by/4.0/).
Share and Cite
Nguyen, T.A.T.; Nguyen, T.L.; Nguyen, Q.T.T.; Nguyen, K.A.T.; Jolly, C.M. Measuring Supply Chain Performance for Khanh Hoa Sanest Soft Drink Joint Stock Company: An Application of the Supply Chain Operations Reference (SCOR) Model. Sustainability 2023, 15, 16057. https://doi.org/10.3390/su152216057
Nguyen TAT, Nguyen TL, Nguyen QTT, Nguyen KAT, Jolly CM. Measuring Supply Chain Performance for Khanh Hoa Sanest Soft Drink Joint Stock Company: An Application of the Supply Chain Operations Reference (SCOR) Model. Sustainability. 2023; 15(22):16057. https://doi.org/10.3390/su152216057
Chicago/Turabian StyleNguyen, Tram Anh Thi, Thuy Lan Nguyen, Quynh Trang Thi Nguyen, Kim Anh Thi Nguyen, and Curtis M. Jolly. 2023. "Measuring Supply Chain Performance for Khanh Hoa Sanest Soft Drink Joint Stock Company: An Application of the Supply Chain Operations Reference (SCOR) Model" Sustainability 15, no. 22: 16057. https://doi.org/10.3390/su152216057
APA StyleNguyen, T. A. T., Nguyen, T. L., Nguyen, Q. T. T., Nguyen, K. A. T., & Jolly, C. M. (2023). Measuring Supply Chain Performance for Khanh Hoa Sanest Soft Drink Joint Stock Company: An Application of the Supply Chain Operations Reference (SCOR) Model. Sustainability, 15(22), 16057. https://doi.org/10.3390/su152216057