
Photocatalytic Degradation of Chlorinated Hydrocarbons: The By-Product of the Petrochemical Industry Using Ag-Cu/Graphite Bimetallic Carbon Nitride
 , ,
, ,
Abstract
:1. Introduction
2. Materials and Methods
2.1. Materials
2.2. Laboratory Preparation of the Waste Liquid 1,2 Dichloroethane (DCE)
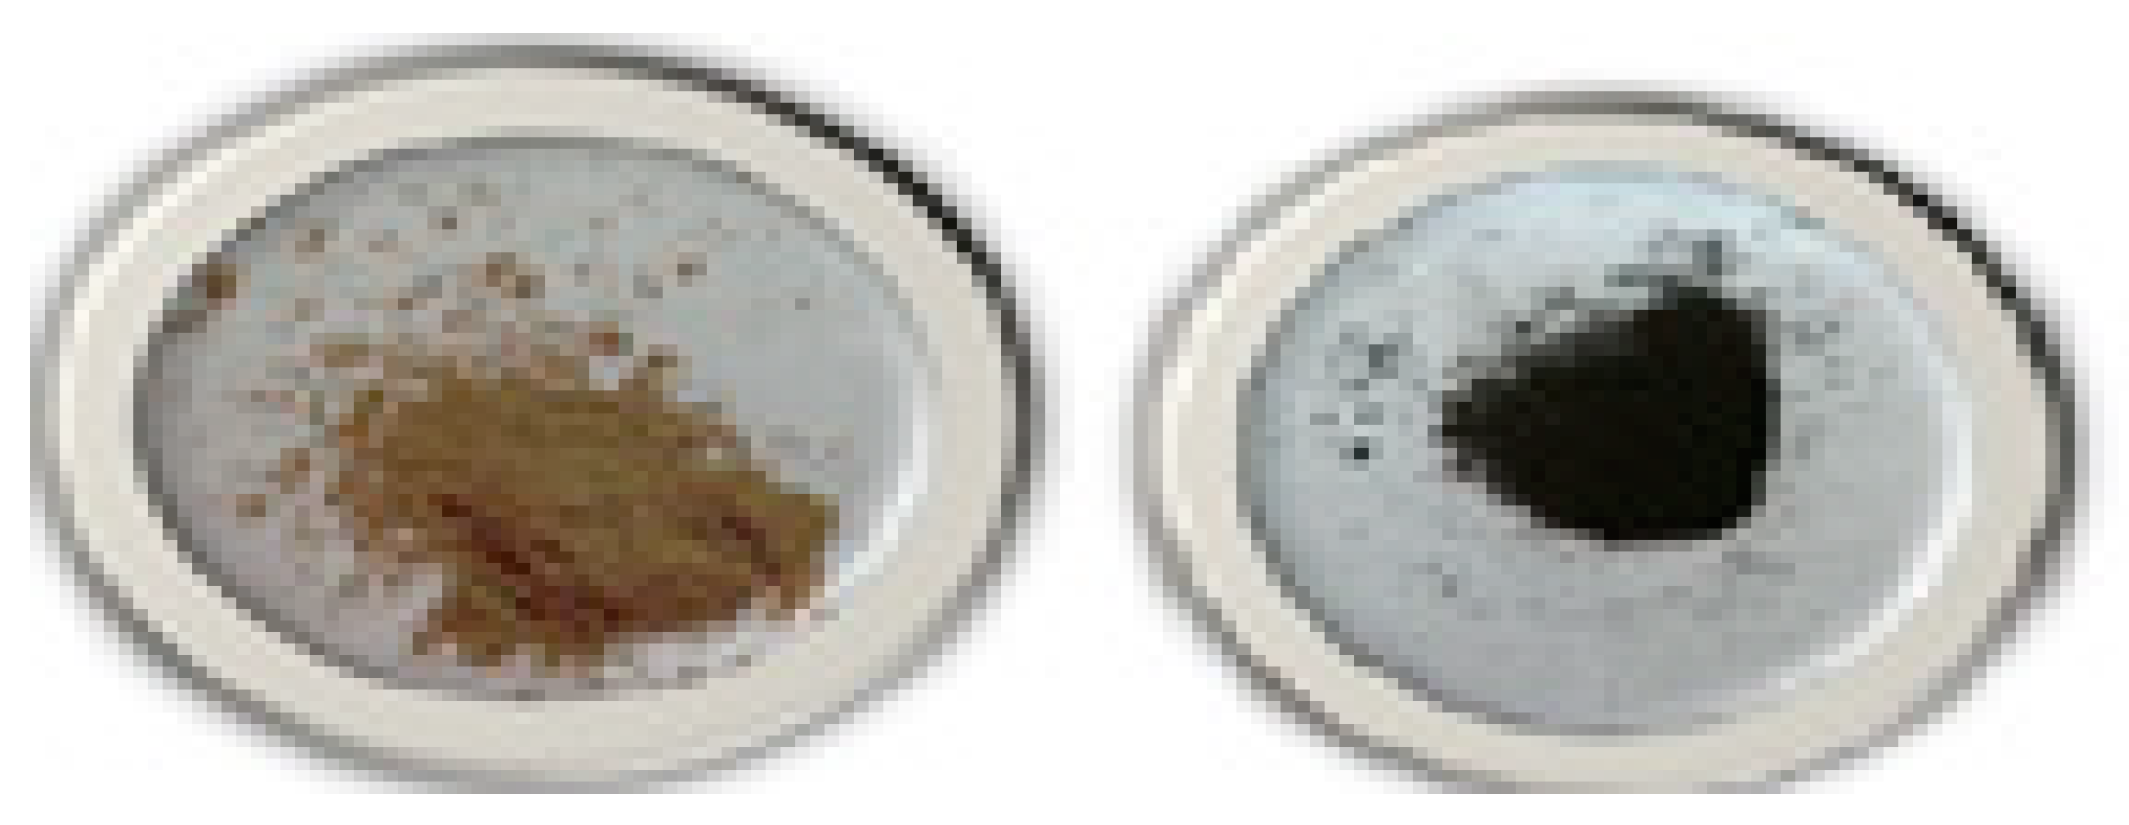
2.3. Synthesis of the g-C3N4 Photo-Catalyst
2.4. Preparation of Ag-Cu/g-C3N4 Catalysts [42]
2.5. Characterization of g-C3N4 and Ag-Cu/g-C3N4 Catalysts
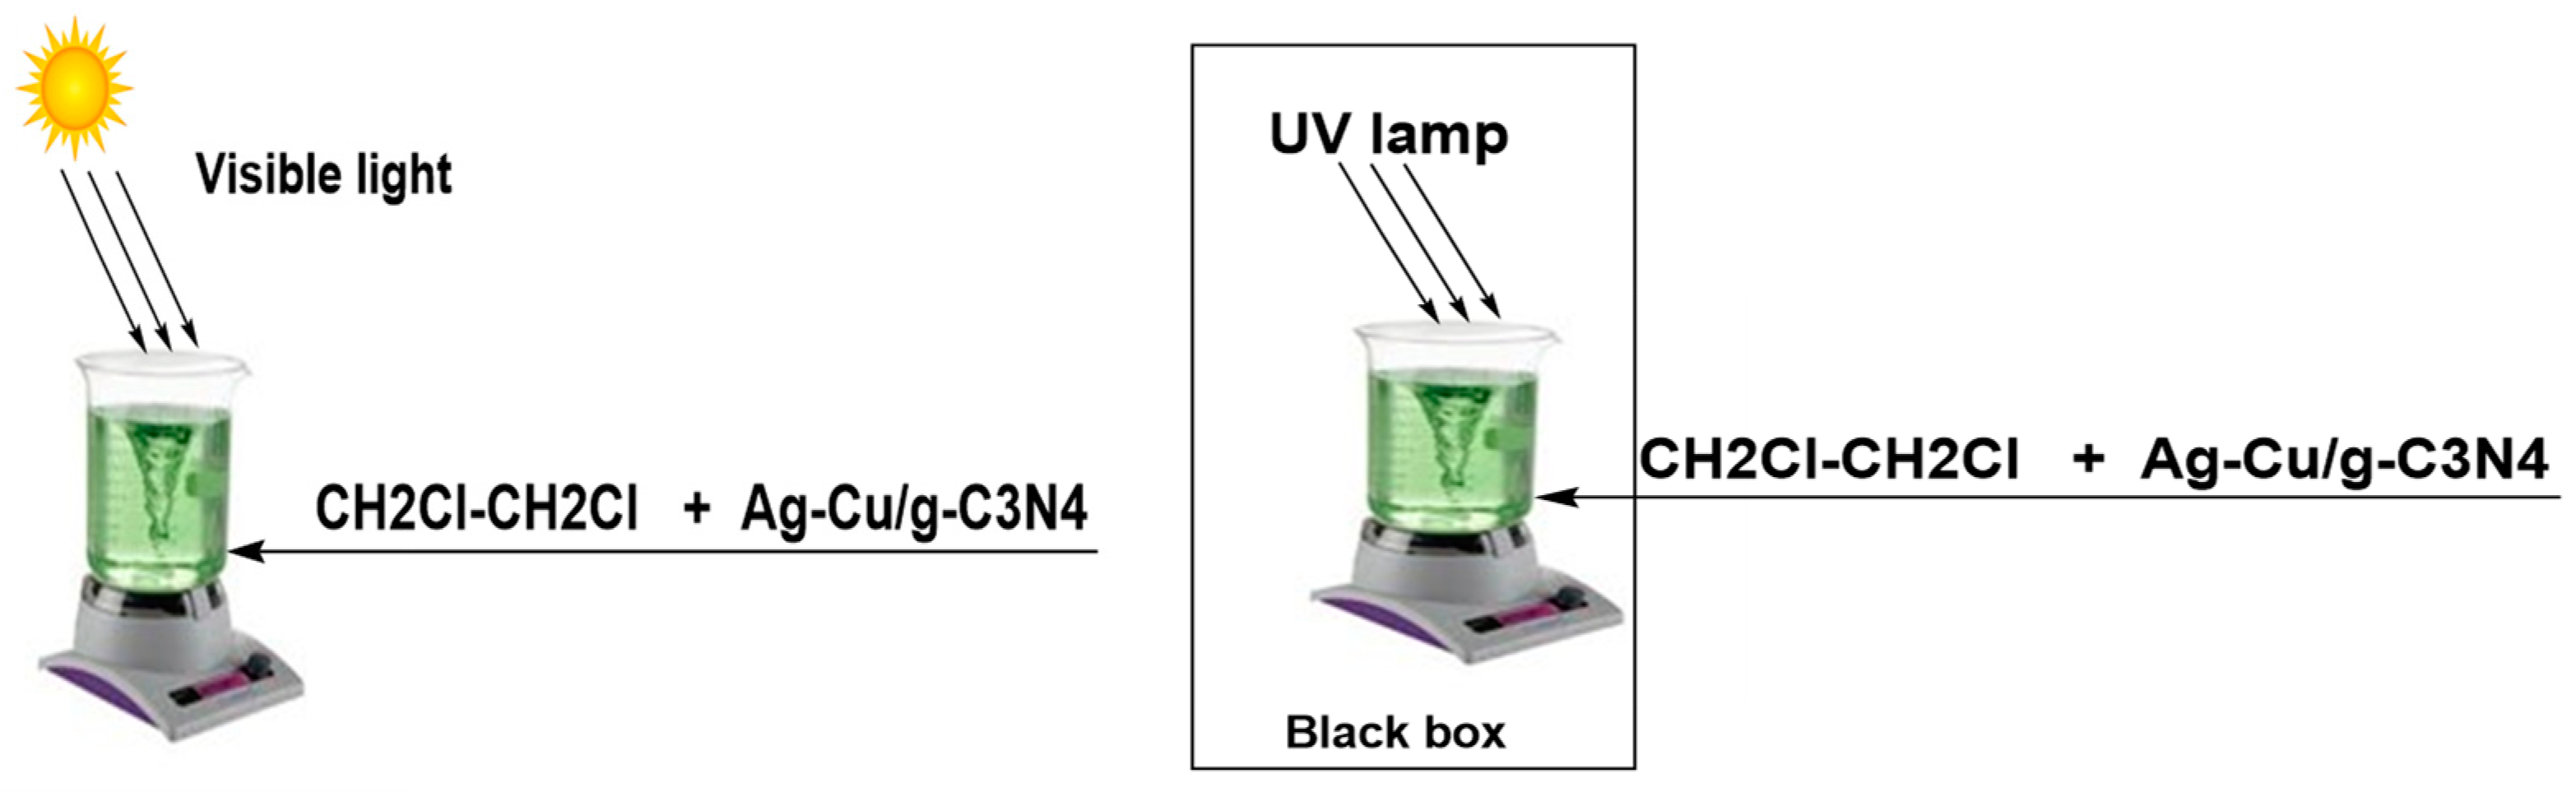
2.6. The Photocatalytic Reactor Lab
3. Results
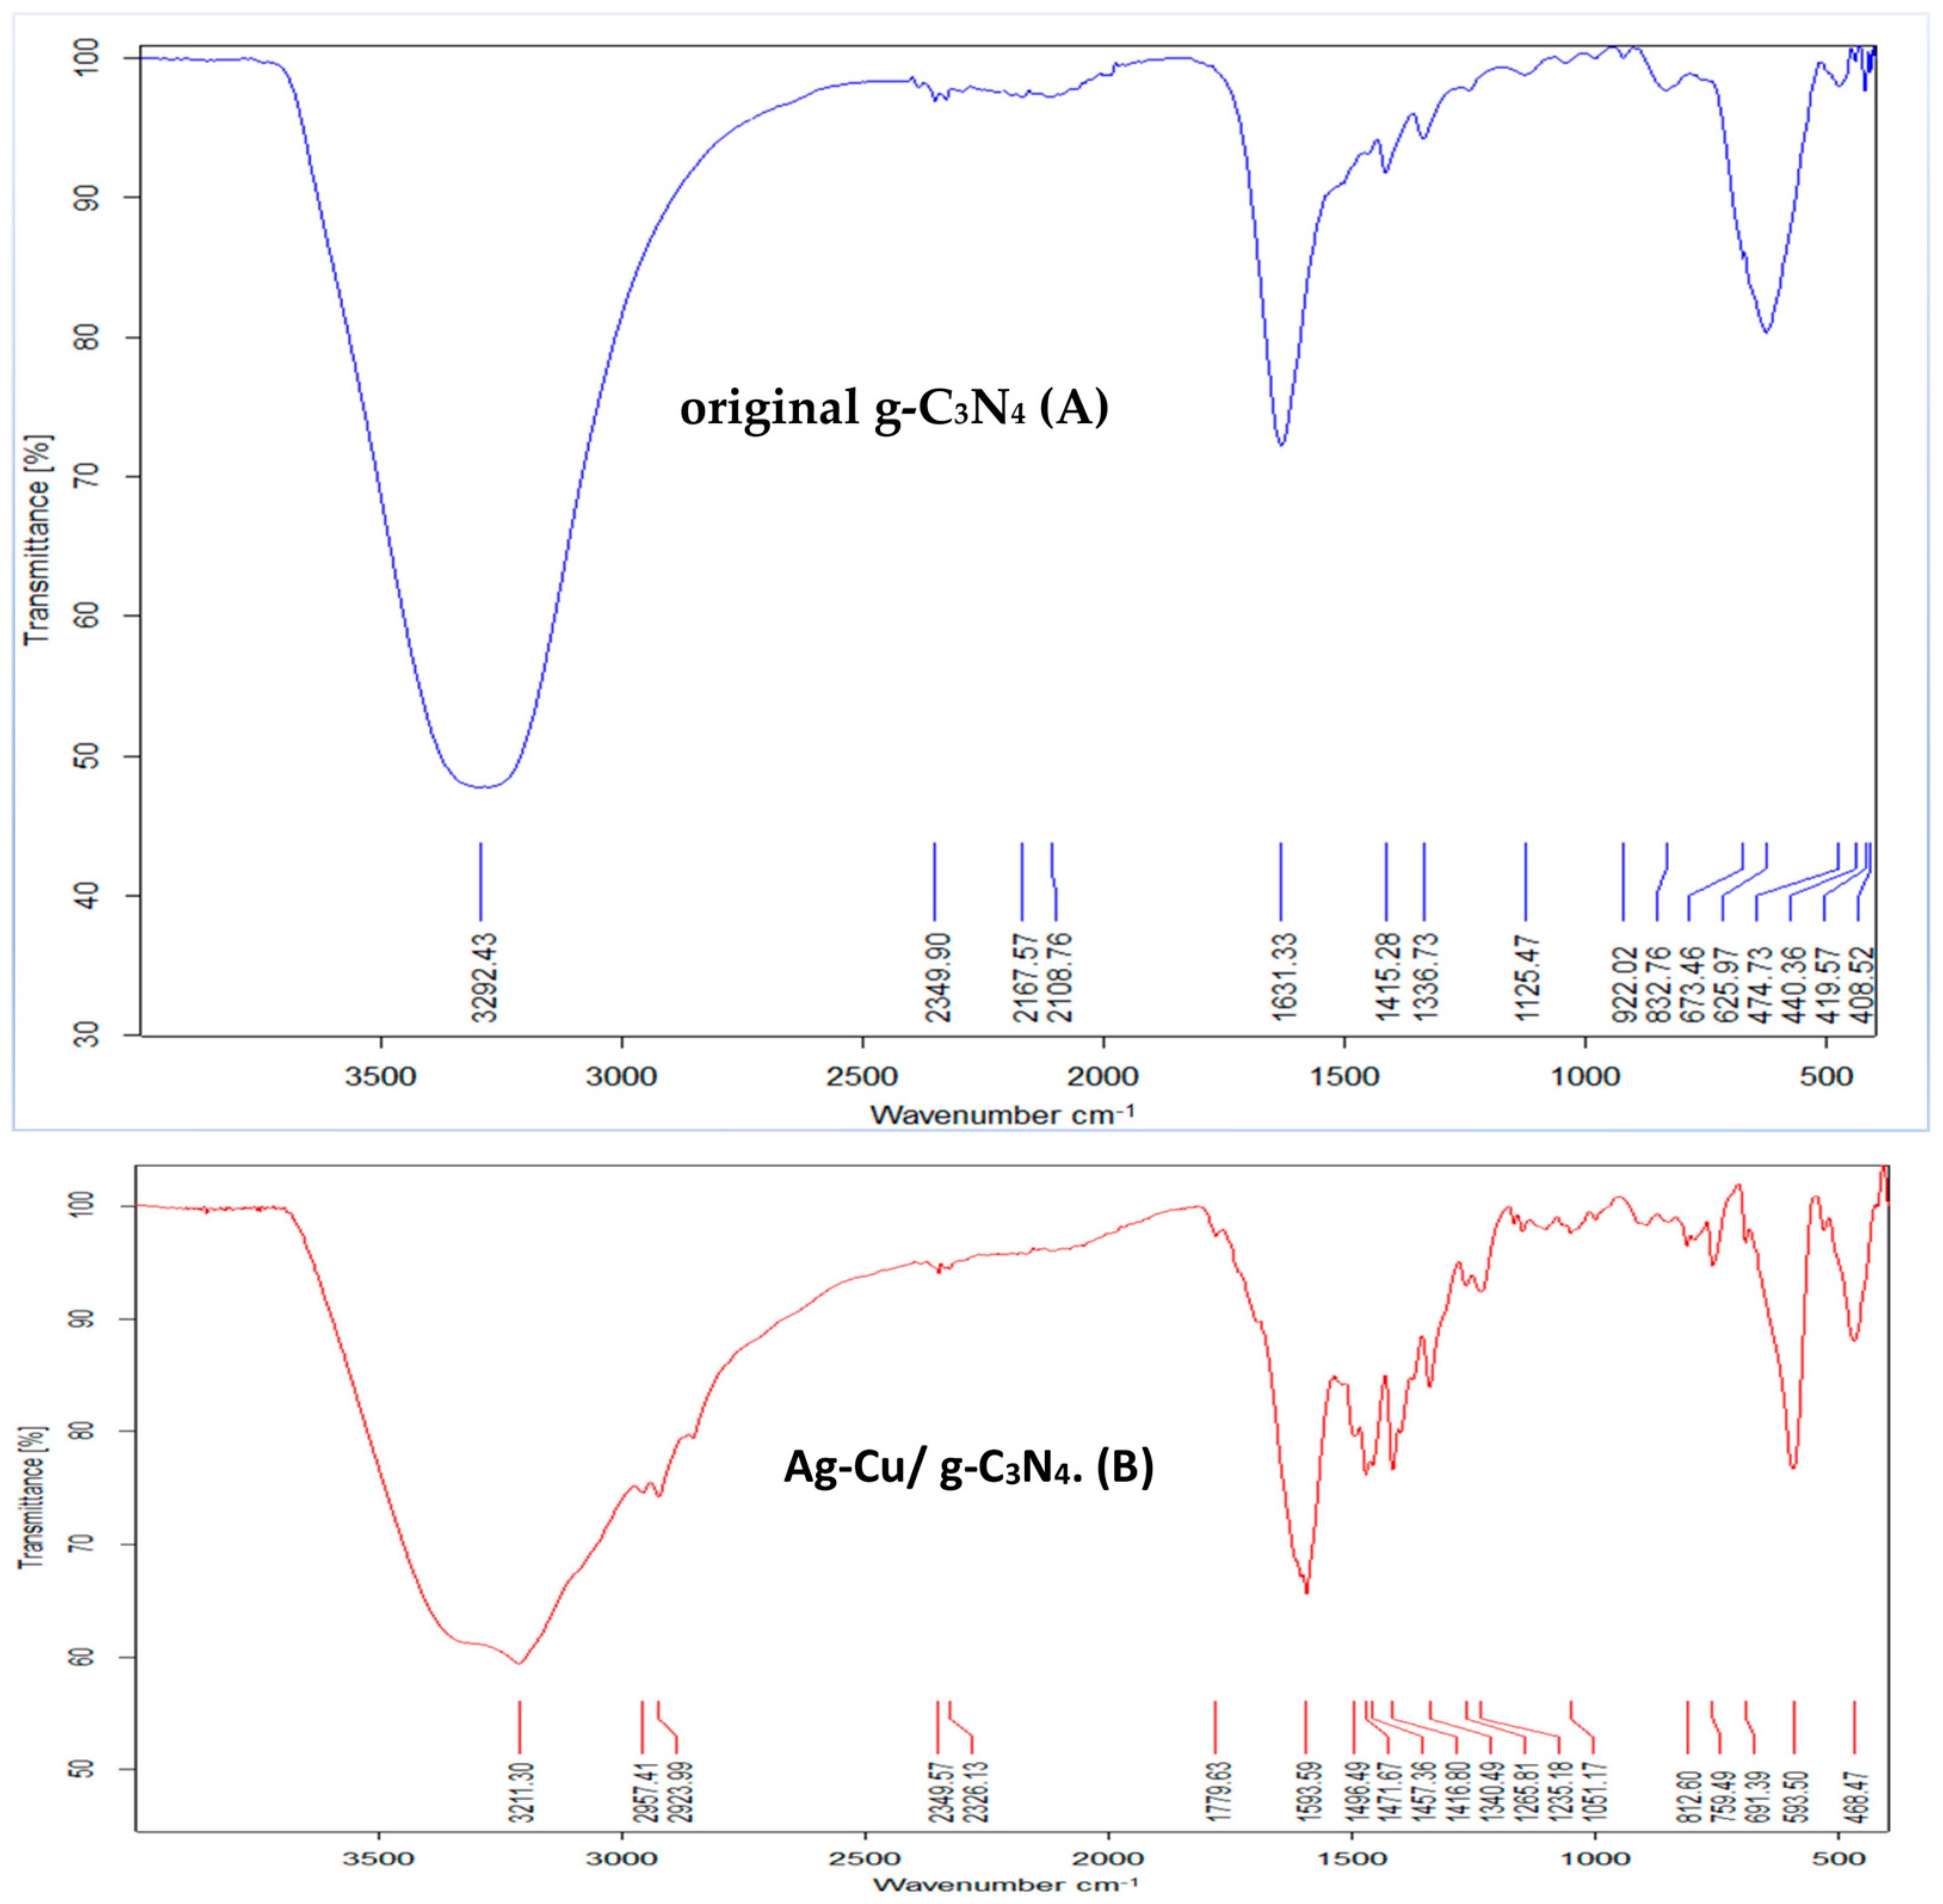
3.1. FTIR Analysis
3.2. XRD Analysis
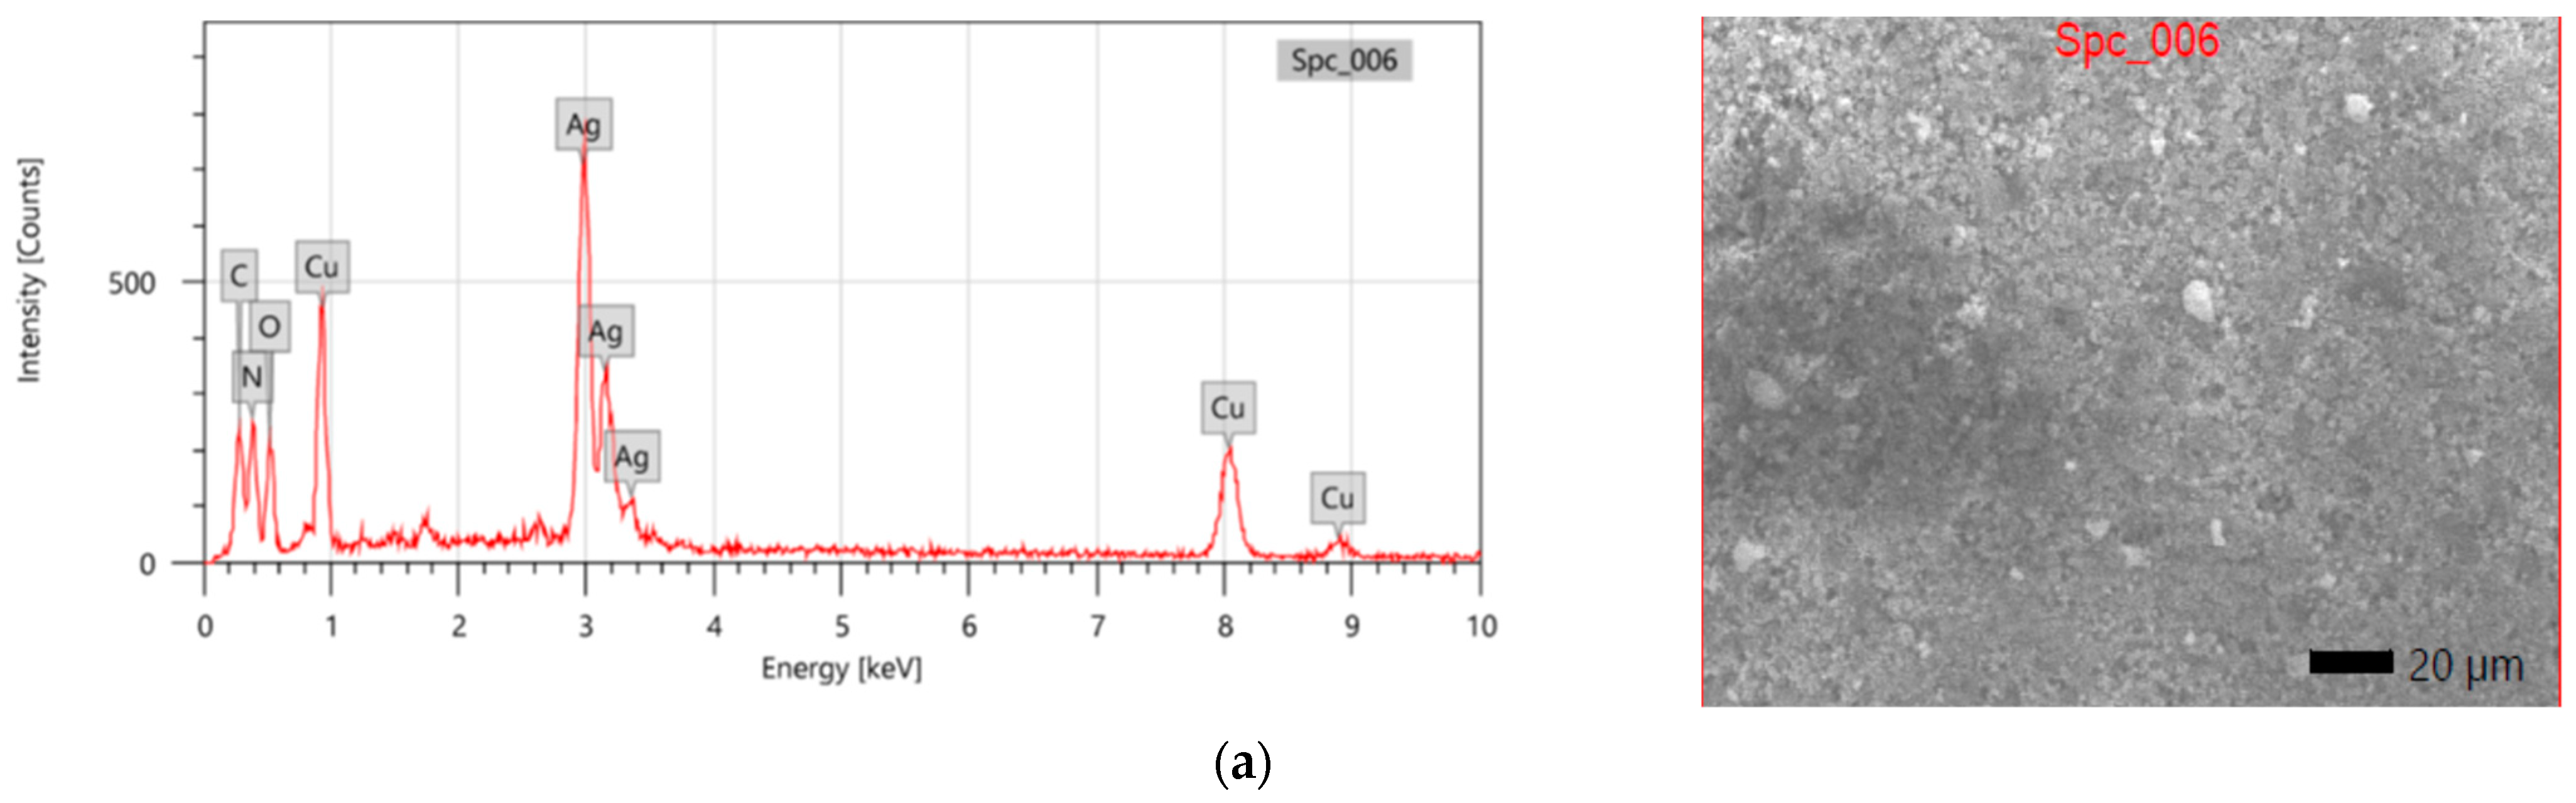
3.3. EDX and SEM Analysis
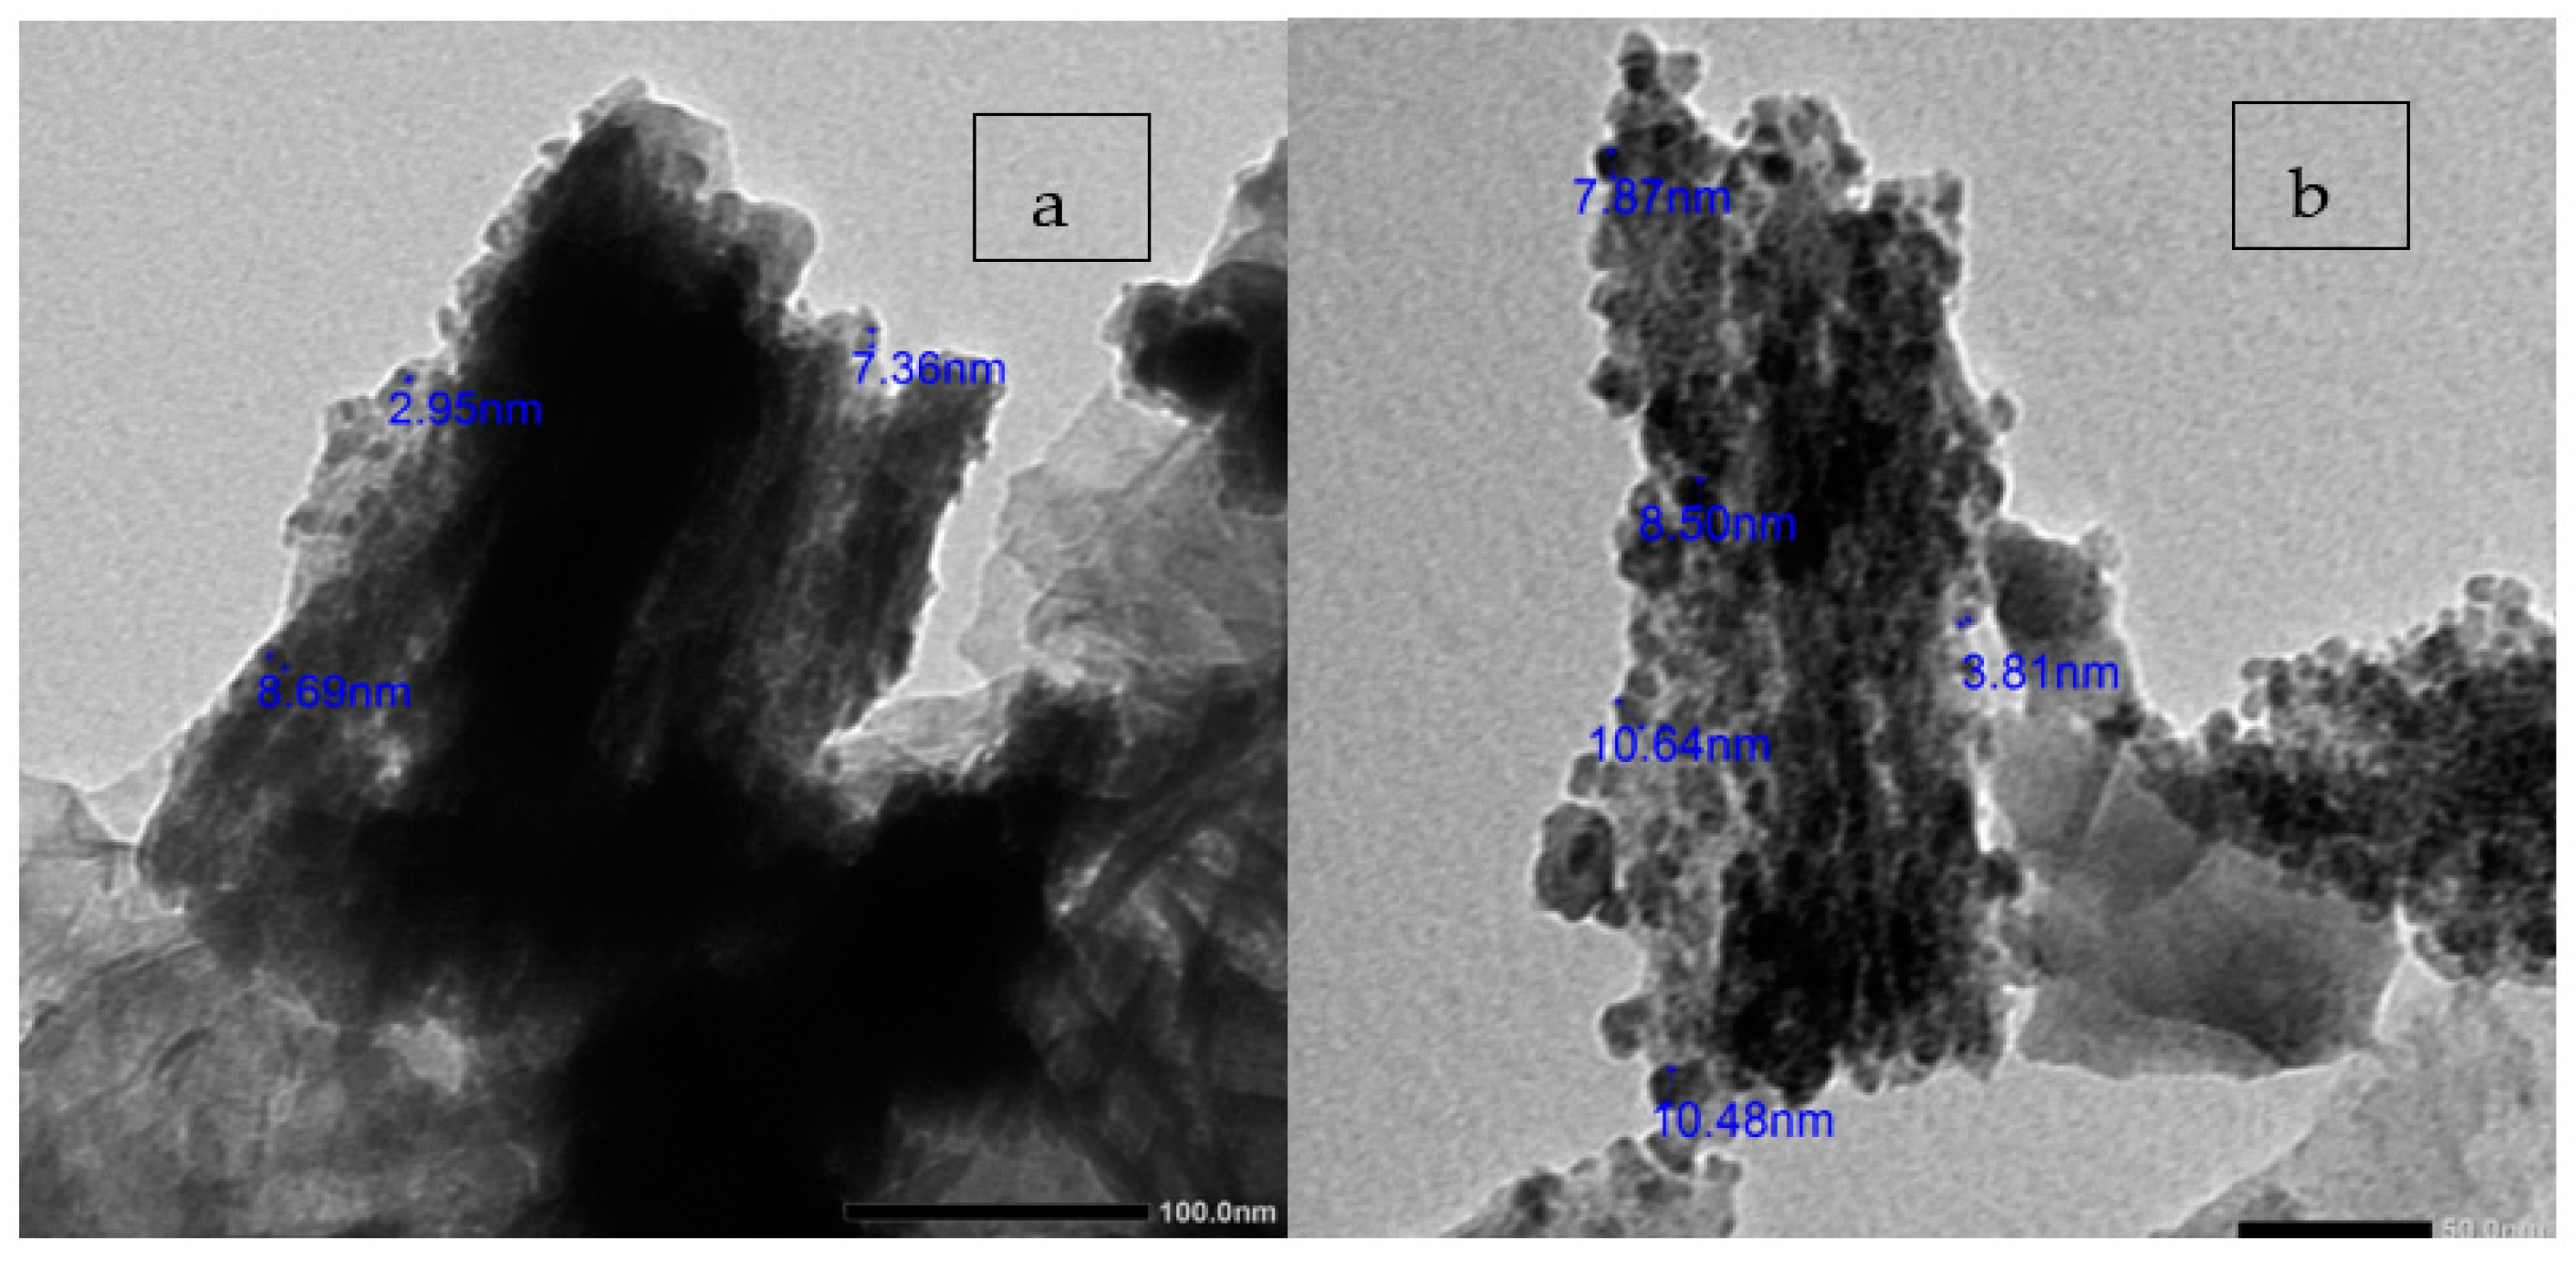
3.4. TEM Analysis
3.5. Photocatalytic Degradation Activity of Ag-Cu/g-C3N4
3.5.1. Decomposing DCE under the Visible-Light Region
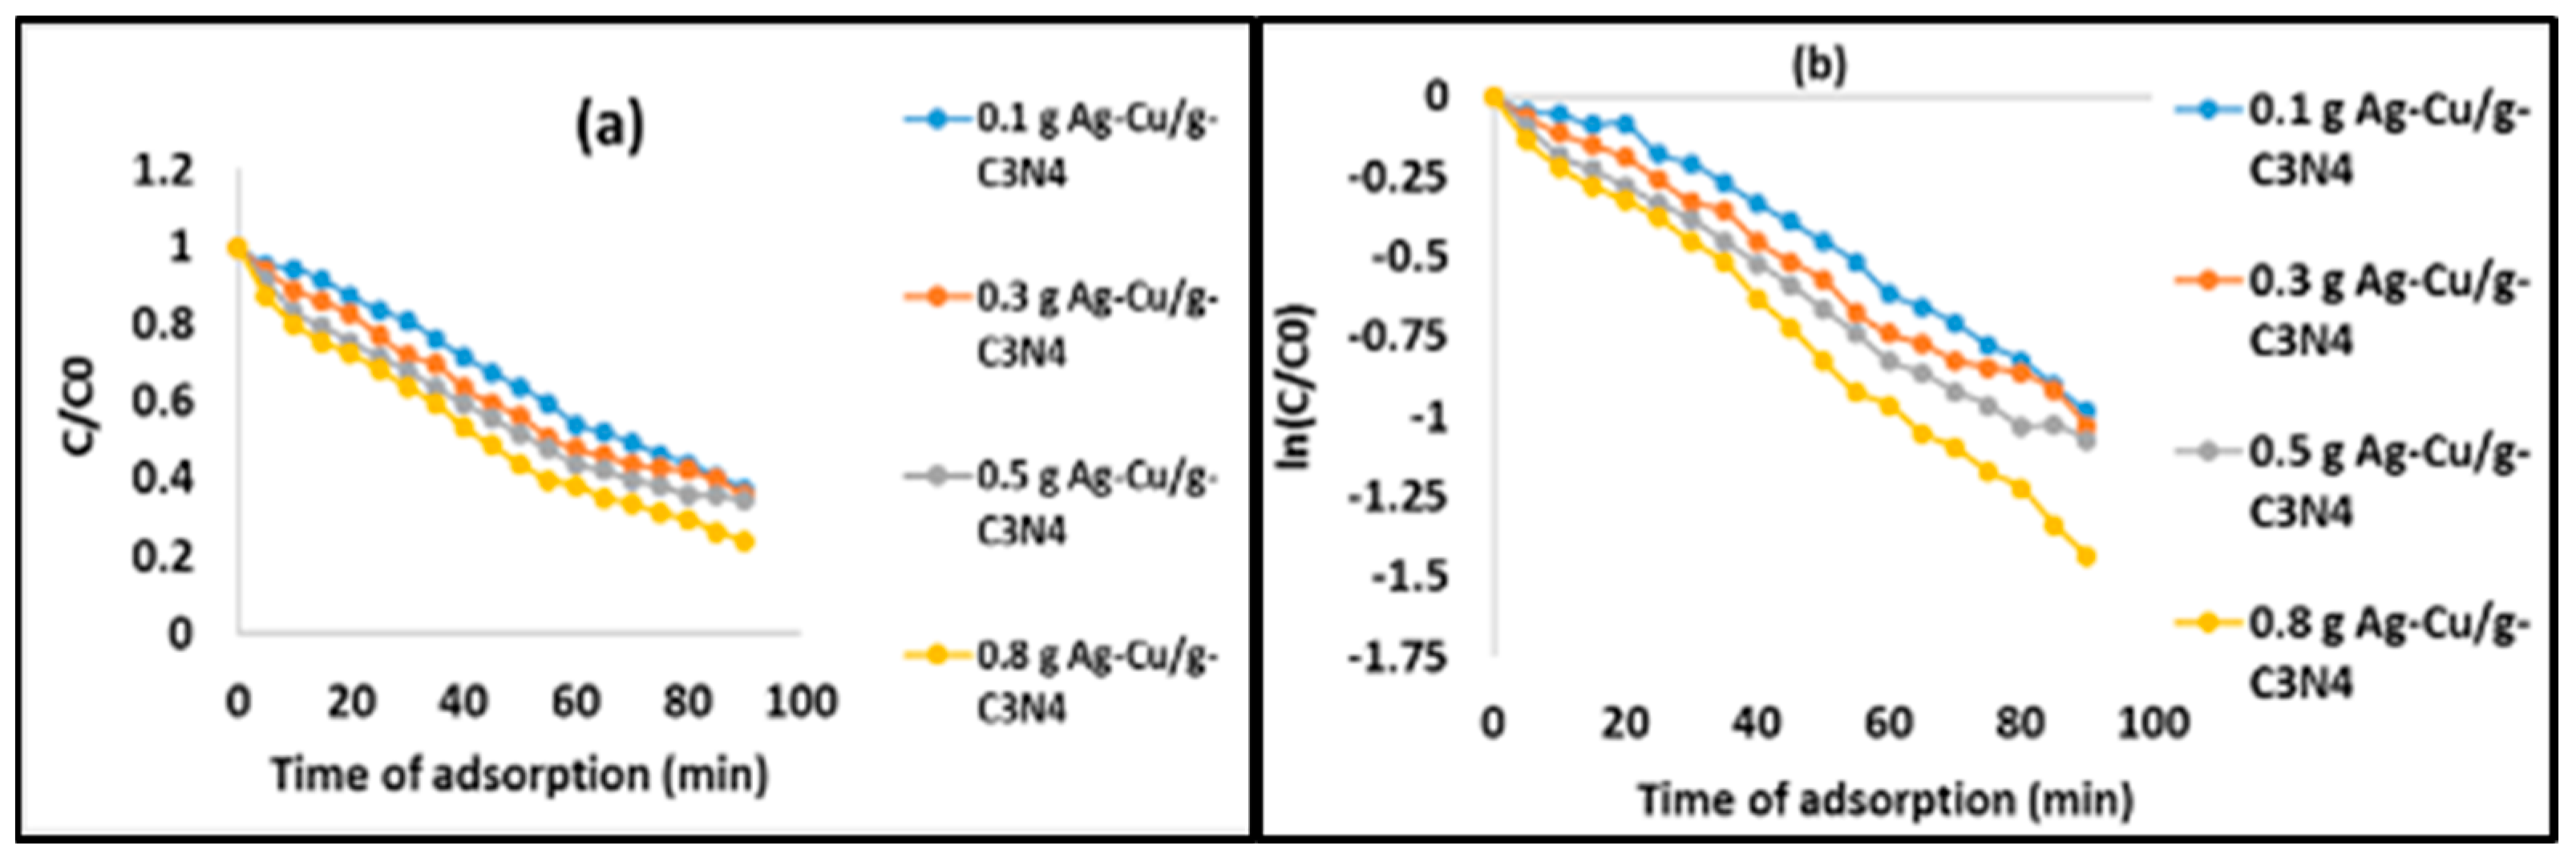
3.5.2. Decomposing DCE under the UV-Light Region
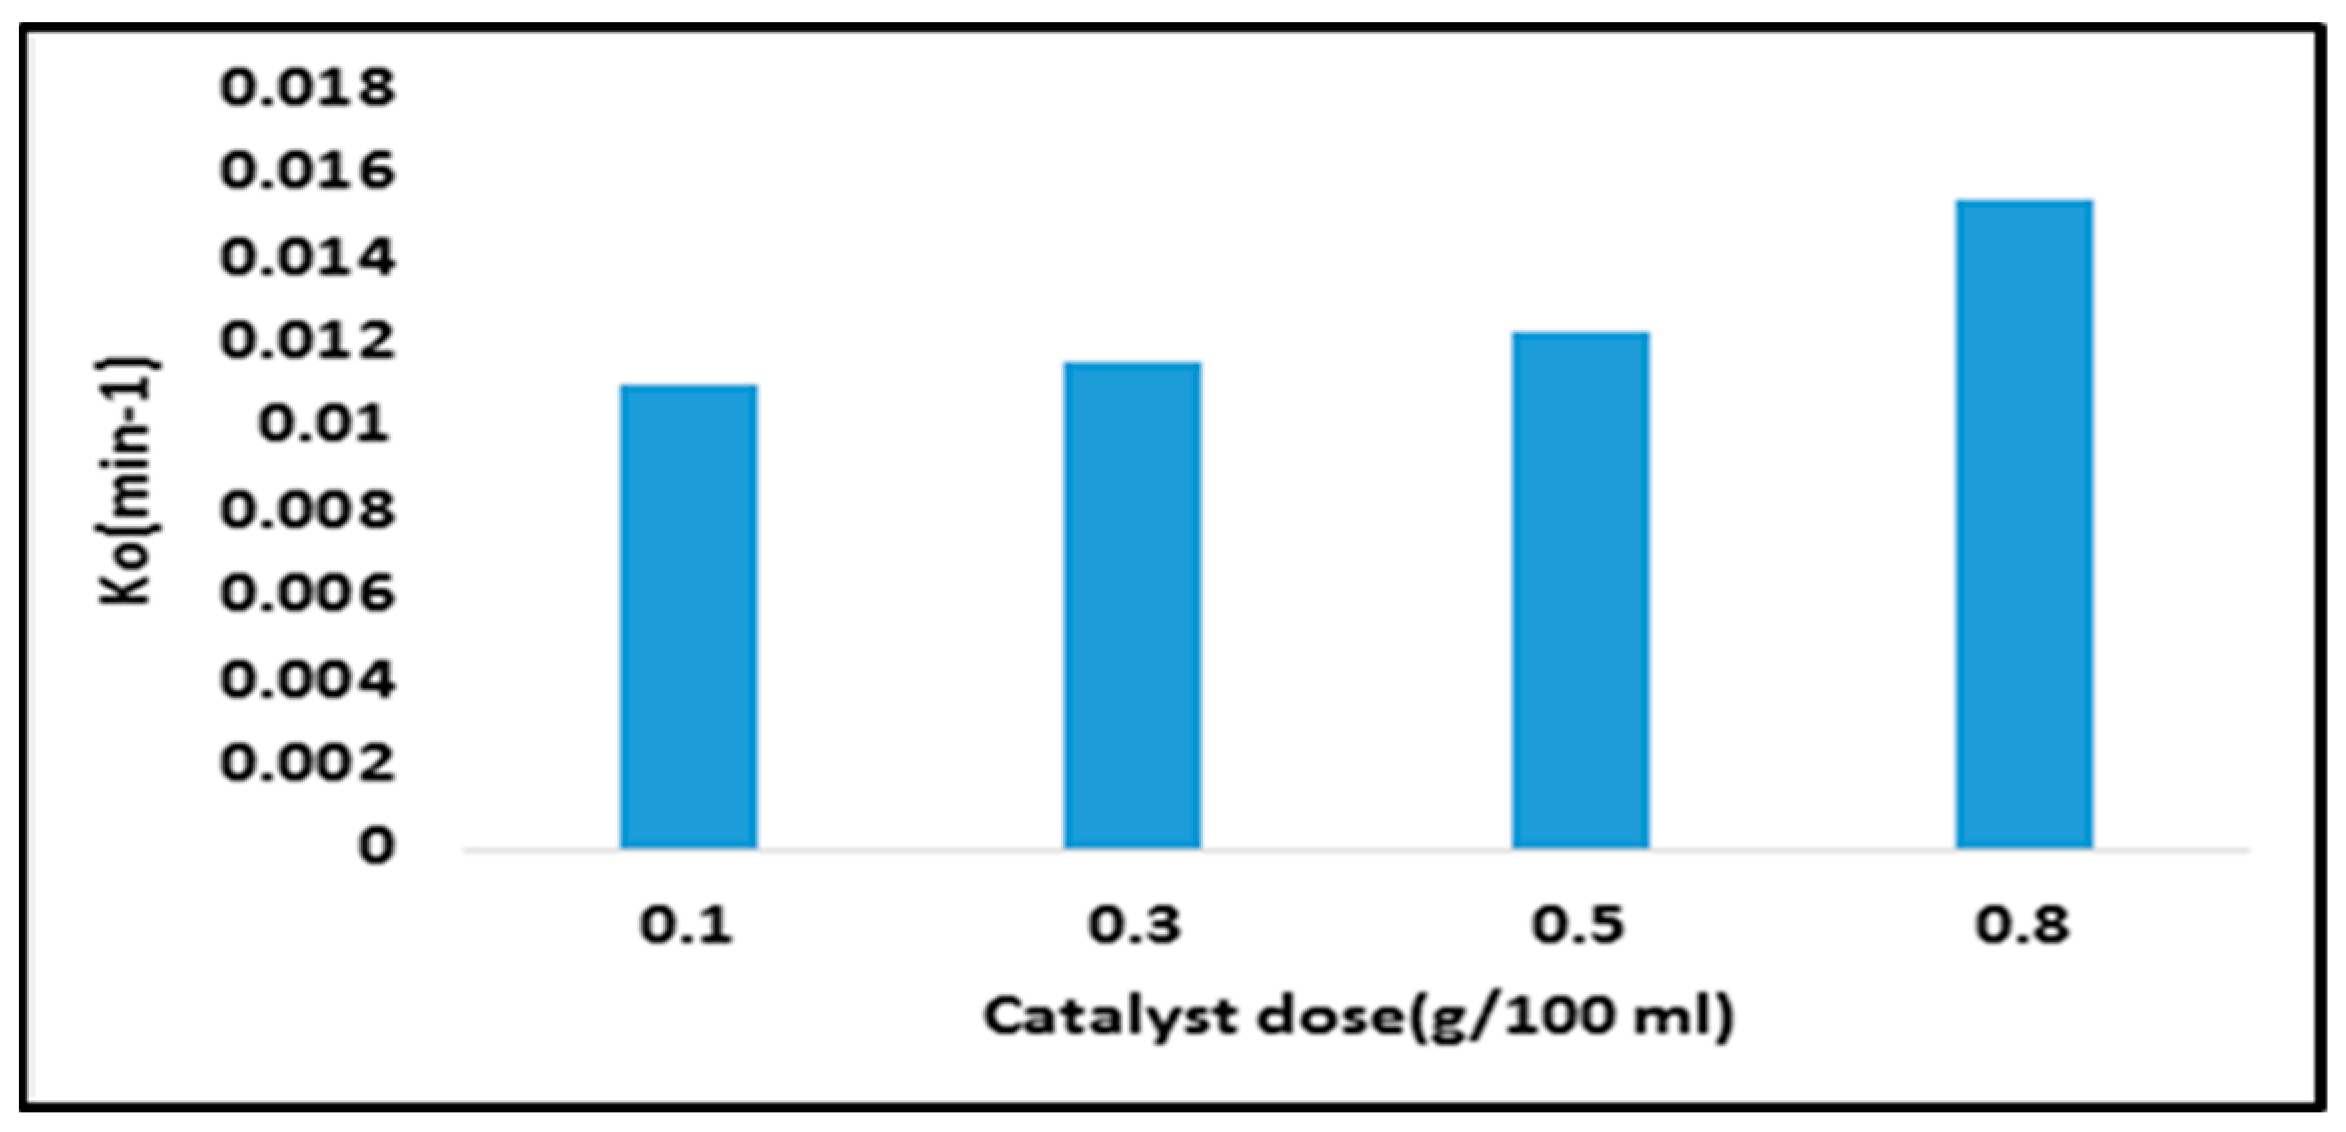
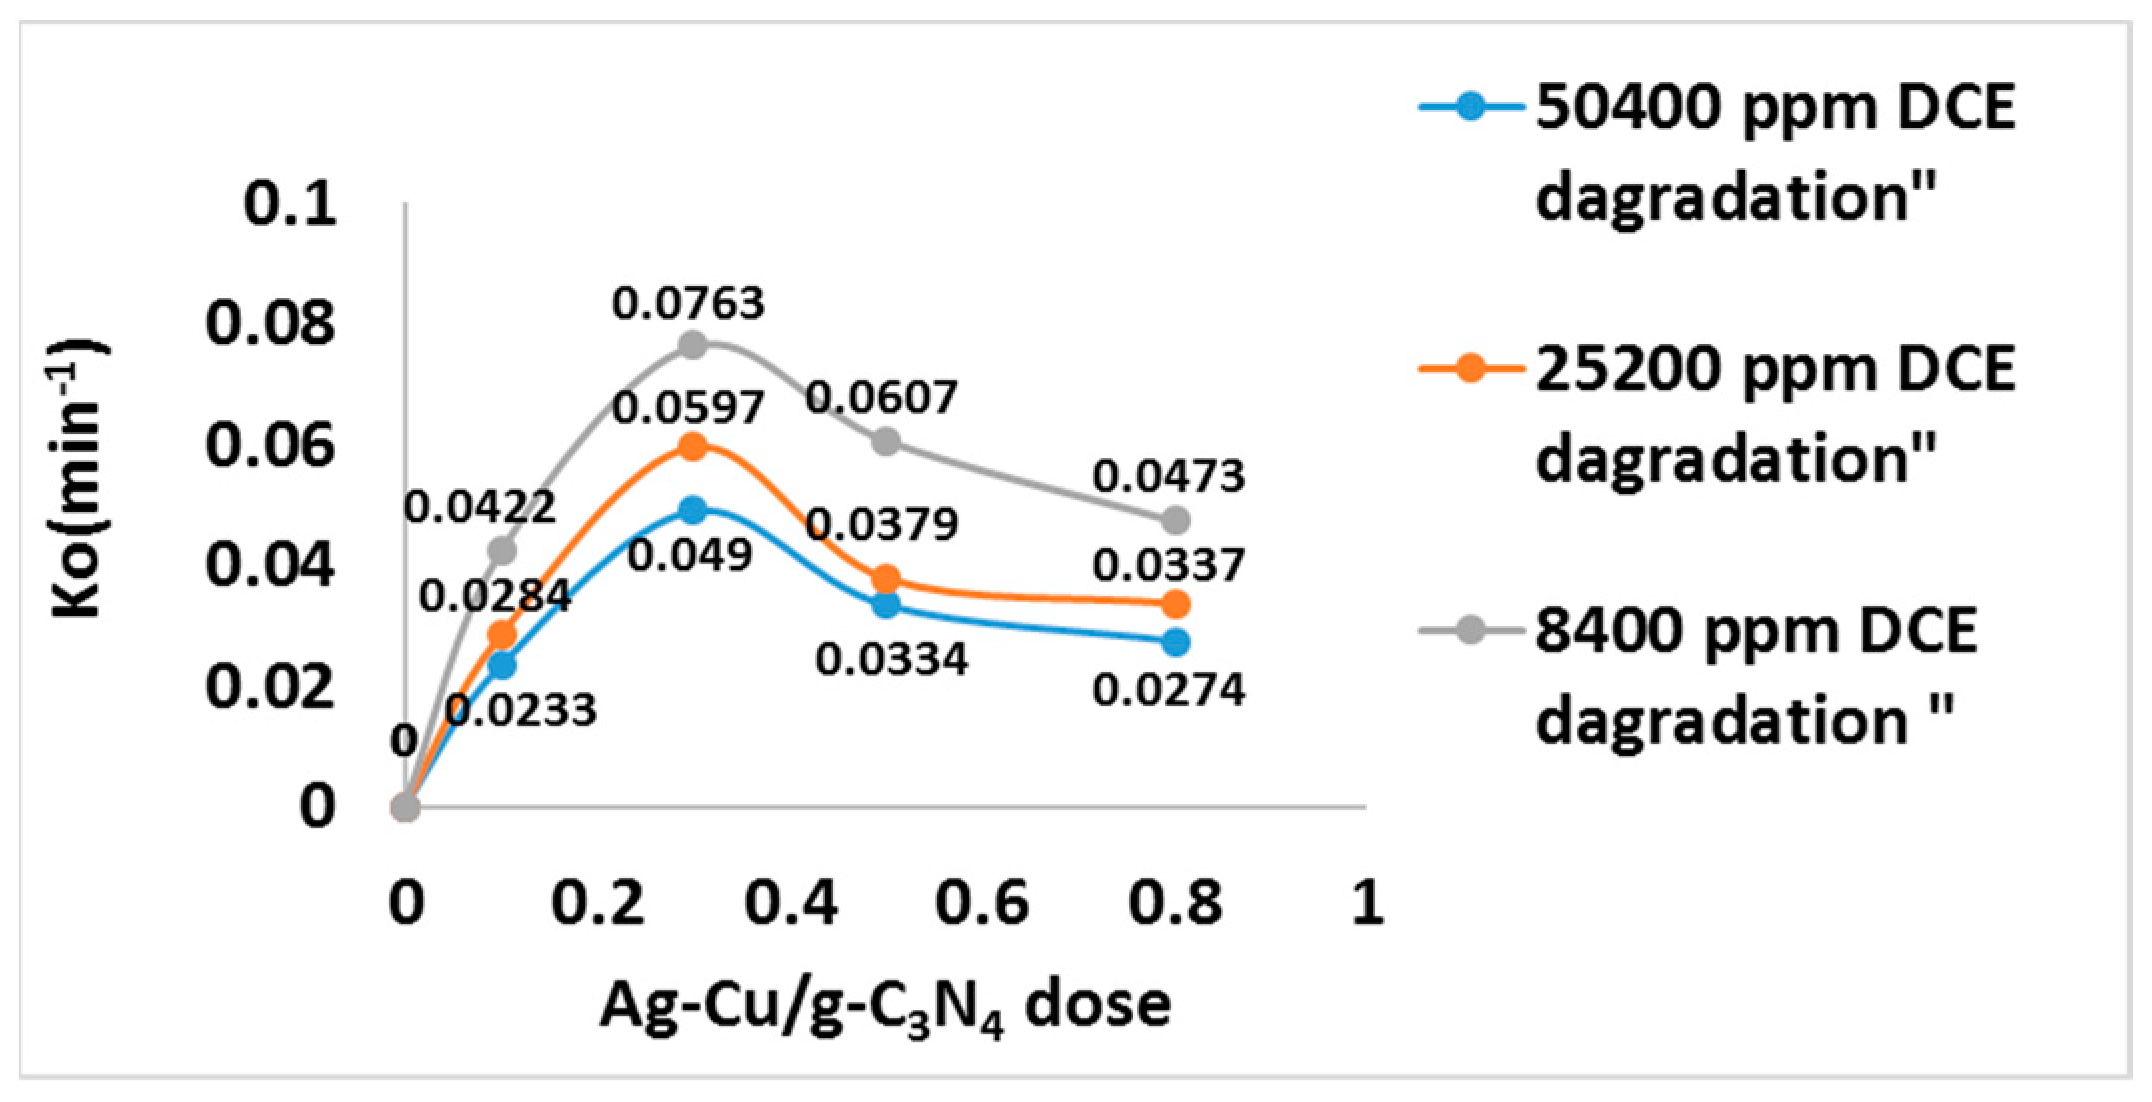
3.6. Kinetics of the Process
4. Conclusions
Author Contributions
Funding
Institutional Review Board Statement
Informed Consent Statement
Data Availability Statement
Acknowledgments
Conflicts of Interest
References
- Mohammadi, M.; Sabbaghi, S.J.E.N. Photo-catalytic degradation of 2, 4-DCP wastewater using MWCNT/TiO2 Nano-composite activated by UV and solar light. Environ. Nanotechnol. Monit. Manag. 2014, 1, 24–29. [Google Scholar] [CrossRef]
- Miia, V.; Vilhunen, S.; Vepsäläinen, M.; Kurniawan, T.A.; Lehtonen, N.; Isomäki, H.; Sillanpää, M. Degradation of 1,2-dichloroethane from wash water of ion-exchange resin using Fenton’s oxidation. Environ. Sci. Pollut. Res. 2010, 17, 875–884. [Google Scholar]
- Khataee, A.R.; Fathinia, M.; Aber, S.; Zarei, M. Optimization of photocatalytic treatment of dye solution on supported TiO2 nanoparticles by central composite design: Intermediates identification. J. Hazard. Mater. 2010, 181, 886–897. [Google Scholar] [CrossRef]
- De Wildeman, S.; Nollet, H.; Van Langenhove, H.; Verstraete, W. Reductive biodegradation of 1,2-dichloroethane by methanogenic granular sludge in lab-scale UASB reactors. Adv. Environ. Res. 2001, 6, 17–27. [Google Scholar] [CrossRef]
- Liu, X.; Vellanki, B.P.; Batchelor, B.; Abdel-Wahab, A. Degradation of 1,2-dichloroethane with advanced reduction processes (ARPs): Effects of process variables and mechanisms. Chem. Eng. J. 2014, 237, 300–307. [Google Scholar] [CrossRef]
- Eydivand, S.; Nikazar, M. Degradation of 1,2-dichloroethane in simulated wastewater solution: A comprehensive study by photocatalysis using TiO2 and ZnO nanoparticles. Chem. Eng. Commun. 2015, 202, 102–111. [Google Scholar] [CrossRef]
- Lin, Y.-H.; Hung, W.-C.; Chen, Y.-C.; Chu, H. Photocatalytic degradation of 1,2-dichloroethane by V/TiO2: The mechanism of photocatalytic reaction and byproduct. Aerosol Air Qual. Res. 2014, 14, 280–292. [Google Scholar] [CrossRef]
- Lin, Y.-H.; Hung, W.-C.; Chen, Y.-C.; Chu, H. Enhanced removal of 1,2-dichloroethane by anodophilic microbial consortia. Water Res. 2009, 43, 2936–2946. [Google Scholar]
- Stasinakis, A.S. Use of selected advanced oxidation processes (AOPs) for wastewater treatment—A mini review. Glob. NEST J. 2008, 10, 376–385. [Google Scholar]
- Nader, B.; Mirbagheri, S.A.; Ehteshami, M.; Ghaznavi, S.M. Optimization of Fenton process using response surface methodology and analytic hierarchy process for landfill leachate treatment. Process Saf. Environ. Prot. 2016, 104, 150–160. [Google Scholar]
- Hung, W.-C.; Chen, Y.-C.; Chu, H.; Tseng, T.-K. Synthesis and characterization of TiO2 and Fe/TiO2 nanoparticles and their performance for photocatalytic degradation of 1,2-dichloroethane. Appl. Surf. Sci. 2008, 255, 2205–2213. [Google Scholar] [CrossRef]
- Kodom, T.; Rusen, E.; Călinescu, I.; Mocanu, A.; Şomoghi, R.; Dinescu, A.; Diacon, A.; Boscornea, C. Silver nanoparticles influence on photocatalytic activity of hybrid materials based on TiO2 P25. J. Nanomater. 2015, 2015, 210734. [Google Scholar] [CrossRef]
- Kayalvizhi, S.; Sengottaiyan, A.; Selvankumar, T.; Senthilkumar, B.; Sudhakar, C.; Selvam, K. Eco-friendly cost-effective approach for synthesis of copper oxide nanoparticles for enhanced photocatalytic performance. Optik 2020, 202, 163507. [Google Scholar] [CrossRef]
- Mahdi, M.; Mirbagheri, S.A.; Sabbaghi, S. Photocatalytic degradation of 1,2-dichloroethane using immobilized PAni-TiO2 nanocomposite in a pilot-scale packed bed reactor. Desalination Water Treat. 2019, 155, 72–83. [Google Scholar]
- Xiaojuan, B.; Zong, R.; Li, C.; Liu, D.; Liu, Y.; Zhu, Y. Enhancement of visible photocatalytic activity via Ag@C3N4 core–shell plasmonic compo-site. Appl. Catal. B Environ. 2014, 147, 82–91. [Google Scholar]
- Taizo, S.; Koike, K.; Hori, T.; Hirakawa, T.; Ohko, Y.; Takeuchi, K. Removal of methyl mercaptan with highly-mobile silver on graphitic carbon-nitride (g-C3N4) photocatalyst. Appl. Catal. B Environ. 2016, 198, 133–141. [Google Scholar]
- Cao, S.; Yu, J. g-C3N4-based photocatalysts for hydrogen generation. J. Phys. Chem. Lett. 2014, 5, 2101–2107. [Google Scholar] [CrossRef]
- Balakumar, V.; Paulmony, T. Visible light active metal-free photocatalysis: N-doped graphene covalently grafted with g-C3N4 for highly robust degradation of methyl orange. Solid State Sci. 2019, 94, 99–105. [Google Scholar]
- Li, X.; Xiong, J.; Gao, X.; Huang, J.; Feng, Z.; Chen, Z.; Zhu, Y. Recent advances in 3D g-C3N4 composite photocatalysts for photocatalytic water splitting, degradation of pollutants and CO2 reduction. J. Alloys Compd. 2019, 802, 196–209. [Google Scholar] [CrossRef]
- Hayat, A.; Raziq, F.; Khan, M.; Ullah, I.; Rahman, M.U.; Khan, W.U.; Khan, J.; Ahmad, A. Visible-light enhanced photocatalytic performance of polypyrrole/g-C3N4 composites for water splitting to evolve H2 and pollutants degradation. J. Photochem. Photobiol. A Chem. 2019, 379, 88–98. [Google Scholar] [CrossRef]
- Nayak, S.; Parida, K.M. Deciphering Z-scheme charge transfer dynamics in heterostructure NiFe-LDH/N-rGO/g-C3N4 nanocomposite for photocatalytic pollutant removal and water splitting reactions. Sci. Rep. 2019, 9, 2458. [Google Scholar] [CrossRef] [PubMed]
- Cheng, N.; Tian, J.; Liu, Q.; Ge, C.; Qusti, A.H.; Asiri, A.M.; Al-Youbi, A.O.; Sun, X. Activation of graphitic carbon nitride (g-C3N4) by alkaline hydrothermal treatment for photocatalytic NO oxidation in gas phase. J. Mater. Chem. 2013, 1, 6489–6496. [Google Scholar]
- Khan, M.S.; Zhang, F.; Osada, M.; Mao, S.S.; Shen, S. Graphitic carbon nitride-based low-dimensional heterostructures for photocatalytic applications. Sol. RRL 2020, 4, 1900435. [Google Scholar] [CrossRef]
- Rana, A.G.; Tasbihi, M.; Schwarze, M.; Minceva, M. Efficient advanced oxidation process (AOP) for photocatalytic contaminant degradation using exfoliated metal-free graphitic carbon nitride and visible light-emitting diodes. Catalysts 2021, 11, 662. [Google Scholar] [CrossRef]
- Zhao, Z.; Sun, Y.; Luo, Q.; Dong, F.; Li, H.; Ho, W.K. Mass-controlled direct synthesis of graphene-like carbon nitride nanosheets with exceptional high visible light activity. Less is better. Sci. Rep. 2015, 5, 14643. [Google Scholar] [CrossRef] [PubMed]
- Zhang, D.; Tan, G.; Wang, M.; Li, B.; Dang, M.; Ren, H.; Xia, A. The modulation of g-C3N4 energy band structure by excitons capture and dissociation. Mater. Res. Bull. 2020, 122, 110685. [Google Scholar] [CrossRef]
- Dong, G.; Zhang, Y.; Pan, Q.; Qiu, J. A fantastic graphitic carbon nitride (g-C3N4) material: Electronic structure, photocatalytic and photoelectronic properties. J. Photochem. Photobiol. C Photochem. Rev. 2014, 20, 33–50. [Google Scholar] [CrossRef]
- Alves, I.; Demazeau, G.; Tanguy, B.; Weill, F. On a new model of the graphitic form of C3N4. Solid State Commun. 1999, 109, 697–701. [Google Scholar] [CrossRef]
- Wang, L.; Wang, C.; Hu, X.; Xue, H.; Pang, H. Metal/graphitic carbon nitride composites: Synthesis, structures, and applications. Chem. Asian J. 2016, 11, 3305–3328. [Google Scholar] [CrossRef]
- Zhang, J.; Chen, X.; Takanabe, K.; Maeda, K.; Domen, K.; Epping, J.D.; Fu, X.; Antonietti, M.; Wang, X. Synthesis of a carbon nitride structure for visible-light catalysis by copolymerization. Angew. Chem. Int. Ed. 2010, 49, 441–444. [Google Scholar] [CrossRef] [PubMed]
- Zhu, Z.; Tang, X.; Wang, T.; Fan, W.; Liu, Z.; Li, C.; Huo, P.; Yan, Y. Insight into the effect of co-doped to the photocatalytic performance and electronic structure of g-C3N4 by first principle. Appl. Catal. B Environ. 2019, 241, 319–328. [Google Scholar] [CrossRef]
- Gang, X.; Meng, Y. Pyrolysis synthesized g-C3N4 for photocatalytic degradation of methylene blue. J. Chem. 2013, 2013, 187912. [Google Scholar]
- Yang, Y.; Li, X.; Zhou, C.; Xiong, W.; Zeng, G.; Huang, D.; Zhang, C.; Wang, W.; Song, B.; Tang, X.; et al. Recent advances in application of graphitic carbon nitride-based catalysts for degrading organic contaminants in water through advanced oxidation processes beyond photocatalysis: A critical review. Water Res. 2020, 184, 116200. [Google Scholar] [CrossRef]
- Ismael, M. A review on graphitic carbon nitride (g-C3N4) based nanocomposites: Synthesis, categories, and their application in photocatalysis. J. Alloys Compd. 2020, 846, 156446. [Google Scholar] [CrossRef]
- Hutchings, G.J.; Davies, P.R.; Pattisson, S.; Davies, T.E.; Morgan, D.J.; Dlamini, M.W. Facile synthesis of a porous 3D g-C3N4 photocatalyst for the degradation of organics in shale gas brines. Catal. Commun. 2022, 169, 106480. [Google Scholar] [CrossRef]
- Zhao, Z.; Sun, Y.; Dong, F. Graphitic carbon nitride based nanocomposites: A review. Nanoscale 2015, 7, 15–37. [Google Scholar] [CrossRef] [PubMed]
- Al-Baldawi, I.A. Removal of 1,2-Dichloroethane from real industrial wastewater using a sub-surface batch system with Typha angustifolia L. Ecotoxicol. Environ. Saf. 2018, 147, 260–265. [Google Scholar] [CrossRef]
- Yoon, S.; Han, D.S.; Liu, X.; Batchelor, B.; Abdel-Wahab, A. Degradation of 1,2-dichloroethane using advanced reduction processes. J. Environ. Chem. Eng. 2014, 2, 731–737. [Google Scholar] [CrossRef]
- Lin, J.-H.; Wu, S.-W.; Kuo, C.-Y. Degradation of gaseous 1,2-dichloroethane using a hybrid cuprous oxide catalyst. Process Saf. Environ. Prot. 2014, 92, 442–446. [Google Scholar] [CrossRef]
- Maeda, K.; An, D.; Kuriki, R.; Lu, D.; Ishitani, O. Graphitic carbon nitride prepared from urea as a photocatalyst for visible-light carbon dioxide reduction with the aid of a mononuclear ruthenium (II) complex. Beilstein J. Org. Chem. 2018, 14, 1806–1812. [Google Scholar] [CrossRef]
- Xu, J.; Li, Y.; Peng, S.; Lu, G.; Li, S. Eosin Y-sensitized graphitic carbon nitride fabricated by heating urea for visible light photocatalytic hydrogen evolution: The effect of the pyrolysis temperature of urea. Phys. Chem. Chem. Phys. 2013, 15, 7657–7665. [Google Scholar] [CrossRef]
- Zhu, Y.; Marianov, A.; Xu, H.; Lang, C.; Jiang, Y. Bimetallic Ag-Cu supported on graphitic carbon nitride nanotubes for improved visible-light photocatalytic hydrogen production. ACS Appl. Mater. Interfaces 2018, 10, 9468–9477. [Google Scholar] [CrossRef] [PubMed]
- Beer–Lambert Law Calculator. Available online: https://en.wikipedia.org/wiki/Beer%E2%80%93Lambert_law (accessed on 28 February 2008).
- Khezrianjoo, S.; Revanasiddappa, H.D. Langmuir-Hinshelwood kinetic expression for the photocatalytic degradation of metanil yellow aqueous solutions by ZnO catalyst. Chem. Sci. J. 2012, 2012, CSJ-85. [Google Scholar]
- Fu, Y.; Huang, T.; Zhang, L.; Zhu, J.; Wang, X. Ag/g-C3N4 catalyst with superior catalytic performance for the degradation of dyes: A borohydride-generated superoxide radical approach. Nanoscale 2015, 7, 13723–13733. [Google Scholar] [CrossRef]
- Tao, S.; Jiang, H.-Y.; Ma, C.-C.; Mao, F.; Xue, B. Ag/g-C3N4 photocatalysts: Microwave-assisted synthesis and enhanced visible-light photocatalytic activity. Catal. Commun. 2016, 79, 45–48. [Google Scholar]
- Patnaik, S.; Sahoo, D.P.; Parida, K. Recent advances in anion doped g-C3N4 photocatalysts: A review. Carbon 2021, 172, 682–711. [Google Scholar] [CrossRef]
- Wang, J.; Tang, L.; Zeng, G.; Liu, Y.; Zhou, Y.; Deng, Y.; Wang, J.; Peng, B. Plasmonic Bi metal deposition and g-C3N4 coating on Bi2WO6 microspheres for efficient visible-light photocatalysis. ACS Sustain. Chem. Eng. 2017, 5, 1062–1072. [Google Scholar] [CrossRef]
- Peng, K.; Wang, H.; Li, X.; Wang, J.; Cai, Z.; Su, L.; Fan, X. Emerging WS2/montmorillonite composite nanosheets as an efficient hydrophilic photocatalyst for aqueous phase reactions. Sci. Rep. 2019, 9, 16325. [Google Scholar] [CrossRef]
- Bhat, S.; Uthappa, U.T.; Sadhasivam, T.; Altalhi, T.; Han, S.S.; Kurkuri, M.D. Abundant cilantro derived high surface area activated carbon (AC) for superior adsorption performances of cationic/anionic dyes and supercapacitor application. Chem. Eng. J. 2023, 459, 141577. [Google Scholar] [CrossRef]
- Ingram, D.B.; Christopher, P.; Bauer, J.L.; Linic, S. Predictive model for the design of plasmonic metal/semiconductor composite photocatalysts. ACS Catal. 2011, 1, 1441–1447. [Google Scholar] [CrossRef]
- Xu, M.; Han, L.; Dong, S. Facile fabrication of highly efficient g-C3N4/Ag2O heterostructured photocatalysts with enhanced visible-light photocatalytic activity. ACS Appl. Mater. Interfaces 2013, 5, 12533–12540. [Google Scholar] [CrossRef]
- Linic, S.; Christopher, P.; Ingram, D.B. Plasmonic-metal nanostructures for efficient conversion of solar to chemical energy. Nat. Mater. 2011, 10, 911–921. [Google Scholar] [CrossRef]
- Yang, Y.; Guo, Y.; Liu, F.; Yuan, X.; Guo, Y.; Zhang, S.; Guo, W.; Huo, M. Preparation and enhanced visible-light photocatalytic activity of silver deposited graphitic carbon nitride plasmonic photocatalyst. Appl. Catal. B Environ. 2013, 142, 828–837. [Google Scholar] [CrossRef]
- Bansal, A.; Sekhon, J.S.; Verma, S.S. Scattering efficiency and LSPR tunability of bimetallic Ag, Au, and Cu nanoparticles. Plasmonics 2014, 9, 143–150. [Google Scholar] [CrossRef]
- Li, X.; Yu, J.; Low, J.; Fang, Y.; Xiao, J.; Chen, X. Engineering heterogeneous semiconductors for solar water splitting. J. Mater. Chem. A 2015, 3, 2485–2534. [Google Scholar] [CrossRef]
- Wen, C.; Yin, A.; Dai, W.-L. Recent advances in silver-based heterogeneous catalysts for green chemistry processes. Appl. Catal. B Environ. 2014, 160, 730–741. [Google Scholar] [CrossRef]
- Sethu, K.; Lee, H.-Y. Preparation of TiO2-deposited silica-based catalysts for photocatalytic decomposition of chloro-pesticide to environmentally less toxic species. Chemosphere 2022, 290, 133300. [Google Scholar]
- Hou, W.; Cronin, S.B. A review of surface plasmon resonance-enhanced photocatalysis. Adv. Funct. Mater. 2013, 23, 1612–1619. [Google Scholar] [CrossRef]
- Lu, Z.; Zeng, G.; Zhou, Z.; Liu, Y.; Wang, P.; Sheng, X.; Dong, J.; Idress, A.; Sui, Q.; Lyu, S. Effective degradation of 1,2-dichloroethane in calcium peroxide activated by Fe (III): Performance and mechanisms. Water Supply 2022, 22, 5589–5602. [Google Scholar] [CrossRef]
- Uthappa, U.T.; Sriram, G.; Arvind, O.R.; Kumar, S.; Neelgund, G.M.; Losic, D.; Kurkuri, M.D. Engineering MIL-100 (Fe) on 3D porous natural diatoms as a versatile high performing platform for controlled isoniazid drug release, Fenton’s catalysis for malachite green dye degradation and environmental adsorbents for Pb2+ removal and dyes. Appl. Surf. Sci. 2020, 528, 146974. [Google Scholar] [CrossRef]


| Catalyst | Performance | Reference |
|---|---|---|
| Reductive biodegradation of 1,2-dichloroethane via methanogenic granular sludge in lab-scale UASB reactors | 1,2-DCE was converted mainly to ethane (65–80%), and the hydraulic retention time varies between 10 and 20 h. | [4] |
| Degradation of 1,2-dichloroethane in V/TiO2 | Complete photocatalytic degradation of 1,2-DCE was achieved after 120 min using UV radiation. | [7] |
| Degradation of 1,2-dichloroethane in Fe/TiO2 | The photocatalytic performance is a function of retention time, and it would have competitive adsorption on the active site of TiO2 between water vapor and 1,2-DCE. | [11] |
| Degradation of 1,2-dichloroethane in immobilized PAni-TiO2 | The photocatalytic degradation of 1,2-DCE was about 60%, 90%, and 95% after 120 min, 240 min, and 300 min, respectively. | [12] |
| Degradation of 1,2-dichloroethane in a simulated wastewater solution: a comprehensive study by photocatalysis using TiO2 nanoparticles and zinc oxide | It was found that with the UV method, just 55% of 1,2-DCA was removed after 6 h under 40 W UV radiation, but with the H2O2/UV method, the removal reached 88% for a similar length of time and radiation intensity. | [37] |
| Degradation of 1,2−dichloroethane in UV-M lamp. UV-N/S2O42− | Complete degradation of 1,2-DCE after 300 min of irradiation time. | [38] |
| Degradation of gaseous 1,2-dichloroethane using a hybrid cuprous oxide catalyst | Degradation efficiencies of 83.8 and 82.2%. | [39] |
| Prepared material: photocatalytic degradation of 1,2 dichloroethane using Ag-Cu/graphite bimetallic carbon nitride radiated using UV | Degradation efficiencies of 0.3 g/100 mL Ag-Cu/g-C3N4 with a reaction time of less than 30 min of 100% with stable material and good reused several times. | - |
| DCE (ppm) | Ko (min−1) | R2 | ||||||
|---|---|---|---|---|---|---|---|---|
| Weight of Ag-Cu/g-C3N4/100 mL | ||||||||
| 0.1 | 0.3 | 0.5 | 0.8 | 0.1 | 0.3 | 0.5 | 0.8 | |
| 50,400 | 0.011 | 0.0115 | 0.0122 | 0.0154 | 0.9849 | 0.9914 | 0.9925 | 0.9957 |
| Dose | 50,400 ppm | 25,200 ppm | 8400 ppm | ||||||||||
|---|---|---|---|---|---|---|---|---|---|---|---|---|---|
| Time | 0.1 Cat. * | 0.3 Cat. * | 0.5 Cat. * | 0.8 Cat. * | 0.1 Cat. * | 0.3 Cat. * | 0.5 Cat. * | 0.8 Cat. * | 0.1 Cat. * | 0.3 Cat. * | 0.5 Cat. * | 0.8 Cat. * | |
| 5 | 9.1 | 12.0 | 13.0 | 12.1 | 13.0 | 17.5 | 17.0 | 14.3 | 17.8 | 28.0 | 23.2 | 20.0 | |
| 10 | 15 | 23.0 | 23.0 | 19.0 | 23.0 | 35.0 | 29.5 | 27.0 | 27.4 | 45.9 | 40.0 | 30.0 | |
| 20 | 29.2 | 40.1 | 40.1 | 35.1 | 40.0 | 61.9 | 50.0 | 47.22 | 54.8 | 78.0 | 67.8 | 54.8 | |
| 30 | 45.0 | 62.0 | 59.1 | 54.2 | 58.2 | 80.9 | 69.0 | 68.25 | 77.0 | 100 | 91.1 | 80.0 | |
| 40 | 62.0 | 84.1 | 75.0 | 66.8 | 78.0 | 99.1 | 80.1 | 90.1 | 95.0 | 100 | 100 | 97.0 | |
| 50 | 79.0 | 96.0 | 93.0 | 79.2 | 96.0 | 100 | 95.2 | 99.0 | 100 | 100 | 100 | 100 | |
| 60 | 94.5 | 100 | 100 | 98.8 | 100 | 100 | 100 | 100 | 100 | 100 | 100 | 100 | |
| DCE ppm | Ko (min−1) | R2 | ||||||
|---|---|---|---|---|---|---|---|---|
| Weight of Ag-Cu/g-C3N4 g/100 mL | ||||||||
| 0.1 | 0.3 | 0.5 | 0.8 | 0.1 | 0.3 | 0.5 | 0.8 | |
| 50,400 | 0.0233 | 0.049 | 0.0334 | 0.0274 | 0.9704 | 0.9322 | 0.9776 | 0.9867 |
| 25,200 | 0.0284 | 0.0597 | 0.0379 | 0.0337 | 0.9937 | 0.9532 | 0.9933 | 0.9907 |
| 8400 | 0.0422 | 0.0763 | 0.0607 | 0.0473 | 0.9886 | 0.9916 | 0.9993 | 0.9935 |
| Cl Ion Conc. and Cat. Dos *. | Cl Ion from Degraded 50,400 ppm DCE | Cl Ion from Degraded 25,200 ppm DCE | Cl Ion from Degraded 8400 ppm DCE | ||||||||||
|---|---|---|---|---|---|---|---|---|---|---|---|---|---|
| Time of Degradn. | 0.1 * | 0.3 * | 0.5 * | 0.8 * | 0.1 * | 0.3 * | 0.5 * | 0.8 * | 0.1 * | 0.3 * | 0.5 * | 0.8 * | |
| 0 | 0 | 0 | 0 | 0 | 0 | 0 | 0 | 0 | 0 | 0 | 0 | 0 | |
| 10 | 60 | 100 | 80 | 50 | 98 | 130 | 100 | 75 | 120 | 160 | 150 | 125 | |
| 20 | 100 | 150 | 130 | 79 | 180 | 242 | 223 | 140 | 160 | 314 | 260 | 225 | |
| 30 | 145 | 185 | 165 | 131 | 270 | 350 | 312 | 230 | 253 | 432 | 390 | 324 | |
| 40 | 180 | 230 | 200 | 170 | 365 | 450 | 403 | 308 | 371 | 570 | 502 | 443 | |
| 50 | 235 | 270 | 250 | 212 | 400 | 500 | 455 | 360 | 463 | 700 | 633 | 573 | |
| 60 | 272 | 310 | 290 | 250 | 420 | 523 | 465 | 390 | 500 | 765 | 690 | 607 | |
Disclaimer/Publisher’s Note: The statements, opinions and data contained in all publications are solely those of the individual author(s) and contributor(s) and not of MDPI and/or the editor(s). MDPI and/or the editor(s) disclaim responsibility for any injury to people or property resulting from any ideas, methods, instructions or products referred to in the content. |
© 2023 by the authors. Licensee MDPI, Basel, Switzerland. This article is an open access article distributed under the terms and conditions of the Creative Commons Attribution (CC BY) license (https://creativecommons.org/licenses/by/4.0/).
Share and Cite
Blall, E.G.; Toderas, M.; Ezzat, A.A.; Abdou, H.A.; Mahmoud, A.S.; Shokry, F. Photocatalytic Degradation of Chlorinated Hydrocarbons: The By-Product of the Petrochemical Industry Using Ag-Cu/Graphite Bimetallic Carbon Nitride. Sustainability 2023, 15, 16114. https://doi.org/10.3390/su152216114
Blall EG, Toderas M, Ezzat AA, Abdou HA, Mahmoud AS, Shokry F. Photocatalytic Degradation of Chlorinated Hydrocarbons: The By-Product of the Petrochemical Industry Using Ag-Cu/Graphite Bimetallic Carbon Nitride. Sustainability. 2023; 15(22):16114. https://doi.org/10.3390/su152216114
Chicago/Turabian StyleBlall, Elsayed G., Monica Toderas, Abbas A. Ezzat, Hossam A. Abdou, Amira S. Mahmoud, and Fathy Shokry. 2023. "Photocatalytic Degradation of Chlorinated Hydrocarbons: The By-Product of the Petrochemical Industry Using Ag-Cu/Graphite Bimetallic Carbon Nitride" Sustainability 15, no. 22: 16114. https://doi.org/10.3390/su152216114