Article

Analyzing and Optimizing the Emission Impact of Intersection Signal Control in Mixed Traffic

1
School of Transportation and Logistics Engineering, Shandong Jiaotong University, Jinan 264209, China
2
Department of Human Factors, Faculty of Engineering, Computer Science and Psychology, Ulm University, 89069 Ulm, Germany
3
Department of Architecture and Civil Engineering, Chalmers University of Technology, SE-412 96 Goteborg, Sweden
*
Author to whom correspondence should be addressed.
Sustainability 2023, 15(22), 16118; https://doi.org/10.3390/su152216118
Submission received: 5 September 2023 / Revised: 5 November 2023 / Accepted: 10 November 2023 / Published: 20 November 2023

Abstract

:
Signalized intersections are one of the typical bottlenecks in urban transport systems that have reduced speeds and which have substantial vehicle emissions. This study aims to analyze and optimize the impacts of signal control on the emissions of mixed traffic flow (CO, HC, and NOx) containing both heavy- and light-duty vehicles at urban intersections, leveraging high-resolution field emission data. An OBEAS-3000 (Manufacturer: Xiamen Tongchuang Inspection Technology Co., Ltd., Xiamen, China.) vehicle emission testing device was used to collect microscopic operating characteristics and instantaneous emission data of different vehicle types (light- and heavy-duty vehicles) under different operating conditions. Based on the collected data, the VSP (Vehicle Specific Power) model combined with the VISSIM traffic simulation platform was used to quantitatively analyze the impact of signal control on traffic emissions. Heavy-duty vehicles contribute to most of the emissions regardless of the low proportion in the traffic flows. Afterward, a model is proposed for determining the optimal signal control at an intersection for a specific percentage of heavy-duty vehicles based on the conversion of emission factors of different types of vehicles. Signal control is also optimized based on conventional signal timing, and vehicle emissions are calculated. In the empirical analysis, the changes in CO, HC, and NOx emissions of light- and heavy-duty vehicles before and after conventional signal control optimization are quantified and compared. After the signal control optimization, the CO, HC, and NOx emissions of heavy-duty vehicles were reduced. The CO and HC emissions of light-duty vehicles were reduced, but the NOx emissions of light-duty vehicles remained unchanged. The emissions of vehicles after optimized signal control based on vehicle conversion factors are reduced more significantly than those after conventional optimized signal control. This study provides a scientific basis for developing traffic management measures for energy saving and emission reduction in transport systems with mixed traffic.

1. Introduction

Global environmental issues have attracted increasing attention in recent years, and traffic emissions have been one of the “major culprits” [1]. Excessive emissions of pollutants from transport seriously impact air quality, public health, and climate in urban contexts [2,3]. In particular, traffic congestion deteriorates the situation and results in more emissions from traffic [4]. CO (Carbon Monoxide), HC (Hydrocarbon Compounds), and NOx (Nitrogen Oxide) emissions from vehicles increase by 20% during peak hours compared with off-peak hours [5]. Under traffic congestion, vehicle pollutant emissions are 5 to 10 times higher than those from normal driving conditions [6]. The city manager urgently needs management measures and tools that can effectively reduce traffic emissions, which requires accurate analysis and modeling of the emission patterns of motor vehicles [7]. Reducing emissions from urban transport systems can be achieved with reasonable transport facilities and management improvements, such as signal controls, that can relieve traffic congestion.
One of the focuses of reducing transport emissions in urban areas is to reduce traffic congestion at intersections and the corresponding traffic emissions, leveraging effective infrastructure and traffic management (e.g., signal timing design). The optimization of intersection signal control is an essential aspect of traffic management that aims to improve the efficiency and safety of intersections. In recent years, researchers have developed various methods and techniques to optimize intersection signal control, including traditional methods such as fixed-time control, actuated control, and adaptive control, as well as more advanced methods such as intelligent transportation systems (ITSs), artificial intelligence (AI), and machine learning (ML) techniques [8,9]. In the early stages of traffic signal development, researchers developed methods to determine fixed signal timings, assuming that the traffic flow from each intersection is constant [10]. This approach does not consider the uncertainty of traffic flows and has lost relevance in the contemporary traffic climate [11]. Thanks to recognizing the uncertainty, much research has been devoted to improving the analysis of delay models and developing control models [12]. To address these issues, researchers have developed more advanced methods, such as actuated control, which adjusts the signal timings based on the actual traffic demand using various sensors and detectors. Adaptive control is another method that utilizes real-time traffic data to dynamically adjust the signal timings and cycle length. Recent technological advancements have led to the development of more advanced methods such as ITS, AI, and ML techniques. These methods deploy sophisticated algorithms and models to optimize intersection signal control based on various factors such as traffic volume, speed, and congestion levels. For instance, some researchers have used deep reinforcement learning (DRL) to optimize signal timings and reduce delays at intersections [13]. Other researchers have applied a combination of genetic algorithms and fuzzy logic to optimize intersection signal control [14]. In these methods, it has been shown how to improve traffic flow and reduce delays and congestion. Previous studies have focused more on optimizing signal timing in terms of reducing vehicle queue lengths, stopping times, and vehicle delays at intersections, with relatively less attention paid to traffic emissions.
As traffic emissions become more serious, researchers are not only limiting themselves to reducing travel time and delays but are also starting to optimize signal control to simultaneously reduce vehicle pollutant emissions [15]. Just to name a few, Jamal et al. [16] investigated the relationship between vehicle emissions and simulated operating conditions at intersections. The overall traffic emissions were measured by superimposing the emissions of vehicles under different simulated operating conditions (queuing and waiting at intersections, the proportion of accelerating vehicles, the proportion of decelerating vehicles, etc.) at signal intersections. Coelho et al. [17] examined the relationship between signal control settings, emissions, and traffic variables on Highway N6 in Portugal. Emissions were calculated using a modal approach to explore the trade-offs between enforcement and added emissions. The results demonstrated that signal control schemes that resulted in stopping more speed violators led to higher emissions, while those that induced speed reduction resulted in lower relative pollutant emissions. Lee et al. [18] developed a CVIC algorithm for an urban intersection and expanded it to a corridor of multiple intersections. It investigated the sustainability aspects of the CVIC system using SSAM and VT-Micro models. The CVIC system showed significant reductions in delay times and rear-end crash events, and improved air quality and fuel consumption compared with coordinated actuated control. Mahmod et al. [19] investigated the impact of traffic measures at a single intersection using a traffic and emission model. The measures included traffic demand control, banning heavy-duty vehicles, and speed restrictions. Reducing traffic demand by 20% led to a 23% reduction in CO2, NOx, and PM10 emissions. Banning heavy-duty vehicles reduced NOx and PM10 emissions significantly, while speed restriction reduced CO2 and NOx emissions but increased PM10 emissions, mainly from heavy-duty vehicles. Abdelghaffar et al. [20] proposed a de-centralized traffic signal controller using a Nash bargaining game-theoretical framework that optimized traffic signal timings at each intersection by modeling each phase as a player in a game. The algorithm was tested on two sample networks and compared with other control approaches, showing a significant reduction in queue length, vehicle delay, and emission levels at both an isolated intersection and an arterial network. Kim et al. [21] introduced a red time traffic signal countdown timer (TSCT) to help drivers control vehicle idling and reduce GHG emissions around signalized intersections. The results of a case study in Haeundae-gu in Busan, Korea revealed decreases in GHG emissions by 10.9% and 56.8% of the stationary and idling vehicles, respectively. This emission reduction provides the environmental benefit of the red time TSCT with the drivers’ voluntary involvement. Niroumand et al. [22] proposed a mixed-integer non-linear programming framework to control the trajectory of connected–automated and connected human-driven vehicles through signalized intersections. The program optimized the trajectory of automated vehicles while introducing a “white” phase to force human-driven vehicles to follow their immediate front vehicle. The proposed methodology successfully controlled the mixed traffic and reduced the total delay by 19.6–96.2% compared with fully actuated signal control. Sun et al. [23] introduced three models to evaluate pollutant dispersion at a busy urban signalized intersection, specifically for fine particulate matter (PM2.5). ANSYS Fluent was found to perform better for PM2.5 concentration prediction with carefully calibrated parameter settings, while ENVI-met performed better in assessing correlation relationships between PM concentrations and intersectional and meteorological factors. The study also found that PM2.5 concentration increases significantly during idle phases, and street canyons with high buildings hinder pollutant diffusion. The findings may assist urban intersection design from various perspectives.
Even though there is some research exploring the optimization of intersection signals to reduce emissions, current research mainly focuses on the emissions of light-duty vehicles based on the traffic flow theories for light-duty vehicles to derive traffic delays in optimization models. Most existing studies neglected the characteristics of mixed traffic flow with different vehicle types, such as light-duty vehicles and heavy-duty vehicles. Few studies have investigated signal optimization methods specific to mixed traffic flows. Heavy-duty vehicles and light-duty vehicles have significantly distinct emission patterns, vehicle sizes, and kinetic characteristics [24,25], which lead to significantly distinct traffic flow characteristics and emission principles. Therefore, the signal time design at intersections with mixed traffic may follow different approaches and should be formulated with awareness of the characteristics of mixed traffic rather than using existing methods for light-duty vehicles.
We initiate our study by collecting real-time emissions and traffic data in the field. With these data, the VSP model is developed. We use a VISSIM simulation to obtain instantaneous speed and acceleration data for vehicles in the traffic flow. These data are then integrated with the VSP model to calculate traffic emissions. We deploy the ratio of instantaneous emissions between light-duty vehicles and heavy-duty vehicles to convert vehicle factors in calculating traffic emissions. These adjusted parameters are utilized in the signal control optimization model, introducing an emission-oriented approach to signal control. We further quantify and compare the changes in CO, HC, and NOx emissions from light-duty and heavy-duty vehicles before and after signal control optimization at a typical intersection in Shanghai. This study offers an effective method for reducing mixed traffic emissions through efficient signal control.
The subsequent sections are organized as follows. Section 2 outlines the procedures for collecting emission data and conducting emission modeling. In Section 3, the mixed traffic flow model for determining the signal control is discussed in detail. Section 4 provides an overview of the simulation approach and an empirical case study. Finally, Section 5 presents concluding remarks.

2. Field Emission Data and Modeling

2.1. Field Emission Data Collection

This study used an OBEAS-3000 portable emission tester to promptly identify CO, HC, and NOx emissions. Moreover, it captured vehicle operational aspects, precise GPS-based position, speed, and acceleration. The OBEAS-3000 underwent calibration to match technical specifications on urban roads in China. By offering real-time emission data under varying conditions, it illustrated the correlation between instant emissions and vehicle speed/acceleration, contributing to the formulation of instantaneous vehicle emission profiles. For our research purposes, light-duty vehicles and heavy-duty vehicles were chosen for experiments. Light-duty vehicles mean M1, M2, and N1 vehicles with a gross weight of up to 3.5 tons. Meanwhile, heavy-duty vehicles represent goods and passenger vehicles weighing more than 8 tons. We selected light-duty vehicles of Volkswagen and Harvard SUV, and heavy-duty vehicles of FAW Jie Fang as the representatives, which are popular vehicles in China. Table 1 provides the vehicle parameters.

2.2. Real-Time Vehicle Emission Models

This study focuses on optimizing emission patterns by analyzing the impact of vehicle operation complexity on emissions. The Vehicle Specific Power (VSP) model is used to link vehicle dynamics to the instant emissions of various exhausts. It involves establishing instant emission models for both light-duty and heavy-duty vehicles regarding CO, HC, and NOx emissions. VSP, defined as instantaneous power per unit mass (kW/t), correlates with transient emissions. The VSP-calibrated emission intervals are tied to VSP output, calculated from vehicle speed and acceleration. The VSP acts as a link between speed, acceleration, and emissions, enabling estimation in diverse conditions [26]. The VSP for light-duty vehicles is calculated using Equation (1). The VSP formula for heavy-duty vehicles (Equation (2)) differs due to varying vehicle characteristics, as recommended by Barth et al. [27]. VSP values are grouped into discrete bins according to emission differences and resolution requirements. Bins are created at 2 kW/t intervals using Equation (3). Emission rates for CO, HC, and NOx are determined using VSP numerical and corresponding exhaust emissions. It establishes the relationship between vehicle operating conditions, VSP, and emission rates. Notably, emission rates vary between different exhausts within the same VSP interval for light-duty vehicles and heavy-duty vehicles.
V S P = v × ( 1.1 a + g × g r a d e + 0.132 ) + 0.000302 v 3
V S P = v × ( a + g × g r a d e + 0.09199 ) + 0.000169 v 3
V S P V S P BIN i = ( , 30 ) [ n 2 , n ] , n = ( 29 , 29 ) , n Z [ 30 , + ]
where v is the instantaneous speed m/s; a is the instantaneous acceleration m/s2; g is the acceleration of gravity and is set to be 9.81 m/s2; g r a d e is the road gradient, %; and n is the integer that divides the interval.
Based on the VSP values and corresponding instantaneous emissions of exhausts (CO, HC, and NOx) detected by the OBEAS-3000 system, we average the instantaneous emission rates in the same VSP interval to obtain representative emission rates within each VSP interval. These results construct a relationship between the vehicle operating conditions (speed and acceleration), VSP values, and the corresponding emission rates for the different exhausts. There are remarkable differences in the emission rates of different exhausts in the same VSP interval (Table 2).

3. Optimization of Signal Control

The frequency of the acceleration and deceleration states of vehicles at intersections surpasses that in regular roadway driving due to the random nature of vehicle arrivals [28]. Poorly designed intersection signal timing can trigger severe traffic flow oscillations, leading to a high occurrence of abrupt acceleration and deceleration behaviors in vehicle micro-operations [29]. Previous research indicates that these acceleration and deceleration processes contribute significantly to traffic emissions. Effectively mitigating motor vehicle acceleration and deceleration can yield substantial emission reductions. Notably, existing studies on traffic signal control have neglected emissions in mixed traffic flows comprising both light-duty and heavy-duty vehicles. This study uniquely prioritizes emissions from mixed traffic flows during the optimization process of traffic signal control, with a specific focus on intersections as critical points for vehicle emissions reduction.
The ratio of instantaneous emissions of light-duty and heavy-duty vehicles is used as the basis for converting the emission coefficients of light-duty vehicles and heavy-duty vehicles. In this study, according to the ratio of one heavy-duty vehicle to N light-duty vehicles, the coefficients are substituted into the signal timing formula, and the signal timing at the intersection is calculated. The determination of the optimization method of signal control at intersections under a certain heavy vehicle ratio is based on the conversion of emission coefficients of different vehicles. In the empirical analysis, the changes in CO, HC, and NOx emissions of light-duty and heavy-duty vehicles before and after signal control optimization are quantitatively analyzed based on VISSIM simulation data.
min : F ( G ) = [ f c ( G ) , f t ( G ) ]
where F ( G ) is the overall emission at the intersection; f c ( G ) and f t ( G ) are the emissions of light-duty vehicles and heavy-duty vehicles, respectively. Vehicle emissions at an intersection are proportional to the number of vehicle delays and acceleration or deceleration times [30], expressed by
f c ( G ) = λ c D c
f t ( G ) = λ t D t
where λ c is the parameter relating the delay time D c of light-duty vehicles to emissions and λ t is the parameter relating the delay time D t of heavy-duty vehicles to the emissions, according to the formula for the optimum cycle time of an intersection.
C = 1.5 L + 5 1 Y
where L is the total signal loss time at the intersection; Y is the sum of the flow ratios of the inlet lanes at the intersection.
In scenarios where heavy-duty vehicles constitute a significant portion of the traffic flow, it becomes imperative to consider the influence these vehicles exert on traffic dynamics. If the intersection has a light-duty vehicle traffic flow of α vehicles per hour and a heavy traffic flow of β vehicles per hour, the optimum perimeter length of the intersection can be expressed as
C = i = 1 n k n ( 1.5 L + 5 ) i = 1 n ( k n α n β n )
where n is the total number of lanes at the intersection; k n is the saturation flow for a single lane of the inlet road; α n is the light-duty vehicle traffic flow in the n lane (veh/h); and β n is the heavy vehicle traffic flow in the lanes (veh/h).
According to the provisions in the Planning and Design Regulations for Urban Road Intersections [31], the basic saturation flow of a single lane of an urban road with only light-duty vehicles traveling in the lane is
S b T = 1800   p c u / h , S b L = 1800   p c u / h , S b R = 1650   p c u / h ,
where S b T is the saturation flow for the straight lane, S b L is the saturation of the left turn lane, and S b R is the saturation of the right turn lane.
When there is a certain proportion of heavy-duty vehicles in the lane, the saturation flow must be corrected according to the proportion of heavy-duty vehicles. Let the proportion of heavy-duty vehicles be HV; then, the proportion of light-duty vehicles is 1-HV. The default gradient of the intersection in the study is G = 0, so the correction factor for heavy-duty vehicles is f H V = 1 ( G + H V ) , the correction factor for lane width is f w , the correction factor for non-motorized vehicles is f b , and the correction factor for the turning radius of the right turn lane is f Z . Therefore, the single-lane saturation flow rate for the inlet lane is derived as
k n T = S b T × f w × f H V × f b
k n L = S b L × f w × f H V × f b
k n R = S b R × f w × f H V × f Z
where k n T is the saturation flow of a single lane in the straight lane (veh/h); k n L is the saturation flow of a single lane in the left turn lane (veh/h); and k n R is the saturation flow of a single lane in the right turn lane (veh/h). According to the Webster algorithm, the effective green light time for a cycle is
C i = C L
where C i is the effective green time; C is the signal period; and L is the total signal loss time at the intersection. The effective green light time for each phase is
C e = C i × y i Y i
where Y i is the sum of the lane flow ratios under each phase control; y i is the lane flow ratio for a given phase. Suppose that the number of lanes under a certain phase control is m , the actual arrival flow of light-duty vehicles in this phase is α m vehicles per hour, and the actual arrival flow of heavy-duty vehicles is β m vehicles per hour. Then, the optimum green time under this phase control is
C e = ( C L ) i = 1 n i = 1 m k n ( α m + β m ) i = 1 n i = 1 m k m ( α n + β n )
From the perspective of traffic flow, the conversion factor is commonly 2:1 for heavy-duty and light-duty vehicles, implying one heavy vehicle is equivalent to two light-duty vehicles within the traffic flow [32]. Nevertheless, when considering emissions, it becomes evident that the instantaneous emissions from a heavy-duty vehicle (HDV) significantly surpass those from a light-duty vehicle (LDV) under identical road and operating conditions. From the emission perspective, the conversion factor could be expressed as
N = E truck E c a r
where N is the conversion factor. E truck and E c a r are the emissions of HDVs and LDVs at the same operation conditions.
E c a r = ( n C O × α + n H C × α H C + n N O x × α N O x ) α car
E t r u c k = ( n C O × β + n H C × β H C + n N O x × β N O x ) β truck
where n C O , n H C , and n N O x are the weights of CO, HC, and NOx, respectively; α C O , α H C , and α N O x are the emission proportions of CO, HC, and NOx for light-duty vehicles, respectively; β C O , β H C , and β N O x are the emission proportions of CO, HC, and NOx for heavy-duty vehicles; α c a r is the proportion of light-duty vehicles in the traffic stream; and β t r u c k is the proportion of heavy-duty vehicles in the traffic stream.
Considering the varying environmental impact of CO, HC, and NOx, their exhaust weights are established as 0.7, 0.15, and 0.15, respectively [33]. Drawing upon the measured CO, HC, and NOx emission proportions from heavy-duty and light-duty vehicles at the intersection, along with the traffic stream ratio between these vehicle categories, we can compute an approximate emission ratio of 20:1 between heavy-duty and light-duty vehicles. This approximation implies that emissions from a solitary heavy-duty vehicle correspond to those generated by 20 light-duty vehicles in an equivalent road scenario.

4. Results

4.1. Case Study Based on Field Data at an Intersection

We selected the Cao’an Highway—Jiasong North Road intersection in Jiading District, Shanghai (Figure 1). To ensure the accuracy of the collected data, we employed drones to capture images at intersections during morning and evening peak hours from Monday to Friday. This comprehensive dataset on intersection conditions was then averaged for in-depth analysis. This urban highway accommodates a diverse traffic stream that includes a significant number of heavy-duty vehicles. By analyzing on-site traffic data alongside the lane design’s saturation traffic flow, we derived the saturation flow ratio for real intersection traffic conditions. The corresponding details are presented in Table 3.

4.2. Impact of Conversion Factors on Signal Timing of Different Directions in the Case Study

By utilizing Equation (15) to compute the effective green light duration while incorporating the proportion of HDVs as a parameter, we can derive a curve illustrating the efficient green light durations for the entry lane with the conversion factors between HDVs and LDVs, which is presented in Figure 2. As depicted in Figure 2, the conversion factor between HDVs and LDVs significantly influences outcomes. A higher conversion factor leads to increased effective green light duration and a heightened pass-through rate in the inlet lane of a direction. It means a higher conversion factor prompts an exponential rise in green light time for the inlet lane. Enhancing the waiting efficiency for one lane unavoidably trims effective green time for another as the cycle length is fixed. Striving for comprehensive traffic flow efficiency across each inlet lane involves elongating effective green times for all four directions to optimize overall intersection performances. Hence, a balance is essential for avoiding unlimited extension of green time for any specific lane.
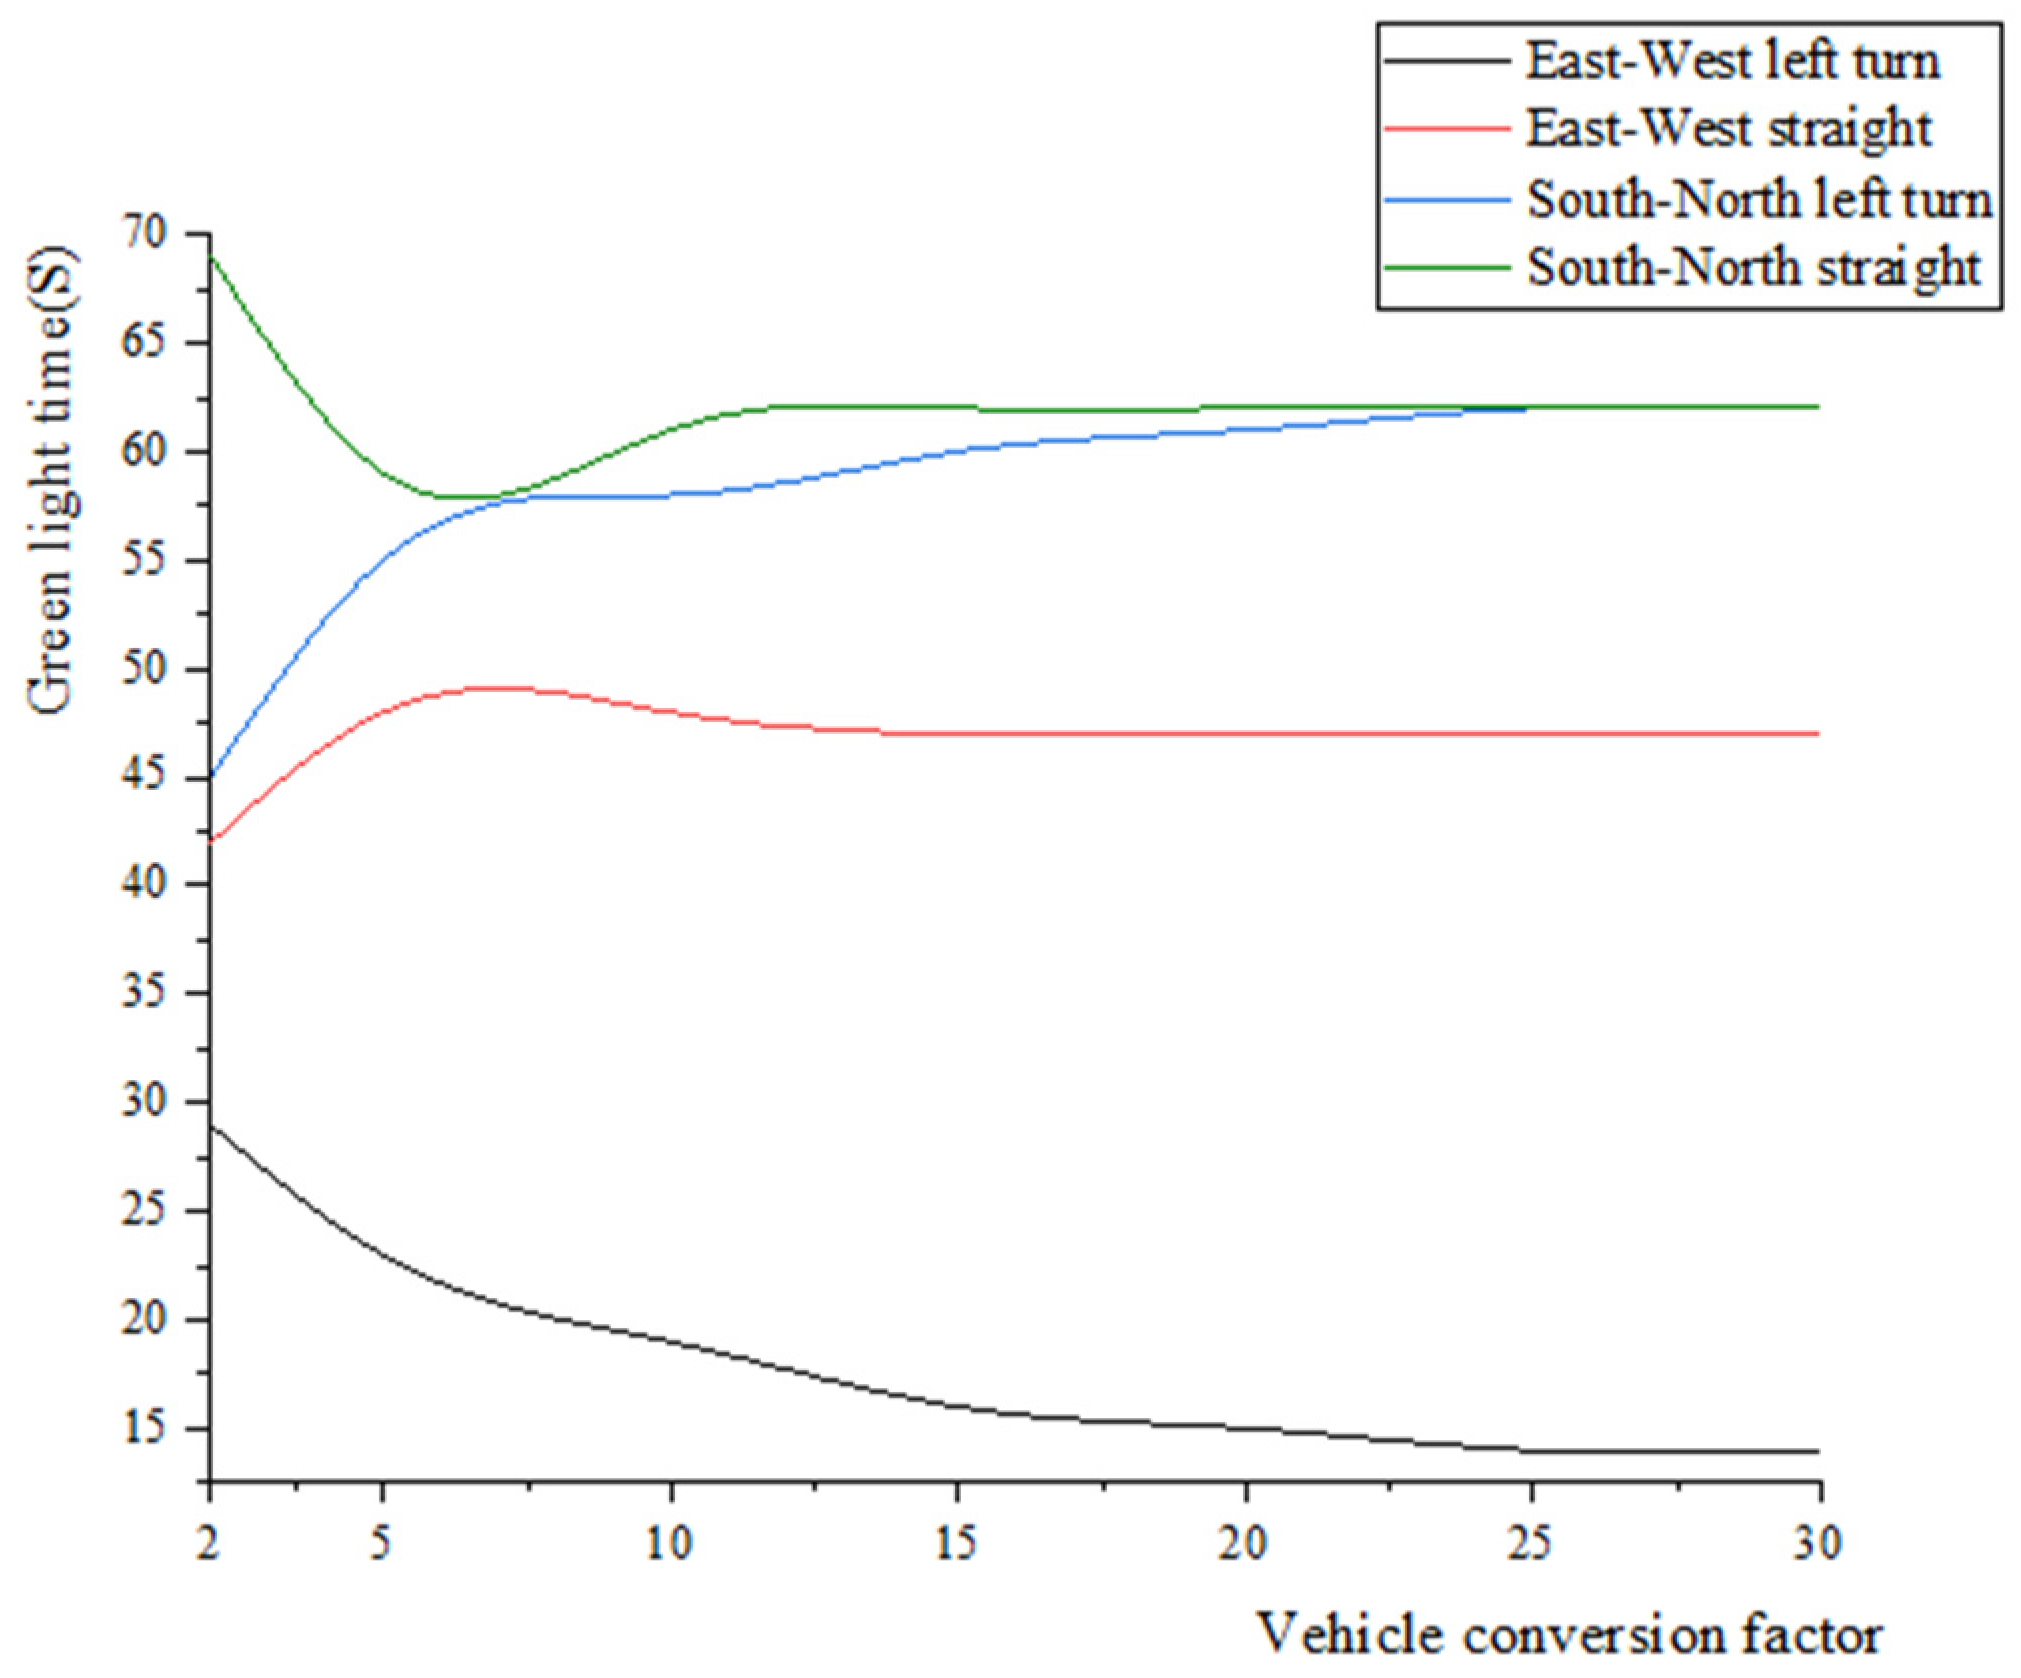
To holistically optimize signal control at the intersection, it is imperative to consider the operational efficiency across all four inlet lanes. We must consider how to assess how conversion factors between HDVs and LDVs influence signal timing in different directions. We calculate signal timing based on varying conversion factors, whose results are summarized in Table 4 and Figure 3. The trends illustrated in Figure 3 unveil how effective green light durations in different directions at the intersection can change with the conversion factors used for optimizing signal timing. The effective green time is linked to the used vehicle conversion factor in the optimization process. Although distinct conversion factors correspond to varied effective green light durations, the rate of change in these durations gradually tapers as the conversion factor rises. So, we suggest that one direction will not be offered unbounded priority as the conversion factor escalates, owing to holistic intersection efficiency considerations. Consequently, as the conversion factor between heavy-duty vehicles and light-duty vehicles grows, the effective green light duration approaches a stable point.

4.3. The Effects of the Proposed Optimization Methods on Intersection Emissions

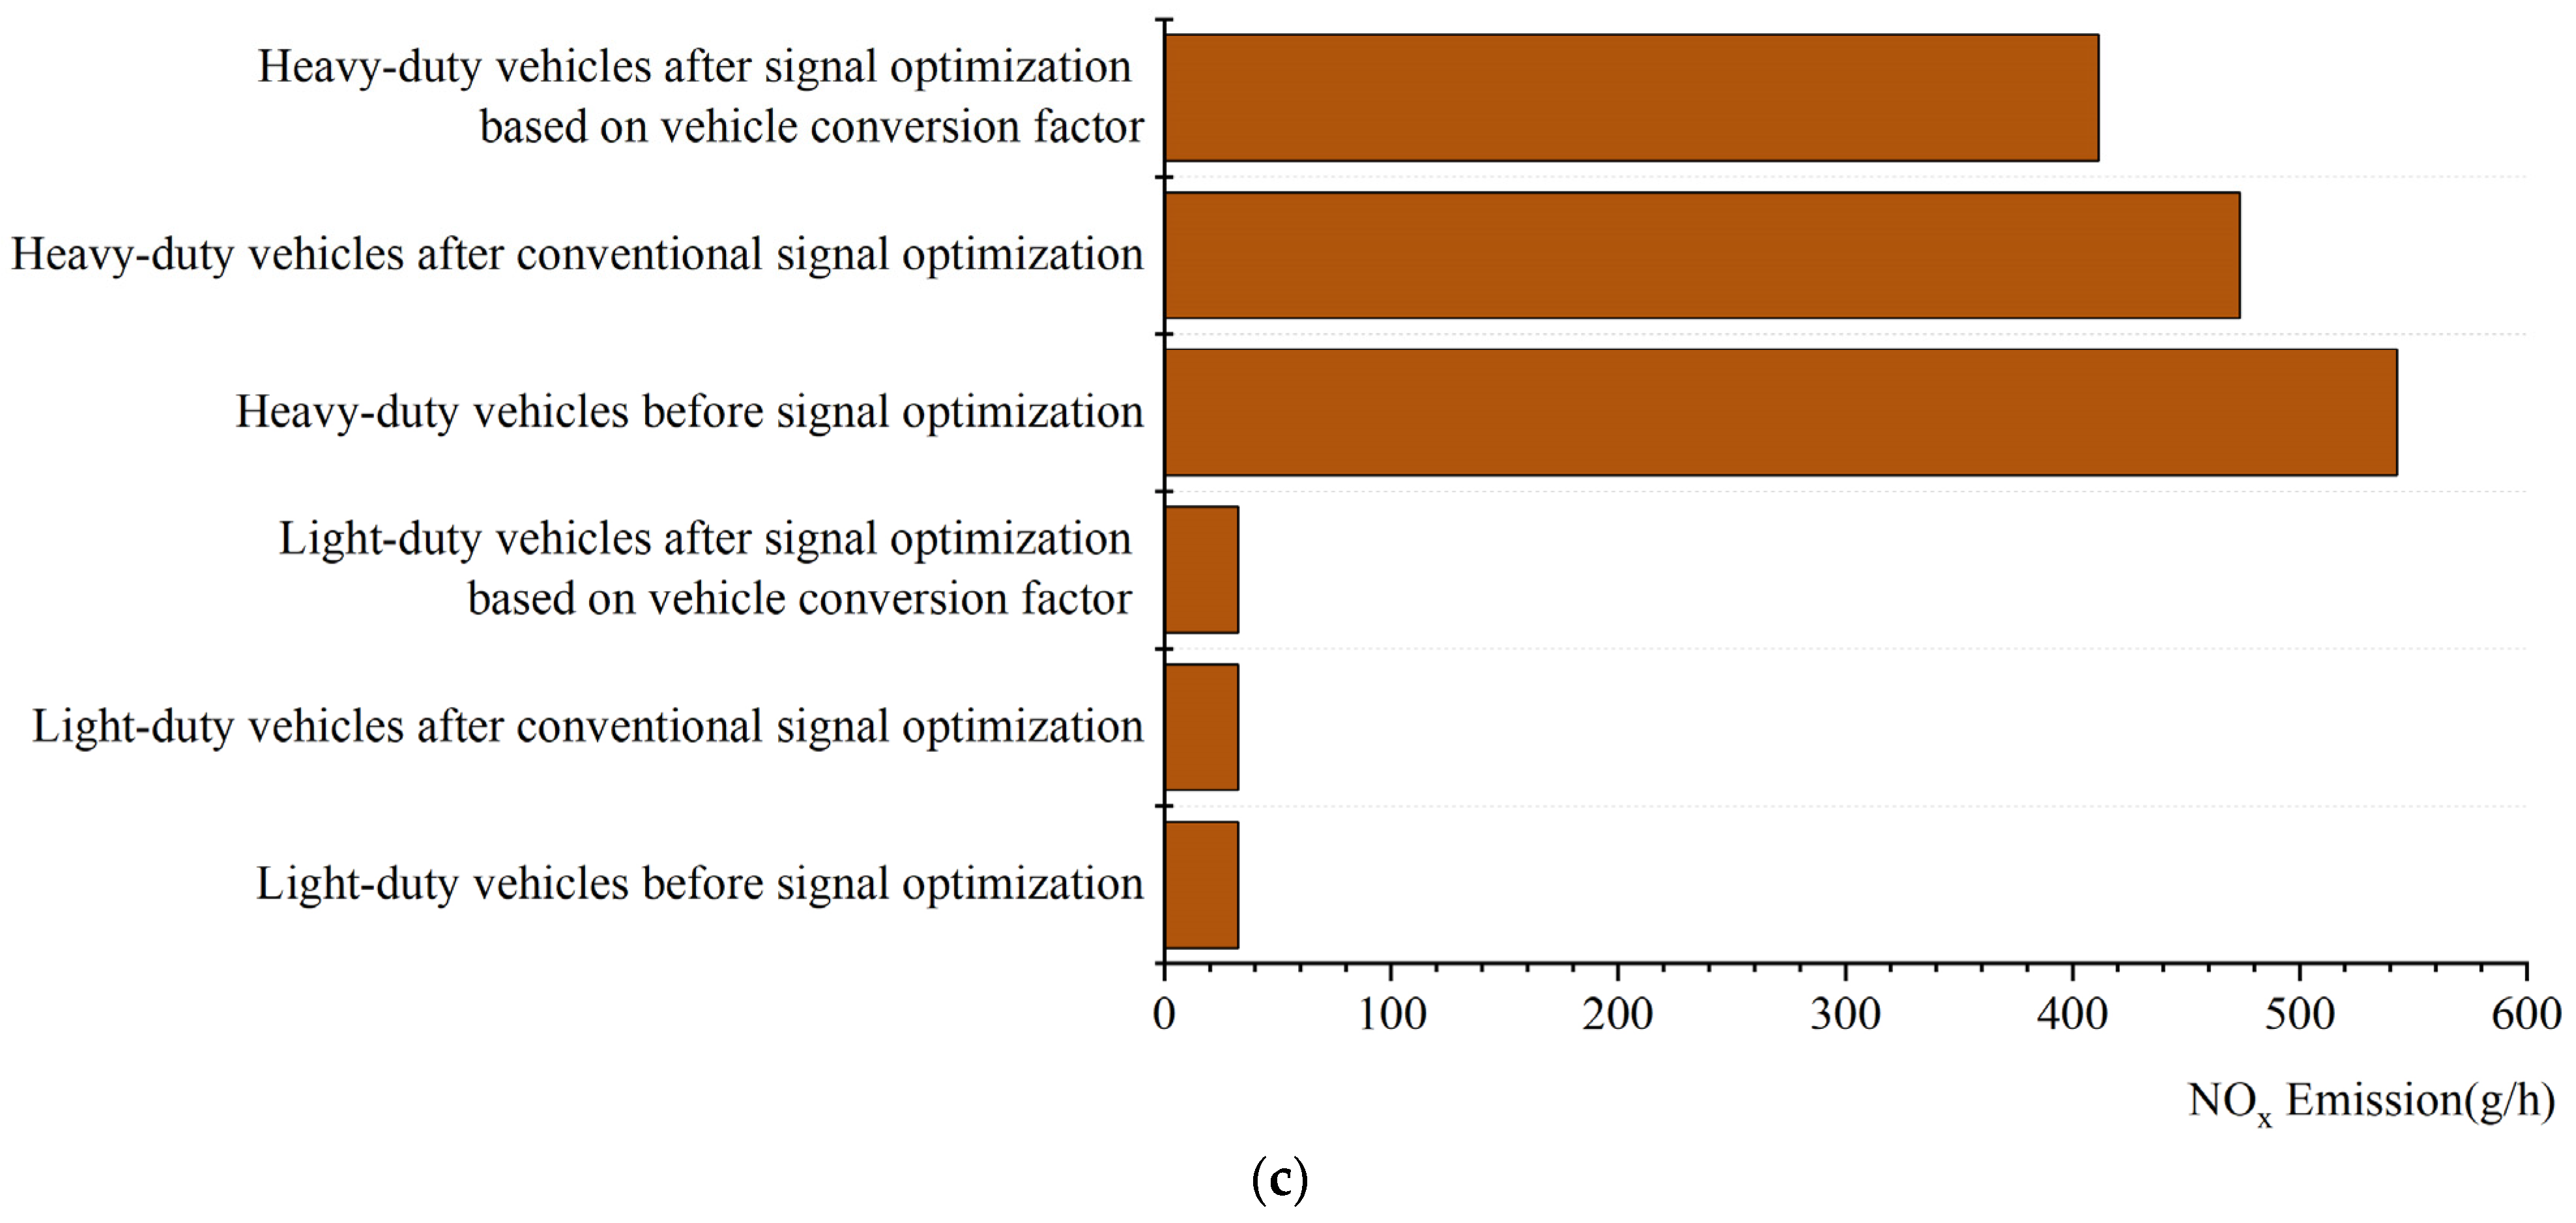
In this section, we compare the emissions at the intersection in three cases: original and before signal optimization, conventional signal optimization, and the proposed signal optimization. Conventional signal optimization means the optimized signal time using the previous rule of thumb about a conversion factor between 2 and 1 from the perspective of traffic flow. The proposed signal optimization refers to the method in the Section 3 with a conversion factor from the perspective of emissions. Figure 4 illustrates the peak hourly emissions of CO, HC, and NOx from both heavy-duty vehicles and light-duty vehicles at intersections in the abovementioned three cases.
As depicted in Figure 4a, before signal control optimization, light-duty vehicles exhibit a CO emission of 1208.69 g per hour. After conventional signal control optimization, the CO emission for light-duty vehicles reduces to 1169.92 g per hour, marking a decrease of 3.21% compared with no optimization. The CO emission changes to 1074.67 g per hour when the signal control is optimized. It indicates a decrease of 11.09% in emissions compared with the case of disregarding the signal control optimization. In terms of HC emissions, LDVs emit 196.62 g of HC per hour. After applying conventional signal control optimization, the HC emission (Figure 4b) decreases to 188.33 g per hour, signifying a reduction of 4.22%. Similarly, with the proposed optimized signal control, HC emissions are reduced to 188.49 g per hour, reflecting a reduction of 4.13%. Regarding NOx emissions from light-duty vehicles, the emission is 32.65 g per hour. Following both conventional signal control optimization and the proposed signal control optimization, the NOx emissions remain relatively stable at 32.53 g and 32.56 g, respectively, showcasing minimal variation.
As for heavy-duty vehicles, prior to signal control optimization, CO emissions were measured at 3129.98 g per hour. Following traditional signal control optimization, CO emissions decreased to 2713.72 g per hour, marking a notable reduction of 13.30%. Upon implementing the proposed signal control optimization, CO emissions diminished to 2512.07 g per hour, showcasing a substantial decrease of 19.74%. Regarding HC emissions from heavy-duty vehicles during peak hours, the initial emission was 425.32 g per hour. After applying conventional signal control optimization, HC emissions decreased to 361.03 g, indicating a reduction of 15.12%. With the proposed optimized signal control, HC emissions decreased to 354.65 g, showcasing a reduction of 16.61%. For NOx emissions from heavy-duty vehicles during peak hours, the initial emission stood at 542.88 g. After conventional signal control optimization, NOx emissions were reduced to 473.78 g, reflecting a reduction of 12.73%. Implementing the proposed signal control optimization led to a reduction in NOx emissions to 411.60 g, marking a substantial decrease of 24.18%.
The quantitative analysis of CO, HC, and NOx emissions reveals that conventional signal control optimization diminishes emissions from both heavy- and light-duty vehicles at intersections. However, the proposed signal control optimization surpasses the emission reduction achieved using conventional methods. In particular, this optimized approach notably affects heavy vehicle emissions to a greater extent than those from light-duty vehicles.

5. Conclusions

This analysis delves into the correlation between signal timing adjustments at intersections and traffic emissions. Instantaneous emissions from both heavy-duty and light-duty vehicles serve as the foundation for determining conversion factors applicable to each vehicle category. Subsequently, intersections undergo signal control optimization, driven by these vehicle conversion factors. The process involves VISSIM simulation for data collection, enabling the examination of vehicle operating conditions, traffic flow dynamics, and emission variations at intersections.
A groundbreaking approach is introduced, establishing a vehicle coefficient conversion model rooted in instantaneous vehicle emissions. This innovative departure from traditional headway time–distance conversion models becomes a robust foundation for intersection signal timing optimization. The challenge lies in simultaneously maintaining traffic flow on various inlet lanes while minimizing emissions. This intricate balance is achieved by optimizing the effective green time for individual inlets while accounting for the others. A comprehensive calculation of effective green time across all four inlets guarantees flow stability.
Analysis of the results is as follows.
(1)
An inlet lane dominated by heavy-duty vehicles experiences an elongation of effective green time with increasing conversion factors, indicating a priority advantage.
(2)
Signal control optimization through instantaneous emissions-based conversion factors leads to varying effective green times for the intersection’s four entry lanes. Nevertheless, a trend towards uniformity emerges as the conversion factor grows. High heavy vehicle ratios do not grant unrestricted priority as the factor increases.
(3)
After conventional signal control optimization, CO, HC, and NOx emissions decrease for heavy-duty vehicles, and CO and HC emissions drop for light-duty vehicles. However, NOx emissions from light-duty vehicles remain relatively steady.
(4)
The improvement in reducing vehicle emissions using signal timing optimization based on vehicle conversion factors is more significant than that based on conventional signal timing optimization.
(5)
Slight increases in traffic emissions occur as the vehicle conversion factor surpasses a specific threshold. It results from the considerable presence of light-duty vehicles in the traffic flow. As heavy-duty vehicles gain more right of way, it impacts light-duty vehicle capacity and contributes to the emission rise.
By establishing a comprehensive traffic emission model and empirically scrutinizing the effects of optimized signal control, this study contributes a scientific underpinning for formulating energy-efficient and emission-reducing traffic management strategies within urban transportation systems.

6. Limitations and Future Study

This study delves into the emissions of mixed traffic flows at peak-hour intersections, focusing on signal timing optimization and the application of vehicle conversion factors for both heavy-duty and light-duty vehicles. It also examines the emissions of heavy-duty and light-duty vehicles before and after signal timing optimization. Future studies could be in the following areas:
(1)
While acknowledging that the peak-hour period represents only a segment of overall traffic flow, our future work will address the impact of signal timing optimization on vehicle emissions during off-peak hours.
(2)
Due to resource constraints, the current dataset is limited. Future research can overcome these limitations by expanding both the volume of data and the breadth of the investigation, allowing for a more comprehensive analysis of emissions from medium-sized vehicles, buses, and other vehicle models. While our present empirical analysis predominantly centers on urban road intersections, subsequent studies can extend to urban segments and the entire road network.
(3)
Traffic emission research primarily informs the creation of urban traffic management and transportation planning. Subsequent research can use simulation methods and consider emission variations among different vehicle models and road network structures. It can construct an expansive traffic emission network simulation tailored to cities.

Author Contributions

Methodology, J.F., T.L. and A.N.; Software, J.F.; Validation, J.S.; Formal analysis, J.F., J.S. and A.N.; Writing—review & editing, J.F., T.L. and A.N.; Visualization, J.F. and T.L. All authors have read and agreed to the published version of the manuscript.

Funding

This research received no external funding.

Institutional Review Board Statement

Not applicable.

Informed Consent Statement

Not applicable.

Data Availability Statement

The data presented in this study are available on request from the corresponding author.

Conflicts of Interest

The authors declare no conflict of interest.

References

  1. Attard, M. Active travel and sustainable transport. Commun. Transp. Res. 2022, 2, 100059. [Google Scholar] [CrossRef]
  2. Jamshidnejad, A.; Papamichail, I.; Papageorgiou, M.; De Schutter, B. A mesoscopic integrated urban traffic flow-emission model. Transp. Res. Part C Emerg. Technol. 2017, 75, 45–83. [Google Scholar] [CrossRef]
  3. Lu, X.; Yao, T.; Fung, J.C.; Lin, C. Estimation of health and economic costs of air pollution over the Pearl River Delta region in China. Sci. Total Environ. 2016, 566, 134–143. [Google Scholar] [CrossRef] [PubMed]
  4. Gao, K.; Yang, Y.; Gil, J.; Qu, X. Data-driven Interpretation on interactive and nonlinear effects of the correlated built environment on shared mobility. J. Transp. Geogr. 2023, 110, 103604. [Google Scholar] [CrossRef]
  5. Choudhary, A.; Gokhale, S. Urban real-world driving traffic emissions during interruption and congestion. Transp. Res. Part D Transp. Environ. 2016, 43, 59–70. [Google Scholar] [CrossRef]
  6. Chen, X.; Jiang, L.; Xia, Y.; Wang, L.; Ye, J.; Hou, T.; Zhang, Y.; Li, M.; Li, Z.; Song, Z.; et al. Quantifying on-road vehicle emissions during traffic congestion using updated emission factors of light-duty gasoline vehicles and real-world traffic monitoring big data. Sci. Total Environ. 2022, 847, 157581. [Google Scholar] [CrossRef]
  7. Gao, K.; Li, A.; Liu, Y.; Gil, J.; Bie, Y. Unraveling the mode substitution of dockless bike-sharing systems and its determinants: A trip level data-driven interpretation. Sustain. Cities Soc. 2023, 98, 104820. [Google Scholar] [CrossRef]
  8. Xu, B.; Ban, X.J.; Bian, Y.; Li, W.; Wang, J.; Li, S.E.; Li, K. Cooperative method of traffic signal optimization and speed control of connected vehicles at isolated intersections. IEEE Trans. Intell. Transp. Syst. 2018, 20, 1390–1403. [Google Scholar] [CrossRef]
  9. Guo, Q.; Li, L.; Ban, X.J. Urban traffic signal control with connected and automated vehicles: A survey. Transp. Res. Part C Emerg. Technol. 2019, 101, 313–334. [Google Scholar] [CrossRef]
  10. Mirchandani, P.; Head, L. A real-time traffic signal control system: Architecture, algorithms, and analysis. Transp. Res. Part C Emerg. Technol. 2001, 9, 415–432. [Google Scholar] [CrossRef]
  11. Ren, G.; Huang, Z.; Cheng, Y.; Zhao, X.; Zhang, Y. An integrated model for evacuation routing and traffic signal optimization with background demand uncertainty. J. Adv. Transp. 2013, 47, 4–27. [Google Scholar] [CrossRef]
  12. Zhong, R.; Sumalee, A.; Pan, T.; Lam, W. Stochastic cell transmission model for traffic network with demand and supply uncertainties. Transp. A Transp. Sci. 2013, 9, 567–602. [Google Scholar] [CrossRef]
  13. Liang, X.; Du, X.; Wang, G.; Han, Z. Deep reinforcement learning for traffic light control in vehicular networks. arXiv 2018, arXiv:1803.11115. [Google Scholar]
  14. Zheng, Y.; Guo, R.; Ma, D.; Zhao, Z.; Li, X. A novel approach to coordinating green wave system with adaptation evolutionary strategy. IEEE Access 2020, 8, 214115–214127. [Google Scholar] [CrossRef]
  15. Eom, M.; Kim, B.I. The traffic signal control problem for intersections: A review. Eur. Transp. Res. Rev. 2020, 12, 50. [Google Scholar] [CrossRef]
  16. Jamal, A.; Tauhidur Rahman, M.; Al-Ahmadi, H.M.; Ullah, I.; Zahid, M. Intelligent intersection control for delay optimization: Using meta-heuristic search algorithms. Sustainability 2020, 12, 1896. [Google Scholar] [CrossRef]
  17. Coelho, M.C.; Farias, T.L.; Rouphail, N.M. Impact of speed control traffic signals on pollutant emissions. Transp. Res. Part D Transp. Environ. 2005, 10, 323–340. [Google Scholar] [CrossRef]
  18. Lee, J.; Park, B.B.; Malakorn, K.; So, J.J. Sustainability assessments of cooperative vehicle intersection control at an urban corridor. Transp. Res. Part C Emerg. Technol. 2013, 32, 193–206. [Google Scholar] [CrossRef]
  19. Mahmod, M.; Van Arem, B.; Pueboobpaphan, R.; De Lange, R. Reducing local traffic emissions at urban intersection using ITS countermeasures. IET Intell. Transp. Syst. 2013, 7, 78–86. [Google Scholar] [CrossRef]
  20. Abdelghaffar, H.M.; Rakha, H.A. Development and testing of a novel game theoretic de-centralized traffic signal controller. IEEE Trans. Intell. Transp. Syst. 2019, 22, 231–242. [Google Scholar] [CrossRef]
  21. Kim, M.; Kim, H.K. Investigation of environmental benefits of traffic signal countdown timers. Transp. Res. Part D Transp. Environ. 2020, 85, 102464. [Google Scholar] [CrossRef]
  22. Niroumand, R.; Tajalli, M.; Hajibabai, L.; Hajbabaie, A. Joint optimization of vehicle-group trajectory and signal timing: Introducing the white phase for mixed-autonomy traffic stream. Transp. Res. Part C Emerg. Technol. 2020, 116, 102659. [Google Scholar] [CrossRef]
  23. Sun, D.J.; Wu, S.; Shen, S.; Xu, T. Simulation and assessment of traffic pollutant dispersion at an urban signalized intersection using multiple platforms. Atmos. Pollut. Res. 2021, 12, 101087. [Google Scholar] [CrossRef]
  24. Lee, T.; Frey, H.C. Evaluation of representativeness of site-specific fuel-based vehicle emission factors for route average emissions. Environ. Sci. Technol. 2012, 46, 6867–6873. [Google Scholar] [CrossRef] [PubMed]
  25. Robinson, M.K.; Holmén, B.A. Hybrid-electric passenger car energy utilization and emissions: Relationships for real-world driving conditions that account for road grade. Sci. Total Environ. 2020, 738, 139692. [Google Scholar] [CrossRef] [PubMed]
  26. Wyatt, D.W.; Li, H.; Tate, J. Examining the Influence of Road Grade on Vehicle Specific Power (VSP) and Carbon Dioxide (CO2) Emission over a Real-World Driving Cycle; SAE Technical Paper; SAE International: Warrendale, PA, USA, 2013. [Google Scholar]
  27. Barth, M.; Younglove, T.; Scora, G. Development of a Heavy-Duty Diesel Modal Emissions and Fuel Consumption Model; University of California: Berkeley, CA, USA, 2005. [Google Scholar]
  28. Dresner, K.; Stone, P. A multiagent approach to autonomous intersection management. J. Artif. Intell. Res. 2008, 31, 591–656. [Google Scholar] [CrossRef]
  29. Asadi, B.; Vahidi, A. Predictive cruise control: Utilizing upcoming traffic signal information for improving fuel economy and reducing trip time. IEEE Trans. Control Syst. Technol. 2010, 19, 707–714. [Google Scholar] [CrossRef]
  30. Mahler, G.; Vahidi, A. An optimal velocity-planning scheme for vehicle energy efficiency through probabilistic prediction of traffic-signal timing. IEEE Trans. Intell. Transp. Syst. 2014, 15, 2516–2523. [Google Scholar] [CrossRef]
  31. Cui, S.; Gao, K.; Yu, B.; Ma, Z.; Najafi, A. Joint Optimal Vehicle and Recharging Scheduling for Mixed Bus Fleets under Limited Chargers. Transp. Res. Part E Logist. Transp. Rev. 2023, 180, 103335. [Google Scholar] [CrossRef]
  32. Benekohal, R.F.; Zhao, W. Delay-based passenger car equivalents for trucks at signalized intersections. Transp. Res. Part A Policy Pract. 2000, 34, 437–457. [Google Scholar] [CrossRef]
  33. Gao, K.; Yang, Y.; Qu, X. Diverging effects of subjective prospect values of uncertain time and money. Commun. Transp. Res. 2021, 1, 100007. [Google Scholar] [CrossRef]
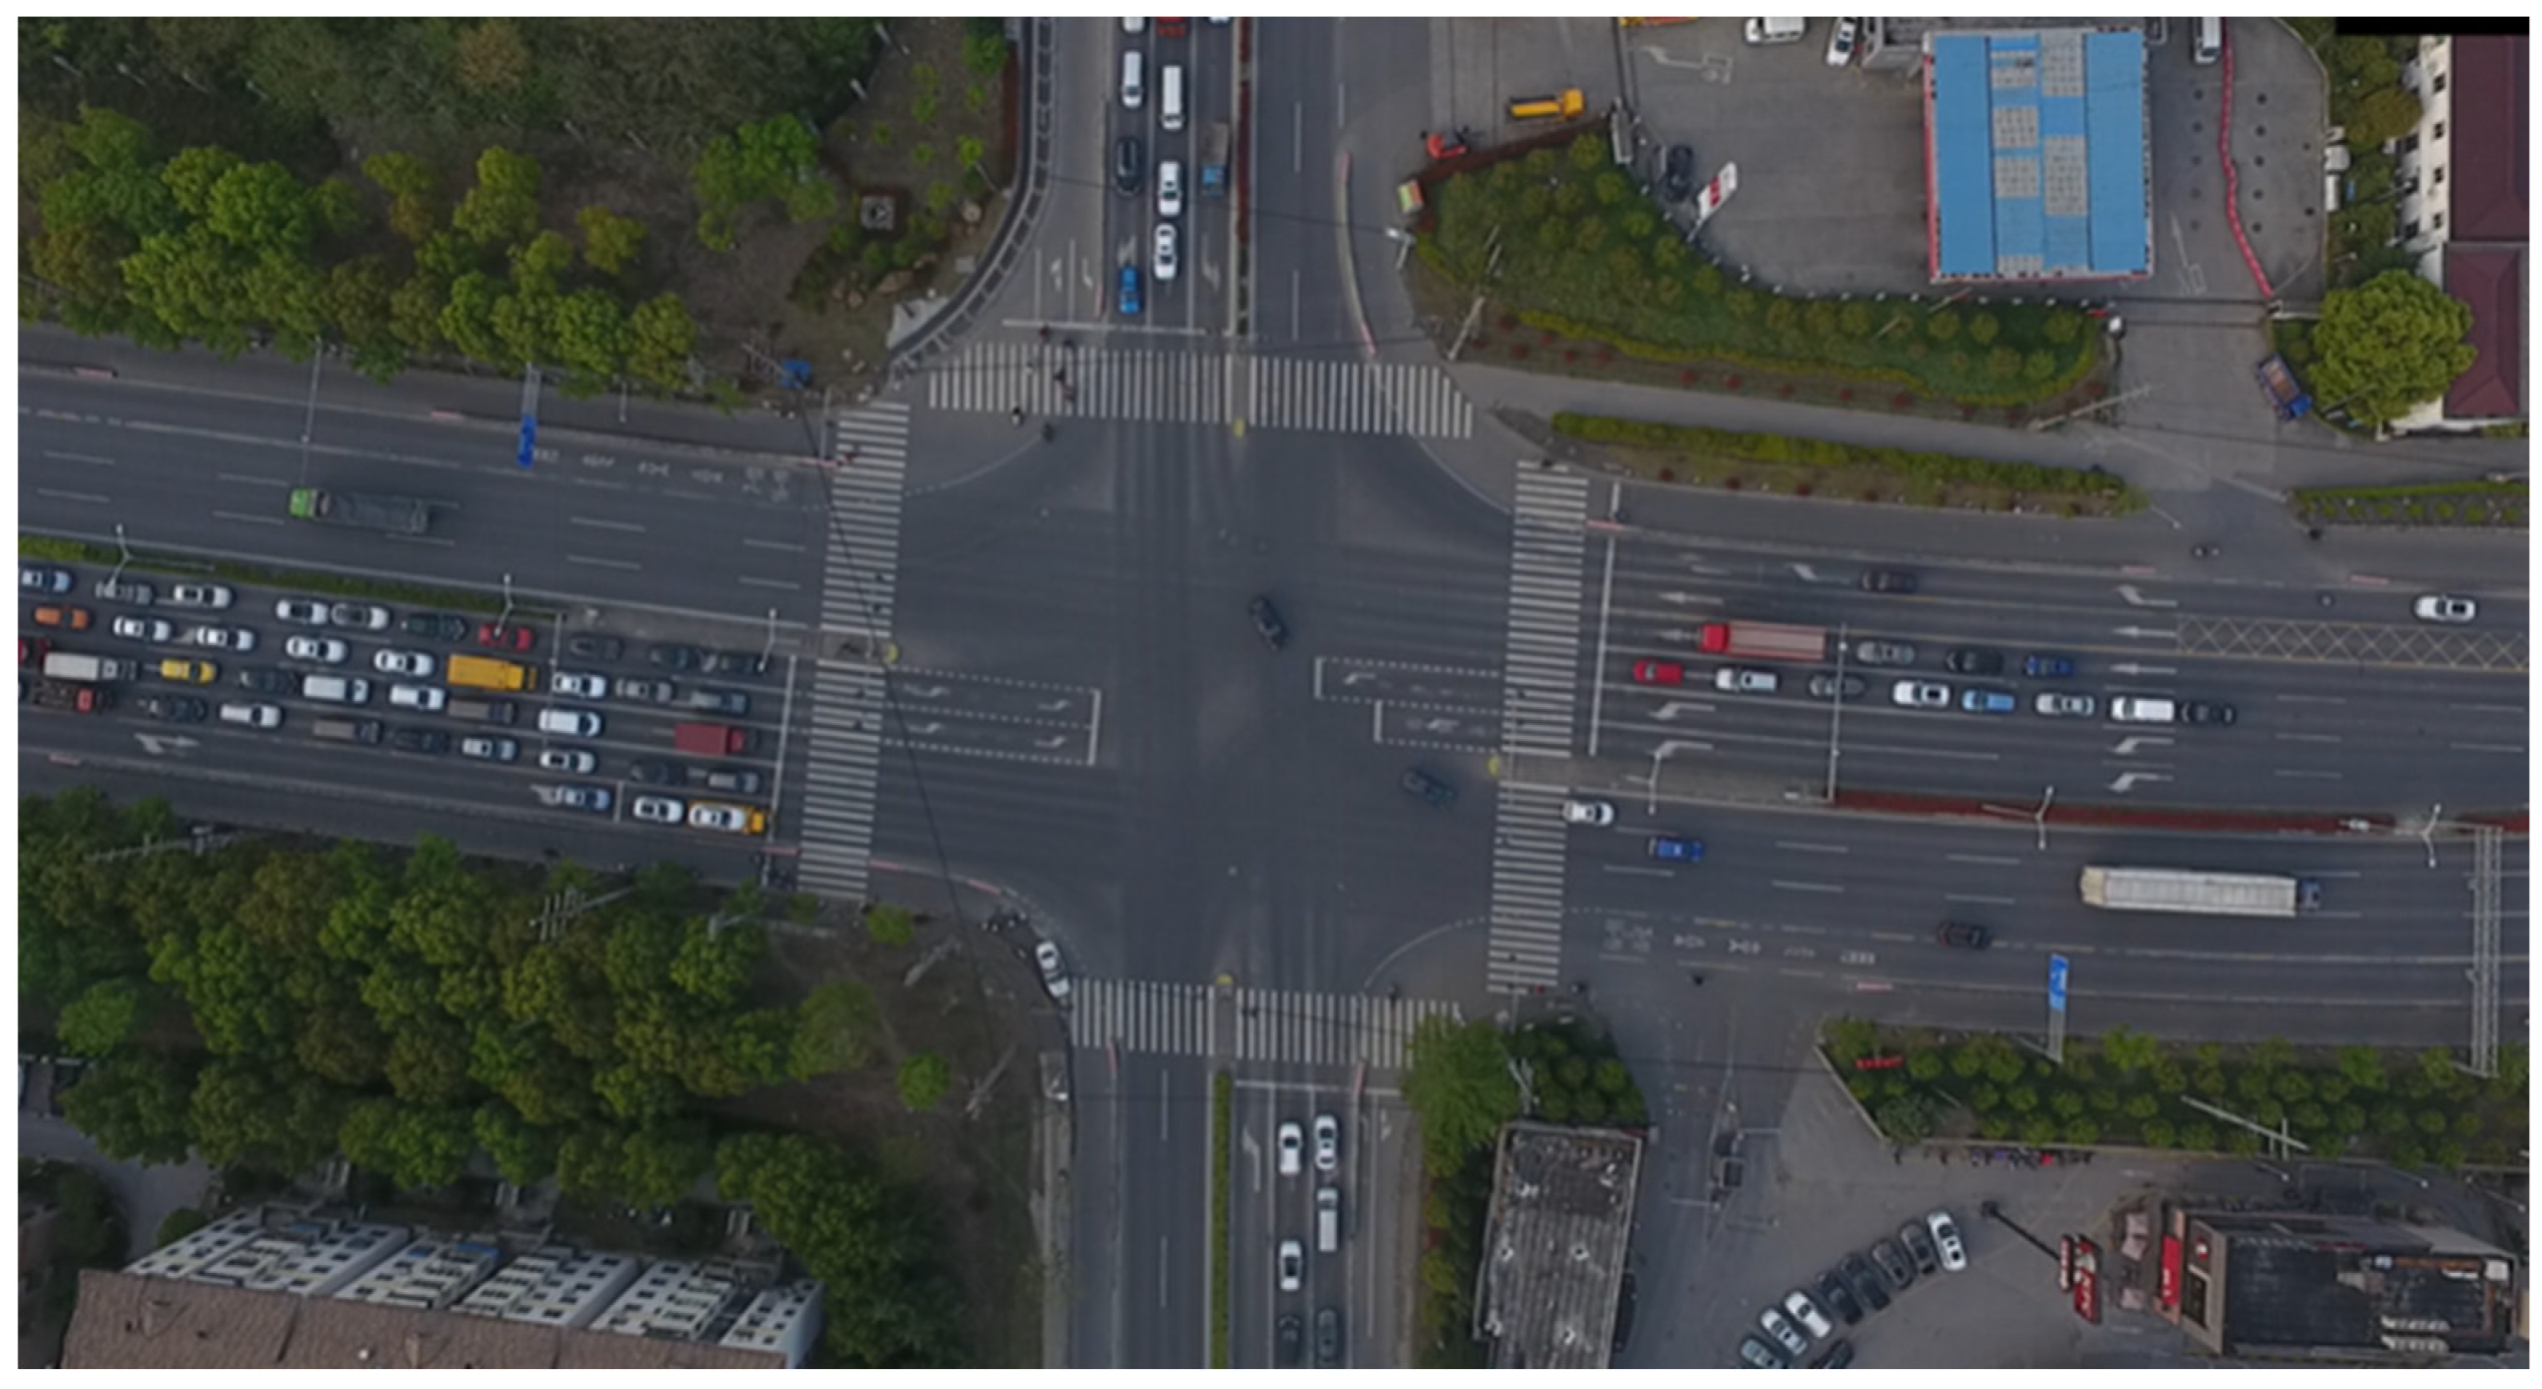
Figure 1. Cao’an Highway—Jiasong North Road Intersection.
Sustainability 15 16118 g001
Figure 2. Relationship between green light times on the import road and vehicle conversions.
Sustainability 15 16118 g002
Figure 3. Green light times for different vehicle conversion factors.
Sustainability 15 16118 g003
Figure 4. Emissions from different models before and after signal control optimization. (a) Changes in CO emissions before and after signal control optimization. (b) Changes in HC emissions before and after signal control optimization. (c) Changes in NOx emissions before and after signal control optimization.
Sustainability 15 16118 g004aSustainability 15 16118 g004b
Table 1. Parameters of the experimental vehicles.
Vehicle ParameterLight-Duty VehicleHeavy-Duty Vehicle
BrandVolkswagenFAW Jie Fang
Total mass (kg)128515,790
Engine displacement (L)1.66.6
Fuel typePetrolDiesel
Table 2. Instantaneous emission data for VSP at 2 kW/t partition.
VSPLight VehicleHeavy Vehicle
Instantaneous Emissions (mg/s)Instantaneous Emissions (mg/s)
COHCNOxCOHCNOx
(−∞, −30)4.270.770.15111.8413.7118.59
[−30, −28)4.450.510.1280.2411.1813.54
[−28, −26)2.540.540.1394.5212.8516.35
[−26, −24)6.840.590.26109.9512.4818.15
[−24, −22)3.550.520.12151.0214.5617.33
[−22, −20)4.060.610.3695.2611.7013.52
[−20, −18)5.000.540.15101.0711.0920.80
[−18, −16)3.420.590.1674.3810.2010.54
[−16, −14)4.920.570.2796.2813.1918.99
[−14, −12)5.200.690.1084.549.9313.82
[−12, −10)5.000.710.1275.7210.8415.86
[−10, −8)5.560.580.1970.2110.3313.37
[−8, −6)4.850.660.1574.9910.6515.16
[−6, −4)5.230.740.1564.7610.2912.77
[−4, −2)3.840.590.0867.649.1911.51
[−2, 0)3.220.560.1088.0411.4616.06
[0, 2)2.900.540.0556.928.349.27
[2, 4)4.380.660.1364.9710.0413.81
[4, 6)5.570.680.1888.8010.5015.94
[6, 8)7.370.830.1692.6210.0212.56
[8, 10)7.290.760.3282.3410.4115.77
[10, 12)7.480.710.2392.5211.1014.55
[12, 14)7.950.810.2887.2311.6715.61
[14, 16)8.470.810.19101.7312.1718.08
[16, 18)7.181.070.2295.2913.0818.34
[18, 20)7.200.830.28126.6512.7316.63
[20, 22)9.440.870.2798.4511.6517.95
[22, 24)8.870.960.2781.5012.2518.01
[24, 26)9.010.970.2584.4812.0318.29
[26, 28)9.000.910.27101.1712.2818.01
[28, 30)10.881.400.44109.6712.2319.53
[30, +∞)6.771.510.27110.0613.6223.34
Table 3. Intersection saturation flow ratios.
Light-Duty
Vehicle
(LDV)
Heavy-Duty
Vehicle
(HDV)
Saturated Traffic FlowSaturated Flow Rate Ratioyi
West importLeft4152117100.130.32
Right59716020.04
Straight73713715120.19
East importLeft3133116200.110.24
Right2316114400.20
Straight5637215840.13
North importLeft2534515120.200.51
Right and Straight75711215660.31
South importLeft2075813860.230.49
Right and Straight52712214760.26
Note: yi is the percentage of heavy-duty vehicles in traffic flow.
Table 4. Signal timing with different vehicle conversion factors.
Conversion Factor of EmissionsImportLeft-Turn Signal Timing (S)Through Signal Timing (S)
HDV:LDV = 2:1East–West2942
South–North4569
HDV:LDV = 5:1East–West2348
South–North5559
HDV:LDV = 10:1East–West1948
South–North5861
HDV:LDV = 15:1East–West1647
South–North6062
HDV:LDV = 20:1East–West1547
South–North6162
HDV:LDV = 25:1East–West1447
South–North6262
HDV:LDV = 30:1East–West1347
South–North6263
Disclaimer/Publisher’s Note: The statements, opinions and data contained in all publications are solely those of the individual author(s) and contributor(s) and not of MDPI and/or the editor(s). MDPI and/or the editor(s) disclaim responsibility for any injury to people or property resulting from any ideas, methods, instructions or products referred to in the content.