Article

Mechanical and Thermal Properties of Sustainable Low-Heat High-Performance Concrete

Structural Engineering Department, Faculty of Engineering, Mansoura University, Mansoura 35516, Egypt
*
Author to whom correspondence should be addressed.
Sustainability 2023, 15(23), 16139; https://doi.org/10.3390/su152316139
Submission received: 16 September 2023 / Revised: 6 November 2023 / Accepted: 17 November 2023 / Published: 21 November 2023
(This article belongs to the Section Sustainable Engineering and Science)

Abstract

:
One of the main drawbacks of utilizing mass concrete is the high amount of heat produced during the hydration of cementitious materials. Low-heat high-performance concrete (LHHPC) is a special type of concrete with low Portland cement content and low heat of hydration. The main aim of this research is to experimentally explore the potential use of blast furnace cement (CEM III) and fly ash (FA) in LHHPC. CEM III is a type of cement with low heat of hydration. FA was used at various dosages, namely 10%, 20%, 30%, and 40%, as a partial replacement of CEM III for producing more sustainable LHHPC. The mechanical and micro-structural characteristics of the LHHPC mixes were investigated. In addition, the concrete thermal conductivity and heat of hydration were predicted and compared using ANSYS finite element software. The experimental results showed that 40% FA as a CEM III partial replacement decreased the heat of hydration in LHHPC by 38.7%. In addition, the produced LHHPC showed low thermal conductivity, which indicates a decrease in early-age cracks. The produced LHHPC showed a constant compressive strength of 90 days compared with the corresponding 28-day compressive strength. The experimental results were supported by scanning electron microscope (SEM) analysis and the numerical analysis for the LHHPC. The 3D finite element model provided accurate predictions for temperature distribution. The results of this research indicated that FA and CEM III can successfully produce LHHPC with adequate strength and low heat of hydration.

1. Introduction

High-performance concrete (HPC) is a special form of concrete that has many desirable properties such as strength, flexibility, density, permeability, and resistance to chemical attack [1,2,3]. Due to its high degree of heterogeneity and porous weak transition zone, ordinary concrete has a relatively low strength and elastic modulus [4].
Mass concrete is a relatively large volume of concrete that needs specific precautions to deal with due to the high production of heat from the cement hydration and the consequent volume change [5]. To control the possible cracking of mass concrete, and to maintain its durability, the heat of cement hydration should be minimized [6]. The high heat of hydration could delay the development of ettringite, which could lead to the early deterioration of mass concrete [7,8]. The heat of mass concrete can be controlled using a range of techniques at various costs such as pre- and post-cooling, and the use of low-heat materials [9,10]. Each strategy has its benefits depending on the available resources. In order to improve the performance and longevity of mass concrete, Atomic Energy of Canada Limited (AECL) patented a low-heat high-performance concrete (LHHPC) mix design in July 1996. The design was based on replacing composite cement (CEM V) with 50% silica fume, and the highest temperature reached was 37 °C [11,12]. LHHPC can be produced with pozzolanic material and non-pozzolanic flour filler. It has specific performance, great granular integration, and reduced porosity [13].
The factors affecting concrete thermal characteristics are the surrounding environment, the temperature at which the concrete is placed, the structure’s thickness, and the type of cement used [14,15]. Blast furnace cement (CEM III) differs from Portland cement (CEM I) in which it has a larger concentration of C2S and a lower concentration of C3S [16]. Theoretically, CEM III takes around 1350 kJ of energy to produce 1 kg of C2S, while it takes about 1810 kJ to produce 1 kg of C3S [17,18]. The high proportion of SO3 in CEM III helps in lowering the produced hydration heat because SO3 is less soluble in a the solution of lime and gypsum [19,20].
Using supplementary cementitious materials (SCMs) in concrete increases its mechanical characteristics, and decreases its bleeding and segregation of the fresh state [21,22,23]. It also results in improved durability and low hydration heat [24]. Fly ash (FA), silica fume (SF), and slag are common examples of SCMs utilized in concrete. They have several economical, technological, and environmental benefits such as the protection of environmental resources and the lowering of greenhouse gas emissions [25]. FA is characterized by its small surface area and pozzolanic activity [26,27]. The pozzolanic reaction of FA begins at a slow rate at normal temperatures which causes the hydration heat to take several weeks to progress to a substantial degree [28,29]. The addition of SF produces a large amount of calcium silicate hydrate (CSH), which increases the concrete’s strength at an early age [30]. With the presence of SF, the rate of heat development accelerates until it reaches its primary peak with the creation of hydroclimate and more ettringite [31,32]. The slag has a commonly visible latent hydraulic activity [33]. Standards allow for a very high level of cement replacement by slag due to its strong reactivity (compared to other SCMs), high calcium content, and similar specific surface area (after grinding) to Portland cement [34]. The allowable replacement levels in CEM III may exceed 95% [35]. The commonly available CEM III in the concrete market is the blended one with 50% cement and 50% slag.
Using FA to partially replace CEM III in producing LHHPC is of great interest due to its sustainability, cost-effectiveness, durability, safeness, and suitability for mass concrete. The majority of published studies focused on developing compressive strength; however, the heat of hydration has yet to be thoroughly determined. Mixes of ultra-high-performance concrete (UHPC) were produced using CEM III and different ratios of FA [31], and compared with the corresponding CEM I. It was concluded that mixes made with CEM I remained better in compressive strength than the CEM III mixes by 11.4% [31]. H. Yildirim et al. [36] used three types of cement, namely blast furnace cement CEM III, sulphate resistant cement SRC, and ordinary Portland cement (CEM I) mixed with FA. The mechanical properties were determined, and the results showed a higher resistance of concrete made with CEM I than the concrete made with the other two types of cement. When raising the replacement percentage of CEM III with FA, the workability of UHPC was improved. The best reported cement replacement percentage by FA was 20% [36]. In addition, the maximum improvement in the mechanical properties was detected for replacement CEM III with 20% FA and 15% SF [36]. The improvements compared to control mixes were 9.6%, 10.1%, 10.2%, and 6.6% for indirect tensile strength, flexural strength, bond strength, and elastic modulus, respectively [36].
As per the above literature, it is essential to explore the thermal characteristics of LHHPC with various FA contents as a partial CEM III replacement. The main aim of this research is to experimentally explore the potential use of blast furnace cement (CEM III) and fly ash in LHHPC. FA was used at various dosages: 10%, 20%, 30%, and 40% as a partial replacement of CEM III. The mechanical and micro-structural characteristics of the mixes were investigated. This study also investigated the concrete’s heat of hydration, thermal conductivity, and specific heat capacity. In addition, the 3D finite element model was used to simulate the thermal performance of the proposed LHHPC to provide accurate predictions for temperature distribution. The results of this research can introduce the ideal FA content that can ensure durable and sustainable LHHPC for mass concrete production.

2. Experimental Program
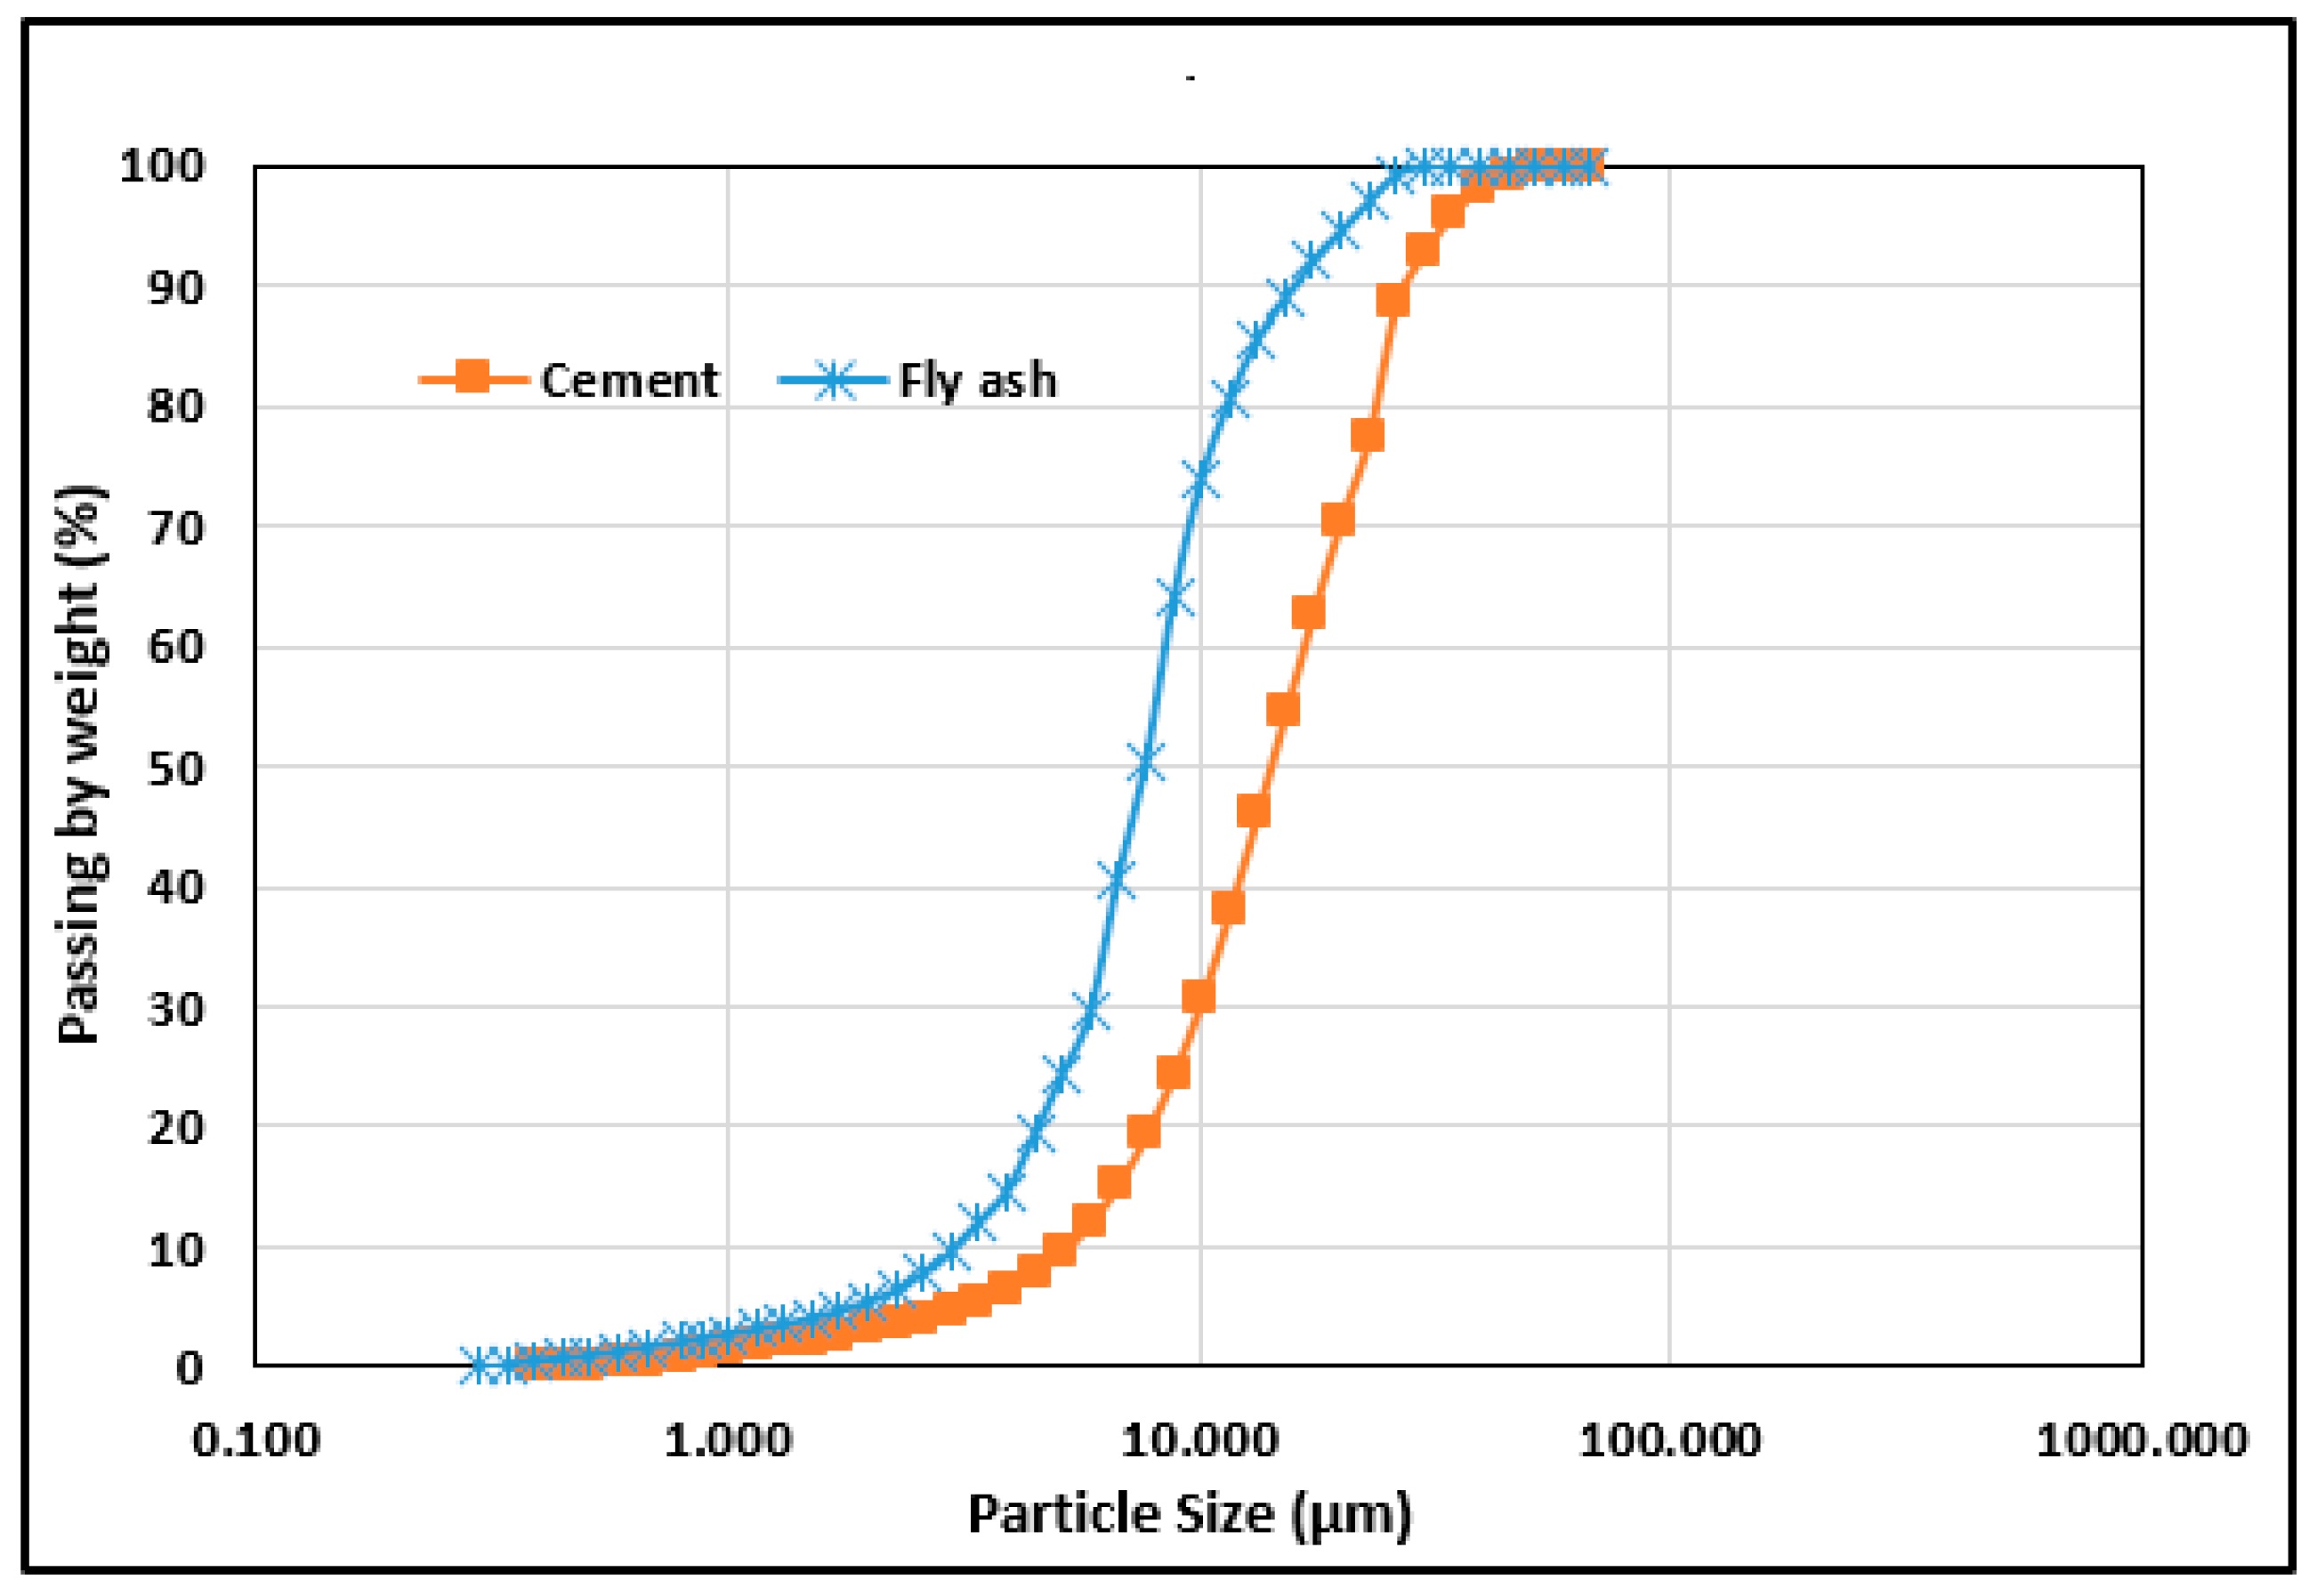
2.1. Materials

Blast furnace cement (CEM III) contained 50% blast furnace slag according to BS EN 197-1/2011 [37,38], and was used as the main binder in this research. The cement and slag had specific gravities of 3.15 and 2.6, respectively, with an overall blain surface area of 331 m2/kg. FA (Type F) was used to partially replace CEM III in this study with 0%, 10%, 20% 30%, and 40% by weight. The FA had a specific gravity of 2.55, and a blain surface area of 612 m2/kg. The mean particle size of the cement and the FA were 11 µm and 7 µm, respectively. Laser granulometry (LA-950) was used to measure the particle size distribution (PSD) for binder materials and is plotted in Figure 1. The compositions of cementitious materials showed that SiO2 and CaO proportions were 63.77% and 3.2%, respectively, for FA and 20.6% and 65.14%, respectively, for CEMIII, as shown in Table 1. Quartz powder, with granule sizes ranging from 75 to 50 µm, was used as filler material in the designed concrete mixes. The specific gravity and blain surface area of the quartz powder were 2.65 and 305 m2/kg, respectively. River sand type 0/4 that was free of organic compounds and undesirable clay was used as the fine aggregates in the concrete mixes. The sand had a specific gravity of 2.65 and a bulk density of 1760 kg/m3. Dolomite stone with a maximum size of 10 mm was used as the course aggregate in this study. The specific gravity of the dolomite used was 2.85 and the bulk density was 1570 kg/m3. A high-range water reducer (superplasticizer—SP) with a specific gravity of 1.11 was used to control the concrete’s workability.

2.2. Mix Proportions

Table 2 exhibits the proportions of all mixes in this study. The total binder content was 450 kg/m3. FA was used as a partial replacement of CEM III of 0%, 10%, 20%, 30%, and 40% by weight. Quartz powder of 225 kg/m3, sand of 540 kg/m3, dolomite of 1080 kg/m3, water of 165 kg/m3, and SP of 9 kg/m3 were kept constant in all concrete mixes. The water/binder ratio was 0.36 and the SP dosage was 2% of the binder weight. The fine aggregate:coarse aggregate ratio was taken as 1:2.

2.3. Casting and Curing of Concrete Specimens

Five different types of specimens were cast to measure the mechanical and thermal properties of each LHHPC mix. Three standard cube specimens (100 × 100 × 100 mm) per measure per day were cast for measuring the concrete’s compressive strength at 7, 28, 56, and 90 days. Three concrete cylinders (150 × 300 mm) per measure per day were cast for measuring the tensile strength at 28 and 90 days. Three concrete beams (100 × 100 × 500 mm) per measure per day were cast for measuring the flexural strength at 28 and 90 days. Three concrete cubes (300 × 300 × 300 mm) were cast for measuring the cement hydration heat. Three concrete cubes (50 × 50 × 50 mm) were cast for measuring both concrete thermal conductivity and specific heat. The specimens were demolded after 24 h and cured in tap water until the test day.

2.4. Methodology

To measure the compressive strength of each mixture, 100 mm cubic specimens were used following ASTM C109/109 M [39]. Compressive strength tests were conducted at 7, 28, 56, and 90 days in order to monitor the strength development. Tensile tests were carried out using Ø150/300 mm cylindrical specimens according to ASTM C496-15 [40]. The average splitting tensile strength of three cylinder specimens was recorded. Thin wooden strips were placed along the contact lines between the cylinder surface and the machine jaws to provide uniformity in loading. Flexure test was performed using a beam of 100 × 100 × 500 mm loaded in center point according to ASTM C78-16 [41]. The point load was located 250 mm from supports with a shear span to depth ratio of 1.0.
Concrete cube specimens (300 × 300 × 300 mm) were prepared from each LHHPC mix to measure the development of cement hydration heat with time. The heat development was measured using a thermocouple that was embedded at the concrete cube center, and the temperature was recorded for 7 days, starting directly after completing concrete mixing and casting. The concrete cube specimens were not molded until the test was completed. Each mold was externally isolated with 30 mm thick thermal foam sheets to lessen the amount of heat escaping from the concrete and to eliminate the effect of the surrounding weather temperature, as shown in Figure 2. This was completed to model the hydration heat increase caused by a semi-adiabatic contraction in mass concrete construction.
Isomet 2104 simulation (Applied Precision, Ltd., Rača, Slovakia) [42] was used to measure the thermal conductivity and specific heat capacity of concrete. The measuring technique was based on investigating the transitory heat transport. Concrete cube specimens with 50 mm sides were utilized for the testing. These specimens were dried at 105 °C until reaching a constant weight. An electrical heater was used to produce heat flow and was placed in direct contact with the test specimens, as shown in Figure 3. Thermocouples were placed on the specimen heating surface, as well as the opposite surface to measure the temperature change between the two surfaces during the test. The whole test setup was isolated by foam sheets to eliminate the effect of the surrounding weather temperature on the test results. The test was run until reaching a steady state flow and the difference in the surface temperatures was recorded. The concrete thermal conductivity and specific heat capacity were calculated using Equations (1) and (2), respectively:
λ 0 = Q d A T
C b 0 = Q m T
where λ 0 is the thermal conductivity (W/mK), C b 0 is the specific heat capacity (J/m3·K), Q is the amount of heat transferred (W), d is distance between the two concrete surfaces (concrete thickness) (m), A is the concrete surface area (m2), ΔT is the temperature difference between the two concrete surfaces (K), and m is the specimen mass (kg).
Scanning electronic microscope (SEM) and energy dispersive X-ray (EDX) analyses were carried out on samples taken from control and FA-40 mixes. After conducting the compressive strength test for each mix, samples from the cross-section cores of the cubic specimens were coated with gold spray for 30 s in a vacuum chamber. The samples were then scanned with a JEOL JSM 6510 lv microscope (Electron Microscopy Unit, Mansoura University, Mansoura, Egypt). at an acceleration voltage of 30 kV to describe and study the surface structure of the selected concrete mixes. The EDX analysis was carried out using an Oxford X-Max 20 device (Mansoura University, Mansoura, Egypt) to determine the atomic percentage of each element in the selected concrete mixes.
Finite element modelling (FEM) was carried out for the LHHPC using ANSYS (Mechanical 2019 R3 Ansys 19.2) software to simulate the thermal performance of tested concrete mixes for mass concrete production. This numerical model aimed to provide accurate predictions of the temperature distribution of LHHPC structures in the early stages of concrete hardening. The predicted thermal performance was compared with the test results reported from the hydration heat test on concrete cubes 300 × 300 × 300 mm.
The concrete core of the test cube was designed using 8 nodes, with six degrees of freedom at each node. Single point volume integration was performed using Gaussian quadrature. Hourglass control with an hourglass parameter of 0.03, as recommended by ANSYS support, was provided to avoid zero power modes. The foam plates were designed using shell elements consisting of 4 nodes with six degrees of freedom at each node. The element was thick and alone. Figure 4 shows the geometry of a 300 × 300 × 300 mm specimen with mesh applied uniformly to all nodes of the cube. The model was divided into sections with a height of 1.5 mm to achieve accurate results. The model block is an isometric cube resulting in 8000 elements and 23,520 nodes to form the planned block model.
The thermal_concrete model was used to simulate the LHHPC material. This model has the ability to automatically generate the required model parameters depending on the thermal conductivity and specific heat capacity of the concrete that were measured in the experimental testing. The surface of the mold was coated with thermal foam to protect it from external influences that can affect the temperature, as they can affect how the target mass develops thermally. An atmosphere with a temperature of 24 degrees was assumed on the surface of the concrete. Cubes made of different concrete mixes listed in Table 2 were analyzed. Due to symmetry, only a quarter of the cube was modelled.

3. Results and Discussion

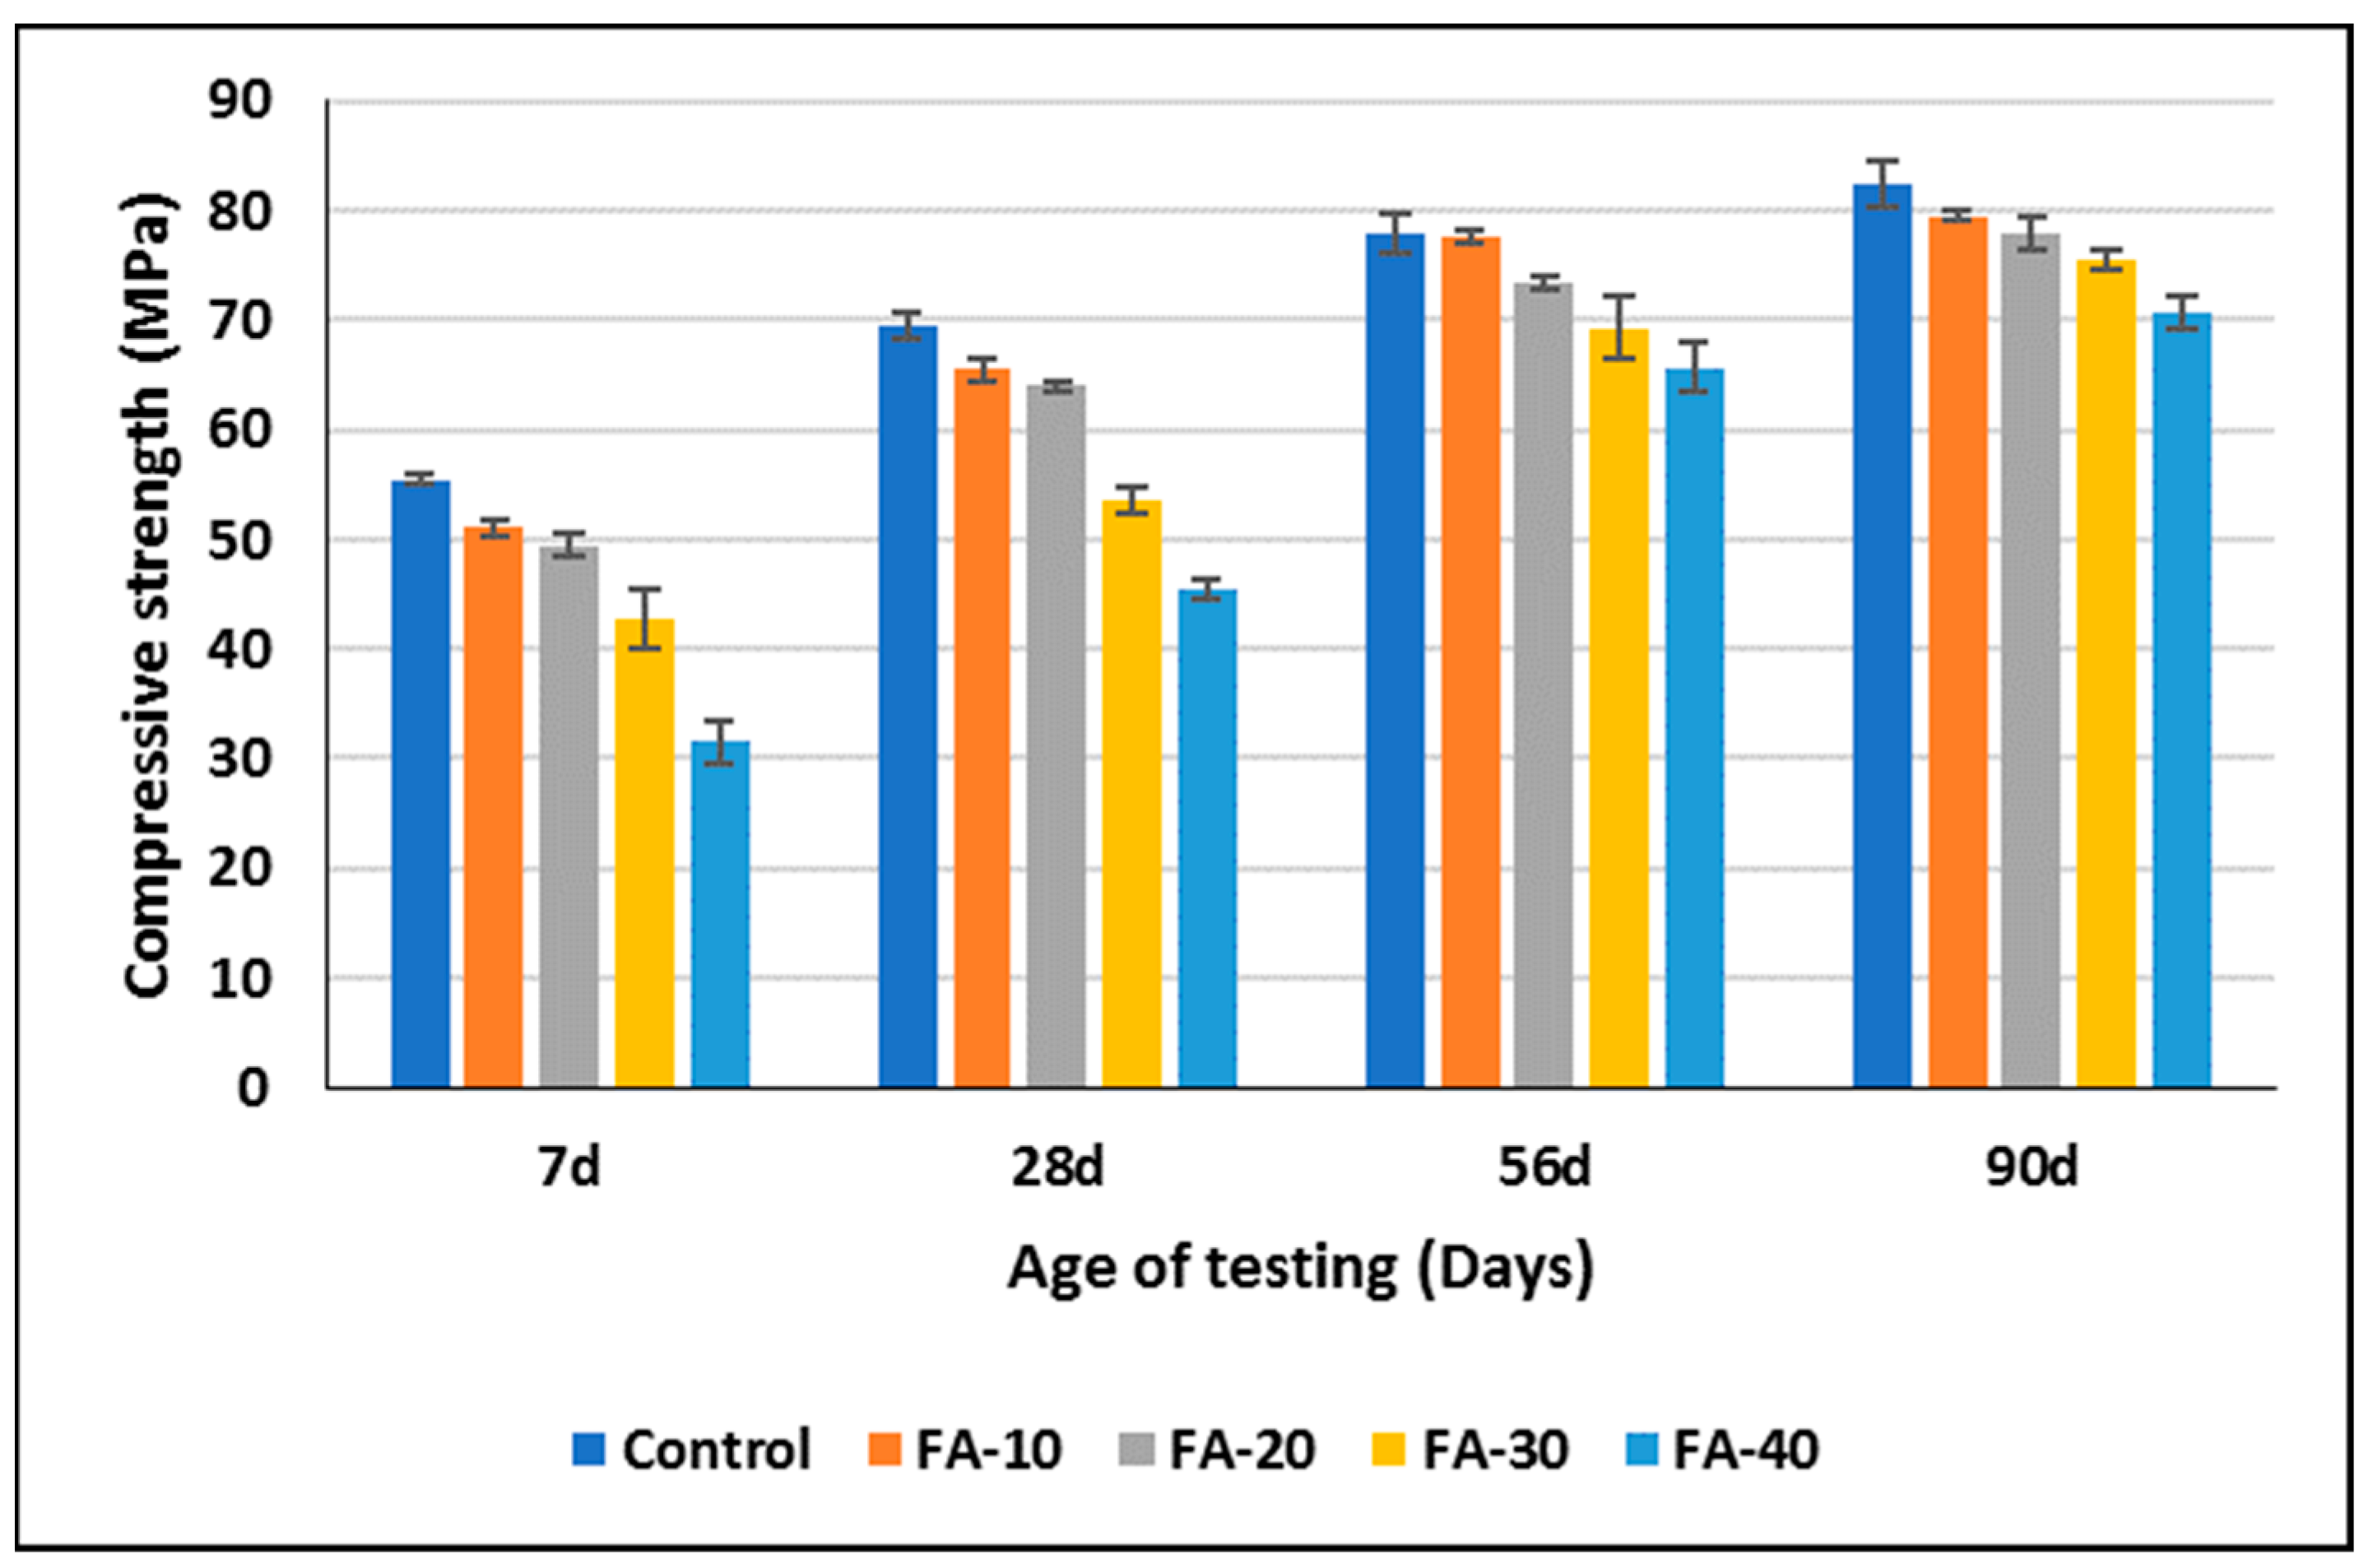
3.1. Compressive Strength

Figure 5 shows the measured compressive strength of the LHHPC mixes at different ages. As shown, it is evident that increasing the FA content in the LHHPC decreased its compressive strength. Compared with the control mix, using 10%, 20%, 30%, and 40% FA decreased the LHHPC compressive strength by 7.8%, 10.8%, 23.0%, and 43.2%, respectively, at 7 days, 5.8%, 7.9%, 22.9%, and 34.5%, respectively, at 28 days, 0.5%, 5.8%, 11.1%, and 15.7%, respectively, at 56 days, and 3.6%, 5.5%, 8.5%, and 14.3%, respectively, at 90 days. The decrease in strength of LHHPC with increasing FA content is due to the replacement of cement in large quantities with FA, which caused a slow reaction and enhanced the ability of concrete to bind materials together, creating a durable structure in the long term. The early concrete strength gain (within the first 3–7 days) generally decreased as more fly ash was added to the concrete. Fly ash affected the concrete’s early strength due to the free lime that was still reacting during the curing process. As the concrete was further cured, the ultimate desired strength was attained at 90 days [43]. With the development of the concrete’s age, the LHHPC compressive strength losses with the FA content increase significantly decreased. For example, using 40% FA decreased the compressive strength by 43.2% at 7 days compared with a 14.3% strength decrease at 90 days. Considering the 28-day compressive strength as the characteristic strength of LHHPC, the development of the compressive strength before 28 days was different from that after 28 days. For the control mix, the strength increased by 25.2% from 7 days to 28 days, and by 12.2% and 18.7% at 56 days and 90 days, respectively, compared with the corresponding 28-day strength. For the LHHPC mixes incorporating FA (FA-10 to FA-40), the strength increased by an average of 30.7% from 7 days to 28 days, and by averages of 25.2% and 32.9% at 56 days and 90 days, respectively, compared with the corresponding 28-day strength. This indicates the ability of FA to increase strength after 90 days due to a slow rate of hydration reaction at early ages.

3.2. Tensile Strength

Figure 6 shows the measured splitting tensile strength of the LHHPC mixes at 28 and 90 days. Due to the good correlation between the concrete tensile strength and compressive strength and due to the same reasons, increasing the FA content in the LHHPC linearly decreased the measured splitting tensile strength. Compared with the control mix, using 10%, 20%, 30%, and 40% FA decreased the LHHPC tensile strength by 7.5%, 17.9%, 25.1%, and 33.5%, respectively, at 28 days, and 4.6%, 17.3%, 22.8%, and 28.9%, respectively, at 90 days. The splitting tensile strength of the proposed mixes ranged from 4.74 to 3.15 MPa at an age of 28 days, and from 5.7 to 4.1 MPa at an age of 90 days. The tensile strengths of the control, FA-10, FA-20, FA-30, and FA-40 were 13.6%,13.9%, 15.4%, 14.1%, and 13.4% of the corresponding compressive strength at 28 days; they were 13.3%, 13.4%, 15.4%, 15.9%, and 16.2% of the corresponding compressive strength at 90 days. This indicated that, over time, the tensile strength increased due to an increased rate of hydration reaction and the formation of a more durable concrete.

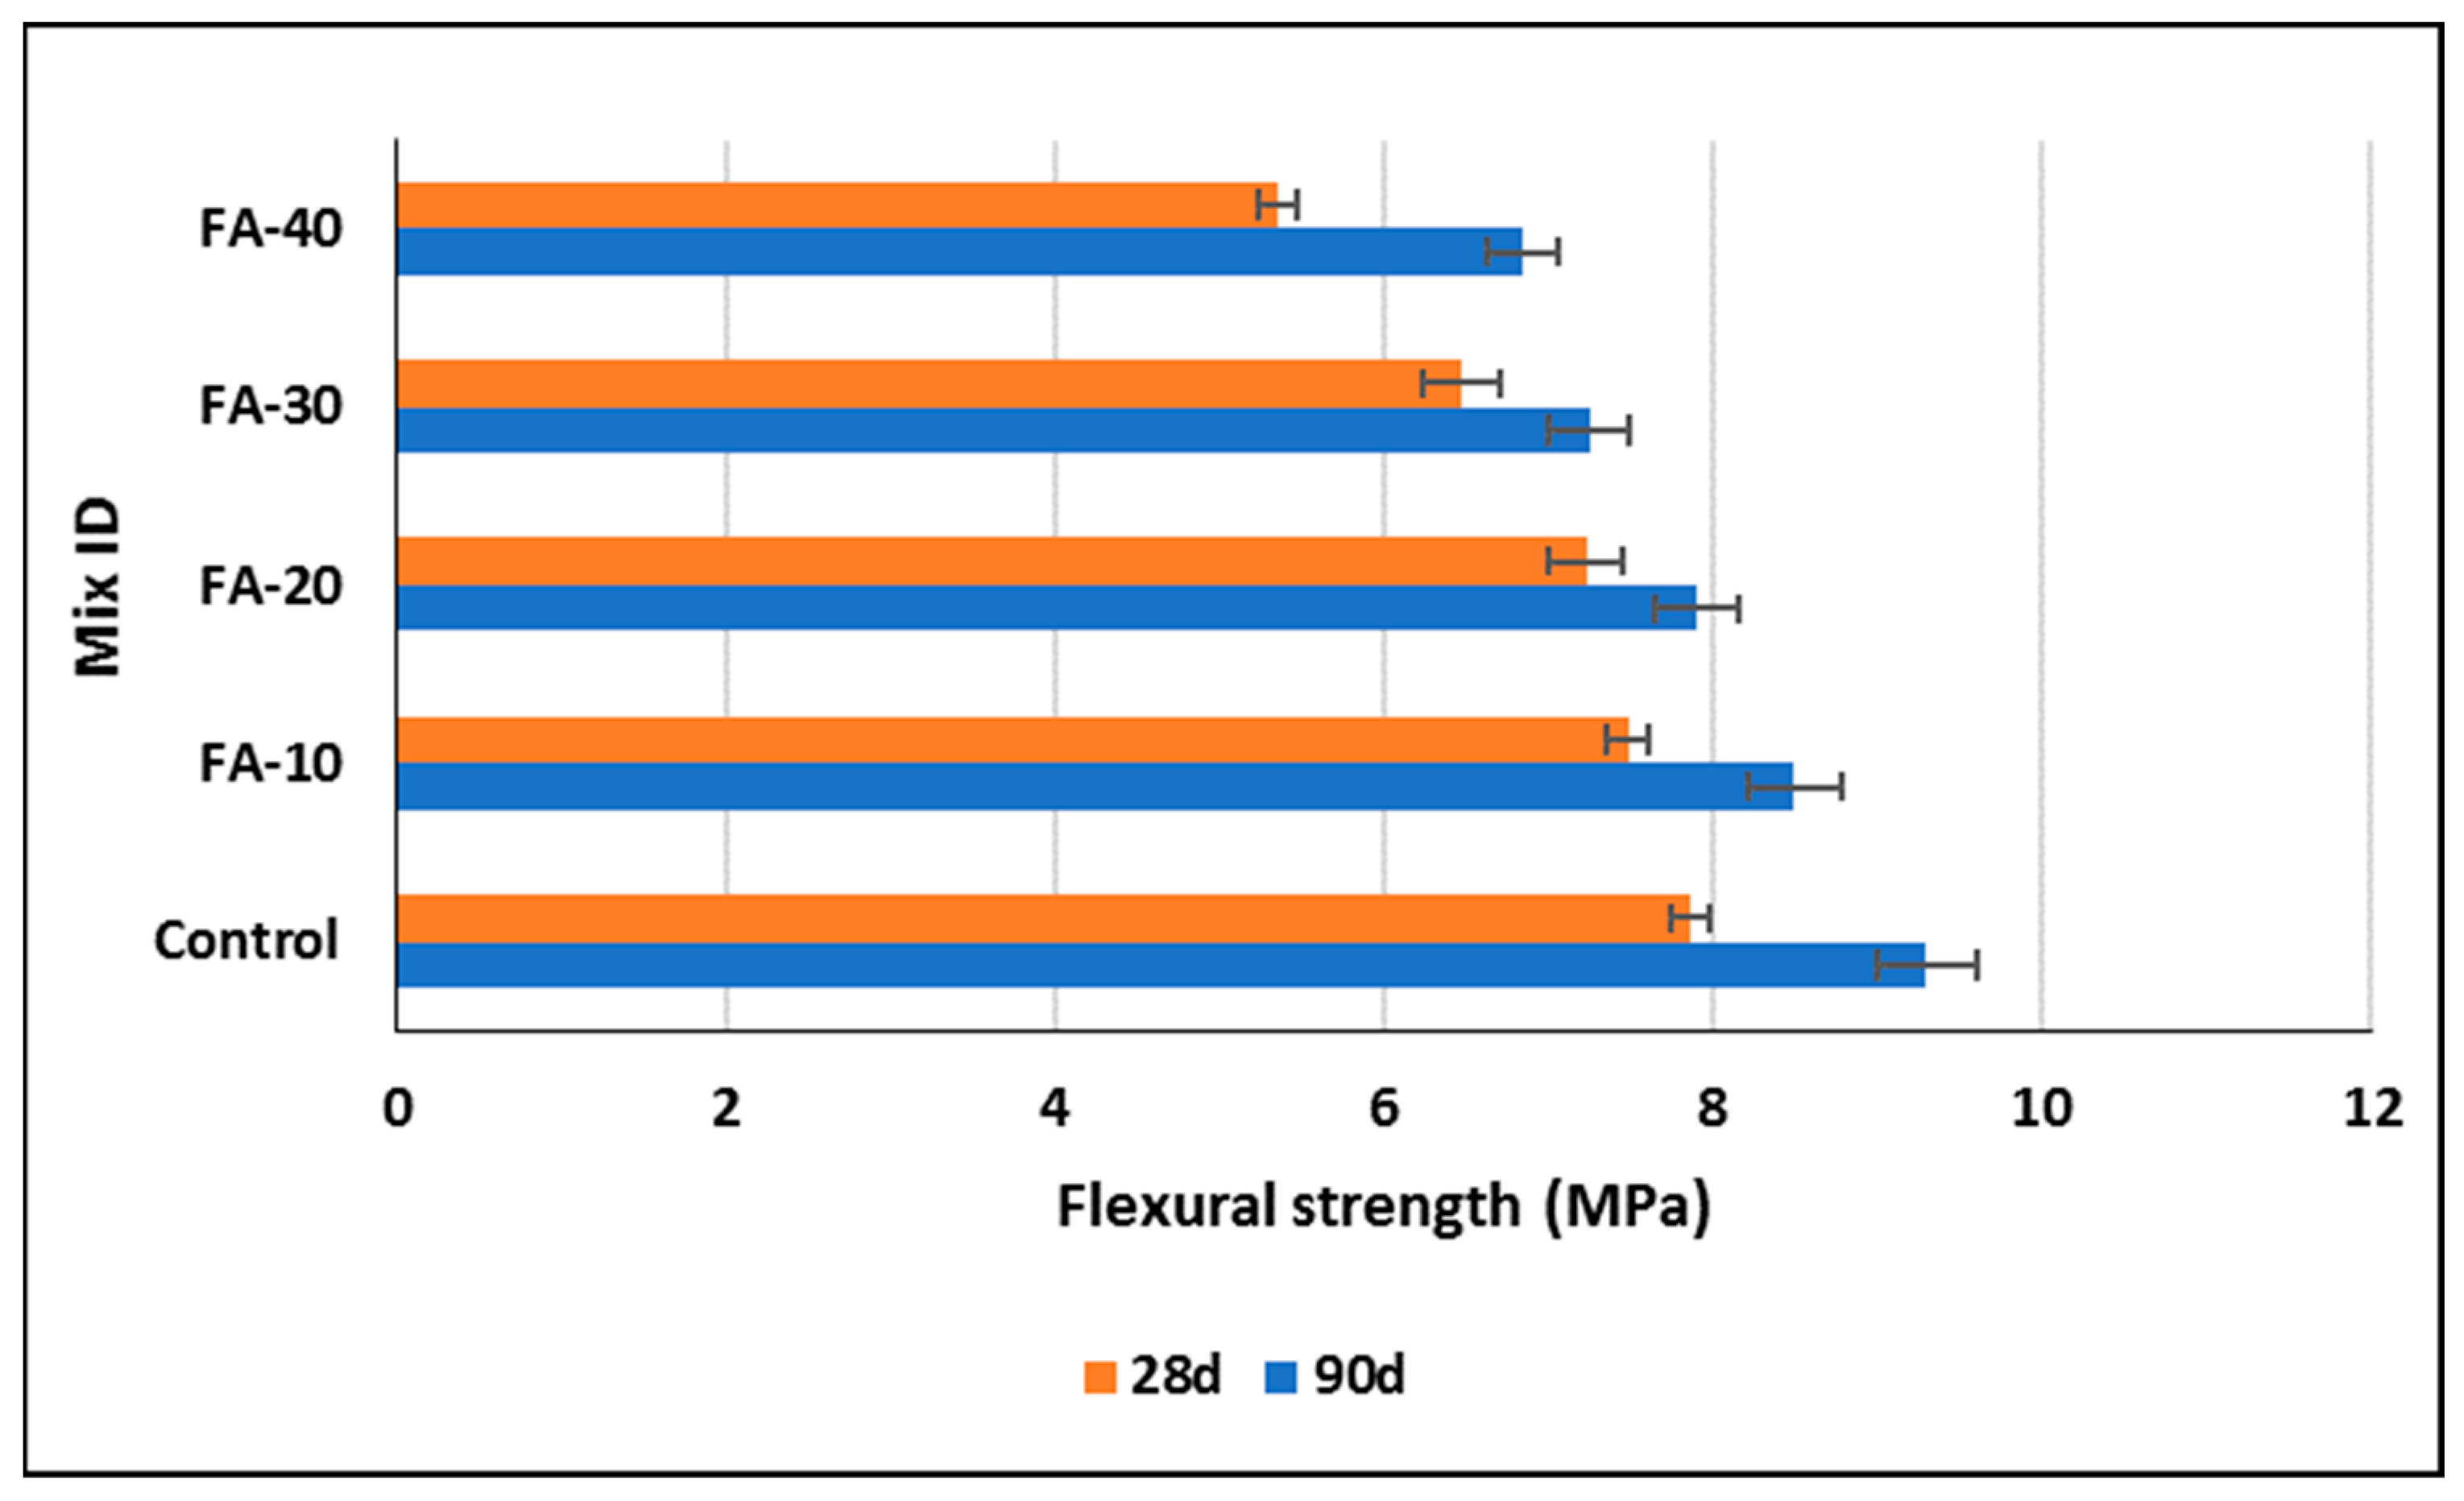
3.3. Flexural Strength
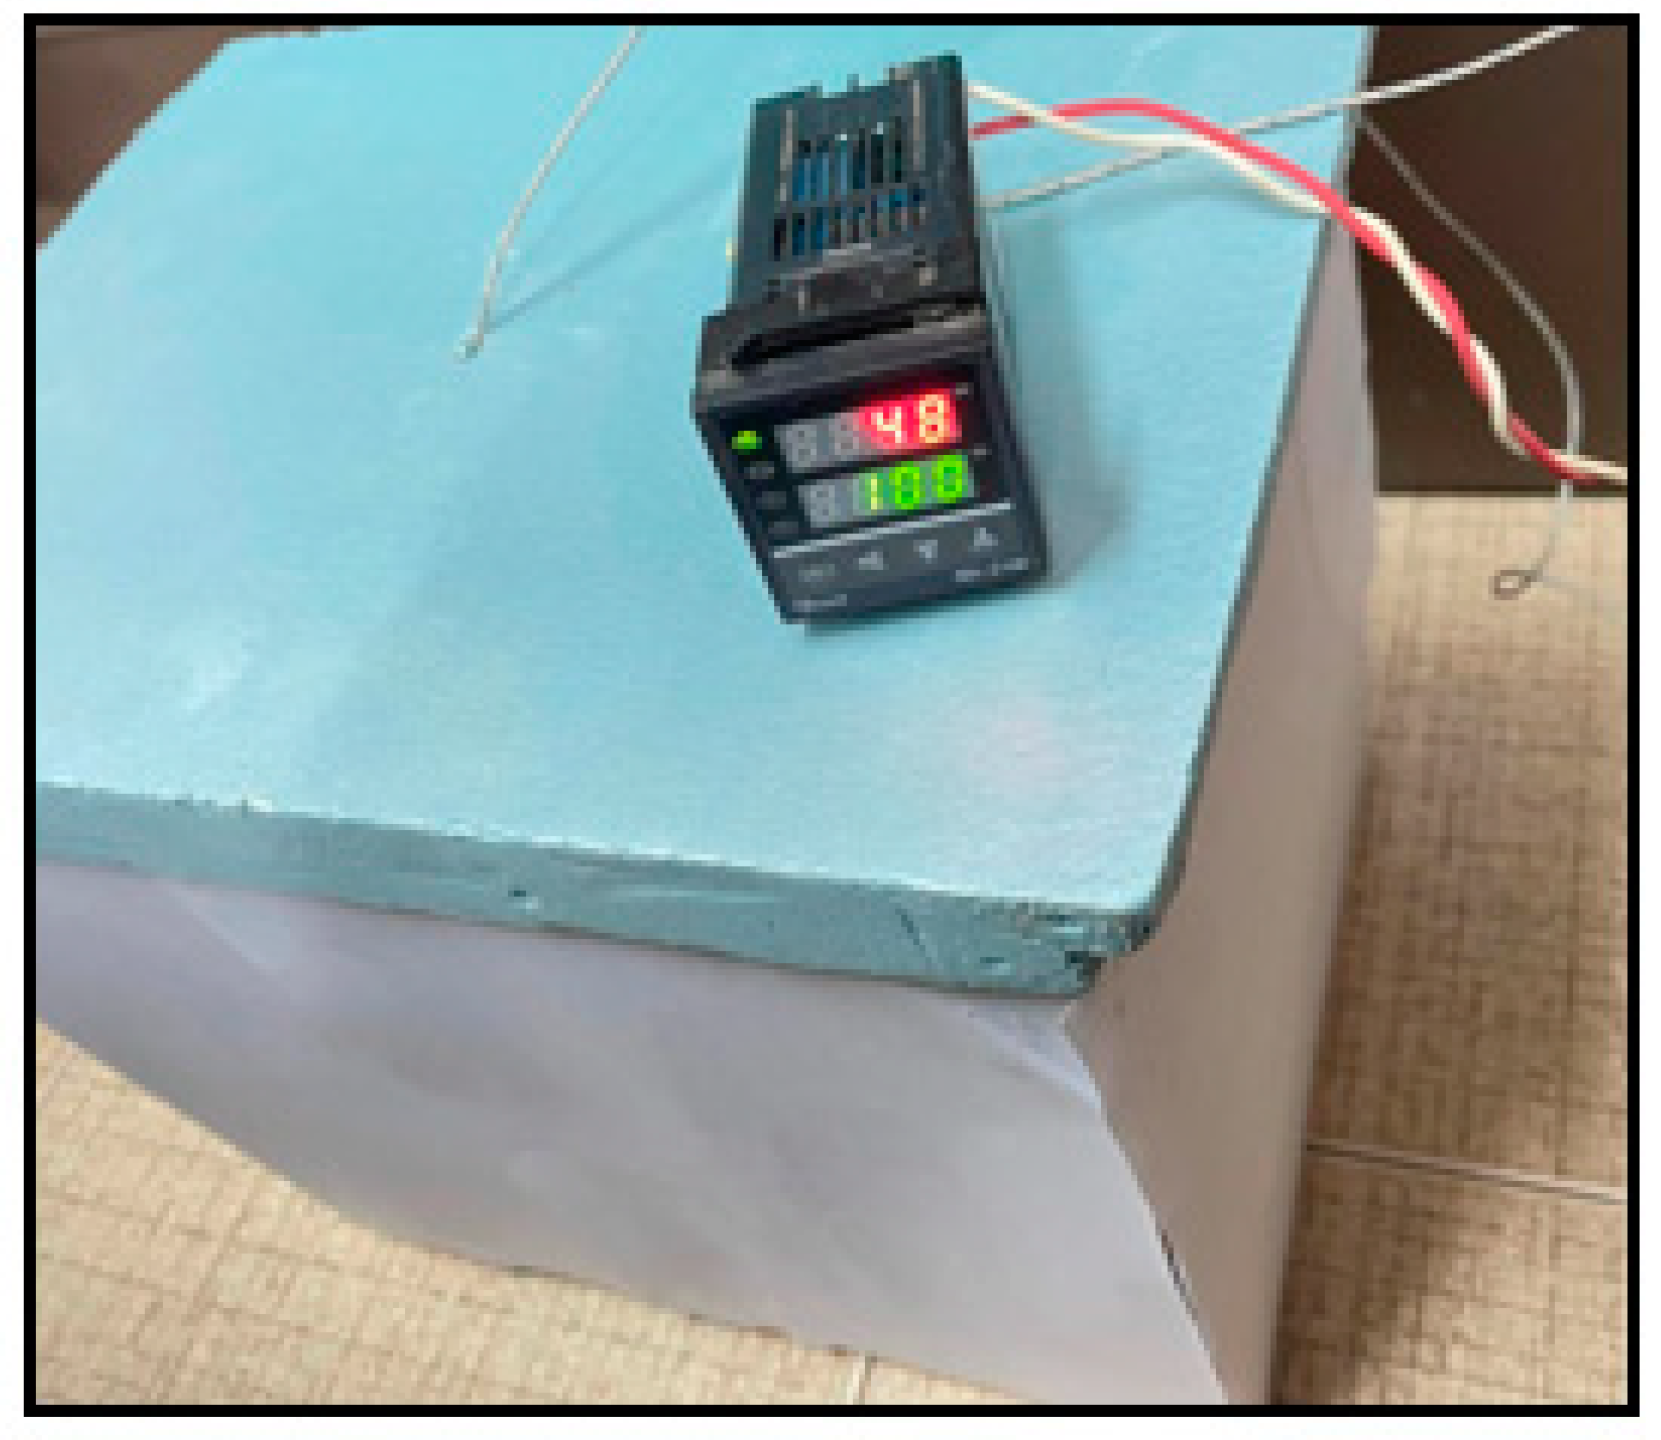
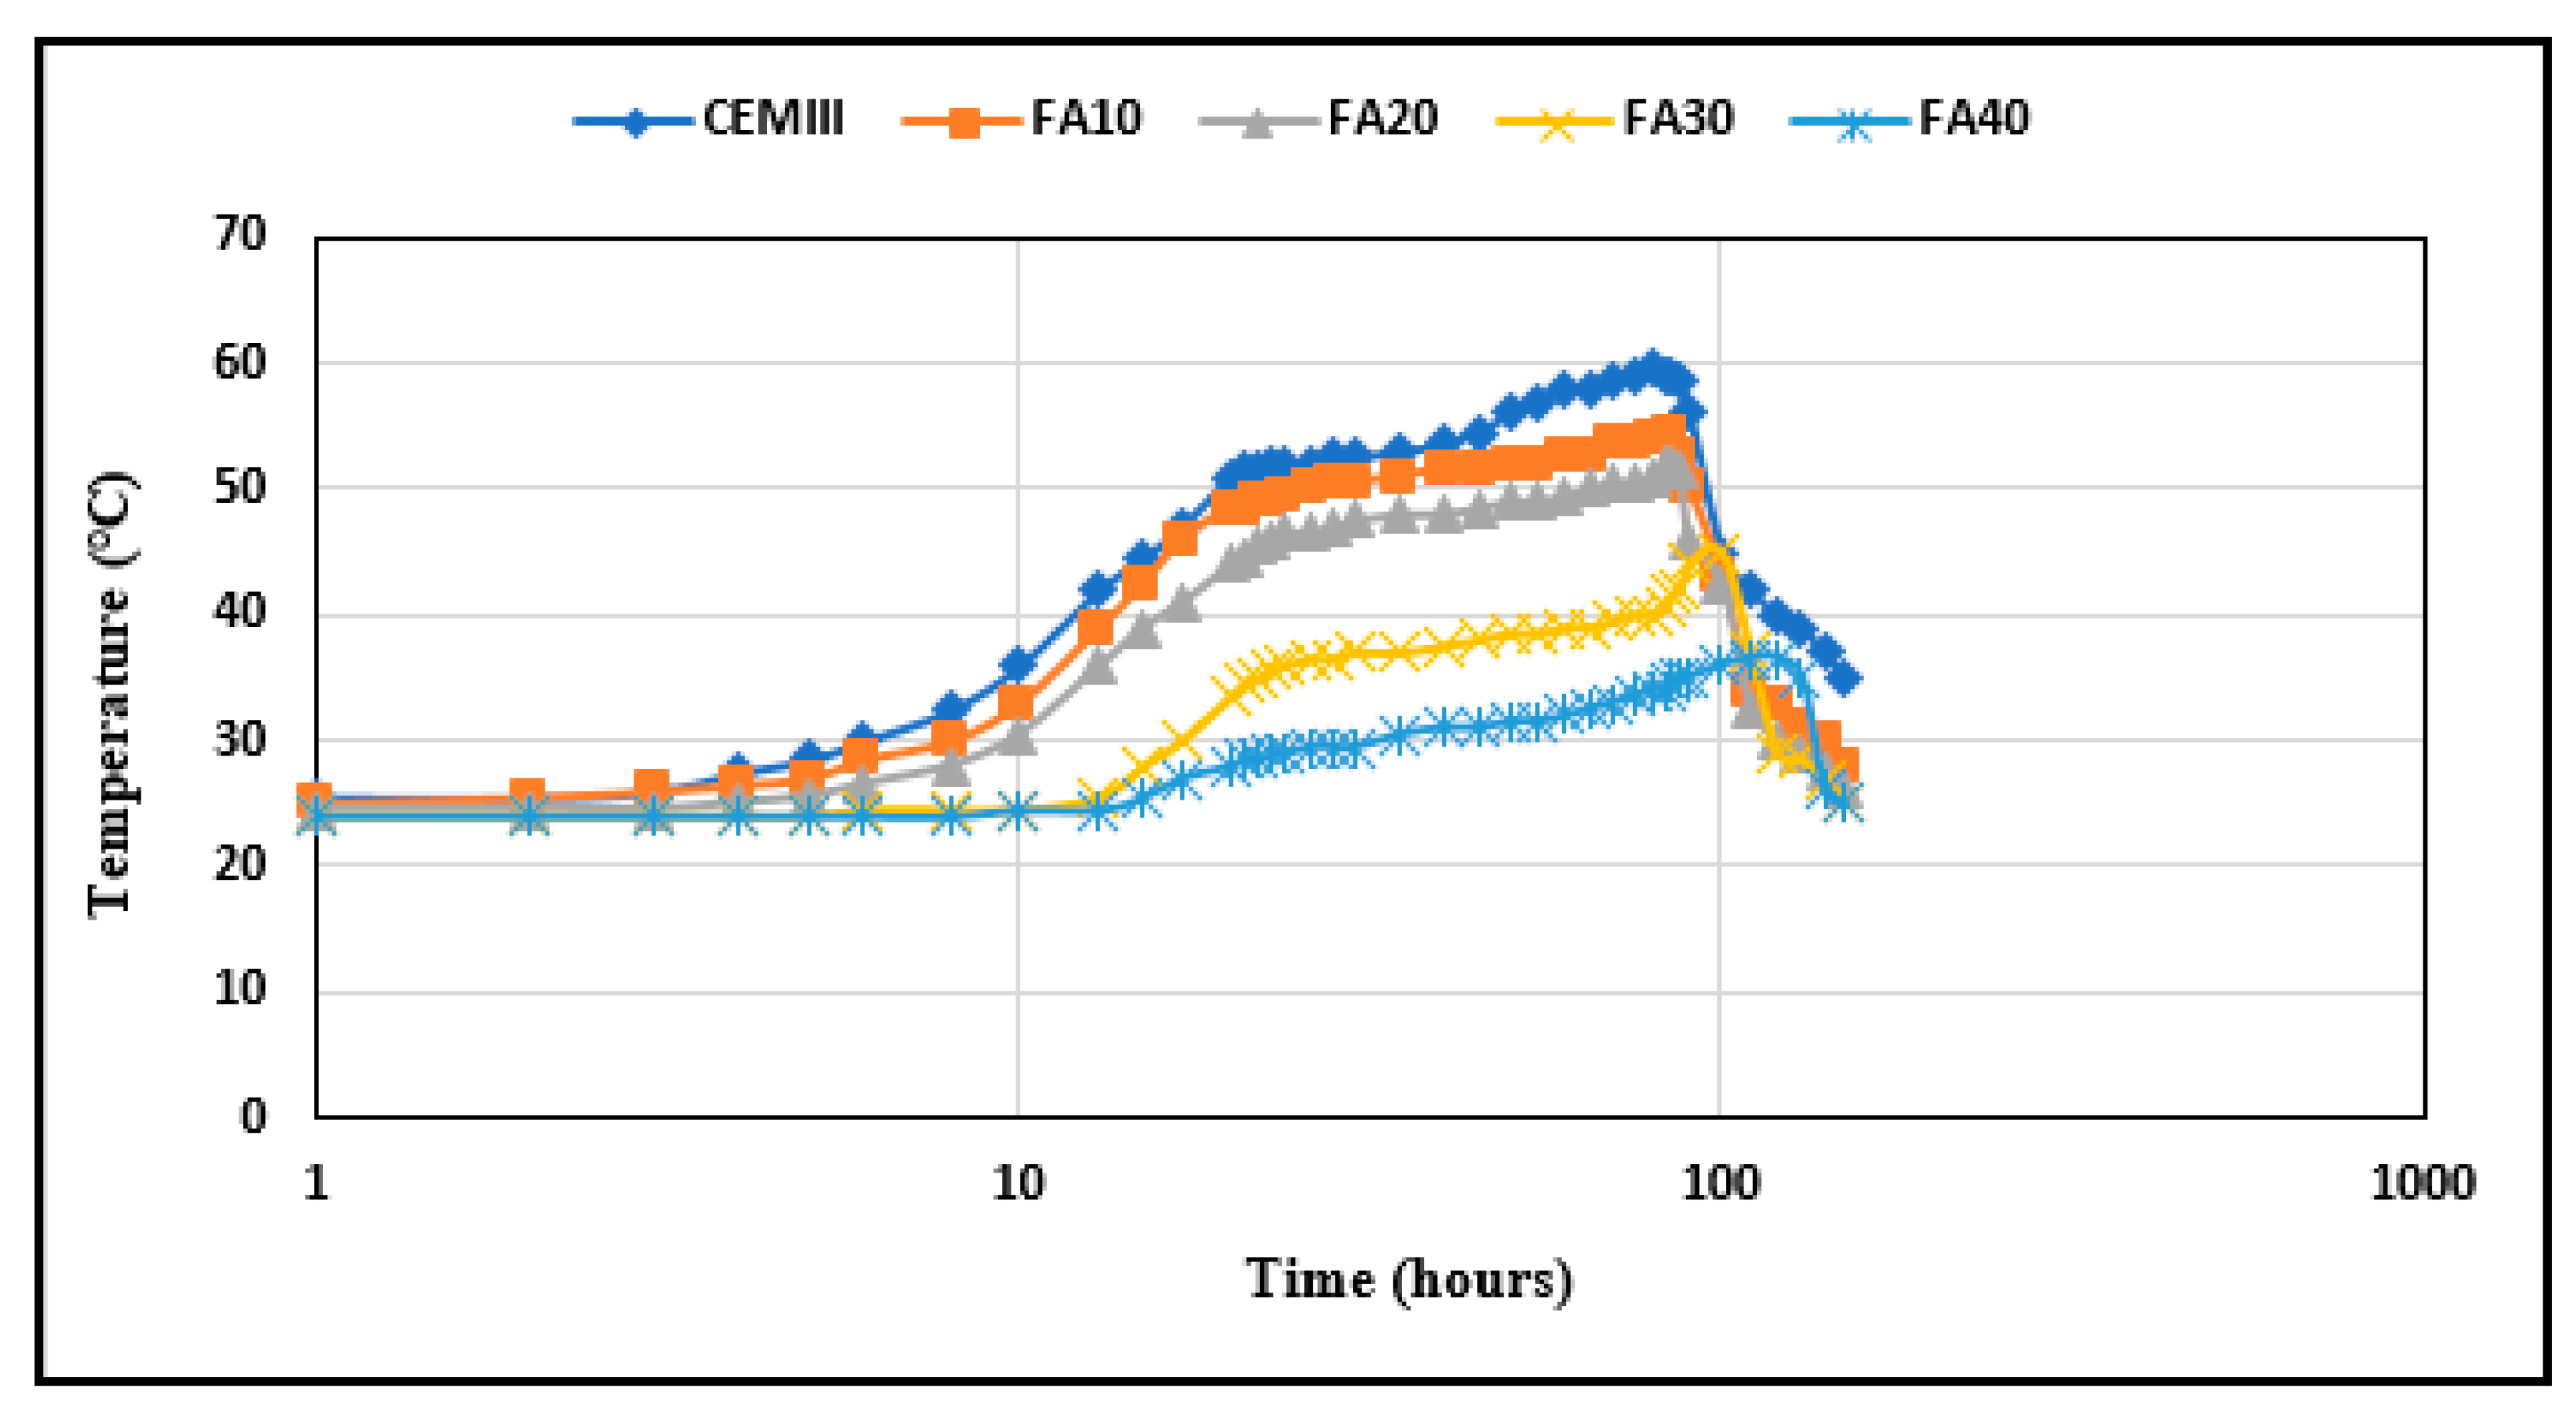
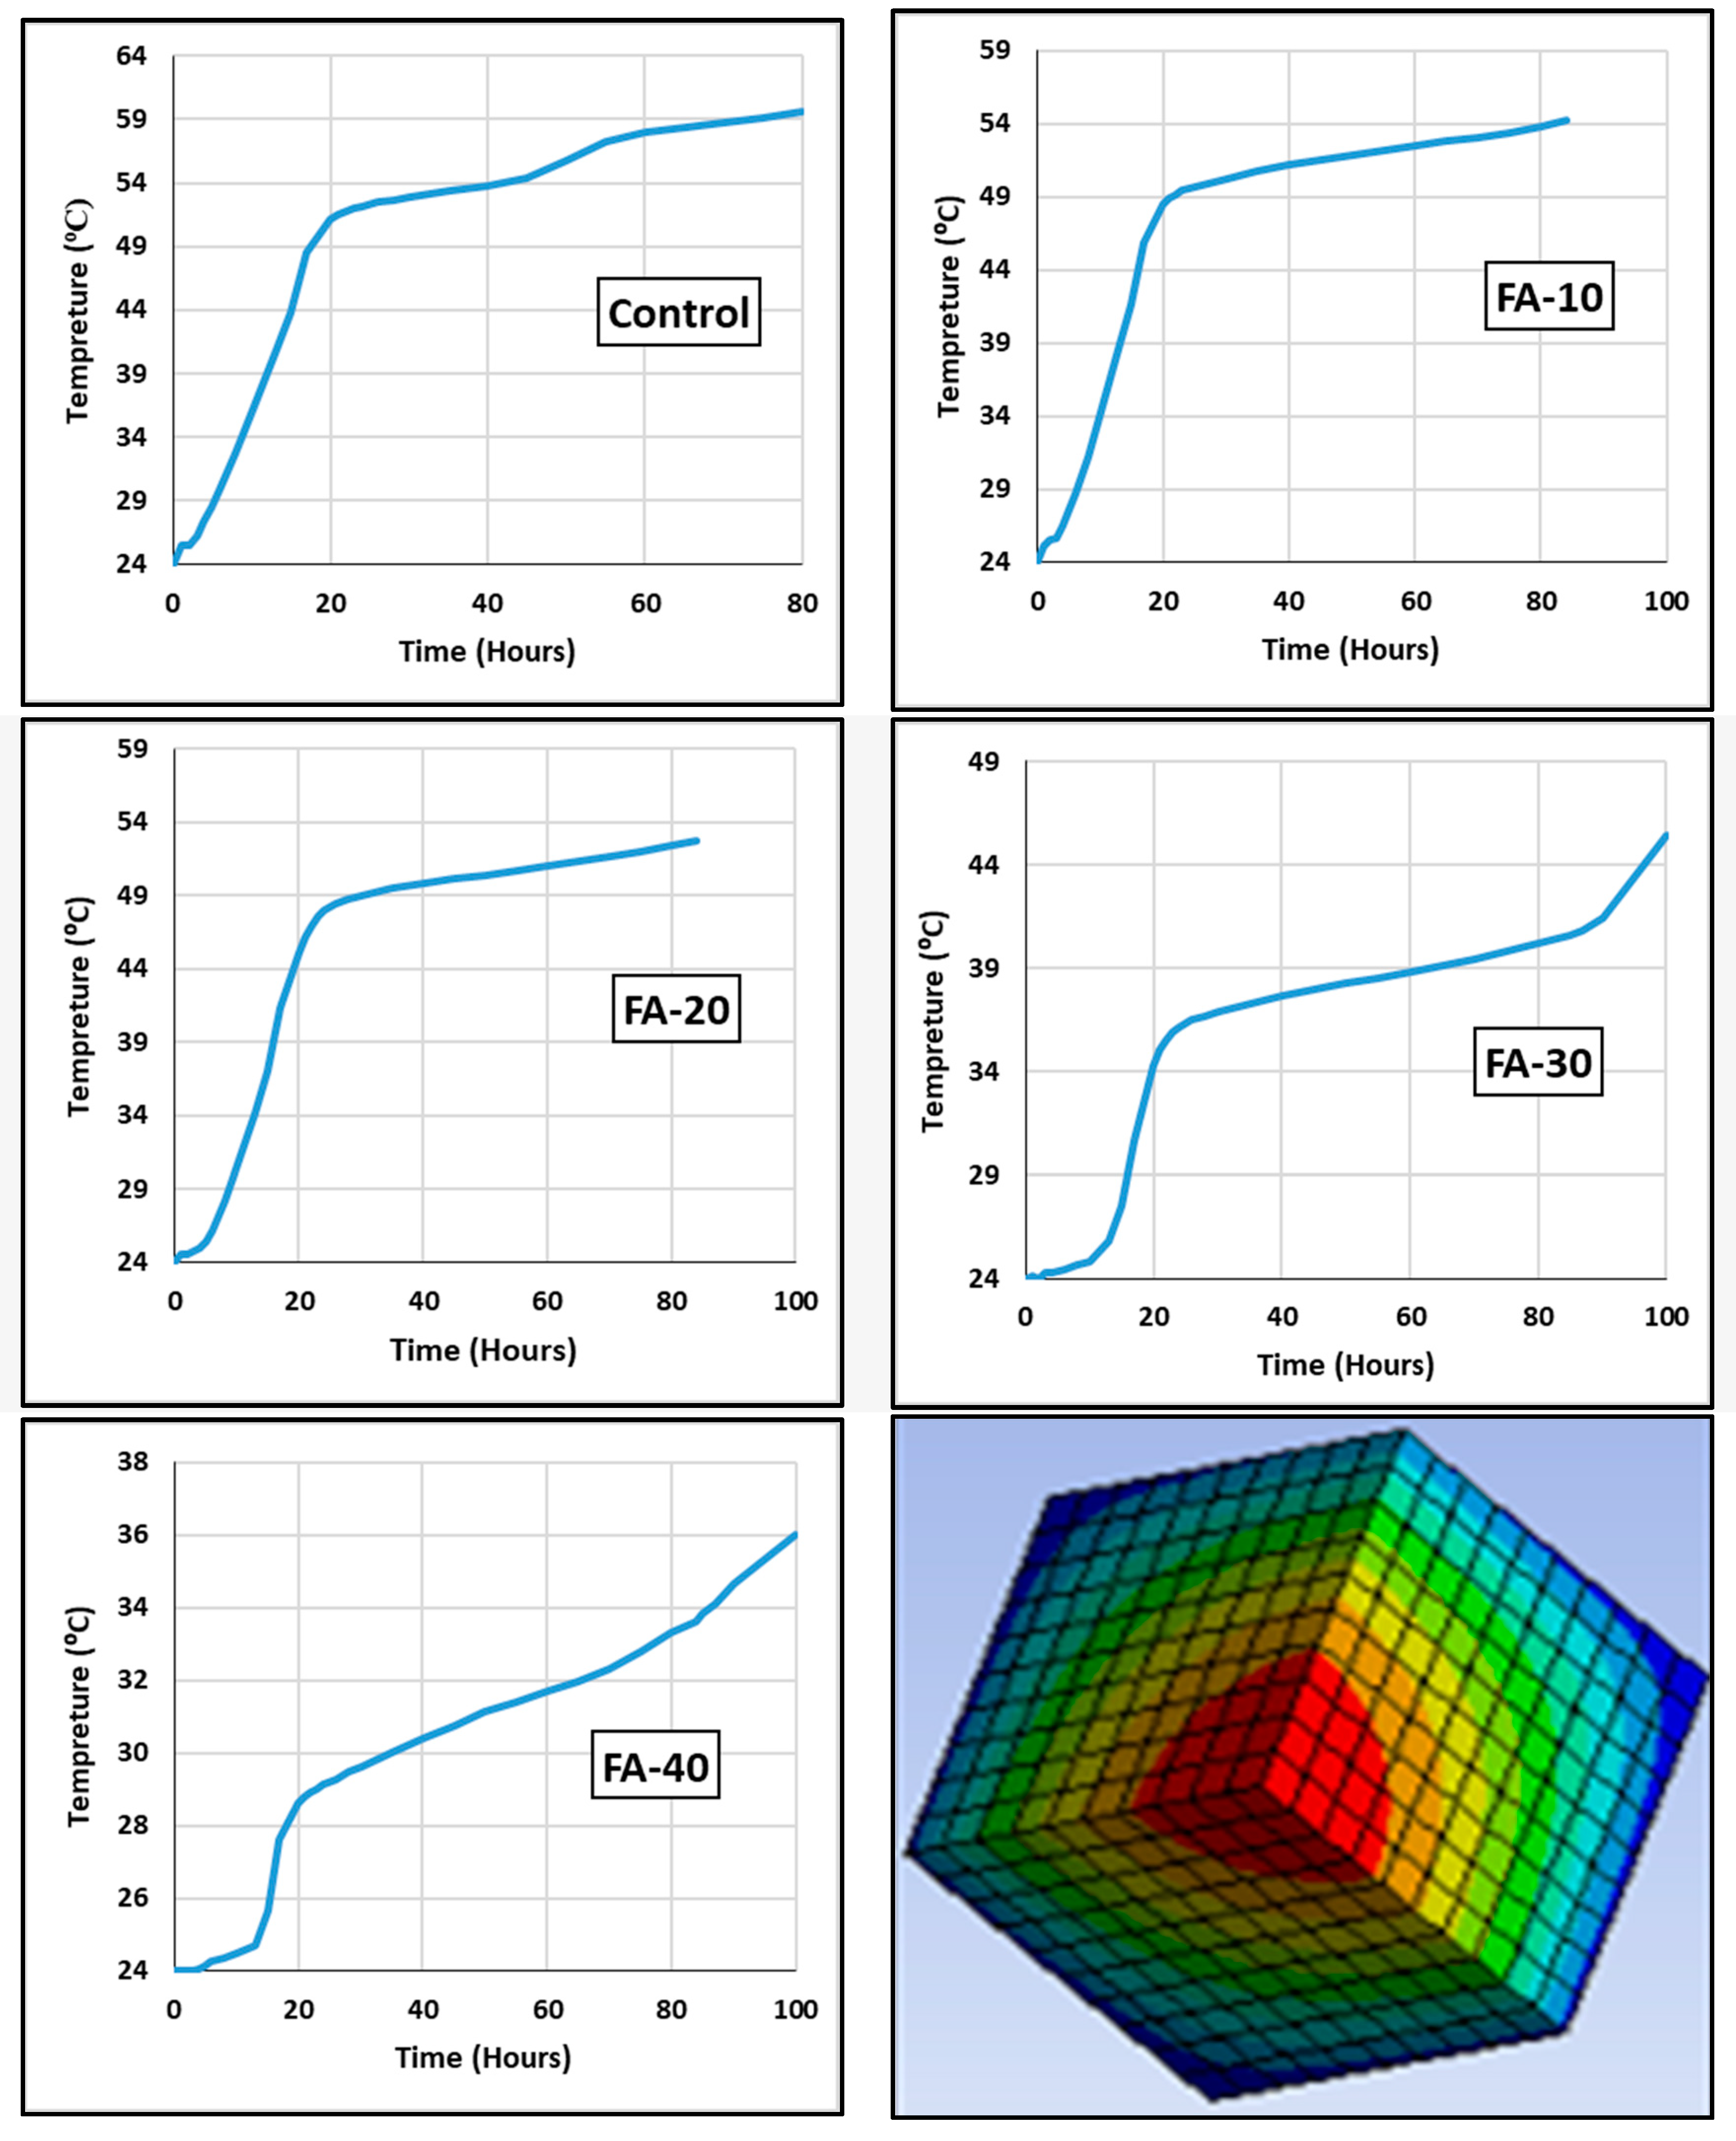
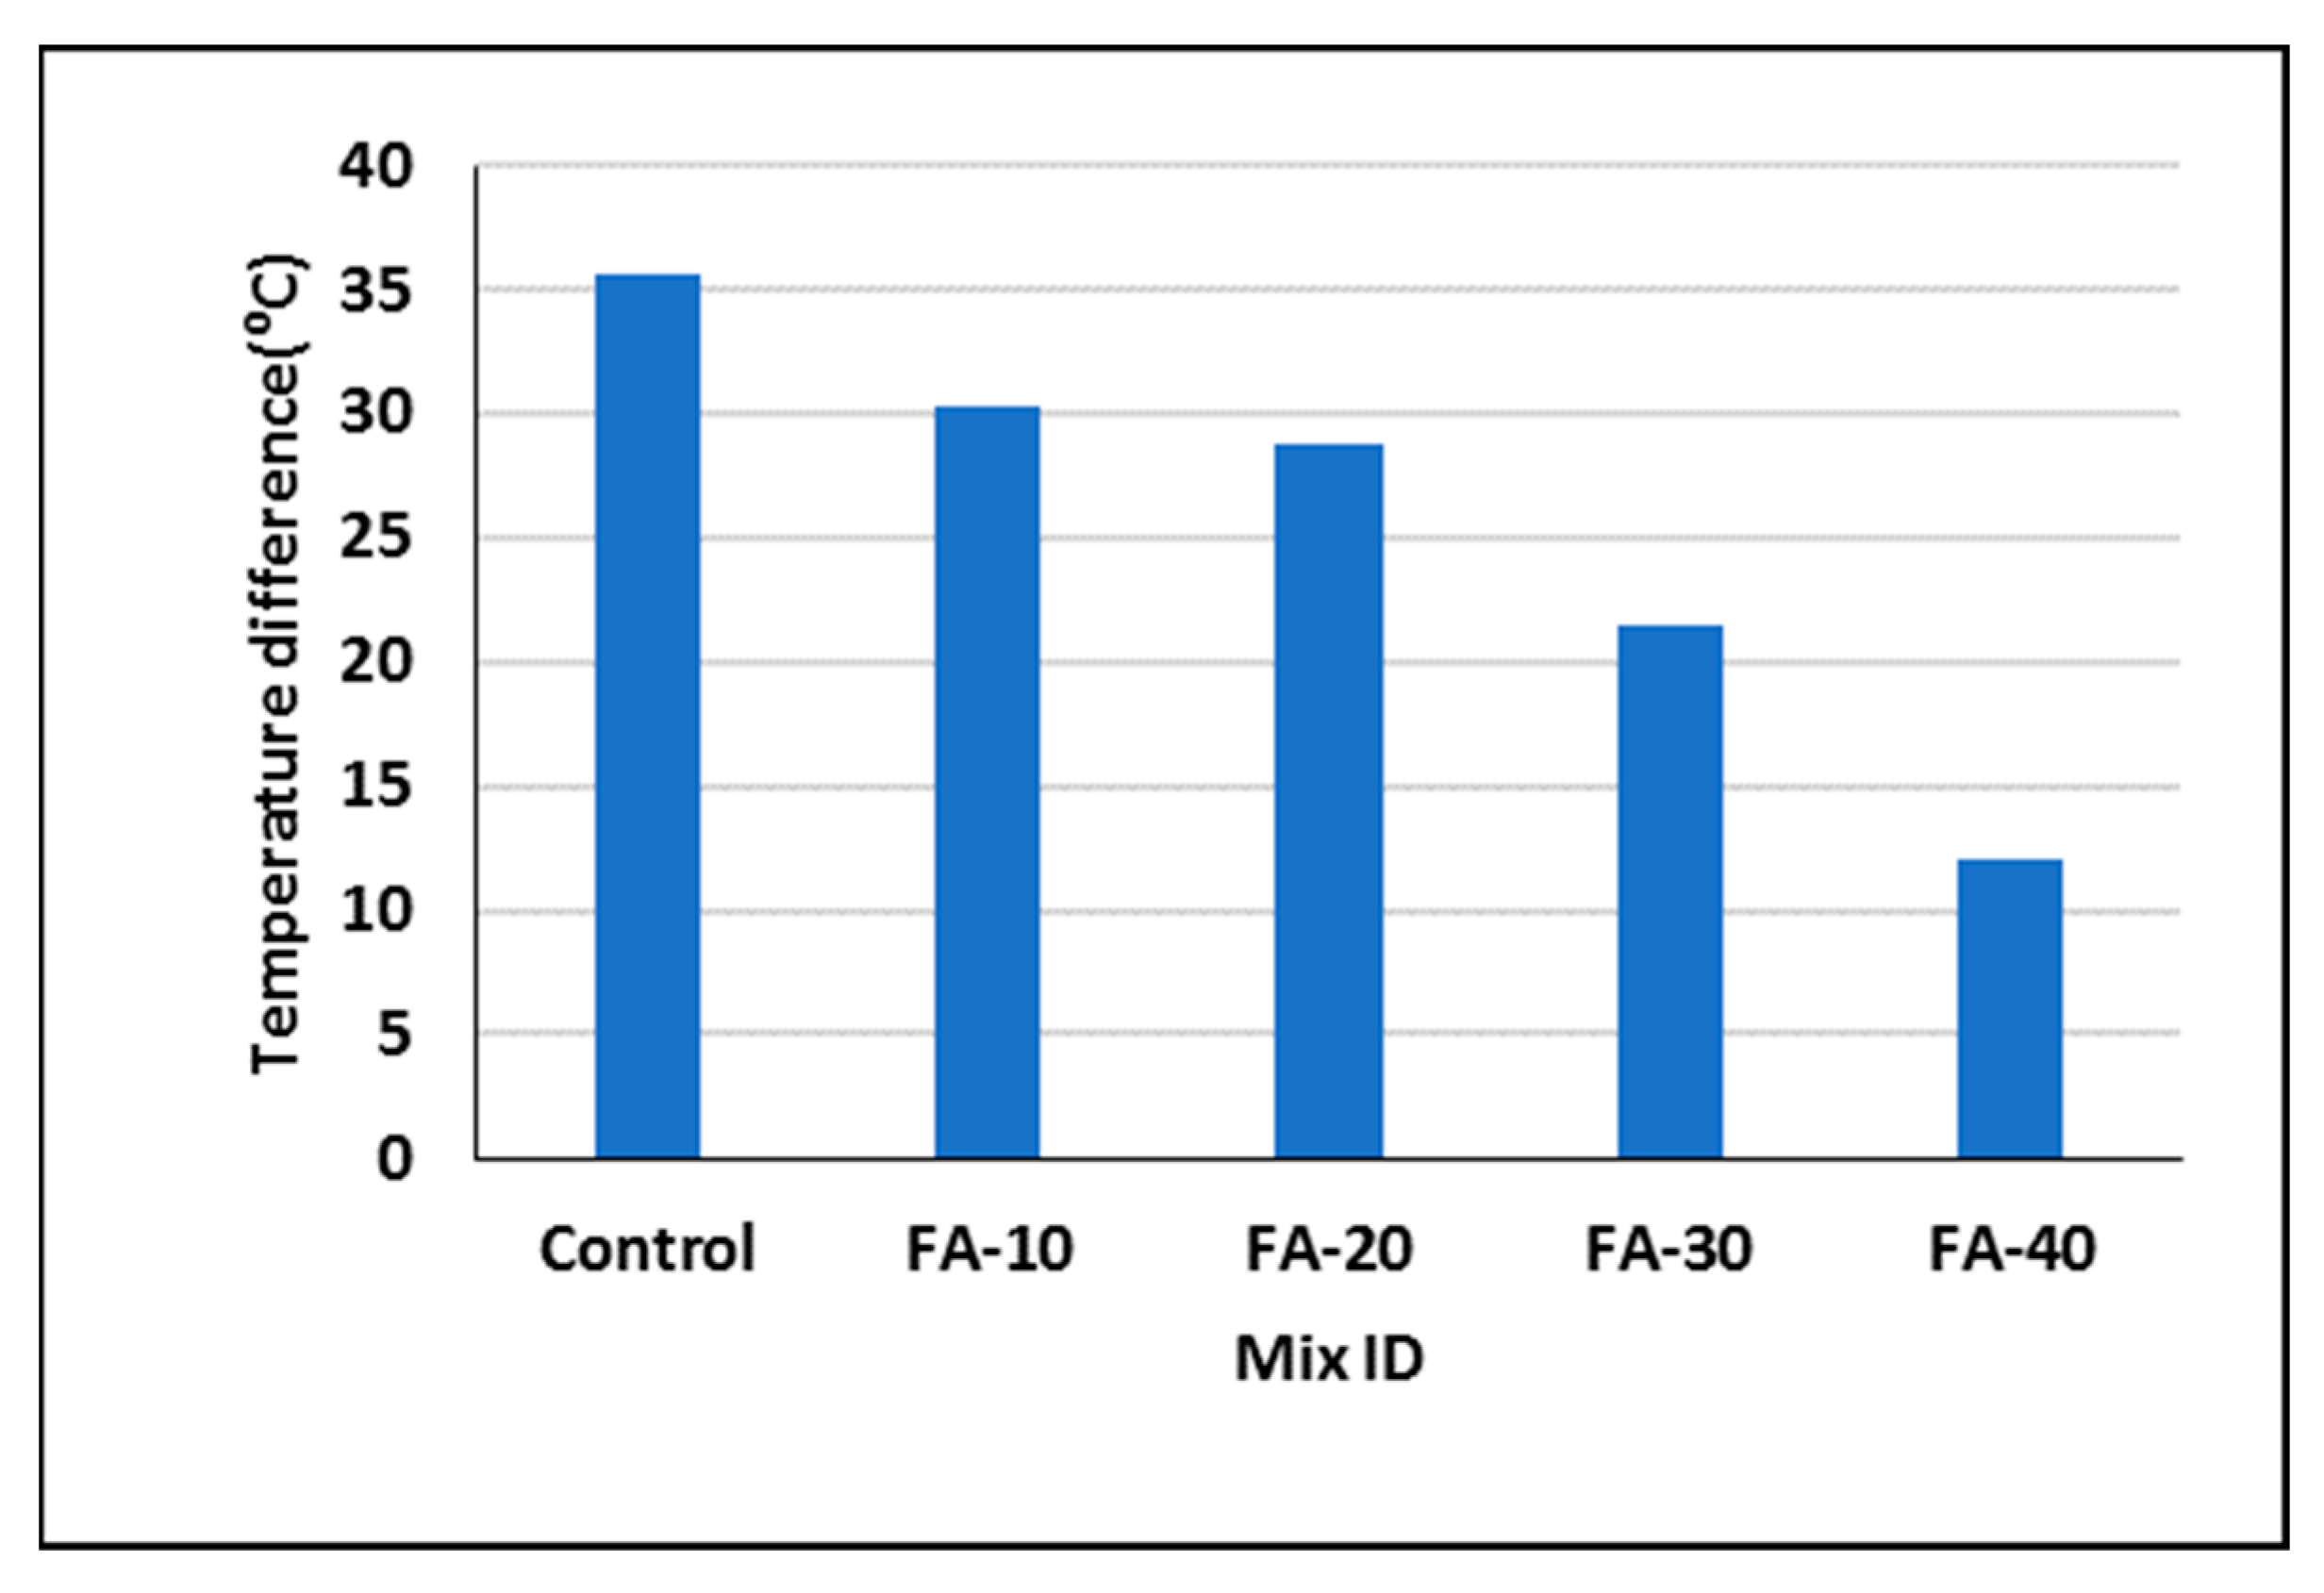
Figure 7 shows the measured flexural strength of the LHHPC mixes at 28 and 90 days. Compared to the control mix, using 10%, 20%, 30%, and 40% FA decreased the LHHPC flexural strength by 4.8%, 8.0%, 17.7%, and 31.9%, respectively, at 28 days, and 8.6%, 15.2%, 22.0%, and 26.3%, respectively, at 90 days. The flexural strength decrease is attributed to the decrease in the corresponding compressive and tensile strengths as the concrete flexural strength mainly depends on the performance of the compression and tensile zones while loading in bending. The flexural strength of the proposed mixes ranged from 7.9 to 5.3 MPa at an age of 28 days, and from 9.3 to 6.8 MPa at an age of 90 days. The flexural strengths of the control, FA-10, FA-20, FA-30, and FA-40 were 7.8%, 7.8%, 7.8%, 7.3%, and 7.5% of the corresponding compressive strength at 28 days; they were 7.9%, 8.3%, 8.9%, 9.4%, and 9.3% of the corresponding compressive strength at 90 days. These results are in good agreement with previous research results [11,12,44,45].

3.4. Hydration Heat

Figure 8 shows the development of the hydration heat for all LHHPC mixes in this study. As shown in the figure, for the control, FA-10, and FA-20 mixes, the hydration heat was almost constant at about 25 °C until around 6 h. Between 6 h and 10 h, the hydration heat for those three mixes started to increase with different rates in which the highest heat development rate was shown by the control mix, and the increasing rate decreased with the increase in FA content. Between 10 h and 40 h, the hydration heat of those three mixes increased at a relatively high rate, compared with the slow rate reported before 10 h. In this period of time (10 h to 40 h) and until the end of the test, the control mix showed the highest rate of heat increase. For mixes FA-30 and FA-40, the hydration heat kept constant at about 25 °C until around 20 h. Beyond that and up to 40 h, the hydration heat of those two mixes started to increase with different rates and the heat increase rate in mix FA-40 was much less than that of mix FA-30. Beyond 40 h for all mixes, the hydration heat increase was relatively slow. The results of this test indicated the ability of FA to significantly reduce and delay the cement hydration heat development. The highest hydration heat recorded for the control mix was 59.5 °C and occurred at 80 h; the FA-40 mix reached 34 °C at the same time, see Figure 6. The highest hydration heat recorded for the FA-40 mix was lower and later than that of the control mix with a maximum value of 36.5 °C occurring at 120 h, when the control mix was showing 40 °C at the same time. The recorded peak hydration heat decreased when increasing the FA content by 8.4%, 12.6%, 24.4%, and 38.7%, respectively, when using 10%, 20%, 30%, and 40%.
The relatively lower heat of hydration when increasing the FA content in LHHPC is attributed to the ability of FA to provide more nucleation sites for cement hydrate deposition. In later concrete ages, this action improves the efficiency of hydration. These findings are in good agreement with earlier investigations [46,47,48]. The increase in tri-calcium aluminate (C3A) reaction and subsequent ettringite to monosulfate conversion could be the result of the FA enhancing the above reaction by providing a large number of nucleation sites for the hydration products to precipitate more calcium aluminate. This hydration reaction involves an exothermic process and contributes to the generated heat [49].

3.5. Thermal Conductivity and Specific Heat

The results of thermal conductivity and specific heat capacity are shown in Table 3. Using FA contents of 10%, 20%, 30%, and 40% in the LHHPC, the thermal conductivity increased by 2.3%, 4.6%, 6.8%, and 9.1%, respectively, while the specific heat capacity decreased by 0.7%, 1.8%, 2.9%, and 4.1%, respectively. This is attributed to the relatively low thermal conductivity of concrete that prevents easy heat transfer due to the presence of thermal cracks resulting from the use of cement in large quantities and the increased heat hydration, which created a thermal gap between the inside and outside of the structure [44,50]. Thermal conductivity is inversely proportional to specific heat capacity. From the above results, it can be concluded that mix FA-40 is the most suitable LHHPC mix for the production of mass concrete.

3.6. Microstructural Analyses

Figure 9 shows the SEM and EDX analyses results. The control mix contained high levels of Ca(OH)2 hexagon, as well as ettringite rods that produce more pores; see Figure 9a. On the other hand, the FA-40 mix showed a denser concrete microstructure with the absence of Ca(OH)2 which indicated a lower heat of hydration and less thermal cracking.
Table 4 compares the element ratios between the control mix and FA-40 mix. It has been proven that 40% of FA reduced the percentage of CaO by 26.4% for the control mix. As a result, the calcium content was lower at 28 days and the formation and hydration of CH and CSH crystals were delayed.

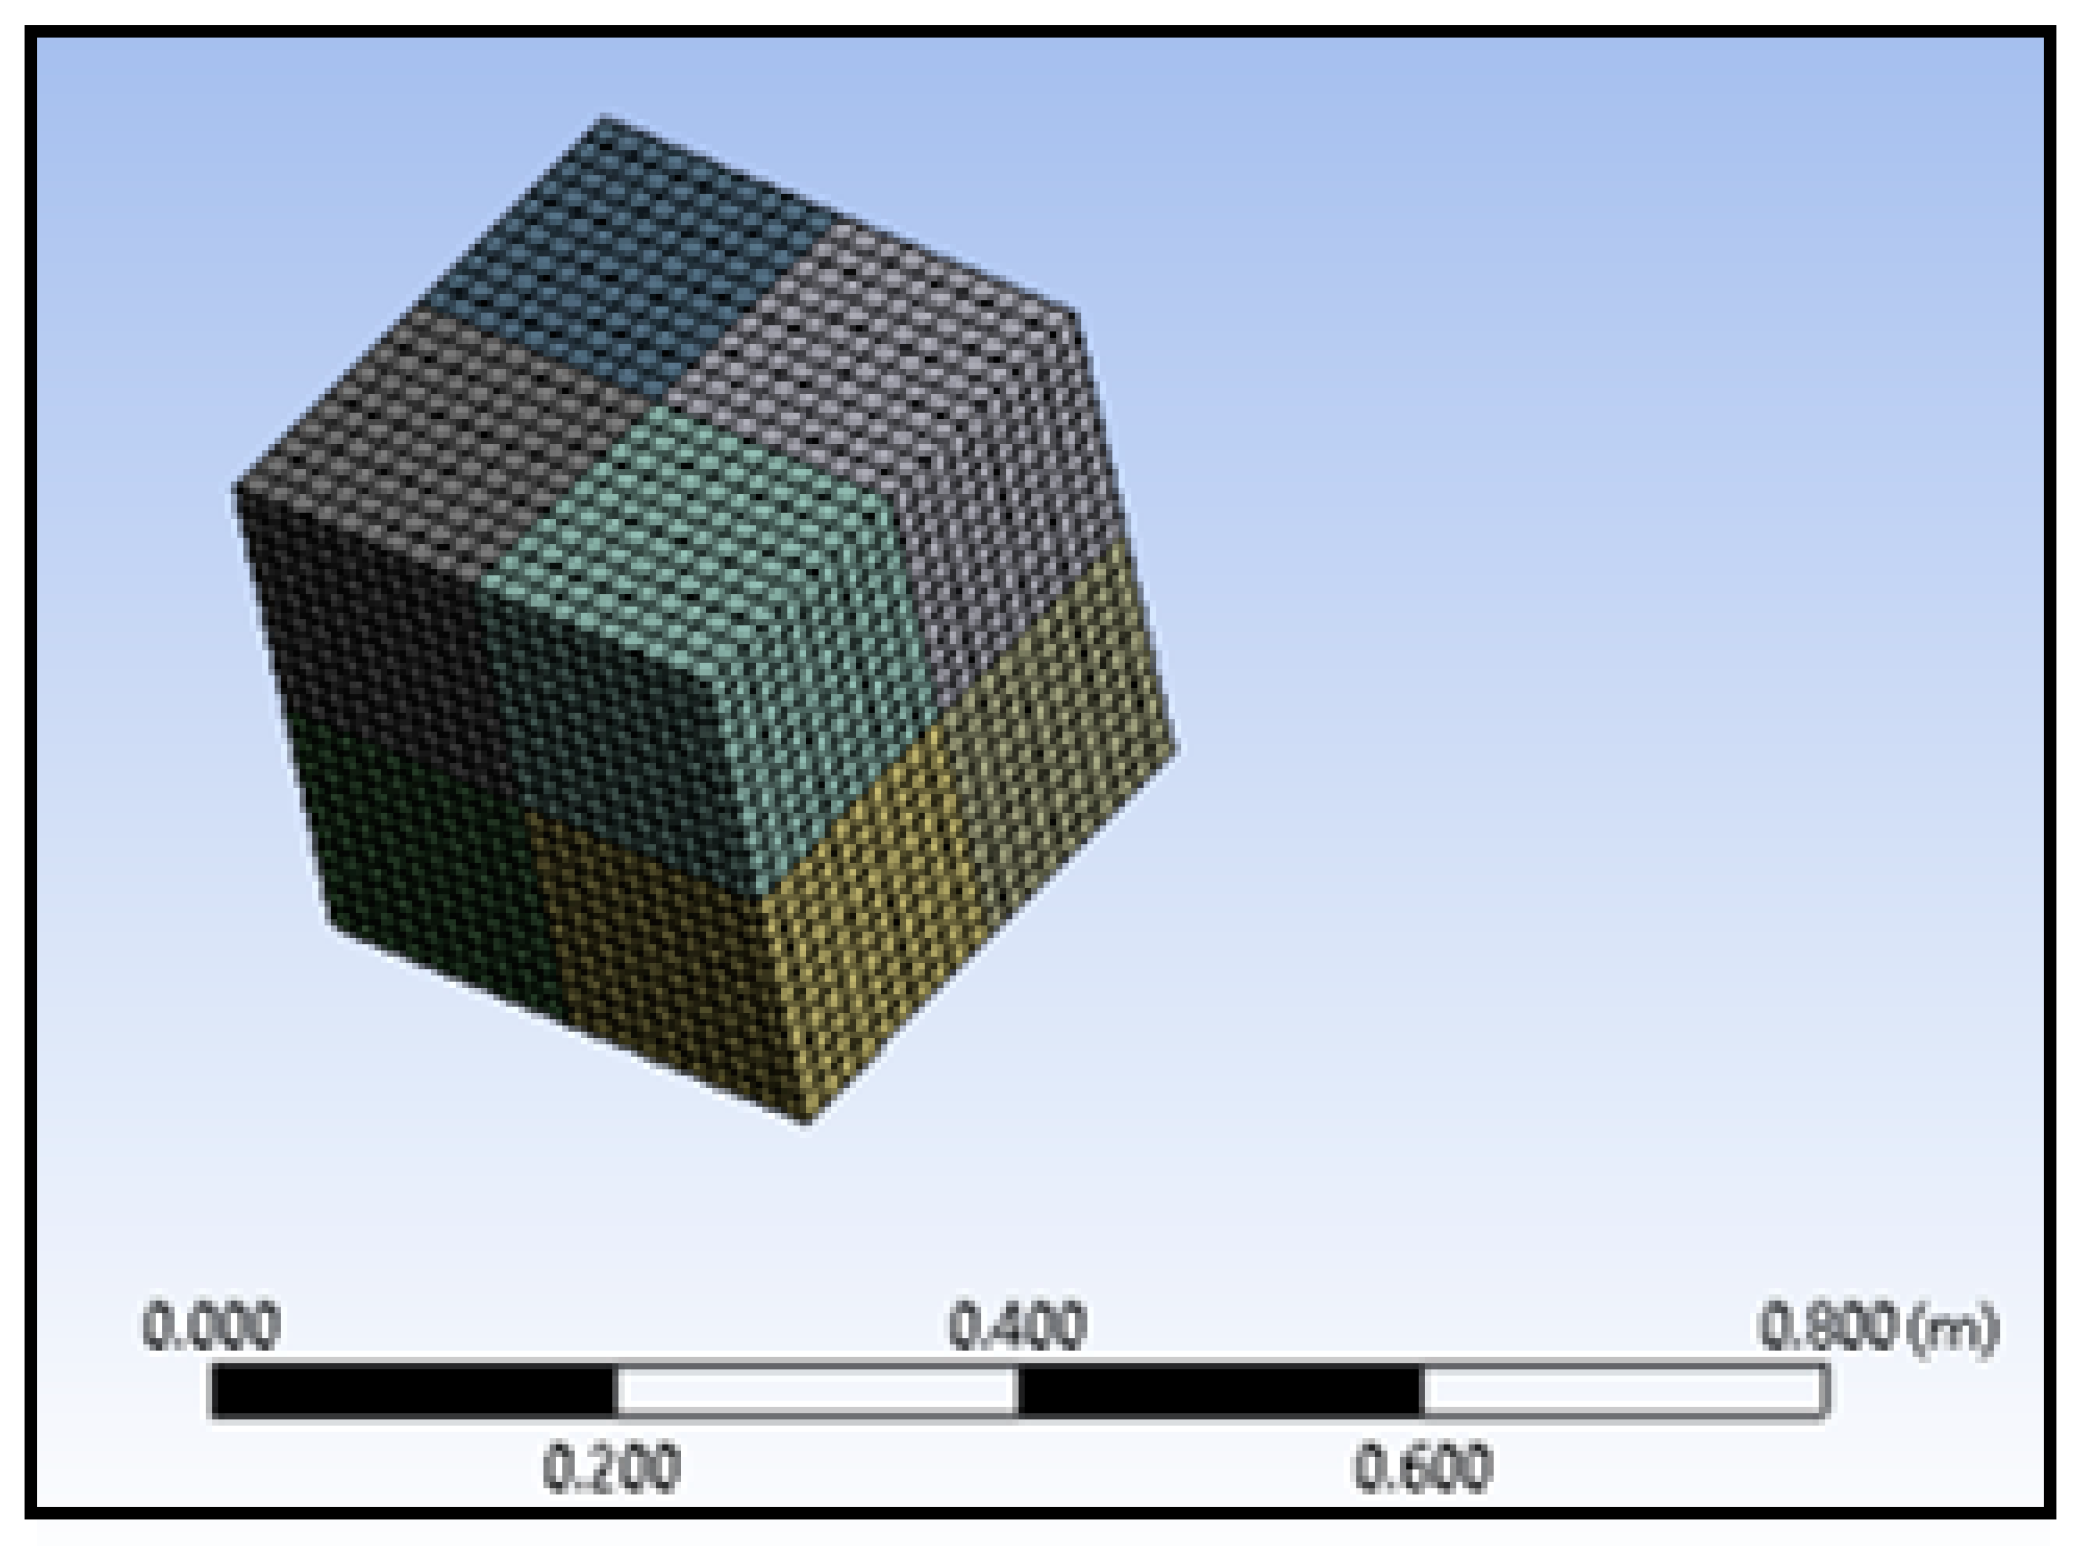
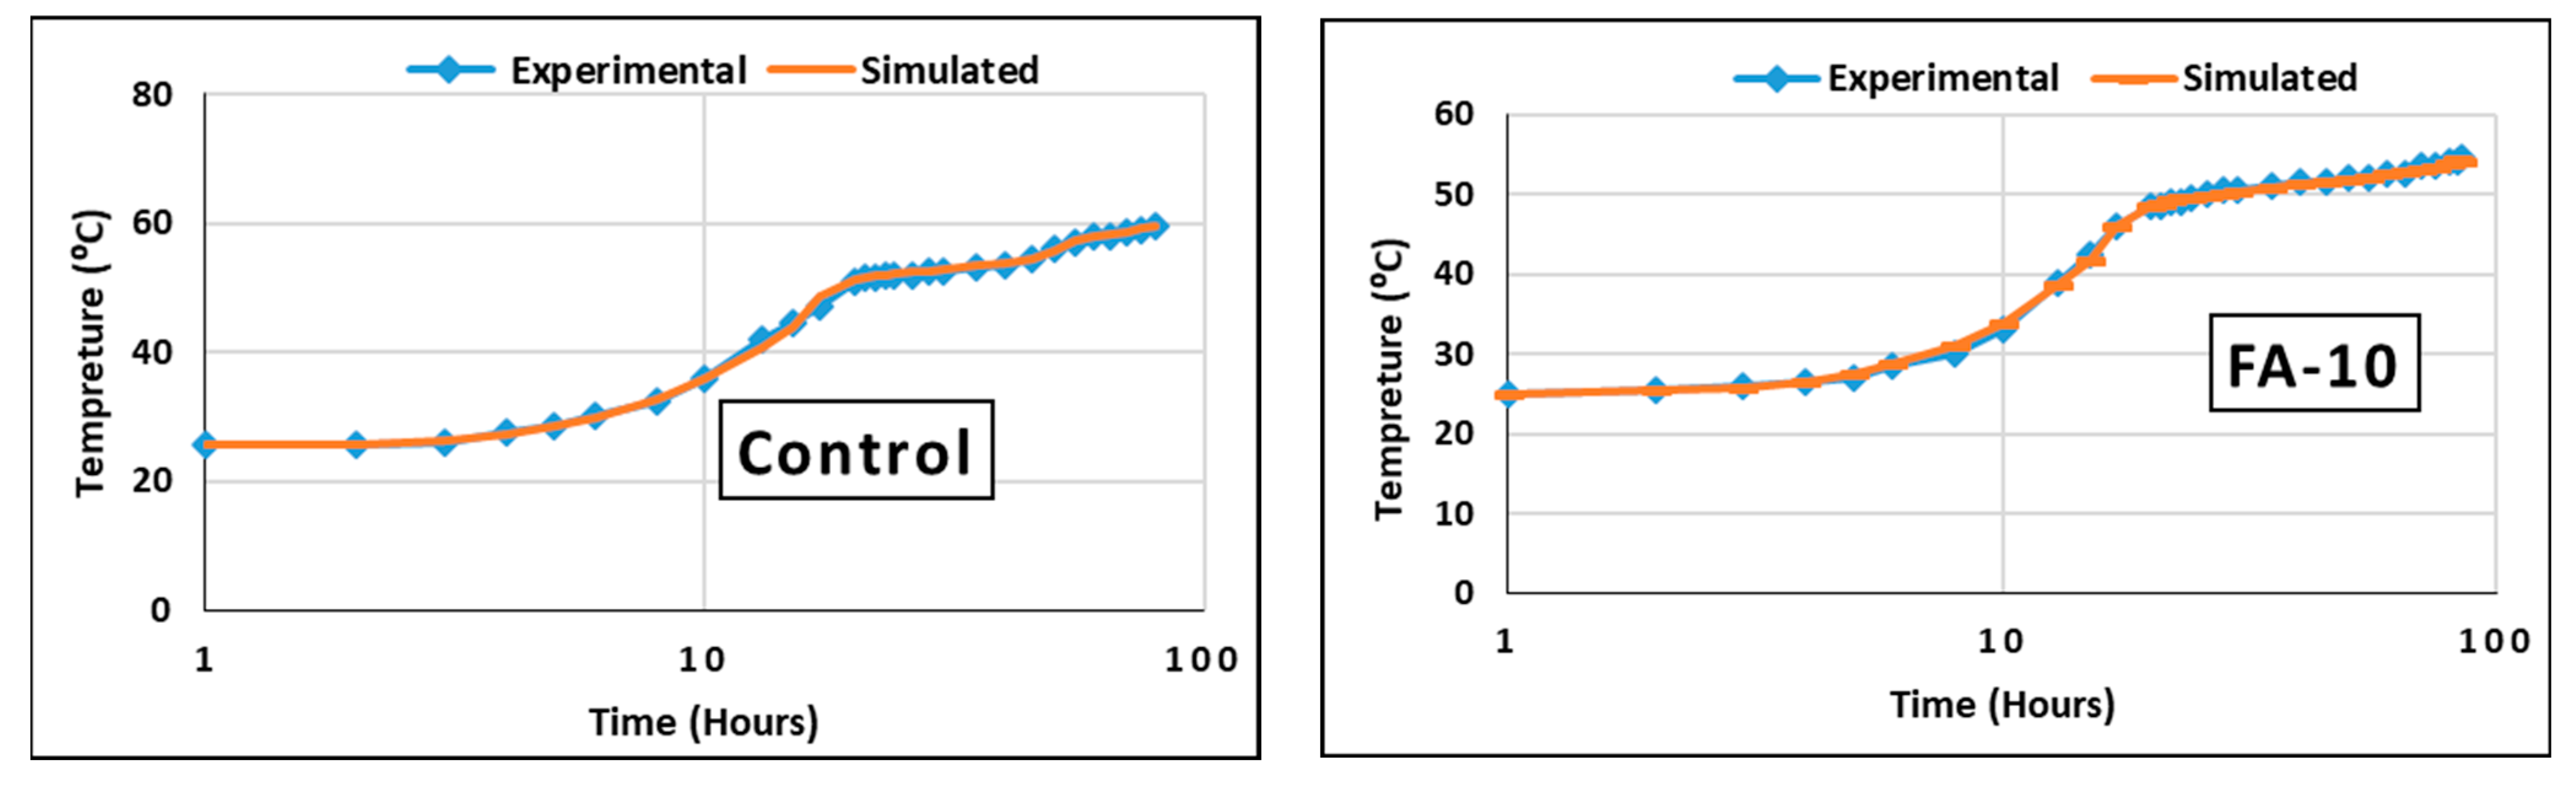
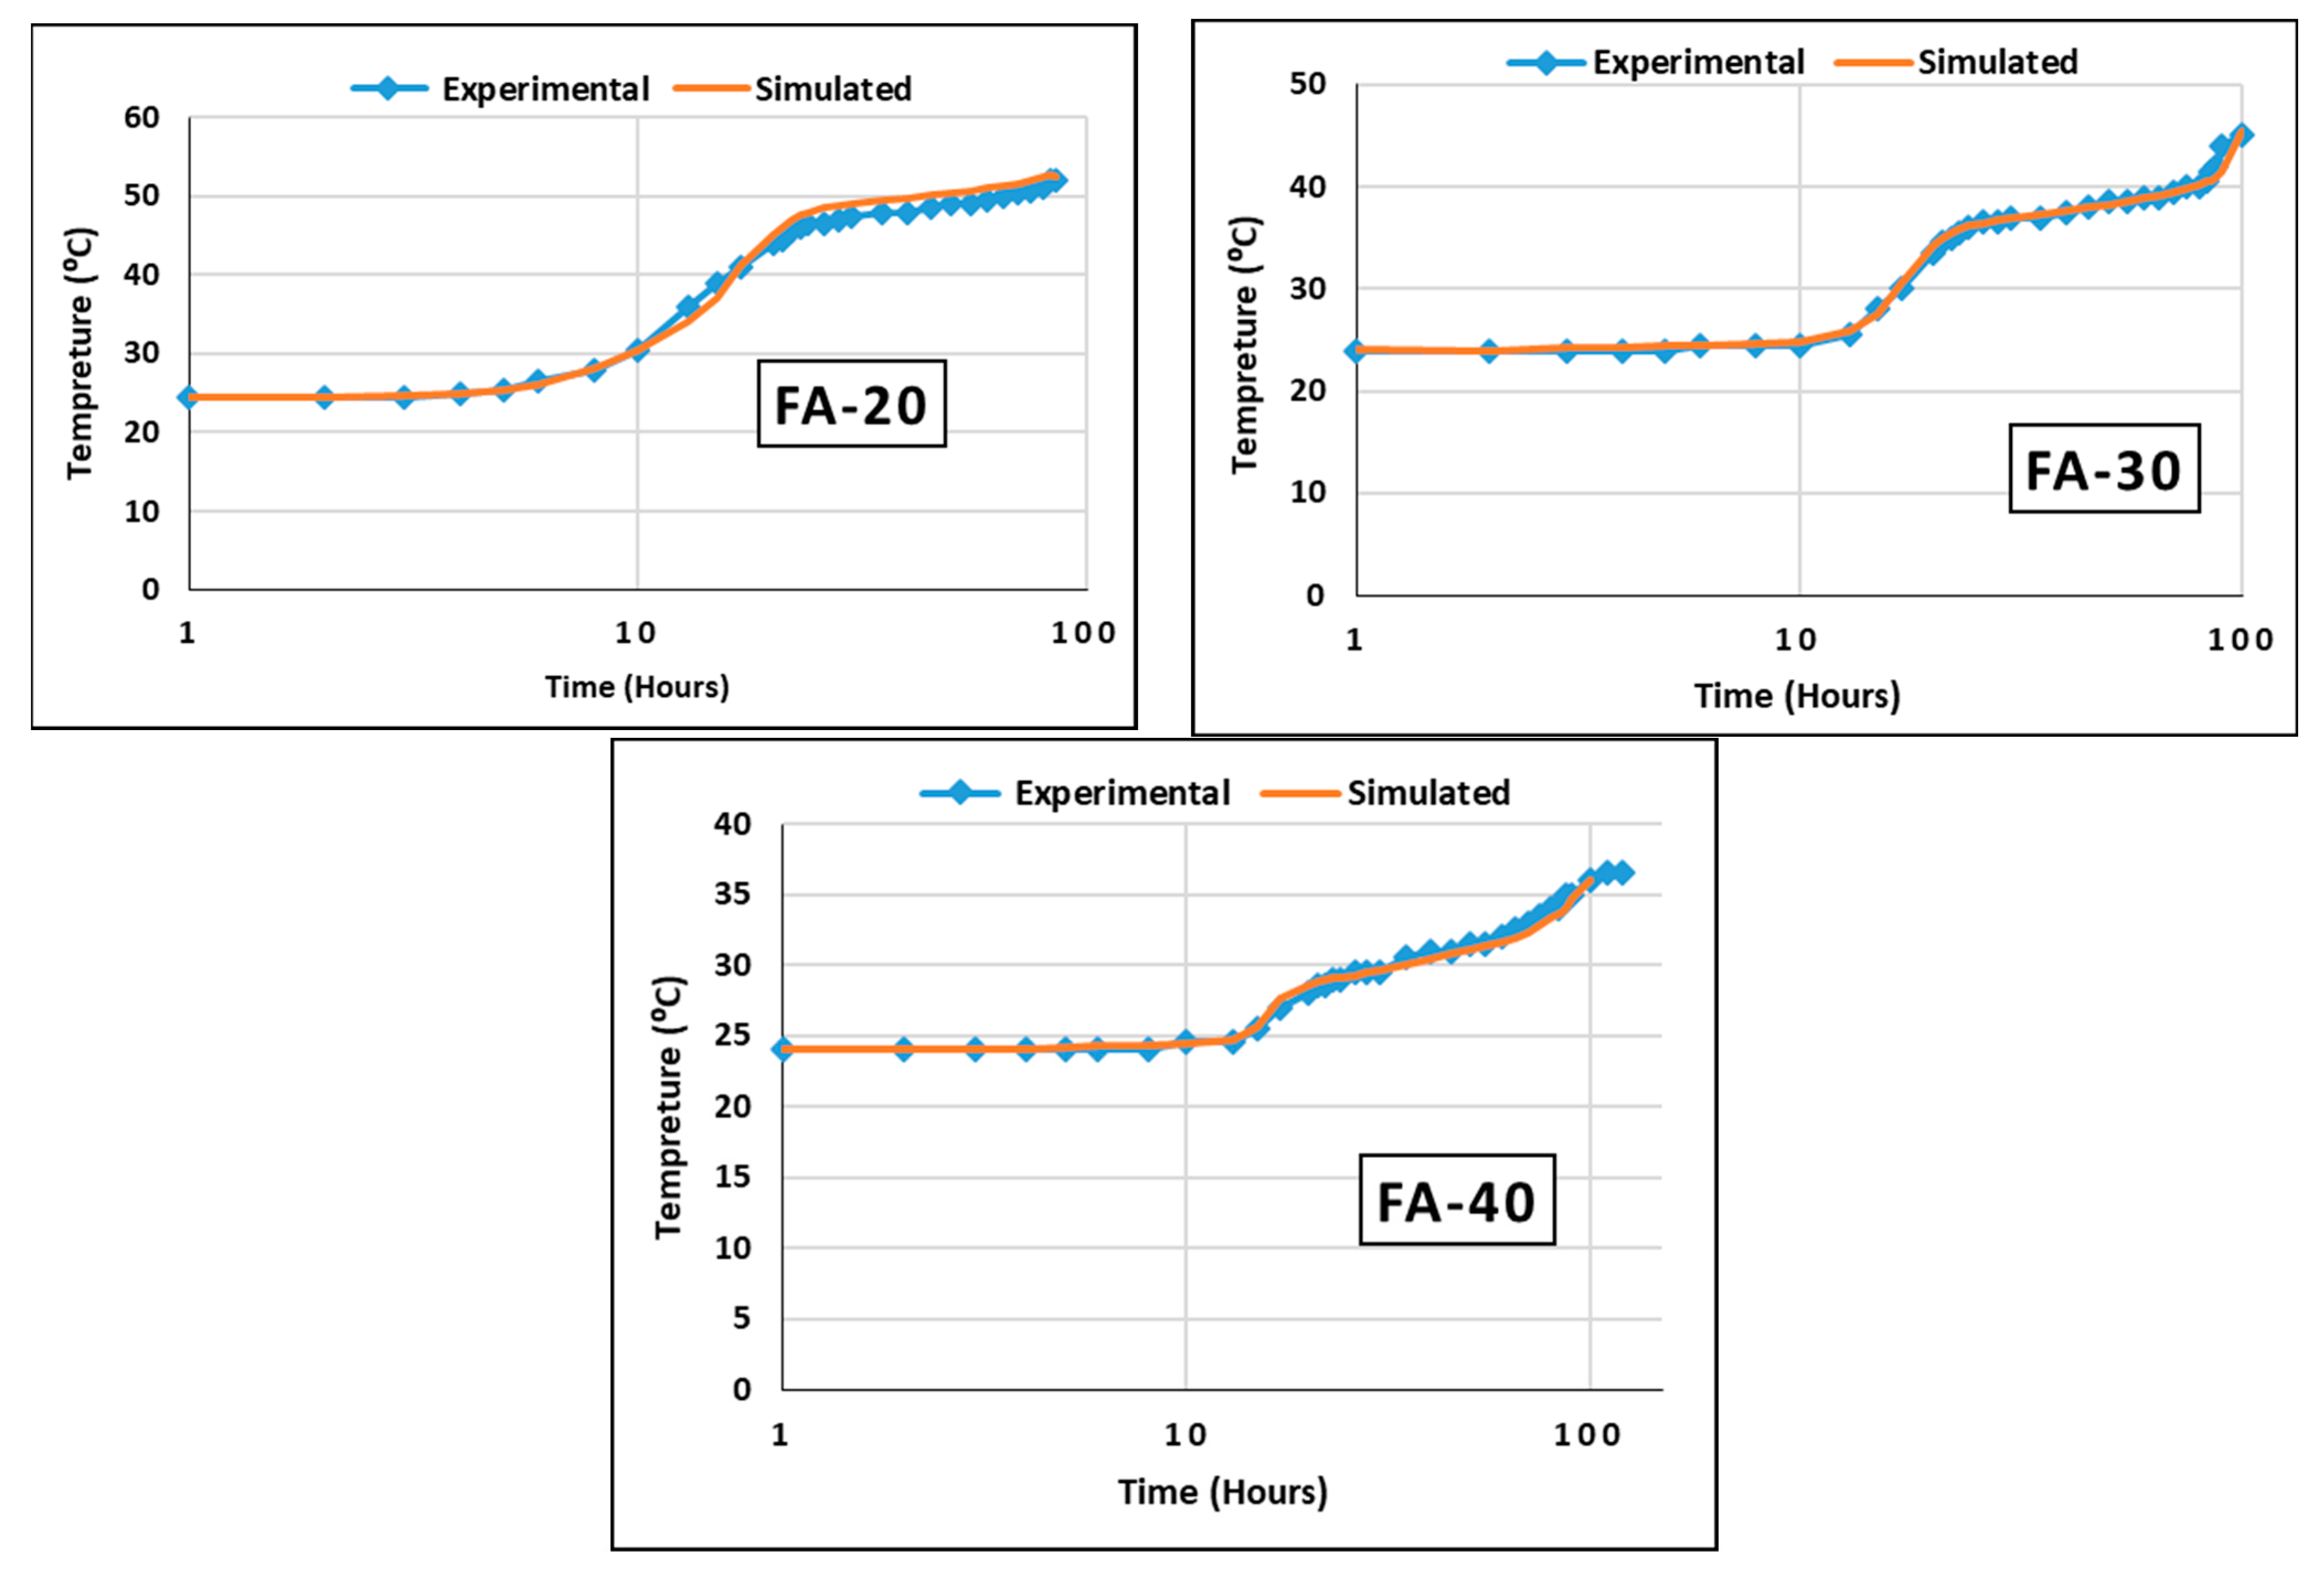
3.7. Results of the Numerical Study

Figure 10 shows the FEM result of the temperature change in the center of the concrete mass. Concrete with the different FA contents of 0%, 10%, 20%, 30%, and 40% showed peak temperatures of 59.55 °C, 54.24 °C, 52.72 °C, 45.44 °C, and 36.02 °C. Compared to the control mix, the percentages of decrease in peak temperature were 8.92%, 11.47%, 23.69%, and 39.52, respectively, for mixes FA-10, FA-20, FA-30, and FA-40. The highest temperature recorded for the control mix was 59.55 °C at time of 80 h, while the temperature recorded for the FA-40 mix was 33.3 °C at the same time. The relatively high difference in the recorded temperature of the control mix and the FA-40 mix at the same time is a reflection of the difference in the heat capacity of the concrete. The FA content affected the time of approaching peak temperatures, as shown in Figure 10. The FA-10 concrete mix was the fastest in reaching the peak temperature; however, FA-40 was the slowest in reaching the peak temperature. Mixes containing 10%, 20%, 30%, and 40% FA reached their peak temperature at 84.0, 84.5, 100, and 101 h, respectively.
Figure 11 shows the maximum recorded temperature difference between the concrete center and the outer surfaces. As shown in the figure, by increasing the FA content in concrete, the temperature difference decreased. For the control mix, the temperature difference was 35.55 °C, while it was 12 °C for the FA-40 mix. This indicates heat transfer during the development of the hydration reaction. The greater the temperature difference between the center and the surface, the greater the thermal cracks.
Figure 12 compares the FEM results and the corresponding experimental results for the hydration heat test. As shown in the figure, FEM was able to predict the experimental results with small errors. The differences between the FEM and experimental results ranged between 0.07% and 1.35% with a temperature difference of less than 1 °C. This indicates the ability of the proposed FEM to predict the thermal performance of the LHHPC, and it can be used in simulating large-scale structures.

4. Conclusions

In this study, the potential use of blast furnace cement (CEM III) and fly ash (FA) in LHHPC was explored. FA was used at various dosages: 10%, 20%, 30%, and 40% as a partial replacement of CEM III. The mechanical and micro-structural characteristics of the mixes were investigated. The thermal properties of the LHHPC mixes were measured, namely the heat of hydration, thermal conductivity, and specific heat capacity. In addition, the 3D finite element model (FEM) was used to simulate the thermal performance of the proposed LHHPC to provide accurate predictions for temperature distribution. Based on the obtained experimental and numerical results, the following conclusions can be summarized:
  • The concrete’s sustainability was enhanced when 40% of the cement weight was replaced by FA. The improvement of sustainability while attaining the appropriate strength and low hydration temperature remained the primary objective.
  • The mechanical properties of LHHPC containing 40% FA at 90 days were similar to those of the control mix at 28 days.
  • At 90 days, the LHHPC mix containing 40% FA showed fewer pores and thermal cracks than that of the control mix, as was evidenced by the microstructure investigations (SEM and XRD).
  • By using LHHPC with the optimum thermal characteristics, concrete with low heat, high thermal conductivity, and low thermal expansion was produced. This lowers the ensuing stresses and the risk of cracking occurrence.
  • The proposed 3D FEM provided good predictions of temperature distribution compared with the experimental results.
  • The results of this research introduce the ideal FA content that can ensure durable and sustainable LHHPC for mass concrete production.

Author Contributions

Conceptualization, H.E. and I.E.; Data curation, I.E. and O.Y.; Formal analysis, H.E. and O.Y.; Investigation, A.M.T.; Methodology, H.E.; Project administration, O.Y.; Resources, A.M.T. and I.E.; Software, H.E. and O.Y.; Supervision, A.M.T. and I.E.; Validation, A.M.T. and I.E.; Visualization, I.E.; Writing—original draft, H.E.; Writing—review and editing, A.M.T. and O.Y. All authors have read and agreed to the published version of the manuscript.

Funding

This research received no external funding.

Institutional Review Board Statement

Not applicable.

Informed Consent Statement

Not applicable.

Data Availability Statement

Data is contained within the article.

Conflicts of Interest

The authors declare no conflict of interest.

References

  1. Lyu, X.; Elchalakani, M.; Ahmed, T.; Sadakkathulla, M.A.; Youssf, O. Residual strength of steel fibre reinforced rubberised UHPC under elevated temperatures. J. Build. Eng. 2023, 76, 107173. [Google Scholar] [CrossRef]
  2. Chakraborty, D.; Awolusi, I.; Gutierrez, L. An explainable machine learning model to predict and elucidate the compressive behavior of high-performance concrete. Results Eng. 2021, 11, 100245. [Google Scholar] [CrossRef]
  3. Tahwia, A.M.; Ellatief, M.A.; Heneigel, A.M.; Abd Elrahman, M. Characteristics of eco-friendly ultra-high-performance geopolymer concrete incorporating waste materials. Ceram. Int. 2022, 48, 19662–19674. [Google Scholar] [CrossRef]
  4. Korolev, A.S.; Kopp, A.; Odnoburcev, D.; Loskov, V.; Shimanovsky, P.; Koroleva, Y.; Vatin, N.I. Compressive and Tensile Elastic Properties of Concrete: Empirical Factors in Span Reinforced Structures Design. Materials 2021, 14, 7578. [Google Scholar] [CrossRef]
  5. American Concrete Institute. AACI 207.1R-05 “Guide to Mass Concrete”; ACI Committee 207; American Concrete Institute: Farmington Hills, MI, USA, 2005. [Google Scholar]
  6. Nguyen, C.T.; Luu, X.B. Reducing temperature difference in mass concrete by surface insulation. Mag. Civ. Eng. 2019, 4, 70–79. [Google Scholar]
  7. Jebli, M.; Jamin, F.; Pelissou, C.; Lhopital, E.; El Youssoufi, M.S. Characterization of the expansion due to the delayed ettringite formation at the cement paste-aggregate interface. Constr. Build. Mater. 2021, 289, 122979. [Google Scholar] [CrossRef]
  8. Luo, F.; Jin, Y. Comparison of the Properties of Coal Gasification Fly Ash and Pulverized Coal Fly Ash as Supplementary Cementitious Materials. Sustainability 2023, 15, 14960. [Google Scholar] [CrossRef]
  9. Bushmanova, A.V.; Semenov, K.V.; Struchkova, A.Y.; Manovitsky, S.S. Thermal cracking resistance in massive foundation slabs in the building period. Mag. Civ. Eng. 2017, 76, 193–200. [Google Scholar]
  10. Bushmanova, A.V.; Videnkov, N.V.; Semenov, K.V.; Dernakova, A.V.; Korovina, V.K. The thermo-stressed state in massive concrete structures. Mag. Civ. Eng. 2017, 28, 51–60. [Google Scholar]
  11. Grey, D.M. Presentation Low Heat High Performance Concrete; NRC Research Press: Ottawa, ON, Canada, 1996. [Google Scholar]
  12. Breton, D. Low-Heat High-Performance Concrete. U.S. Patent 5,531,823, 6 February 1995. [Google Scholar]
  13. Jawara, A. Low Heat High Performance Concrete for Glass Fiber Reinforced Polymer Reinforcement. Master’s Thesis, Department of Civil Engineering, University of Manitoba, Winnipeg, MB, Canada, 1999. [Google Scholar]
  14. Kigha, F.; Sadeeq, J.A.; Abejide, O.S. Effects of temperature levels and concrete cover thickness on residual strength characteristics of fire exposed reinforced concrete beams. Niger. J. Technol. 2015, 34, 429–437. [Google Scholar] [CrossRef]
  15. Tahwia, A.M.; Fouda, R.M.; Elrahman, M.A.; Youssf, O. Long-Term Performance of Concrete Made with Different Types of Cement under Severe Sulfate Exposure. Materials 2022, 16, 240. [Google Scholar] [CrossRef] [PubMed]
  16. Bonnet, J.; Mosser-Ruck, R.; Sterpenich, J.; Bourdelle, F.; Verron, H.; Michau, N.; Bourbon, X.; Linard, Y. Chemical and mineralogical characterizations of a low-pH cementitious material designed for the disposal cell of the high-level radioactive waste (HLW). Cem. Concr. Res. 2022, 162, 107013. [Google Scholar] [CrossRef]
  17. Cuesta, A.; Ayuela, A.; Aranda, M.A.G. Belite cements and their activation. Cem. Concr. Res. 2021, 140, 106319. [Google Scholar] [CrossRef]
  18. Zongshou, L.; Weihong, X.; Wei, C. Cementitious Materials Science: Theories and Applications; Walter de Gruyter GmbH & Co. KG: Berlin, Germany, 2019. [Google Scholar]
  19. Mohammed, S.; Safiullah, O. Optimization of the SO3 content of an Algerian Portland cement: Study on the effect of various amounts of gypsum on cement properties. Constr. Build. Mater. 2018, 164, 362–370. [Google Scholar] [CrossRef]
  20. Horkoss, S.; Escadeillas, G.; Rizk, T.; Lteif, R. The effect of the source of cement SO3 on the expansion of mortars. Case Stud. Constr. Mater. 2016, 4, 62–72. [Google Scholar]
  21. Helmy, S.H.; Tahwia, A.M.; Mahdy, M.G.; Elrahman, M.A.; Abed, M.A.; Youssf, O. The Use of Recycled Tire Rubber, Crushed Glass, and Crushed Clay Brick in Lightweight Concrete Production: A Review. Sustainability 2023, 15, 10060. [Google Scholar] [CrossRef]
  22. El-Mir, A.; Nehme, S.G.; Assaad, J.J. Effect of binder content and sand type on mechanical characteristics of ultra-high performance concrete. Arab. J. Sci. Eng. 2022, 47, 13021–13034. [Google Scholar] [CrossRef]
  23. Arshad, S.; Sharif, M.B.; Irfan-ul-Hassan, M.; Khan, M.; Zhang, J.-L. Efficiency of supplementary cementitious materials and natural fiber on mechanical performance of concrete. Arab. J. Sci. Eng. 2020, 45, 8577–8589. [Google Scholar] [CrossRef]
  24. Saridemir, M.; Severcan, M.H.; Ciflikli, M.; Celikten, S.; Ozcan, F.; Atis, C.D. The influence of elevated temperature on strength and microstructure of high strength concrete containing ground pumice and metakaolin. Constr. Build. Mater. 2016, 124, 244–257. [Google Scholar] [CrossRef]
  25. Arrigoni, A.; Panesar, D.K.; Duhamel, M.; Opher, T.; Saxe, S.; Posen, I.D.; MacLean, H.L. Life cycle greenhouse gas emissions of concrete containing supplementary cementitious materials: Cut-off vs. substitution. J. Clean. Prod. 2020, 263, 121465. [Google Scholar] [CrossRef]
  26. Alanazi, H.; Hu, J.; Kim, Y.-R. Effect of slag, silica fume, and metakaolin on properties and performance of alkali-activated fly ash cured at ambient temperature. Constr. Build. Mater. 2018, 197, 747–756. [Google Scholar] [CrossRef]
  27. Sherwani, A.F.H.; Younis, K.H.; Arndt, R.W.; Pilakoutas, K. Performance of Self-Compacted Geopolymer Concrete Containing Fly Ash and Slag as Binders. Sustainability 2022, 14, 15063. [Google Scholar] [CrossRef]
  28. Kang, S.-H.; Kang, H.; Lee, N.; Kwon, Y.-H.; Moon, J. Development of cementless ultra-high performance fly ash composite (UHPFC) using nucleated pozzolanic reaction of low Ca fly ash. Cem. Concr. Compos. 2022, 132, 104650. [Google Scholar] [CrossRef]
  29. Wang, T.; Ishida, T. Multiphase pozzolanic reaction model of low-calcium fly ash in cement systems. Cem. Concr. Res. 2019, 122, 274–287. [Google Scholar] [CrossRef]
  30. Wang, X.-Y.; Lee, H.-S. Modeling the hydration of concrete incorporating fly ash or slag. Cem. Concr. Res. 2010, 40, 984–996. [Google Scholar] [CrossRef]
  31. Fang, Y.; Wang, J.; Ma, H.; Wang, L.; Qian, X.; Qiao, P. Performance enhancement of silica fume blended mortars using bio-functionalized nano-silica. Constr. Build. Mater. 2021, 312, 125467. [Google Scholar] [CrossRef]
  32. Serdyuk, V.; Rudchenko, D.; Dyuzhilova, N. The use of low clinker binders in the production of autoclaved aerated concrete by cutting technology. East-Eur. J. Enterp. Technol. 2020, 6, 108. [Google Scholar] [CrossRef]
  33. Machowska, A.; Kledyński, Z.; Wilińska, I.; Pacewska, B. A study of the early hydration processes and properties of fly ash-slag binders. Bull. Mater. Sci. 2019, 42, 213. [Google Scholar] [CrossRef]
  34. Wagner, D.; Bellmann, F.; Neubauer, J. Influence of aluminium on the hydration of triclinic C3S with addition of KOH solution. Cem. Concr. Res. 2020, 137, 106198. [Google Scholar] [CrossRef]
  35. Joseph, S.; Cizer, Ö. Hydration of hybrid cements at low temperatures: A study on portland cement-blast furnace slag—Na2SO4. Materials 2022, 15, 1914. [Google Scholar] [CrossRef]
  36. Yildirim, H.; Ilica, T.; Sengul, O. Effect of cement type on the resistance of concrete against chloride penetration. Constr. Build. Mater. 2011, 25, 1282–1288. [Google Scholar] [CrossRef]
  37. Sanjuán, M.A.; Argiz, C. The new European standard on common cements specifications EN 197-1: 2011. Mater. Construcción 2012, 62, 425–430. [Google Scholar] [CrossRef]
  38. BS EN 197-1/2011; Cement Composition, Specifications and Conformity Criteria for Common Cements. European Standard: Brussels, Belgium, 2011.
  39. ASTM C 109/C 109M; Standard Test Method for Compressive Strength of Hydraulic Cement Mortars (Using 2-in. or [50-mm] Cube Specimens). ASTM International: West Conshohocken, PA, USA, 2008.
  40. ASTM C 496; Standard Test Method for Splitting Tensile Strength of Cylindrical Concrete Specimens. ASTM International: West Conshohocken, PA, USA, 2017.
  41. ASTM C78-16; Standard Test Method for Flexural Strength of Concrete (Using Simple Beam with Third-Point Loading). ASTM International: West Conshohocken, PA, USA, 2016.
  42. Ramos, R.; Aresti, L.; Christodoulides, P.; Vieira, A.; Florides, G. Assessment and comparison of soil thermal characteristics by laboratory measurements. In Energy Geotechnics: SEG-2018; Springer: Cham, Switzerland, 2019; pp. 155–162. [Google Scholar]
  43. Bendapudi, S.C.K.; Saha, P. Contribution of fly ash to the properties of mortar and concrete. Int. J. Earth Sci. Eng. 2011, 4, 1017–1023. [Google Scholar]
  44. Klemczak, B.; Batog, M. Heat of hydration of low-clinker cements. J. Therm. Anal. Calorim. 2016, 123, 1351–1360. [Google Scholar] [CrossRef]
  45. Sarker, P.; McKenzie, L. Strength and hydration heat of concrete using fly ash as a partial replacement of cement. In Proceedings of the 24th Biennial Conference of the Concrete Institute Australia, Luna Park, Sydney, 17–19 September 2009. [Google Scholar]
  46. Mustapha, F.A.; Sulaiman, A.; Mohamed, R.N.; Umara, S.A. The effect of fly ash and silica fume on self-compacting high-performance concrete. Mater. Today Proc. 2021, 39, 965–969. [Google Scholar] [CrossRef]
  47. Chouhan, P.; Jamle, S.; Verma, M.P. Effect of Silica Fume on Strength Parameters of Concrete as a Partial Substitution of Cement. IJSART3 2017, 5, 3–7. [Google Scholar]
  48. Scrivener, K.; Ouzia, A.; Juilland, P.; Mohamed, A.K. Advances in understanding cement hydration mechanisms. Cem. Concr. Res. 2019, 124, 105823. [Google Scholar] [CrossRef]
  49. Phung, Q.T.; Ferreira, E.; Seetharam, S.; Govaerts, J.; Valcke, E. Understanding hydration heat of mortars containing supplementary cementitious materials with potential to immobilize heavy metal containing waste. Cem. Concr. Compos. 2021, 115, 103859. [Google Scholar] [CrossRef]
  50. Tang, C.-W. The temperature and pore pressure distribution of lightweight aggregate concrete slabs exposed to elevated temperatures. Appl. Sci. 2022, 12, 10317. [Google Scholar] [CrossRef]
Figure 1. PSD of binder materials.
Sustainability 15 16139 g001
Figure 2. Test setup for concrete hydration heat development.
Sustainability 15 16139 g002
Figure 3. Schematic drawing of the thermal conductivity and specific heat test setup.
Sustainability 15 16139 g003
Figure 4. Analyzed mass concrete with the applied finite element mesh.
Sustainability 15 16139 g004
Figure 5. Compressive strength of concrete at different ages.
Sustainability 15 16139 g005
Figure 6. Splitting tensile strength of concrete at different ages.
Sustainability 15 16139 g006
Figure 7. Flexural strength of concrete at different ages.
Sustainability 15 16139 g007
Figure 8. The heat of hydration development for LHHPC mixes.
Sustainability 15 16139 g008
Figure 9. SEM and EDX analyses results for mixes (a) control and (b) FA-40.
Sustainability 15 16139 g009
Figure 10. Temperature variation at the center of the concrete block (FEM results).
Sustainability 15 16139 g010
Figure 11. Maximum temperature difference between concrete center and outer surfaces.
Sustainability 15 16139 g011
Figure 12. Comparison between experimental and FEM temperature variation at the center of the concrete block.
Sustainability 15 16139 g012aSustainability 15 16139 g012b
Table 1. The compositions of the cementitious materials.
Component SiO2Al2O3Fe2O3CaOMgOSO3Na2OK2OGGBS
CEM III20.64.92.865.142.23.50.560.350%
Fly ash63.7721.69.63.21.20.10.530.45-
Table 2. The compositions of concrete mixtures (kg/m3).
Mix IDCEM IIIFly AshQuartz PowderSandDolomiteWaterSP
Clinker GGBS
Control 225225022554010801659
FA-102002005022554010801659
FA-201801809022554010801659
FA-30157.5157.513522554010801659
FA-4013513518022554010801659
Table 3. Thermal conductivity and specific heat capacity of LHHPC.
PropertyControlFA-10FA-20FA-30FA-40
Thermal conductivity λ0 [W/(mK)]3.513.593.673.753.83
Specific heat capacity cb0 [106 J/(kg·K)]0.7300.7250.7170.7090.700
Table 4. The percentage of elements in the control and FA-40 mixes.
ElementPercentage %
ControlFA-40
CaO44.6332.83
SiO253.4565.24
Al2O30.931.41
Fe2O30.990.52
Disclaimer/Publisher’s Note: The statements, opinions and data contained in all publications are solely those of the individual author(s) and contributor(s) and not of MDPI and/or the editor(s). MDPI and/or the editor(s) disclaim responsibility for any injury to people or property resulting from any ideas, methods, instructions or products referred to in the content.

