Article

Deep-Learning-Based Anti-Collision System for Construction Equipment Operators

1
Smart Construction Promotion Center, Korea Institute of Civil Engineering and Building Technology, Goyang-si 10223, Republic of Korea
2
Research and Development Center, Youngshine, Hanam-si 12939, Republic of Korea
3
Eco Smart Solution Team, SK Ecoplant, Jongno-gu, Seoul 03143, Republic of Korea
*
Author to whom correspondence should be addressed.
Sustainability 2023, 15(23), 16163; https://doi.org/10.3390/su152316163
Submission received: 5 September 2023 / Revised: 30 October 2023 / Accepted: 7 November 2023 / Published: 21 November 2023

Abstract

:
Due to the dynamic environment of construction sites, worker collisions and stray accidents caused by heavy equipment are constantly occurring. In this study, a deep learning-based anti-collision system was developed to improve the existing proximity warning systems and to monitor the surroundings in real time. The technology proposed in this paper consists of an AI monitor, an image collection camera, and an alarm device. The AI monitor has a built-in object detection algorithm, automatically detects the operator from the image input from the camera, and notifies the operator of a danger warning. The deep learning-based object detection algorithm was trained with an image data set composed of a total of 42,620 newly constructed in this study. The proposed technology was installed on an excavator, which is the main equipment operated at the construction site, and performance tests were performed, and it showed the potential to effectively prevent collision accidents.

1. Introduction

Due to its complex and dynamic environment, in a construction site, a high number of collision accidents between workers and heavy equipment occur every year and have drawn great attention from many researchers to provide various safety measures [1,2,3,4]. Currently, the safety inspection in a construction site is manually managed, which has limitations in monitoring a vast area in real-time [5]. Moreover, it is difficult to respond rapidly in case of an accident. Therefore, in order to overcome such limitations, by using various sensor technologies, a proximity warning system (PWS) has been adopted in recent days. In general, PWS provides a warning or alarm when equipment and a worker are within a certain distance from each other. Along with the alarm feature, an emergency stop function (E-Stop) is often included, which allows a machine to automatically pause upon danger [6].
Collision accidents that occur at construction sites are basically caused by the failure to find workers approaching from blind spots that are caused by the limited visibility of equipment operators. The proximity warning system detects the proximity between the equipment and the operator in advance and induces the operator to avoid it through an alarm to prevent potential collision accidents. NIOSH of the United States evaluated the proximity warning system for mining equipment and proved that various sensor-based proximity sensing technologies are effective in detecting obstacles in the blind spot of mining equipment [7].
In general, a proximity warning system consists of a sensor that detects objects around the equipment and a warning device that provides an audible or visual alarm to the equipment operator or proximity worker. The proximity warning system can be classified into a tag-based approach and a non-tag-based approach according to the object detection method. The tag-based approach mainly uses Global Positioning System (GPS), Radio-frequency identification (RFID), or Ultra-wideband (UWB) for object detection while the non-tag approach mainly utilizes radio detection and ranging (Radar), Light Detection and Ranging (LiDAR), and video cameras for the object detection. Each technology used for object detection has its own characteristics, and it is a key to select and use a technology suitable for the application environment. The main considerations in the selection of a proximity warning system include cost, detection range, and object identification.
GPS can collect absolute location data of objects and can detect wide areas. However, its performance cannot be guaranteed when the signal is blocked by the surrounding buildings and the equipment is often expensive. RFID attaches an inexpensive tag to a worker’s hardhat and can effectively detect a pedestrian approaching a blind spot around the equipment through an RFID antenna. However, the possibility of misdetection and the inconsistent detection range also exist according to the physical orientation of the RFID antenna and tag [8]. UWB has the advantages of fast and easy installation and a relatively wide detection range with 360-degree directions [9]. On the other hand, the cost of the required UWB tag is relatively high (about USD 100), and the total cost increases dramatically when multiple workers are involved in a project. Although the tag-based proximity warning system has the advantage of detecting an object with high accuracy, radio frequency tags (RF-tags) are required for the detection. Otherwise, it is impossible to detect non-tagged unspecified pedestrians. Moreover, it is difficult to maintain the distributed RF tags in optimal conditions.
Among the non-tag-based approach, Radar is one of the widely used technologies for obstacle detection, and it is not affected by atmospheric conditions and can detect unspecified objects [10]. Radar has a wide enough detection range for use in proximity warning systems, but it is difficult to identify objects, therefore it is not suitable for construction sites. In the case of LiDAR, it is possible to provide information to a driver by creating high-resolution images of the surrounding equipment environment. However, in order to generate a precise image, a multi-channel LiDAR sensor is required which is limited in wide application due to high cost. In the case of a video camera, image information that can visually determine objects is provided. However, if the video camera is solely used, the user must check the possibility of collision between the machine and the operator in real-time. Since it is difficult to monitor approaching workers in real-time while working on heavy equipment, an object detection technique that automatically identifies objects and provides appropriate warning alerts is required.
The purpose of this study is to overcome the limitations of the existing proximity warning systems (including ultrasonic, RFID, UWB, radar, and video camera) and to monitor the blind spots around the equipment in real-time by developing a deep learning-based proximity warning system. The system proposed in this study contains (1) an artificial intelligence (AI) monitor, (2) a camera, (3) an alarm device, (4) a convolutional neural network (CNN) [11] based object detection method and (5) a training dataset. The AI monitor was developed as an embedded system in consideration of ease of installation and maintenance and expandability to various equipment. In addition, in order to improve the performance of the CNN-based object detection model, a dataset was constructed by collecting images of workers in various environments. In the proposed system, the camera and alarm system are mounted on the outside of the equipment and connected to the AI monitor installed in the equipment cabin. The AI monitor uses the image input from the camera to automatically detect the operator and notify the operator of danger (including visual and audible alarms). At the same time, it transmits an object detection signal to the alarm device, and the alarm device spreads the danger to approaching workers. The proposed deep learning-based warning system has the potential to prevent collision accidents caused by blind spots around heavy equipment at construction sites in a cost-effective manner while improving existing technologies. The system developed in this paper can be applied to all equipment operating at the construction site, but in this study, performance tests were limited to the excavator.

2. Literature Review

2.1. PWS

The PWS can be divided into a tag-based approach and a non-tag-based approach according to the object detection method. The tag-based approach requires physical tags that interact with the sensor which detects an object. The non-tag-based approach is used by the sensor alone and can detect unspecified objects. In this section, an extensive literature review was conducted on proximity warning technology using various technologies.

2.1.1. Tag-Based PWS

RFID Technology: An RFID-based PWS is generally composed of an RFID reader, a RFID tag, and an alarm device. The basic communication principle of the RFID system is based on radio waves which exchange data through the antennas in the RFID-tag and the RFID-reader. Based on the principle, the RFID reader is mounted on the equipment, and the RFID tag is attached to the object. Since RFID tags are inexpensive and come in various sizes, they can be attached to any object such as hard hats for a worker, and their effectiveness was tested [10]. NIOSH proved through this test that RFID technology is effective in detecting objects such as people or vehicles approaching the blind spot around the equipment [10]. Ruff and Hession-Kunz [8] suggested that the following two major issues should be improved in order to improve the performance of the RFID-based PWS.
(1) The RFID antenna misses the RFID tag in the proximity of the equipment due to the movement of the RFID-tag-attached object such as bending motion;
(2) The RFID tag is missed due to nulls in the field within the range of the RFID antenna.
In addition, in the case of RFID tags, maintenance is difficult because sufficient durability is not guaranteed to be used in a harsh environment such as a construction site.
UWB Technology: UWB-based PWS, a kind of RF (radio frequency) technology, is a vehicle device (same role as RFID reader) mounted on equipment, and an object device (same role as an RFID tag) distributed to detection targets.) and an alarm device. Jo et al. [6] proposed a robust construction safety system (RCSS) to which UWB technology was applied, and tests were performed on excavators, dump trucks, and forklifts at actual construction sites. The system they proposed propagates a hazard warning when a worker with an object tag approaches the vehicle-tag-mounted equipment (about 10 m). Similarly, Teizer et al. [4] presented a proximity warning system consisting of a personal protection unit (PPU) and an equipment protection unit (EPU) using very-high frequency (VHF) active radio frequency technology near 700 Mhz and performed a performance test. PPU is composed of a chip, battery, and alarm, and EPU is composed of a single antenna, reader, and alarm. Marks and Teizer [9] presented a test and evaluation method for the reliability and effectiveness of RF-based PWS at the construction site. The PWS they applied in their study used a secure wireless communication line of very high frequency (VHF) near 434 MHz. Compared with RFID, UWB technology has the advantages of a wide detection range and high accuracy [12]. On the other hand, UWB-based PWS, like RFID, has the following major problems when applied to large-scale construction sites due to the object tag distributed to all detection targets.
(1) Unlike RFID tags, object tags use expensive UWB sensors, so it is difficult to apply to all objects due to economic problems.
(2) In the case of an object tag, it must be made small so that workers do not feel uncomfortable, and there is a limit to the amount of battery. Therefore, it is necessary to periodically monitor whether the battery is charging or not, and the task of the safety manager (e.g., collection-charge-distribution) is added.
Therefore, when applying UWB technology, it is important to design an optimal design based on the weight of the object tag and the battery, and it is necessary to train workers to directly charge the battery.
GPS Technology: GPS is a technology that uses satellite signals to identify three-dimensional coordinates and is used in various fields for an object’s location tracking [13]. Nieto [14] proposed a real-time proximity warning and 3-D mapping system, and in this study, GPS technology was applied to the PWS. The proposed system builds a virtual mine map and can monitor the position of mining equipment with GPS [15,16,17]. In the case of GPS-based PWS, the precision of positioning is most important. In general, for positioning using GPS, there are various types and equipment depending on the method, and accordingly, there is a difference in accuracy. When precise location data is required, the Real-time kinematic (RTK) method is applied, but there is a limit to applying it as a PWS because the equipment is expensive. Table 1 shows the main features and related research of the tag-based PWS.

2.1.2. Non-Tag-Based PWS

Radar Technology: Radar emits electromagnetic radiation and analyzes the energy that hits the object and is reflected back to obtain information about the target, such as the object’s distance, speed, and direction. Since this radar technology is not affected by weather conditions (including rain and snow), it is widely used in the field of object detection. A researcher at NIOSH in the United States conducted an effectiveness test of a total of four different Radar-based proximity warning systems (PWS) on a 50-ton-capacity dump truck [10]. In addition, they improved the system (including video camera) and performed performance tests by adding a 240-ton-capacity dump truck [25]. Through this test, they judged that if the Radar system solves some problems, it will be able to show suitable performance as a proximity warning system. First, in the case of a radar system, the mounting angle of the radar is important for detecting an object. Therefore, it was announced that finding an appropriate mounting location for the characteristics of the equipment is one of the major issues. Next, in the case of Radar, the possibility of frequent false alarms is high because objects cannot be identified (e.g., high walls or buildings). In order to improve this, Ruff [26] recommends using an additional technology such as a video camera that can identify objects in the case of the radar system by fusion. Choe et al. [27] and NIOSH researchers [28] presented a test method for Radar-based PWS.
LiDAR Technology: Similar to Radar, LiDAR is a technology that can detect the distance, direction, and speed of an object by shining a laser on the target. Using LiDAR, it is possible to create high-resolution three-dimensional models of objects and terrain that reflect width, distance, and height. For this reason, it is mainly used in the field of autonomous vehicles and spatial information. Unlike radar, it is affected by weather conditions (including rain and snow) and uses an expensive multi-channel LiDAR sensor, so it is not widely used as a PWS to prevent collision accidents at construction sites.
Video Camera Technology: A video camera provides visual information of objects in the blind spot of the equipment. In this respect, the video camera is judged to be the most ideal technology to be used in PWS. However, if only a video camera is used, a problem arises that the operator of the equipment has to continuously check the monitor, unlike other technologies. It is very difficult to check the monitors while operating the equipment in real-time, which puts you at a high risk of potential collisions. Therefore, rather than using a video camera alone, it should be applied together with technology (including UWB or Radar) that automatically detects the approach of an object and notifies an alarm. The grafting of deep learning-based object detection technology [29], which has been used in various fields recently, is one of the good solutions. If the deep learning-based object detection algorithm is applied, it is possible to automatically detect objects approaching the equipment using the image transmitted from the camera and provide an alarm signal in real-time. Recently, various studies have been underway to apply deep learning-based object detection technology to the construction field [30,31,32,33]. Table 2 shows the main features and related research of the Non-tag-based PWS.

2.2. Object Detection Based Deep Learning

CNN, a type of deep learning, is mainly used to process image or video data. LeCun et al. [37] introduced early CNNs. After that, with the advent of AlexNet [38], state-of-the-art technology was greatly improved through various studies on performance improvement [39]. The CNN-based image processing technology, with its significant advancement in computer hardware technology like GPUs, has demonstrated excellent performance in areas such as object classification, object detection, and object segmentation [40].
In general, the CNN-based object detection model is largely composed of a Backbone–Neck–Head structure. In the case of the back-bone part, VGG [41] and ResNet [42] are included as representative feature extractors for generating a feature map using an input image. In the case of the neck part, it is the part that connects the backbone and the head and is mainly inserted to improve the performance of the deep learning model. In the case of Neck, it plays the role of refinement and reconfiguration to generate a feature map containing rich information. The Head (Dense or Sparse prediction) part is used to predict the bounding box using the extracted feature map or to classify the class of the object in each box. In dense prediction, the prediction of object class and bounding box is performed at the same time, and in sparse prediction, two operations are performed separately. At this time, when dense prediction is a head, it becomes a one-stage detector, and when sparse prediction is a head, it becomes a two-stage detector. R-CNN [43,44,45], Fast R-CNN [46,47], and Faster R-CNN [48] are representative models of two-stage detectors.
In this study, the one-stage detector YOLO model is applied, and the main features of the YOLO model are as follows. YOLO-v1 [49] is a model that integrates individual elements of object detection into a single neural network, enabling near-real-time object detection. YOLO-v1 is based on Goog-LeNet [50] and consists of 24 convolution layers and 2 fully-connected layers (FCL). The base network of YOLO-v1 can process 45 frames per second (FPS) on Titan X GPU. YOLO-v1 is a very effective algorithm for real-time object detection system implementation due to its relatively high accuracy and fast processing speed. YOLO-v2 [51] is an improved model of YOLO-v1, which balances object detection speed and accuracy. YOLO-v2 has added 10 elements to improve the performance of the existing YOLO-v1. YOLO-v2 uses a CNN network called DarkNet-19 as a feature extractor, and the last two fully connected layers (FCL) are changed to a convolution layer. In addition, in YOLO-v2, multi-scale training is possible by using images of various sizes (small-size image = 320 × 320, large-size image = 608 × 608) as input. YOLO-v3 [52] extended from DarkNet-19 to DarkNet-53, which consists of 53 convolution layers, and used a deep learning model with a deeper layer as a feature extractor. In Darknet-53, the skip connection concept proposed in ResNet [42] used in Darknet-19 was applied. YOLO-v3 changed the network structure by applying a method similar to the concept of the feature pyramid network (FPN) [53]. Through this, the bounding box is predicted at three different scales (13 × 13, 26 × 26, 52 × 52) through a series of processing, and multi-scale feature maps are extracted.

3. Deep Learning-Based Anti-Collision System

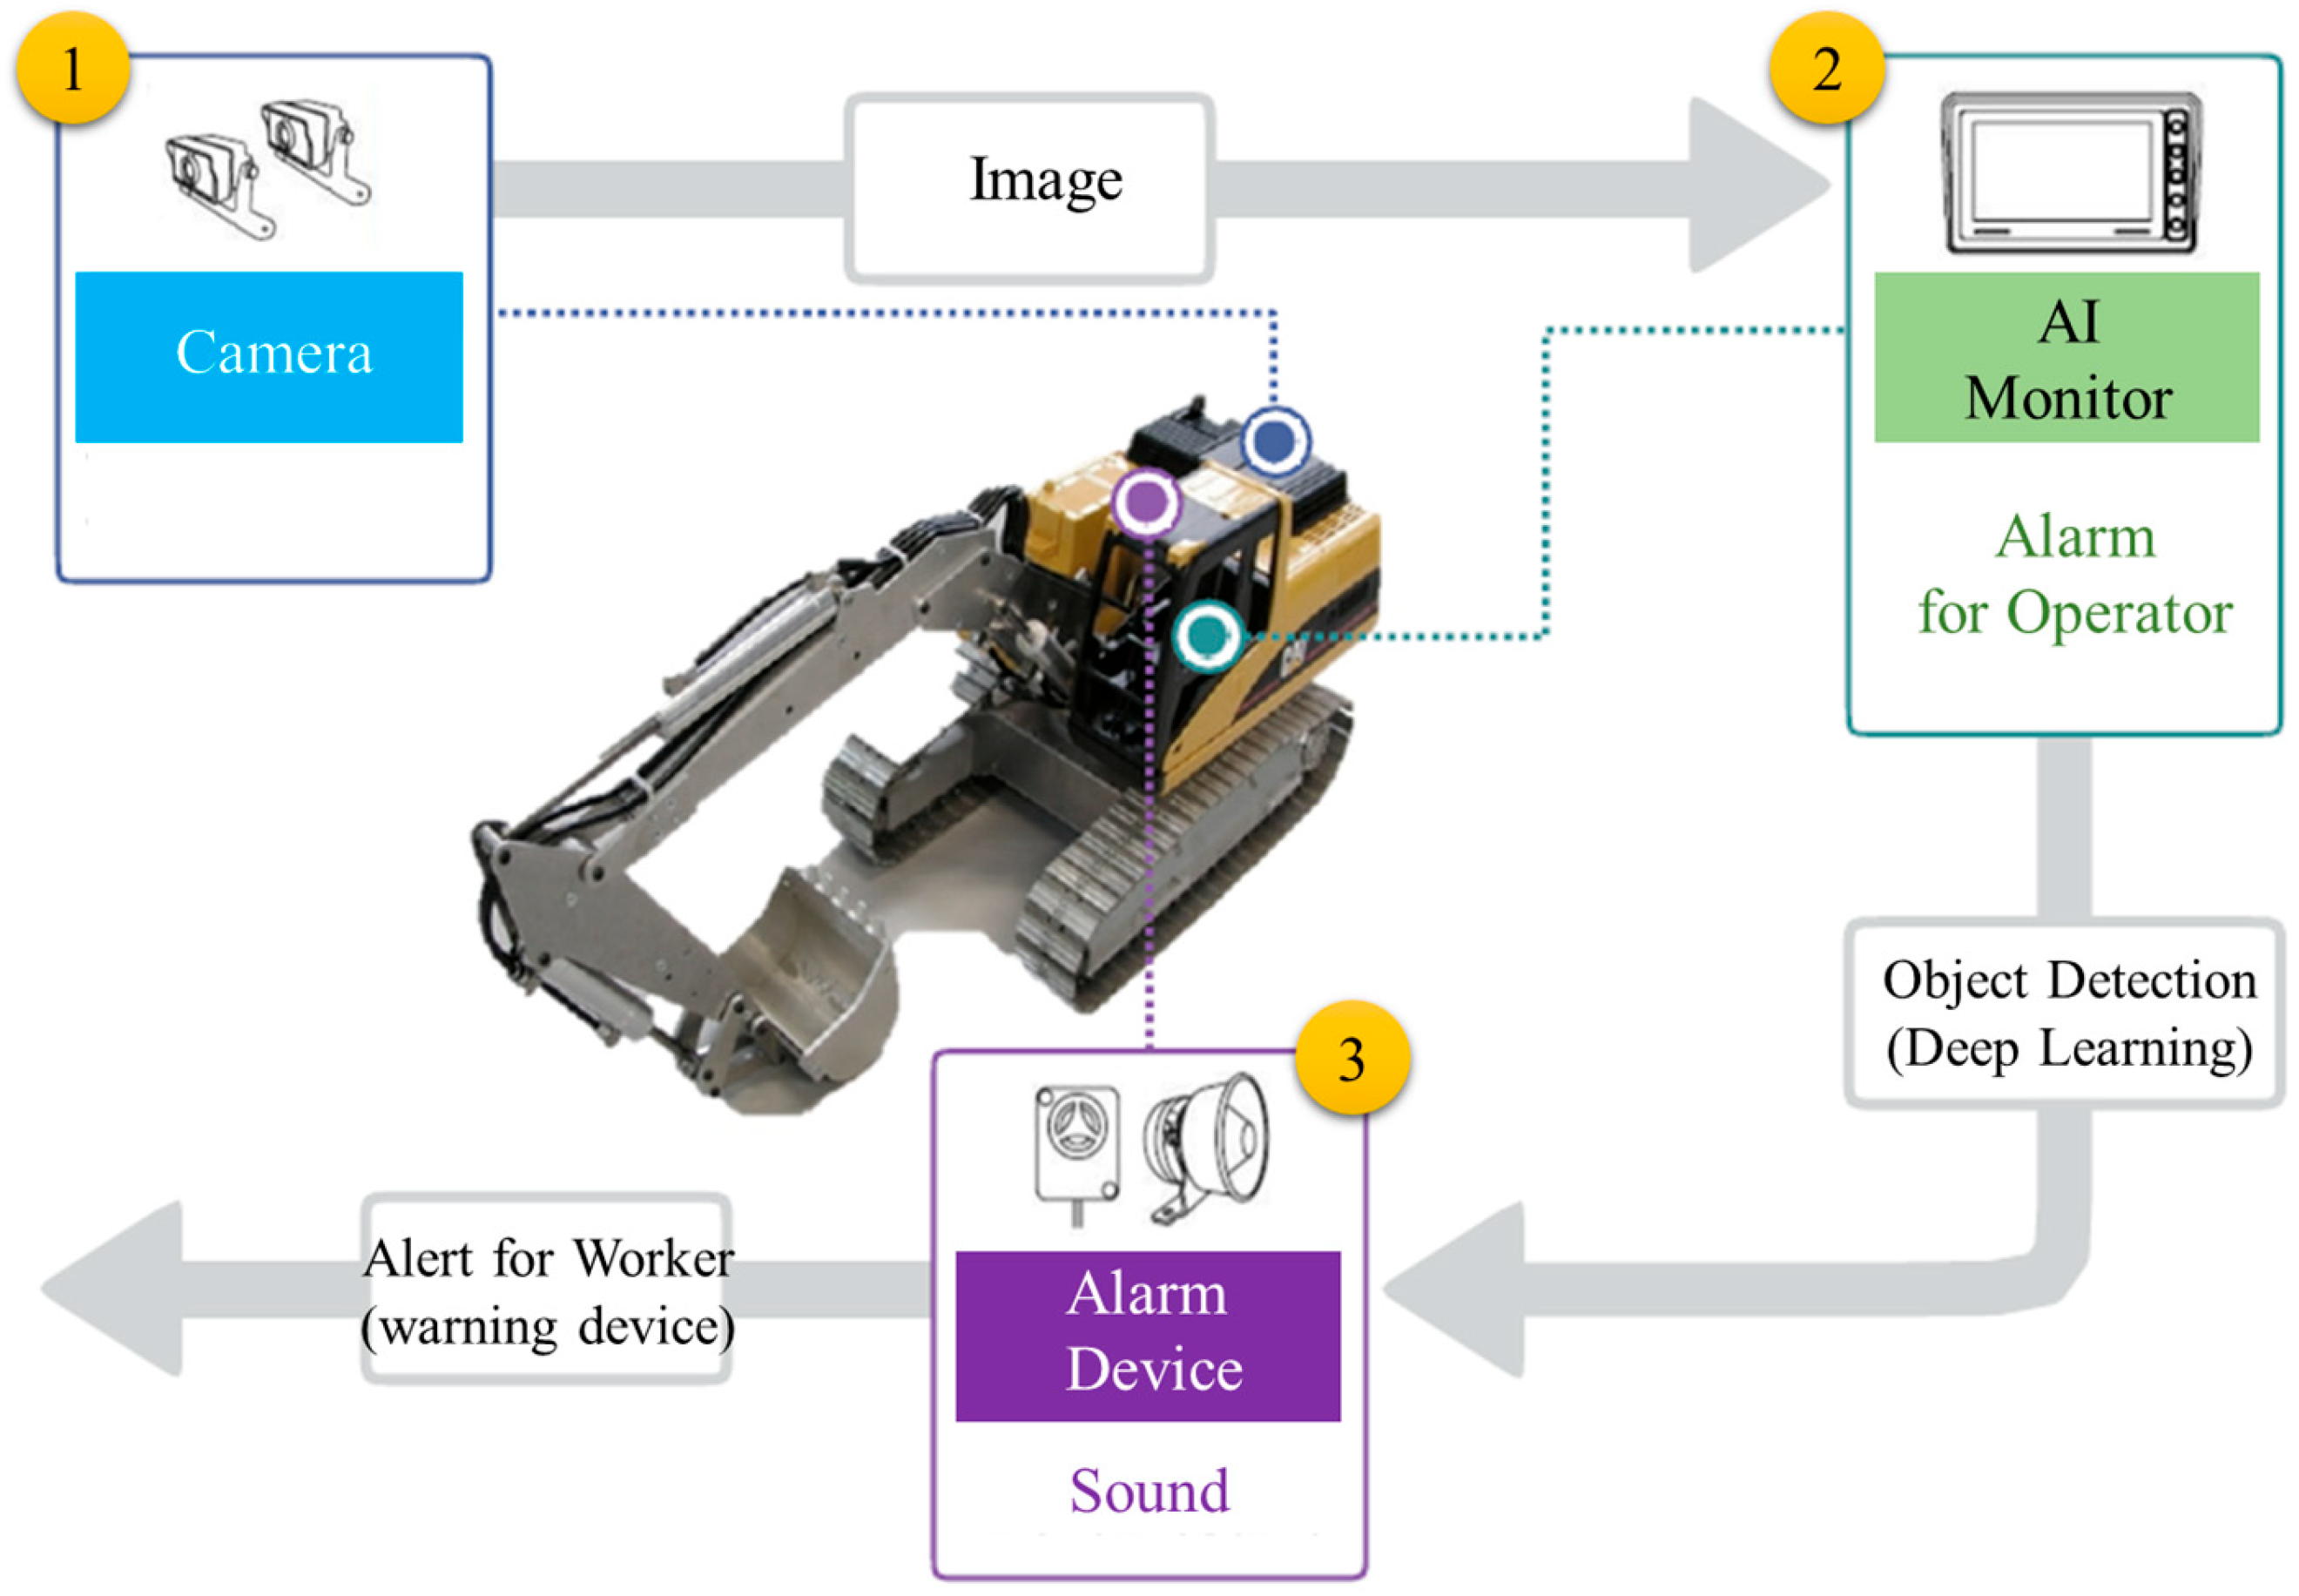
3.1. Overview of the Proposed System

As already mentioned, in this study, a deep learning-based anti-collision system is used to prevent collision accidents between workers and heavy equipment that often occur at construction sites. The proposed system is largely installed on the outside of the equipment to collect images of blind spots (blind area), an AI monitor installed in the equipment cabin, and an AI monitor that allows the operator to monitor the surroundings in real time, and equipment. It consists of an alarm device that propagates an alarm to nearby workers (see Figure 1). An AI monitor has a built-in deep learning algorithm for object detection, and can automatically classify and detect workers from the background through the image input from the camera. In addition, since the operator cannot concentrate on the monitor while the equipment is in operation, it effectively informs the position of the approaching operator through a visual and audible alarm. Figure 1 depicts the concept of the proposed system.

3.2. Object Detection Algorithm

3.2.1. Transfer Learning

In general, a large amount of data is required to train a CNN-based deep-learning model. However, it takes a lot of time and money to build such data. To solve this problem, transfer learning [54] is used. In general, when training a large-scale deep learning model, if it is newly trained from scratch, a problem of slow speed occurs. In this case, when there is an existing similar deep learning model, if the existing model is reused, it can be trained quickly with a small amount of data. Transfer learning is a machine learning technique that uses a model trained in a field with a large amount of data (including weights or feature extractors) to create a model for a field with insufficient training data. As described above, using transfer learning, it is possible to train a model with excellent performance in a short time while using a smaller amount of training data than when creating a new deep-learning model. In this paper, the pre-trained YOLO-v4 network [55] was reused to create a deep learning model for detecting workers in the construction site and trained by applying the transfer learning technique.

3.2.2. YOLO-v4

YOLO-v4 [55] is a state-of-the-art real-time object detection that maximizes the performance of YOLO by applying various techniques that can improve the accuracy of deep learning. (Object detection) model. The authors of YOLO-v4 categorized methods for improving model performance into two groups: Bag of Freebies (BoF) and Bag of Specials (BoS). They applied these techniques to YOLO to assess their impact on performance.
First, BoF refers to techniques that improve model performance by changing a training method or increasing a training cost without changing a computation resource required for inference. BoS refers to techniques that can increase the accuracy of object detectors by increasing inference cost and consists of ideas applied in the inference process. As such, YOLO-v4 is an object detection model that improves the performance of the model by applying the BoF method, which is a factor involved in training, and the BoS method, which is involved in inference. Table 3 summarizes the techniques applied to YOLO-v4.

Bag of Freebies

In this section, the main BoF techniques applied to the backbone and detector of YOLO-v4 are summarized.
BoF for backbone: YOLO-v4 applies a data augmentation technique to increase the variability of image data for training and to make the designed model have high robustness to various images. First, the CutMix [57] technique, which creates a new image by combining two images, was used. The CutMix data augmentation technique cuts out a part of the original image and replaces this part with a patch from another image. After that, you can adjust the Ground Truth (GT) label according to the ratio of the patch size. This CutMix shows higher performance than CutOut [69] and Mixup [70], which have been widely used in the past [57]. Also, unlike CutMix, which uses two images, a new data augmentation called Mosaic [55] that combines four images was proposed. Using Mosaic, the effect of learning four different images from one image can be obtained, so the size of the batch size can be reduced [55]. YOLO-v4 uses label smoothing to solve the overconfidence problem. Label smoothing was described by Szegedy et al. [59]. Generally, the GT label is assigned a value of 0 or 1. When the label is assigned a value of 1, the GT label has 100% confidence (=1.0) for a specific class. Since the data used for learning are annotated by humans, there is a possibility of mistakes, and this may cause mislabeling problems in the existing labeling method. Label smoothing can solve this problem by giving the label value smooth rather than 0 or 1 [58]. There are several methods for label smoothing, but in YO-LO-v4, it is implemented by simply changing the label from 1.0 to 0.9 at once. In YOLO-v4, DropBlock [60] was used to solve the overfitting problem of the designed model. In the case of DropOut [71], which is one of the regularization methods, arbitrary independent features are dropped. On the other hand, DropBlock shows better performance than DropOut by dropping contiguous regions around the feature [60].
BoF for Detector: YOLO-v4 adds the Self-Adversarial Training (SAT) method as a type of data augmentation [55]. SAT consists of two steps, and it prevents the designed model from detecting the object by applying an adversarial attack to the input image. After that, the model is made robust by learning with the perturbed image. In YOLO-v4, Cross-Iteration Batch Normalization (CBN) [64] modified Cross mini-Batch Normalization (CmBN) was applied as the batch normalization [72] method.

Bag of Specials

In this section, the main BoS techniques applied to the Backbone and Detector of YOLO-v4 are summarized.
BoS for backbone: In YOLO-v4, CSP [62] was applied to the existing DarkNet-53, improved to CSPDarkNet-53, and used as a feature extractor. The main purpose of CSP is to maintain the accuracy of the model and to reduce the computation cost required for inference [62]. In general, when training a deep network, as the layer gets deeper, gradient vanishing problems occur, which leads to a decrease in performance [42]. To improve this problem, ResNet [42] solved the problem of gradient vanishing as the layer deepens through residual learning using the skip connection concept. DensNet [73] further extended the skip connection concept and presented a structure that connects the feature maps of all layers. However, by connecting all the layers, a lot of gradient information is repeatedly used. By using CSP, redundant use of excessive gradient information can be prevented and the performance of the model can be improved. In other words, it is possible to reduce the computation cost by preventing the gradient information from increasing while maintaining the advantages of DensNet.
In a CNN model, it is important to apply an appropriate activation function because the output value varies depending on which activation function is used. In YOLO-v4, Mish [61], which improved the accuracy of both CSPDarkNet-53 and the detector, was used as the activation function through investigation and comparison experiments on various existing activation functions.
BoS for Detector: Detecting multi-scale objects is one of the important issues in the field of object detection. The existing CNN-based object detector compresses features at a time and uses the compressed features in the final layer (using one scale extracted from the uppermost layer). In addition, features were independently extracted from each level and used for object detection, but in this case, the features of the upper layer are not reused.
FPN [53] was proposed to effectively detect objects of various sizes by including high-level feature information at all scales. FPN inputs single-scale images of arbitrary size to CNN and outputs feature maps of different scales through the process of bottom-up pathway, top-down pathway, and lateral connections. In addition, since higher-level information is reused, multi-scale features can be effectively utilized. In YOLO-v3, this FPN concept was applied to DarkNet-53.
In YOLO-v4, PAN [68] with extended FPN was used for the detection neck. Briefly, PAN is a structure in which a bottom-up pathway is added to the FPN backbone. Shortcuts (composed of less than 10 layers) allow low-level features to be delivered to high-level through shorter paths. Existing FPN extracts features from each level independently for object detection and uses them, but PAN integrates features of all scales in the final decision-making stage.

3.3. Training Dataset

Typically, image datasets are used as standard evaluation data for training and assessing the performance of CNN models that can be applied in various computer vision fields, including object classification, object detection, and object segmentation. Therefore, the rich image dataset is one of the main factors determining the performance of the CNN model [74]. So far, a large-scale benchmark database that includes workers from construction sites or industrial sites has not been established. Existing benchmark datasets [75,76,77,78] mainly include pedestrians or crowded persons in everyday life. For this reason, in the case of conventional large-scale benchmark data, it is not suitable as a training dataset for worker detection in a special situation of a construction site. Recently, some researchers [30,79,80] in the construction field have made small-scale data as needed and used it for research, but they are not easily accessible, and the form of data (including object class, background, object size, and viewpoint) are also different. Therefore, in this study, a data set that can be applied to the proposed system and that can learn and evaluate worker detection in various construction sites was newly created, which is called Industrial Worker Dataset-Construction (IWD-C). named.

3.3.1. Popular Image Dataset

PASCAL Visual Object Classes (VOC) [76]: The data set used in the PASCAL VOC challenge contains images of 20 object categories. The PASCAL VOC challenge was conducted from 2005 to 2012 as a competition to evaluate the performance of object class recognition in the field of computer vision.
MS COCO Dataset [78]: This data set comprises the most widely used data for performance evaluation of recent object detection models, including images of 91 common object categories. The MS COCO data set consists of 328 k images and includes 20 object categories of the PASCAL VOC data set.
ImageNet Dataset [75]: ImageNet is a representative large-scale dataset in the field of computer vision and is a dataset used in the ImageNet Large Scale Visual Recognition Challenge (IL SVRC). ILSVRC is a competition to evaluate the performance of algorithms for image classification and object detection, similar to the PASCAL VOC challenge.
KITTI Dataset [77]: The KITTI dataset is designed to evaluate vehicle, pedestrian, and sign/pole detection algorithms in the field of autonomous driving. The KITTI data set consists of image data collected from various sensors, including high-resolution cameras and 3D laser scanners.

3.3.2. Industrial Worker Dataset-Construction (IWD-C)

In general, the easiest way to build a training data set is to crawl and download websites using a search engine such as Google. However, search engine-based images include size, resolution, background, and dynamic and appropriate information on the site to which the proposed system is applied (including images collected from cameras mounted on construction equipment). Including camera angle), the algorithm can be biased. Therefore, in this study, an image dataset suitable for the developed system was newly constructed. Figure 2 shows the learning data set acquisition process in this study.
First, an image was extracted from the video collected by attaching a camera (resolution = 1280 × 720, frame rate = 30 FPS) to the outside of the construction equipment operating at the construction site. Images are saved during the operation time of the equipment in units of 10 s. That is, 300 images (10 s × 30 FPS) can be extracted from one image. Each image was judged suitable for labeling and used as training data. Video data collection was carried out by installing 30 cameras on 15 construction equipment (2 cameras per equipment) at a total of three construction sites. A total of 1,156,634 images were collected, and 57,228 objects (workers) were selected as final learning data from a total of 42,620 images through filtering. Table 4 summarizes the image data collected in this paper.
The collected image data was labeled using Image Marker, a self-made work tool (see Figure 3). Using Image Marker, labeling can be carried out easily with just a click of a mouse, and it can be converted into various formats such as YOLO, KITTI, VOC, and COCO. Table 5 shows a part of the training data set constructed in this study.

3.4. Implementation of the Proposed System

3.4.1. Hardware Description

Figure 4 shows the hardware configuration of the proposed system. Deep-learning-based anti-collision system consists of two cameras for image collection, a device connector that can be linked with an additional external device, an alarm device, and an AI monitor. All components are connected through cables with AI monitors that perform the object detection role, which is the core function of the proposed system. A deep-learning-based anti-collision system is designed to continuously receive power through a external power (or auxiliary battery) to prevent discharge during operation. The AI monitor is installed inside the equipment, so the transmission range of the approach alarm is limited only to the operator. Therefore, an additional alarm device is required to disseminate an alarm to workers around the equipment. The AI monitor is designed to be linked with various alarm devices through the device connector. The proposed system can be used in conjunction with alarm devices using two methods. The first method involves interlocking through the splitter cable depicted in Figure 4. This method entails connecting wires between splitter cable and the alarm devices. However, the wire-to-wire connection method can be inconvenient and may lead to malfunctions caused by poor contact. The second method involves interlocking through the device connector. This method requires the design of a customized device but offers the advantage of easy system connection. Table 6 summarizes the main functions and specifications of each device.

3.4.2. NVIDIA Jetson Nano for Inference

For object detection inference of AI monitors, the NVIDIA Jetson Nano platform, a small artificial intelligence (AI) computer, was used [81]. Deep learning-based object detection algorithms require high computational costs, and Jetson Nano is designed to support edge AI devices. Jetson Nano is also compatible with popular artificial intelligence frameworks such as Caffe, Keras, and TensorFlow. Table 7 shows the main specifications of Jetson Nano.
The proposed system performs deep learning inference on an AI monitor in real time. However, the training process requires more computational power compared to the inference process. Therefore, the deep learning model is trained in a separate workstation, and the trained model is applied to the Jetson Nano (see Figure 5).

3.4.3. User Interface of the AI Monitor

An AI monitor operates in three modes as shown in Table 8. First, it shows the image normally transmitted from the camera. The image output from the main screen can be displayed on a single-channel screen (image transmitted from CAM1 in Figure 4.) or divided into two channels. If a worker appears on the screen of the AI monitor, inference starts automatically and a red bounding box is created around the object. Finally, the red light blinks on the AI monitor’s main screen and the LED lamp, and the text-to-speech (TTS) danger message is propagated.

4. Evaluation

4.1. Bounding-Box Merging and Extension

In this paper, to improve the performance of the object detection model, IWD-C was again classified into three classes as shown in Figure 6. The reason for applying this method is (1) In the case of an anti-collision system, it is more important to reduce false negatives (FN) than false positives (FP), and (2) detect all true positives (TPs) so that there is no missing detection. This is important because of the specificity of the application environment of the anti-collision system, which can lead to a serious disaster when the TP is low and the FN is high. Therefore, in this study, the model was designed by constructing the training data to be sensitive to missing detection. In other words, the safety of the field was improved when the system was applied by determining that a worker was detected when even one of the three classes was detected.
When three classes are applied in the object detection model, each worker instance is displayed as three different bounding boxes, which causes two issues. The first is to merge the three bounding boxes of the whole body, head, and upper body created for one worker into one in terms of usability. Another issue is that if only the head or bust is detected, the whole body instance cannot be obtained. To solve the first issue, a bounding-box merging technique that merges each bounding box into one when it is within a specific range was applied (see Figure 7). This merging technique is to avoid creating too many bounding boxes in the AI monitor and causing confusion to the equipment operator.
The coordinates ( x m i n , y m a x ) of the upper left point of the merged bounding box in Figure 7 can be obtained as shown in the following formula.
x m i n = x 1 ,     x 1 <   x 3 x 3 ,     x 1   x 3 ,   y m a x = y 3 ,     y 1 <   y 3 y 1 ,     y 1   y 3
In Equation (1), ( x 1 , y 1 ) and ( x 3 , y 3 ) represent the upper left coordinates of each bounding box. In a similar way, all coordinates of the bounding box that are merged can be obtained. The distance threshold of each box to be merged can be determined by IoU (Intersection over Union), and bounding-box merging is applied in all situations where boxes overlap. This is because, as described above, in the case of the Anti-Collision System, it is more important to determine the presence of workers around the equipment than to accurately measure the number of workers.
To solve the second issue, a method of extending the length of the bounding box was applied when detecting the head or upper body. As shown in Equation (2), the width and height of the bounding box were expanded so that the size of the bounding box was readjusted to resemble the whole body of the worker (see Figure 8).
B B o x w = B B o x h e a d _ w × k 1 , B B o x h = B B o x h e a d _ h × k 2
In Equation (2), B B o x w , B B o x h is the width and height of the final bounding box, B B o x h e a d _ w , B B o x h e a d _ h is the head’s bounding box width and height k 1 , k 2 represents an adjustment coefficient. You can adjust the size of the upper body’s bounding box in a similar way. Figure 9 shows the process of the bounding box merging and extension method.

4.2. Performance Evaluation

For the performance evaluation of the deep learning-based object detection algorithm, the most widely used con-fusion matrix-based mAP (Mean Average Precision) index was used. YOLO-v4 was implemented using Darknet, and the overall test environment is shown in Table 9 and Table 10.
By adding the IWD-C data and CrowdHuman dataset constructed in this paper, we divided the training set into 70%, the validation set 20%, and the test set 10% to perform training and performance evaluation of the object detection model. Table 11 shows the entire data set used for training.
As a result of the test, the upper body showed the highest performance at 91.3%, the whole body at 88.7%, and the head at 80.8% (see Table 12). The mAP is 86.9%, which shows sufficient performance to be applied to the an-ti-collision system. The object detection model presented in this paper has an advantage in terms of safety by design to increase the maximum performance (=91.3%) and improve missing detection (the alarm is propagated even when only one class is detected).

5. Field Test

In order to verify the performance of the proposed technology in an outdoor environment, a field test was performed at the Smart Construction Machinery Test Research Center site located in Gunsan, Jeollabuk-do (see Figure 10). The equipment used in the test was a 22-ton excavator, Doosan DX 220LC, and equipment from Korea Construction Equipment Technology Institute (KOCETI) was used. The tester was a male with a height of 180 cm.
The test was divided into (1) static test and (2) dynamic test. In the static test, the detection performance according to (1-1) Maximum Detection Distance and (1-2) camera angle and distance of the deep-learning-based anti-collision system were analyzed. In the maximum detection distance test, the detection performance of each point was measured by increasing the distance at intervals of 1 m from the detectable point with the camera installed on the back of the excavator (height 2.13 m from the ground) (see Figure 11a). At this time, the camera is fixed at a height of 2.13 m from the ground and an inclination of 30° from the horizontal. In the second test, the detection performance for each distance was analyzed in the range of 120° from the camera’s maximum field of view of 130°, excluding 5° at both ends. At this time, each measurement point is shown in Figure 11b.
The dynamic test simulates the environment in which workers wander around the excavator, (2-1) when moving back and forth at the rear of the excavator (see Figure 12a), and (2-2) when moving the excavator left and right (see Figure 12b). Detection performance was analyzed for both of these scenarios. At this time, the camera installation conditions were the same as those of the static test.
As an index for field test performance evaluation, the deep-learning-based anti-collision system was executed and operated for 1000 consecutive frames, and then the accurately detected frames were calculated and calculated as in Equation (3). Both the static test and the dynamic test used the same metrics to analyze the performance.
Detection   Rate % = T r u e   P o s i t i v e + T r u e   N e g a t i v e N u m b e r   o f   T o t a l   I m a g e   ( 1000 ) × 100  

5.1. Static Test

5.1.1. Maximum Detection Distance Test

Figure 13 shows the maximum detection distance test. You can check the appearance of the tester on the AI monitor of the anti-collision system for each distance. In the case of a proximity distance of 1 m to 2 m, an object is detected by the head and upper-body classes because a part of the body is omitted. As such, the classification of three classes is very useful for detecting workers in close distance.
Table 13 shows the overall test results. A detection rate of 100% was recorded from 1 m to 11 m for each distance. In the case of 12 m, it was found to be 83.2%, and in consideration of safety, it is judged that it is appropriate to use it within 10 m of the site.

5.1.2. Detection Performance Test According to the Camera Angle of View and Distance

Figure 14 shows the performance test according to the camera angle of view and distance. A tester was placed at each point and the performance was evaluated in the same way as the maximum detection distance test. At this time, the maximum distance for performance evaluation was limited to 10 m based on the previous test results.
Table 14 shows the overall test results. A detection rate of 100% was shown in all sections, except for recording a performance of 98.7% at a camera angle of view of 30°, and a distance of 1 m. It can be confirmed that the system proposed in this paper exhibits excellent object detection performance within a 120° field of view and 10 m distance from the position where the camera is fixed on the back of the excavator used in the test.

5.2. Dynamic Test

The dynamic test analyzed the performance by depicting the case where the worker roamed around the equipment. As shown in Figure 15, the object detection performance of the proposed system was tested while the tester moved back and forth and left and right to the predetermined position of the rear of the excavator. For the forward/backward movement test, the point is repeatedly moved from 1 m to 10 m, and in the case of the left/right test, the point of view of 30° to 150° is moved repeatedly (see Figure 15). The movement speed was 4 km/h, which is the average walking speed of the general public, and the performance evaluation was analyzed using Equation (3).
Table 15 shows the test results before and after. The object detection rate was 98.2%, which showed excellent detection accuracy even when workers wandered around the rear of the excavator.
Table 16 shows the left and right test results. The object detection rate was 99.1%, demonstrating sufficient detection ability even when the worker wanders left and right with a camera angle of view of 30° to 150° at a point 10 m behind the excavator.

6. Conclusions

6.1. Summary

In this study, a deep learning-based anti-collision system was developed to prevent collisions and stray accidents caused by heavy equipment at construction sites. The system proposed in this paper consists of a two-channel camera for image collection, an AI monitor with a built-in deep learning-based object detection algorithm, and an alarm device. The AI monitor analyzes the video input from the camera to automatically detect workers and broadcasts real-time alerts to heavy equipment operators. Through these alarms, the operator can stop the operation of the equipment and prevent accidents. In addition, the alarm device is installed outside the heavy equipment, and when it receives a signal from the AI monitor, it spreads a danger signal to the surroundings so that workers can avoid it in advance, effectively preventing collisions and stray accidents.
The performance of the object detection algorithm used in this deep learning-based anti-collision system is greatly affected by the learning data. Therefore, it is most important to configure data suitable for the use environment of the AI model. In this paper, 1,156,634 images were collected from a total of three construction sites, and an IWD-C composed of a total of 42,620 images for learning was constructed through selection. IWD-C was constructed by classifying workers into three classes and performing labeling work, and consists of 57,228 head, 58,089 upper-body, and 57,228 whole-body objects. An object detection model was developed by learning the pre-trained YOLO-v4 Network by adding the CrowdHuman dataset (consisting of 48,154 heads, 38,802 upper-body, and 72,318 objects) to the IWD-C constructed in this study. As a result of the performance test, it was found that mAP was 86.9% based on Threshold 0.5. Each AP showed performance of the head at 80.8%, upper body at 91.3%, and whole body at 88.7%.
Finally, performance verification was performed by installing a deep learning-based anti-collision system on a 22-ton excavator in an outdoor environment. In the field test, static test and dynamic tests were performed, and high accuracy was recorded in each test scenario. The technology proposed in this paper effectively prevents collisions and stray accidents that may occur in construction sites and dramatically reduces industrial accidents. It has enough potential to do that.

6.2. Future Research

The deep learning-based anti-collision system discussed in this paper was initially studied on an excavator but has the potential for application to all construction equipment. To adapt it to various construction equipment, the following steps are necessary: (1) analyzing equipment characteristics and working environments, (2) collecting appropriate training data, (3) data preprocessing, and (4) algorithm training. This paper’s system can be extended to all construction equipment by incorporating a learning model for each type and configuring the user interface to allow equipment selection. However, collecting and processing training data for all construction equipment is a resource-intensive task, and individual researchers may face limitations, such as the availability of diverse construction sites and equipment for prolonged usage. Therefore, government support is necessary to facilitate the integration and distribution of standardized equipment data.
To the best of the authors’ knowledge, there is currently no standardized performance testing method for the deep learning-based collision prevention system presented in this paper. In the absence of such a standard, some intelligent CCTV certification methods are adapted for conducting performance tests. However, unlike fixed-location CCTV systems, construction equipment is constantly in motion, and the working environment frequently changes. Therefore, the development of a standardized performance testing method that accounts for the dynamic working environment is of utmost importance.
The technique presented in this paper employs image recognition methods to detect workers approaching an excavator. However, these image recognition techniques are susceptible to weather conditions, such as snow and rain. To mitigate this issue, one approach is to integrate image recognition with radar technology, which enables precise distance measurement, addressing a limitation of video recognition technology. Nevertheless, the introduction of radar technology leads to increased construction costs. The cost of the system proposed in this paper is approximately USD 1000 per unit, and when radar technology is integrated, costs are expected to rise by over 50%, posing challenges in deploying the system in the field. To address these cost-related challenges, it is imperative to explore policy support options, such as the implementation of a shared procurement system that allows local governments or clients to purchase and lease smart safety devices in bulk, integrating advanced technologies such as AI and IoT.

Author Contributions

Conceptualization, Y.-S.L.; methodology, Y.-S.L. and D.-K.K.; validation, Y.-S.L. and D.-K.K.; formal analysis, Y.-S.L.; investigation, Y.-S.L. and D.-K.K.; resources, D.-K.K. and J.-H.K.; data curation, Y.-S.L. and D.-K.K.; writing—original draft preparation, Y.-S.L.; writing—review and editing, Y.-S.L. and J.-H.K.; visualization, D.-K.K.; supervision, Y.-S.L.; project administration, Y.-S.L.; funding acquisition, Y.-S.L. and D.-K.K. All authors have read and agreed to the published version of the manuscript.

Funding

This research was funded by the Ministry of Land, Korea Agency for Infrastructure Technology Advancement (KAIA), grant number RS-2022-00143285.

Institutional Review Board Statement

Not applicable.

Informed Consent Statement

Not applicable.

Data Availability Statement

The data used in this paper serves a business purpose and, due to confidentiality reasons, cannot be shared publicly.

Conflicts of Interest

The authors declare no conflict of interest.

References

  1. Jo, B.W.; Lee, Y.S.; Kim, J.H.; Khan, R.M.A. Trend Analysis of Construction Industrial Accidents in Korea from 2011 to 2015. Sustainability 2017, 9, 1297. [Google Scholar] [CrossRef]
  2. Kim, D.; Liu, M.; Lee, S.; Kamat, V.R. Remote proximity monitoring between mobile construction resources using camera-mounted UAVs. Autom. Constr. 2019, 99, 168–182. [Google Scholar] [CrossRef]
  3. Park, J.; Yang, X.; Cho, Y.K.; Seo, J. Improving dynamic proximity sensing and processing for smart work-zone safety. Autom. Constr. 2017, 84, 111–120. [Google Scholar] [CrossRef]
  4. Teizer, J.; Allread, B.S.; Fullerton, C.E.; Hinze, J. Autonomous pro-active real-time construction worker and equipment operator proximity safety alert system. Autom. Constr. 2010, 19, 630–640. [Google Scholar] [CrossRef]
  5. Kim, K.; Kim, H.; Kim, H. Image-based construction hazard avoidance system using augmented reality in wearable device. Autom. Constr. 2017, 83, 390–403. [Google Scholar] [CrossRef]
  6. Jo, B.-W.; Lee, Y.-S.; Khan, R.M.A.; Kim, J.-H.; Kim, D.-K. Robust Construction Safety System (RCSS) for Collision Accidents Prevention on Construction Sites. Sensors 2019, 19, 932. [Google Scholar] [CrossRef] [PubMed]
  7. Ruff, T. Recommendations for Evaluating and Implementing Proximity Warning Systems on Surface Mining Equipment; US Department of Health and Human Services: Washington, DC, USA, 2007. Available online: https://www.cdc.gov/niosh/mining/works/coversheet202.html#print (accessed on 5 September 2023).
  8. Ruff, T.M.; Hession-Kunz, D. Application of radio-frequency identification systems to collision avoidance in metal/nonmetal mines. IEEE Trans. Ind. Appl. 2001, 37, 112–116. [Google Scholar] [CrossRef]
  9. Marks, E.D.; Teizer, J. Method for testing proximity detection and alert technology for safe construction equipment operation. Constr. Manag. Econ. 2013, 31, 636–646. [Google Scholar] [CrossRef]
  10. Ruff, T.M. Test Results of Collision Warning Systems for Surface Mining Dump Trucks; US Department of Health and Human Services: Washington, DC, USA, 2000.
  11. Albawi, S.; Mohammed, T.A.; Al-Zawi, S. Understanding of a convolutional neural network. In Proceedings of the 2017 International Conference on Engineering and Technology (ICET), Antalya, Turkey, 21–23 August 2017; IEEE: Piscataway, NJ, USA, 2017. [Google Scholar]
  12. Cheng, T.; Venugopal, M.; Teizer, J.; Vela, P.A. Performance evaluation of ultra wideband technology for construction resource location tracking in harsh environments. Autom. Constr. 2011, 20, 1173–1184. [Google Scholar] [CrossRef]
  13. El-Rabbany, A. Introduction to GPS: The Global Positioning System; Artech House: New York, NY, USA, 2002. [Google Scholar]
  14. Vega, A.N. Development of a Real-time Proximity Warning and 3-D Mapping System Based on Wireless Networks, Virtual Reality Graphics, and GPS to Improve Safety in Open-Pit Mines; Colorado School of Mines Golden: Golden, CO, USA, 2001. [Google Scholar]
  15. Nieto, A.; Dagdelen, K. Accuracy Testing of a Vehicle Proximity Warning System based on GPS and Wireless Networks. Int. J. Surf. Min. Reclam. Environ. 2003, 17, 156–170. [Google Scholar] [CrossRef]
  16. Nieto, A.; Dagdelen, K. Development and testing of a vehicle collision avoidance system based on GPS and wireless networks for open-pit mines. Appl. Comput. Oper. Res. Miner. Ind. 2003, 31, 27–34. [Google Scholar]
  17. Nieto, A.; Miller, S.; Miller, R. GPS proximity warning system for at-rest large mobile equipment. Int. J. Surf. Min. Reclam. Environ. 2005, 19, 75–84. [Google Scholar] [CrossRef]
  18. Song, J.; Haas, C.T.; Caldas, C.H. A proximity-based method for locating RFID tagged objects. Adv. Eng. Inform. 2007, 21, 367–376. [Google Scholar] [CrossRef]
  19. Chae, S.; Yoshida, T. Application of RFID technology to prevention of collision accident with heavy equipment. Autom. Constr. 2010, 19, 368–374. [Google Scholar] [CrossRef]
  20. Lee, H.-S.; Lee, K.-P.; Park, M.; Baek, Y.; Lee, S. RFID-Based Real-Time Locating System for Construction Safety Management. J. Comput. Civ. Eng. 2012, 26, 366–377. [Google Scholar] [CrossRef]
  21. Kelm, A.; Laußat, L.; Meins-Becker, A.; Platz, D.; Khazaee, M.J.; Costin, A.M.; Helmus, M.; Teizer, J. Mobile passive Radio Frequency Identification (RFID) portal for automated and rapid control of Personal Protective Equipment (PPE) on construction sites. Autom. Constr. 2013, 36, 38–52. [Google Scholar] [CrossRef]
  22. Teizer, J. Wearable, wireless identification sensing platform: Self-monitoring alert and reporting technology for hazard avoidance and training (SmartHat). J. Inf. Technol. Constr. ITcon 2015, 20, 295–312. [Google Scholar]
  23. Jo, B.-W.; Lee, Y.-S.; Kim, J.-H.; Kim, D.-K.; Choi, P.-H. Proximity Warning and Excavator Control System for Prevention of Collision Accidents. Sustainability 2017, 9, 1488. [Google Scholar] [CrossRef]
  24. Enji, S.; Nieto, A.; Zhongxue, L. GPS and Google Earth based 3D assisted driving system for trucks in surface mines. Min. Sci. Technol. China 2010, 20, 138–142. [Google Scholar]
  25. Ruff, T. Test Results of Collision Warning Systems on Off-Highway Dump Trucks; US Department of Health and Human Services: Washington, DC, USA, 2000.
  26. Ruff, T. Evaluation of a radar-based proximity warning system for off-highway dump trucks. Accid. Anal. Prev. 2006, 38, 92–98. [Google Scholar] [CrossRef]
  27. Choe, S.; Leite, F.; Seedah, D.; Caldas, C. Evaluation of sensing technology for the prevention of backover accidents in construction work zones. J. Inf. Technol. Constr. ITcon 2014, 19, 1–19. [Google Scholar]
  28. Ruff, T.M. Recommendations for Testing Radar-Based Collision Warning Systems on Heavy Equipment; Centers for Disease Control and Prevention: Atlanta, GA, USA, 2002. Available online: https://stacks.cdc.gov/view/cdc/9496#tabs-2 (accessed on 5 September 2023).
  29. Zhao, Z.-Q.; Zheng, P.; Xu, S.; Wu, X. Object detection with deep learning: A review. IEEE Trans. Neural Netw. Learn. Syst. 2019, 30, 3212–3232. [Google Scholar] [CrossRef]
  30. Kim, J.; Hwang, J.; Chi, S.; Seo, J. Towards database-free vision-based monitoring on construction sites: A deep active learning approach. Autom. Constr. 2020, 120, 103376. [Google Scholar] [CrossRef]
  31. Bhowmick, S.; Nagarajaiah, S.; Veeraraghavan, A. Vision and Deep Learning-Based Algorithms to Detect and Quantify Cracks on Concrete Surfaces from UAV Videos. Sensors 2020, 20, 6299. [Google Scholar] [CrossRef] [PubMed]
  32. Shim, S.; Korea Institute of Civil Engineering and Building Technology; Chun, C.; Ryu, S.-K. Road Surface Damage Detection based on Object Recognition using Fast R-CNN. J. Korea Inst. Intell. Transp. Syst. 2019, 18, 104–113. [Google Scholar] [CrossRef]
  33. Spencer, B.F., Jr.; Hoskere, V.; Narazaki, Y. Advances in Computer Vision-Based Civil Infrastructure Inspection and Monitoring. Engineering 2019, 5, 199–222. [Google Scholar] [CrossRef]
  34. Rasul, A.; Seo, J.; Oh, K.; Khajepour, A.; Reginald, N. Predicted Safety Algorithms for Autonomous Excavators Using a 3D LiDAR Sensor. In Proceedings of the 2020 IEEE International Systems Conference (SysCon), Montreal, QC, Canada, 24 August–20 September 2020. [Google Scholar]
  35. Fremont, V.; Bui, M.T.; Boukerroui, D.; Letort, P. Vision-Based People Detection System for Heavy Machine Applications. Sensors 2016, 16, 128. [Google Scholar] [CrossRef] [PubMed]
  36. Jeelani, I.; Asadi, K.; Ramshankar, H.; Han, K.; Albert, A. Real-time vision-based worker localization & hazard detection for construction. Autom. Constr. 2020, 121, 103448. [Google Scholar] [CrossRef]
  37. Lecun, Y.; Bottou, L.; Bengio, Y.; Haffner, P. Gradient-based learning applied to document recognition. Proc. IEEE 1998, 86, 2278–2324. [Google Scholar] [CrossRef]
  38. Krizhevsky, A.; Sutskever, I.; Hinton, G.E. Imagenet classification with deep convolutional neural networks. Adv. Neural Inf. Process. Syst. 2012, 25, 1097–1105. [Google Scholar] [CrossRef]
  39. Rawat, W.; Wang, Z. Deep convolutional neural networks for image classification: A comprehensive review. Neural Comput. 2017, 29, 2352–2449. [Google Scholar] [CrossRef] [PubMed]
  40. LeCun, Y.; Bengio, Y.; Hinton, G. Deep learning. Nature 2015, 521, 436–444. [Google Scholar] [CrossRef] [PubMed]
  41. Simonyan, K.; Zisserman, A. Very deep convolutional networks for large-scale image recognition. arXiv 2014, arXiv:1409.1556. [Google Scholar]
  42. He, K.; Zhang, X.; Ren, S.; Sun, J. Deep residual learning for image recognition. In Proceedings of the IEEE Conference on Computer Vision and Pattern Recognition, Las Vegas, NV, USA, 27–30 June 2016. [Google Scholar]
  43. Uijlings, J.R.; van de Sande, K.E.A.; Gevers, T.; Smeulders, A.W.M. Selective search for object recognition. Int. J. Comput. Vis. 2013, 104, 154–171. [Google Scholar] [CrossRef]
  44. Girshick, R.; Donahue, J.; Darrell, T.; Malik, J. Rich Feature Hierarchies for Accurate Object Detection and Semantic Segmentation. In Proceedings of the IEEE Conference on Computer Vision and Pattern Recognition, Columbus, OH, USA, 23–28 June 2014; pp. 580–587. [Google Scholar] [CrossRef]
  45. Wang, L. Support Vector Machines: Theory and Applications; Springer Science & Business Media: Berlin/Heidelberg, Germany, 2005; Volume 177. [Google Scholar]
  46. Girshick, R. Fast r-cnn. In Proceedings of the IEEE International Conference on Computer Vision, Santiago, Chile, 7–13 December 2015. [Google Scholar]
  47. He, K.; Zhang, X.; Ren, S.; Sun, J. Spatial Pyramid Pooling in Deep Convolutional Networks for Visual Recognition. IEEE Trans. Pattern Anal. Mach. Intell. 2015, 37, 1904–1916. [Google Scholar] [CrossRef]
  48. Ren, S.; He, K.; Girshick, R.; Sun, J. Faster r-cnn: Towards real-time object detection with region proposal networks. arXiv 2015, arXiv:1506.01497. [Google Scholar] [CrossRef] [PubMed]
  49. Redmon, J.; Divvala, S.; Girshick, R.; Farhadi, A. You only look once: Unified, real-time object detection. In Proceedings of the IEEE Conference on Computer Vision and Pattern Recognition, Las Vegas, NV, USA, 27–30 June 2016. [Google Scholar]
  50. Szegedy, C.; Liu, W.; Jia, Y.; Sermanet, P.; Reed, S.; Anguelov, D.; Erhan, D.; Vanhoucke, V.; Rabinovich, A. Going deeper with convolutions. In Proceedings of the IEEE Conference on Computer Vision and Pattern Recognition, Boston, MA, USA, 7–12 June 2015. [Google Scholar]
  51. Redmon, J.; Farhadi, A. YOLO9000: Better, faster, stronger. In Proceedings of the IEEE Conference on Computer Vision and Pattern Recognition, Honolulu, HI, USA, 21–26 July 2017. [Google Scholar]
  52. Redmon, J.; Farhadi, A. Yolov3: An incremental improvement. arXiv 2018, arXiv:1804.02767. [Google Scholar]
  53. Lin, T.-Y.; Dollár, P.; Girshick, R.; He, K.; Hariharan, B.; Belongie, S. Feature pyramid networks for object detection. In Proceedings of the IEEE Conference on Computer Vision and Pattern Recognition, Honolulu, HI, USA, 21–26 July 2017. [Google Scholar]
  54. Pan, S.J.; Yang, Q. A survey on transfer learning. IEEE Trans. Knowl. Data Eng. 2009, 22, 1345–1359. [Google Scholar] [CrossRef]
  55. Bochkovskiy, A.; Wang, C.-Y.; Liao, H.-Y.M. Yolov4: Optimal speed and accuracy of object detection. arXiv 2020, arXiv:2004.10934. [Google Scholar]
  56. Shorten, C.; Khoshgoftaar, T.M. A survey on Image Data Augmentation for Deep Learning. J. Big Data 2019, 6, 60. [Google Scholar] [CrossRef]
  57. Yun, S.; Han, D.; Oh, S.J.; Chun, S.; Choe, J.; Yoo, Y. CutMix: Regularization Strategy to Train Strong Classifiers with Localizable Features. In Proceedings of the IEEE/CVF International Conference on Computer Vision (ICCV), Seoul, Republic of Korea, 27 October–2 November 2019. [Google Scholar]
  58. Müller, R.; Kornblith, S.; Hinton, G. When does label smoothing help? arXiv 2019, arXiv:1906.02629. [Google Scholar]
  59. Szegedy, C.; Vanhoucke, V.; Ioffe, S.; Shlens, J.; Wojna, Z. Rethinking the inception architecture for computer vision. In Proceedings of the IEEE Conference on Computer Vision and Pattern Recognition, Las Vegas, NV, USA, 27–30 June 2016. [Google Scholar]
  60. Ghiasi, G.; Lin, T.-Y.; Le, Q.V. Dropblock: A regularization method for convolutional networks. arXiv 2018, arXiv:1810.12890. [Google Scholar]
  61. Misra, D. Mish: A self regularized non-monotonic activation function. arXiv 2019, arXiv:1908.08681. [Google Scholar]
  62. Wang, C.-Y.; Liao, H.-Y.M.; Yeh, I.; Wu, Y.-H.; Chen, P.-Y.; Hsieh, J.-W. CSPNet: A new backbone that can enhance learning capability of CNN. In Proceedings of the IEEE/CVF Conference on Computer Vision and Pattern Recognition Workshops, Seattle, WA, USA, 13–19 June 2020. [Google Scholar]
  63. Zheng, Z.; Wang, P.; Liu, W.; Li, J.; Ye, R.; Ren, D. Distance-IoU loss: Faster and better learning for bounding box regression. In Proceedings of the AAAI Conference on Artificial Intelligence, New York, NY, USA, 7–12 February 2020. [Google Scholar]
  64. Yao, Z.; Cao, Y.; Zheng, S.; Huang, G.; Lin, S. Cross-iteration batch normalization. arXiv 2020, arXiv:2002.05712. [Google Scholar]
  65. Loshchilov, I.; Hutter, F. Sgdr: Stochastic gradient descent with warm restarts. arXiv 2016, arXiv:1608.03983. [Google Scholar]
  66. Huang, Z.; Wang, J.; Fu, X.; Yu, T.; Guo, Y.; Wang, R. DC-SPP-YOLO: Dense connection and spatial pyramid pooling based YOLO for object detection. Inf. Sci. 2020, 522, 241–258. [Google Scholar] [CrossRef]
  67. Woo, S.; Park, J.; Lee, J.-Y.; Kweon, I.S. Cbam: Convolutional block attention module. In Proceedings of the European Conference on Computer Vision (ECCV), Munich, Germany, 8–14 September 2018. [Google Scholar]
  68. Liu, S.; Qi, L.; Qin, H.; Shi, J.; Jia, J. Path aggregation network for instance segmentation. In Proceedings of the IEEE Conference on Computer Vision and Pattern Recognition, Salt Lake City, UT, USA, 18–23 June 2018. [Google Scholar]
  69. DeVries, T.; Taylor, G.W. Improved regularization of convolutional neural networks with cutout. arXiv 2017, arXiv:1708.04552. [Google Scholar]
  70. Zhang, H.; Cisse, M.; Dauphin, Y.N.; Lopez-Paz, D. mixup: Beyond empirical risk minimization. arXiv 2017, arXiv:1710.09412. [Google Scholar]
  71. Srivastava, N.; Hinton, G.; Krizhevsky, A.; Sutskever, I.; Salakhutdinov, R. Dropout: A simple way to prevent neural networks from overfitting. J. Mach. Learn. Res. 2014, 15, 1929–1958. [Google Scholar]
  72. Ioffe, S.; Szegedy, C. Batch normalization: Accelerating deep network training by reducing internal covariate shift. In Proceedings of the International Conference on Machine Learning 2015, PMLR, Lille, France, 6–11 July 2015. [Google Scholar]
  73. Huang, G.; Liu, Z.; van der Maaten, L.; Weinberger, K.Q. Densely connected convolutional networks. In Proceedings of the IEEE Conference on Computer Vision and Pattern Recognition, Honolulu, HI, USA, 21–26 July 2017. [Google Scholar]
  74. Xiang, Y.; Wang, H.; Su, T.; Li, R.; Brach, C.; Mao, S.S.; Geimer, M. Kit moma: A mobile machines dataset. arXiv 2020, arXiv:2007.04198. [Google Scholar]
  75. Deng, J.; Dong, W.; Socher, R.; Li, L.-J.; Li, K.; Li, F.-F. Imagenet: A large-scale hierarchical image database. In Proceedings of the 2009 IEEE Conference on Computer Vision and Pattern Recognition, Miami, FL, USA, 20–25 June 2009; IEEE: Piscataway, NJ, USA, 2009. [Google Scholar]
  76. Everingham, M.; Van Gool, L.; Williams, C.K.I.; Winn, J.; Zisserman, A. The Pascal Visual Object Classes (VOC) Challenge. Int. J. Comput. Vis. 2009, 88, 303–338. [Google Scholar] [CrossRef]
  77. Geiger, A.; Stiller, C.; Urtasun, R. Vision meets robotics: The kitti dataset. Int. J. Robot. Res. 2013, 32, 1231–1237. [Google Scholar] [CrossRef]
  78. Lin, T.-Y.; Maire, M.; Belongie, S.; Bourdev, L.; Girshick, R.; Hays, J.; Perona, P.; Ramanan, D.; Zitnick, C.L.; Dollár, P. Microsoft coco: Common objects in context. In Proceedings of the European Conference on Computer Vision, Zurich, Switzerland, 6–12 September 2014; Springer: Berlin/Heidelberg, Germany, 2014. [Google Scholar]
  79. Nath, N.D.; Behzadan, A.H. Deep Convolutional Networks for Construction Object Detection Under Different Visual Conditions. Front. Built Environ. 2020, 6, 1–22. [Google Scholar] [CrossRef]
  80. Neuhausen, M.; Pawlowski, D.; König, M. Comparing Classical and Modern Machine Learning Techniques for Monitoring Pedestrian Workers in Top-View Construction Site Video Sequences. Appl. Sci. 2020, 10, 8466. [Google Scholar] [CrossRef]
  81. Jetson Nano. Available online: https://developer.nvidia.com/embedded/jetson-nano (accessed on 27 April 2021).
Figure 1. Conceptual diagram of the proposed system.
Sustainability 15 16163 g001
Figure 2. Acquisition process of the industrial worker data set.
Sustainability 15 16163 g002
Figure 3. Image marker for data labeling.
Sustainability 15 16163 g003
Figure 4. Hardware configuration of the anti-collision system.
Sustainability 15 16163 g004
Figure 5. Training and inference.
Sustainability 15 16163 g005
Figure 6. IWD-C for the anti-collision system on a construction site.
Sustainability 15 16163 g006
Figure 7. Concept of bounding box merging.
Sustainability 15 16163 g007
Figure 8. Concept of bounding box extension.
Sustainability 15 16163 g008
Figure 9. Process of bounding box merging and extension.
Sustainability 15 16163 g009
Figure 10. On-field testing environment.
Sustainability 15 16163 g010
Figure 11. Overview of the static test. (a) Maximum detection distance test. (b) Detection performance test according to the camera angle and distance.
Sustainability 15 16163 g011
Figure 12. Overview of the dynamic test. (a) Back and forth. (b) Left and right.
Sustainability 15 16163 g012
Figure 13. Maximum detection distance test environment.
Sustainability 15 16163 g013
Figure 14. Detection performance test environment according to the camera angle of view and distance.
Sustainability 15 16163 g014
Figure 15. Dynamic test. (a) Test 1—back and forth. (b) Test 2—left and right.
Sustainability 15 16163 g015
Table 1. Main Features of Tag-based PWS.
Main ItemMain FeaturesRelated Research
RFID[Advantage]
Cost-efficient of RFID-tag
Detection function for both daytime and night
[Disadvantages]
Detection area of uneven
Difficulty of maintenance due to the durability of RFID-tag
[8,18,19,20,21,22,23]
UWB[Advantage]
Easy installation and data collection
More accurate detection of activity object
[Disadvantages]
Relatively high cost due to object-tag
Periodic battery charging of object-tag
[4,6,9,12]
GPS[Advantage]
Minimal required device
Suitable for long-range detection
[Disadvantages]
Not available indoors
An expensive system is required for precise positioning
[14,15,16,17,24]
Table 2. Main features of a proximity warning system (non-tag-based).
Main ItemMain FeaturesRelated Research
Radar[Advantage]
Detection function for both daytime and night
Unaffected by weather conditions
[Disadvantages]
Not able to distinguish a person from other objects
Susceptibility to false alarms or nuisance alarms
[10,25,26,27,28]
LiDAR[Advantage]
High-resolution object information collection possible
The system can identify a ground worker from other objects
[Disadvantages]
Relatively high-cost sensor
High data processing effort
[34]
Video Camera[Advantage]
Minimal required device
Provides visual object information
[Disadvantages]
Not available night
Highly influenced by weather conditions
[5,35,36]
Table 3. Summary of YOLO-v4.
Categories
BackboneBoFData augmentation [56]CutMix [57]
Mosaic [55]
Data imbalance [58]Class label smoothing [59]
RegularizationDropBlock [60]
BoSActivation functionMish [61]
Skip-connectionCross-stage partial connections (CSP) [62]
Multi-input weighted residual connections (MiWRC)
DetectorBoFData augmentationMosaic [55]
Self-Adversarial Training [55]
RegularizationDropBlock [60]
Objective functionCIoU-loss [63]
Batch NormalizationCmBN [64]
OthersOptimal hyperparameters [55]
Cosine annealing scheduler [65]
Eliminate grid sensitivity [55]
Using multiple anchors for a single ground truth [55]
Random training shapes [55]
BoSActivation functionMish [61]
Receptive field enhancementSPP [47,66]
Attention moduleModified-SAM [67]
Feature integrationModified-PAN(Path aggregation network) [68]
Post-processingDIoU-NMS [63]
Table 4. Overview of Image Dataset.
Construction Site—A (6 May 2021–30 July 2021)
EquipmentExcavator 1Excavator 2Excavator 3
ImageSustainability 15 16163 i001Sustainability 15 16163 i002Sustainability 15 16163 i003
Number of videos153,205139,461131,498
Construction Site—B (6 May 2021–30 July 2021)
EquipmentExcavator 1Excavator 2Excavator 3
ImageSustainability 15 16163 i004Sustainability 15 16163 i005Sustainability 15 16163 i006
Number of videos67,04873,903115,162
EquipmentExcavator 4Excavator 5
ImageSustainability 15 16163 i007Sustainability 15 16163 i008
Number of videos81,67364,086
Construction Site—C (4 June 2021–30 July 2021)
EquipmentExcavator 1Excavator 2Excavator 3
ImageSustainability 15 16163 i009Sustainability 15 16163 i010Sustainability 15 16163 i011
Number of videos41,62969,79340,114
EquipmentExcavator 4Excavator 5Excavator 6
ImageSustainability 15 16163 i012Sustainability 15 16163 i013Sustainability 15 16163 i014
Number of videos10,86443,79670,419
EquipmentExcavator 7
ImageSustainability 15 16163 i015
Number of videos53,883
Summary
Number of ① video/② image/③ object① 1,156,634 ② 42,620 ③ 57,228
Table 5. Sample of IWD-C.
Sustainability 15 16163 i016Sustainability 15 16163 i017Sustainability 15 16163 i018Sustainability 15 16163 i019
Sustainability 15 16163 i020Sustainability 15 16163 i021Sustainability 15 16163 i022Sustainability 15 16163 i023
Sustainability 15 16163 i024Sustainability 15 16163 i025Sustainability 15 16163 i026Sustainability 15 16163 i027
Sustainability 15 16163 i028Sustainability 15 16163 i029Sustainability 15 16163 i030Sustainability 15 16163 i031
Sustainability 15 16163 i032Sustainability 15 16163 i033Sustainability 15 16163 i034Sustainability 15 16163 i035
Sustainability 15 16163 i036Sustainability 15 16163 i037Sustainability 15 16163 i038Sustainability 15 16163 i039
Sustainability 15 16163 i040Sustainability 15 16163 i041Sustainability 15 16163 i042Sustainability 15 16163 i043
Sustainability 15 16163 i044Sustainability 15 16163 i045Sustainability 15 16163 i046Sustainability 15 16163 i047
Sustainability 15 16163 i048Sustainability 15 16163 i049Sustainability 15 16163 i050Sustainability 15 16163 i051
Sustainability 15 16163 i052Sustainability 15 16163 i053Sustainability 15 16163 i054Sustainability 15 16163 i055
Sustainability 15 16163 i056Sustainability 15 16163 i057Sustainability 15 16163 i058Sustainability 15 16163 i059
Sustainability 15 16163 i060Sustainability 15 16163 i061Sustainability 15 16163 i062Sustainability 15 16163 i063
Sustainability 15 16163 i064Sustainability 15 16163 i065Sustainability 15 16163 i066Sustainability 15 16163 i067
Table 6. Summary of the hardware component.
ClassificationImageFeatures
AI monitorSustainability 15 16163 i068
Image visualization
Computation of object detection algorithm
Proximity alarm (visual and audible) for the operator
Display: 7 inch
Resolution: 1024 × 600
Size: 225 × 140 × 70 mm (W × D × H)
CamerasSustainability 15 16163 i069
Image acquisition
Resolution: 1280 × 720
Field of view: 130° (H), 68° (V)
Device connectorSustainability 15 16163 i070
Connection of multiple external devices (including warning device)
User-customized alarm system available through the device connector
Splitter cableSustainability 15 16163 i071
Connect to the power line in Figure 4.
Line 1: Power
Line 2: Siren
Alarm device
(Default)
Sustainability 15 16163 i072
Proximity alarm (audible) for worker
Connect to the splitter cable line 2
Can be removed when an alarm device is connected to the device connector
Table 7. Technical specifications of Jetson Nano [81].
ClassificationSpecification
GPUNVIDIA Maxwell architecture with 128 NVIDIA CUDA® cores
CPUQuad-core ARM Cortex-A57 MPCore processor
Memory4 GB 64-bit LPDDR4, 1600 MHz 25.6 GB/s
Storage16 GB eMMC 5.1
Table 8. Description of object detection and alert.
ClassificationImageFeatures
Main screenSustainability 15 16163 i073
Menu or Select
Direction (↑)
Direction (↓)
Save
Cancel or Back
Object detectionSustainability 15 16163 i074
When an object is detected, a red bounding box is created around the object
The monitor’s screen and the LED on the bottom flash red at the same time and danger is alerted (The arrows indicate the LED indicator area.)
AlertSustainability 15 16163 i075
Table 9. Hardware environment.
CPUAMD 3700X
OSUbuntu 18.04
GPURTX 2080 Ti
RAM32 GB
Table 10. Training Environment.
Pre-trained ModelYOLO-v4
Batch size64
Epoch10
Learning rate0.001
FrameworkDarknet
Table 11. Training Dataset.
IWD-CCrowdHumanTotal
42,62042,72658,08957,22859,73648,15438,80272,318102,35690,88096,891129,546
① Image ② Head ③ Upper-body ④ Whole body.
Table 12. Result.
Table 12. Result.
Model
YOLO-v480.8%91.3%88.7%86.9%0.780.730.8434
① Head (AP) ② Upper-body(AP) ③ Whole body(AP) ④ mAP ⑤ F1-Score ⑥ Precision ⑦Recall ⑧ FPS.
Table 13. Result of the maximum detection distance test.
PositionTest ImageDetection RatePositionTest ImageDetection Rate
1 mSustainability 15 16163 i0761007 mSustainability 15 16163 i077100
2 mSustainability 15 16163 i0781008 mSustainability 15 16163 i079100
3 mSustainability 15 16163 i0801009 mSustainability 15 16163 i081100
4 mSustainability 15 16163 i08210010 mSustainability 15 16163 i083100
5 mSustainability 15 16163 i08410011 mSustainability 15 16163 i085100
6 mSustainability 15 16163 i08610012 mSustainability 15 16163 i08783.2
Table 14. Results of the detection performance test according to the camera angle of view and distance.
Position 30 ° (%) 60 ° (%) 90 ° (%) 120 ° (%) 150 ° (%)
1 mSustainability 15 16163 i088Sustainability 15 16163 i089Sustainability 15 16163 i090Sustainability 15 16163 i091Sustainability 15 16163 i092
98.7100100100100
2 mSustainability 15 16163 i093Sustainability 15 16163 i094Sustainability 15 16163 i095Sustainability 15 16163 i096Sustainability 15 16163 i097
100100100100100
3 mSustainability 15 16163 i098Sustainability 15 16163 i099Sustainability 15 16163 i100Sustainability 15 16163 i101Sustainability 15 16163 i102
100100100100100
4 mSustainability 15 16163 i103Sustainability 15 16163 i104Sustainability 15 16163 i105Sustainability 15 16163 i106Sustainability 15 16163 i107
100100100100100
5 mSustainability 15 16163 i108Sustainability 15 16163 i109Sustainability 15 16163 i110Sustainability 15 16163 i111Sustainability 15 16163 i112
100100100100100
6 mSustainability 15 16163 i113Sustainability 15 16163 i114Sustainability 15 16163 i115Sustainability 15 16163 i116Sustainability 15 16163 i117
100100100100100
7 mSustainability 15 16163 i118Sustainability 15 16163 i119Sustainability 15 16163 i120Sustainability 15 16163 i121Sustainability 15 16163 i122
100100100100100
8 mSustainability 15 16163 i123Sustainability 15 16163 i124Sustainability 15 16163 i125Sustainability 15 16163 i126Sustainability 15 16163 i127
100100100100100
9 mSustainability 15 16163 i128Sustainability 15 16163 i129Sustainability 15 16163 i130Sustainability 15 16163 i131Sustainability 15 16163 i132
100100100100100
10 mSustainability 15 16163 i133Sustainability 15 16163 i134Sustainability 15 16163 i135Sustainability 15 16163 i136Sustainability 15 16163 i137
100100100100100
Table 15. Results of dynamic test 1.
TypeStarting
Point
Ending
Point
Average SpeedTest ImageDetection
Rate
Back
and
Forth
Horizontal Angle
90 ° -1 m
Horizontal Angle
90 ° -10 m
about
4 km/h
Sustainability 15 16163 i138
Sustainability 15 16163 i139
Sustainability 15 16163 i140
98.2%
Table 16. Results of dynamic test 2.
TypeStarting
Point
Ending
Point
Average SpeedTest ImageDetection
Rate
Left
and
Right
Horizontal Angle
30 ° -10 m
Horizontal Angle
15 0 ° -10 m
about
4 km/h
Sustainability 15 16163 i141
Sustainability 15 16163 i142
Sustainability 15 16163 i143
99.1%
Disclaimer/Publisher’s Note: The statements, opinions and data contained in all publications are solely those of the individual author(s) and contributor(s) and not of MDPI and/or the editor(s). MDPI and/or the editor(s) disclaim responsibility for any injury to people or property resulting from any ideas, methods, instructions or products referred to in the content.

