Review

Integrated Management of Industrial Wastewater in the Food Sector

by
Mona A. Abdel-Fatah
Chemical Engineering and Pilot Plant Department, Engineering and Renewable Energy Research Institute, National Research Centre (NRC), 33 El-Bohooth St., Giza 12622, Egypt
Sustainability 2023, 15(23), 16193; https://doi.org/10.3390/su152316193
Submission received: 27 August 2023 / Revised: 15 October 2023 / Accepted: 14 November 2023 / Published: 22 November 2023

Abstract

:
In 2019, a staggering 931 million tons of food went to waste, which is equal to about 17% of all the food available in stores. Dealing with this waste and managing wastewater from various industries will be among the world’s top challenges soon. This is because the global population is expected to grow to around 9 billion people by 2050. Food processing effluent is characterized by valuable material in considerable concentrations, including proteins and lipids with low concentrations of heavy metals and toxicants. Developing an integrated management system for food-processing wastewater should focus on recovering abundant resources, improving the economic value of the process, and mitigating the organic contaminant in the food-processing effluent. This state-of-the-art will review the wastewater management processes of the food processing industry. The latest wastewater treatment processes in different food processing sectors will be reviewed. This review will encompass various physicochemical treatment and recovery techniques, such as precipitation, membrane technology, solvent extraction, foam fractionation, adsorption, and aqueous two-phase systems. Additionally, it will delve into bio-treatment processes that leverage microorganisms and/or enzymes to utilize nutrients found in food-processing wastewater as cost-effective substrates for the production of valuable products. This includes a detailed examination of microalga biomass production within wastewater treatment systems. Finally, the review will put forward future research directions aimed at integrating the principles of the circular economy and developing comprehensive food-processing wastewater management systems.

1. Introduction

The shortage of potable water resources may lead to several problems, including deaths and health-related issues [1,2]. Globally, 2.2 billion individuals lack access to safe drinking water, including 884 million who lack essential water services [3]. In some cities, such as New Delhi, India, there is a massive shortage of water for the inhabitants, leading to deadly competition over limited water resources [4]. The global population is projected to grow to around 9 billion people by 2050. This underscores the urgency of addressing food waste and wastewater management to meet the needs of a growing population [1,2,3,4,5,6,7,8].
Considering the increasing demand for water due to the steady increase in world population and the industrial use of water, reusing water is vital to maintain water resources and to cope with the world’s economic growth [5]. The circular economy concept should be implemented in water usage by considering restricted regulations for wastewater discharge to protect natural water reserves. Wastewater reuse schemes should be developed and implemented in all the industrial sectors; nevertheless, more work and development are still needed to ensure sustainable water utilization practices through cost-effective technologies for wastewater treatment [6].
The food industry is a large water consumer. The amount of water used varies considerably in the food and beverages industry according to the nature of the sector, process parameters, unit size, and cleaning process used [7]. Wastewater generated in the food industry may result from processing units, rinsing and cleaning activities, forming byproduct formation streams, including solid and liquid waste [8]. The appropriate water resources and reusing technologies can be selected by evaluating each process’s water needs and characteristics. Three different approaches can be implemented to minimize water consumption in the food industry [9]:
  • Using production technologies that consume less water.
  • Decreasing uncontrolled water usage by implementing spray nozzles and reducing leaks.
  • Recycling/reusing water efficiently.
A practical water use reduction strategy can be achieved by recycling and reusing the treated water and recovering valuable materials. Achieving such a strategy requires implementing efficient wastewater treatment methods. Due to the negative perception of using treated water and the possible contamination risk, the concept of circular water use is still not implemented in the food industry [10,11]. 
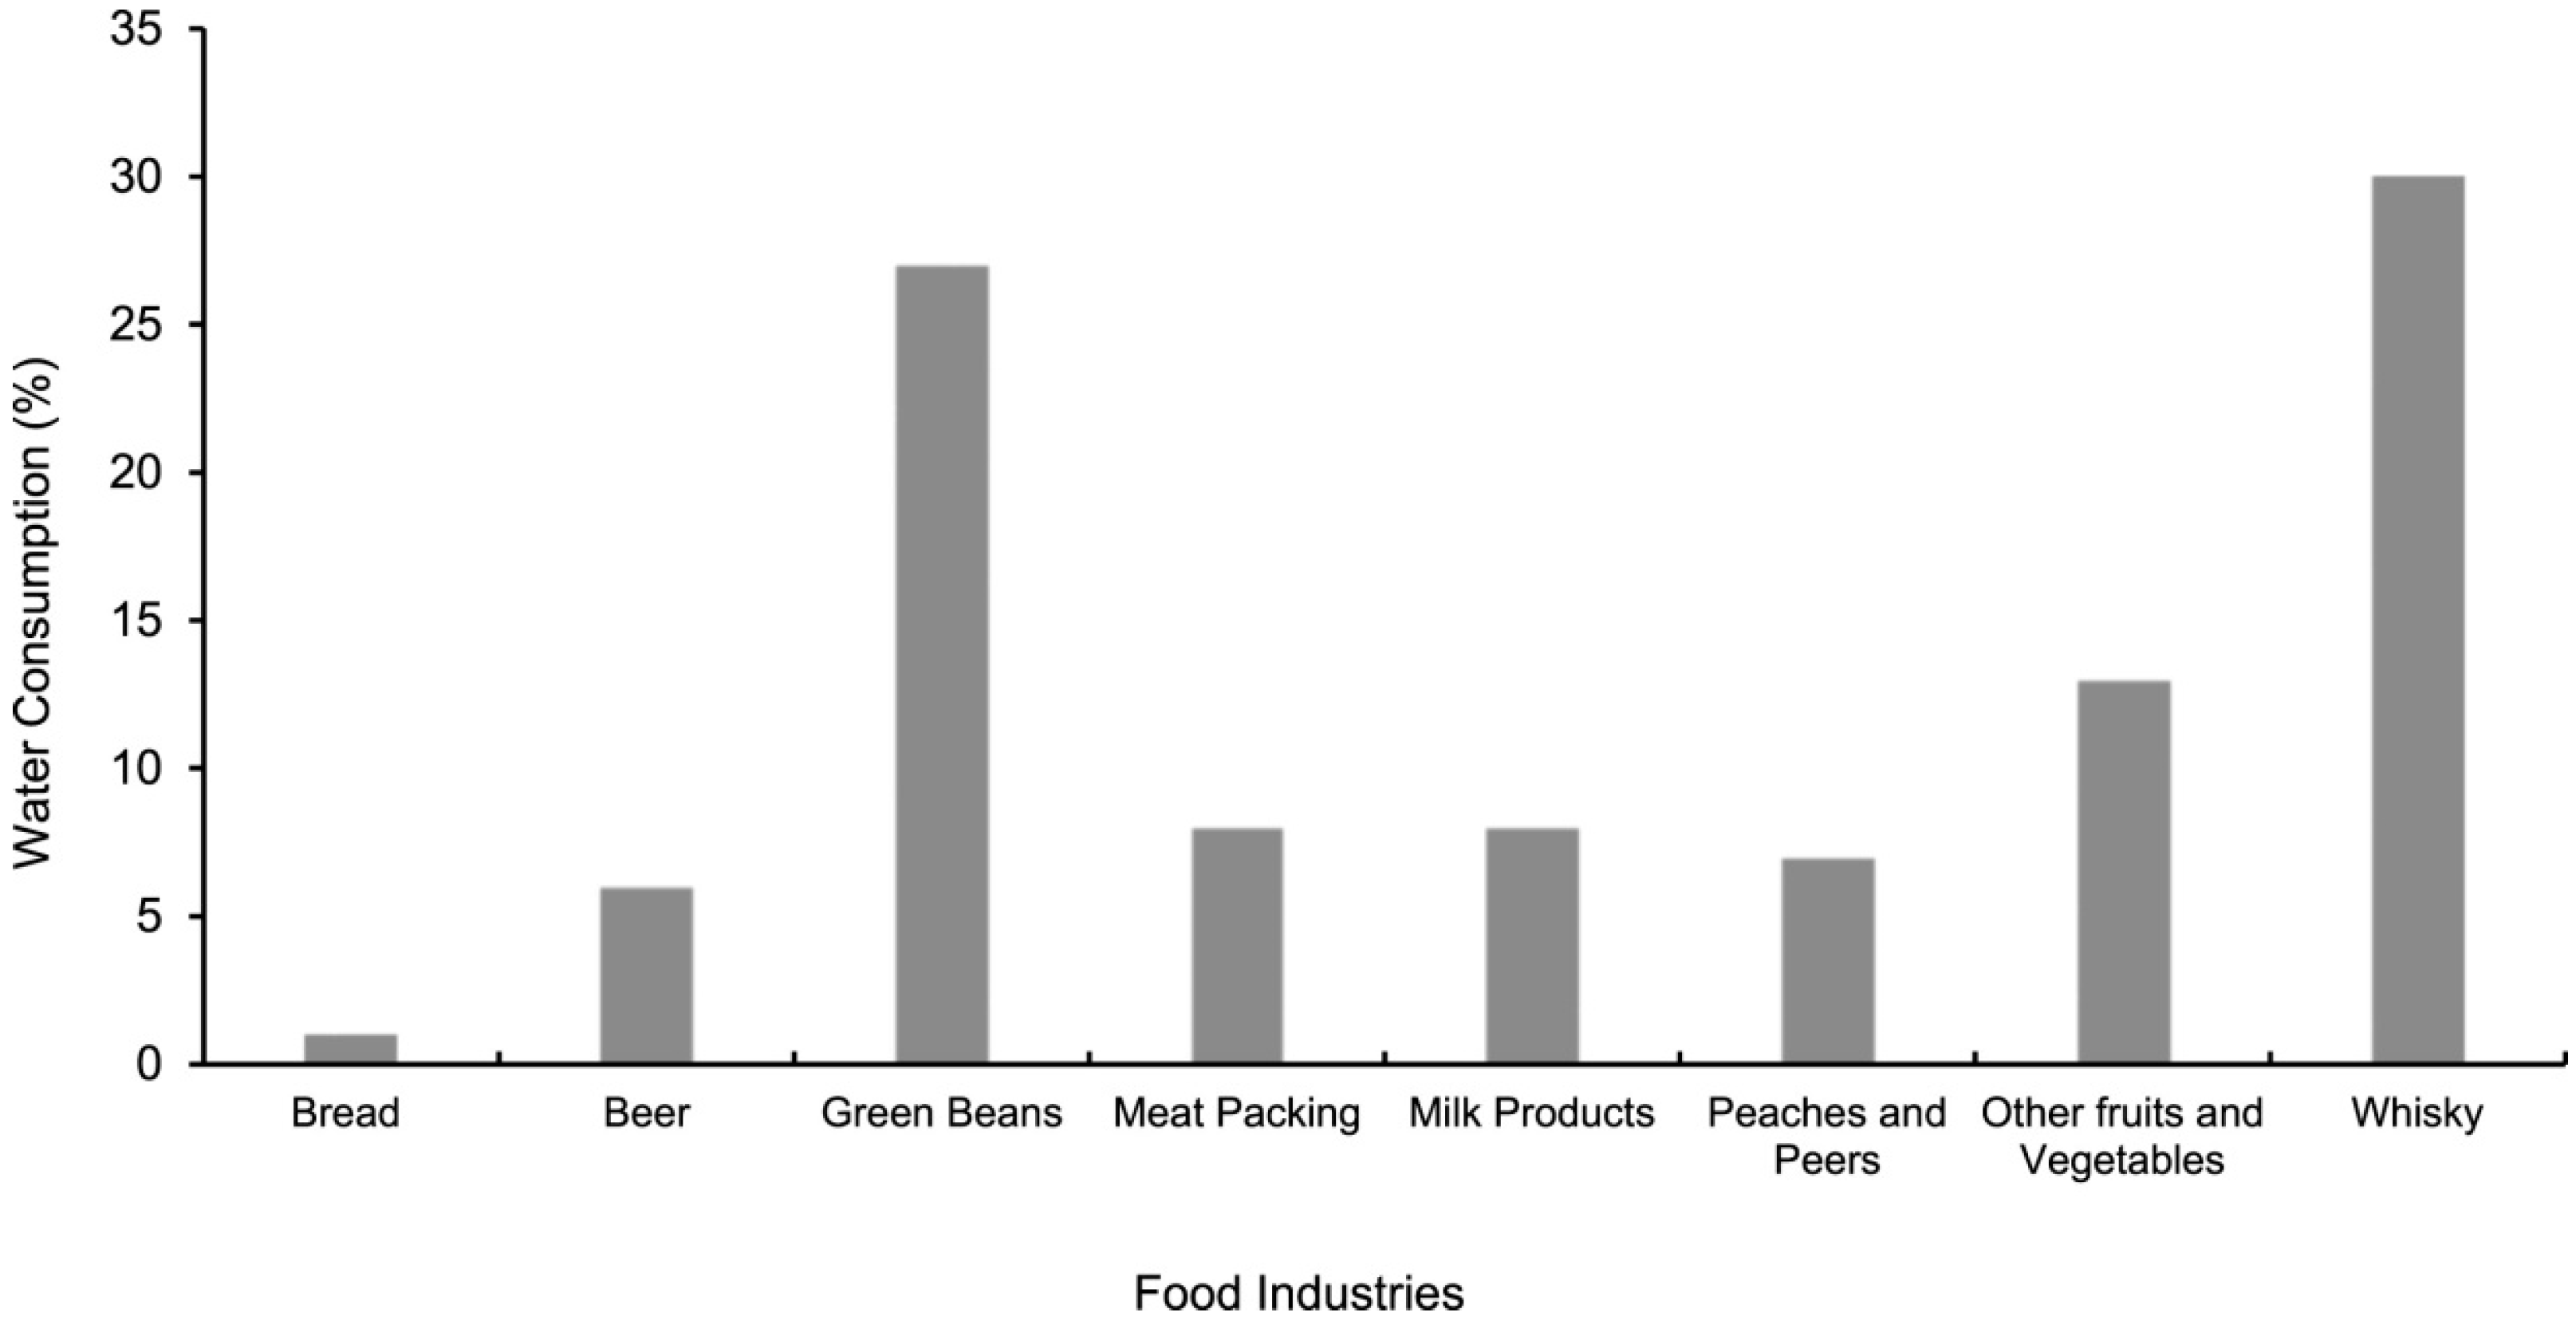
Figure 1 illustrates the water consumption by percentage in different sectors of the food industry. Water consumption in industrial food units is affected by many factors, including plant capacity, the manufacturing process, equipment, cleaning operations, and end products. About 4 trillion m3 is needed, while the freshwater available for these activities is only about 0.01 trillion m3, which may increase water scarcity [12,13]. With limited water resources, unconventional water resources such as wastewater, rainwater, and saline water must be considered [14,15]. Around 20% of global water consumption is associated with industrial applications, and this is expected to increase annually [16].
Water reuse is significant for legislative requirements, and it strengthens corporate social responsibility and reputation. Several global companies such as Coca-Cola and Heineken have taken the initiative to reuse treated water. Coca-Cola produces around 804 billion liters of wastewater annually; 173 billion liters are reused. The reuse of this large amount helped the company to meet governmental requirements. Heineken is working on a promising plan to reuse 100% of brewery wastewater by 2030 [17].
Wastewater from the food industry can be toxic to aquatic life, containing organic content 10–100 times that found in domestic water [18]. Due to the versatility of food industries, it is hard to develop one single management method for all the different processing units. The optimum wastewater management approach and treatment method should be chosen based on the food-processing process’s nature and the discharged effluent’s characteristics [19]. Water is needed in the food industry for process uses and non-process uses. The process uses include any water used as a raw material.
In contrast, the non-process uses include water consumed for washing, cooling, and heating [20]. The non-process uses of water represent the central portion of water use in the food industry [21]. Since water does not significantly impact the raw material or final product within the process uses, wastewater can be used as a sustainable water resource in the food industry after applying efficient treatment and management methods [22,23].
Regarding wastewater creation, management, and recycling in the beverage and food industry, the proficiency of commonly employed technologies for wastewater treatment, including the financial and environmental consequences, will be discussed taking into consideration the following characteristics: (i) legislative necessities regulating the reuse of water, guidelines, and prospective applications of recycled water; (ii) wastewater treatment technologies evaluation, including combining several treatment methods; and (iii) resources recovery during wastewater treatment.
The wastewater generated from non-process uses usually has a high loading of COD, BOD5, organic contaminants, suspended solids, nutrients such as N2 and P, solvents, and ions [24]. The circular economy is an interesting framework for wastewater management in the food industry based on reusing and recycling water and other valuable resources [25,26,27,28]. The circular economy supports sustainable development in all process-related activities [29]. New methods such as mathematical modeling/optimization and pinch analysis are developed for the sustainable management of resources [30,31,32,33]. The primary goal of the circular economy is to develop process integration methods, including redesigning industrial operations to optimize resource management [34].
To implement the optimum wastewater management method, the process data must be considered, including water requirements, operational flow diagram, characteristics and amount of wastewater generated, and feasible methods of wastewater treatment considering the operating conditions. The previous discussion clearly shows the urgent need to develop integrated wastewater management for different industrial applications to reduce environmental harm.
A significant aspect of these challenges is the substantial water consumption by industries such as food processing, which places a strain on our limited sources of clean drinking water. Notably, the food-processing industry is a major contributor to freshwater use. In response, scientists and engineers are actively engaged in developing innovative approaches to enhance wastewater management.
One distinctive aspect of this work is its focus on the valuable components present in food-processing effluent, notably proteins and lipids, alongside low concentrations of heavy metals and toxicants. This integrated approach seeks to harness these valuable resources, thereby elevating the economic viability of the food-processing process. Importantly, this approach aims to address both economic and environmental concerns associated with food-processing effluent.
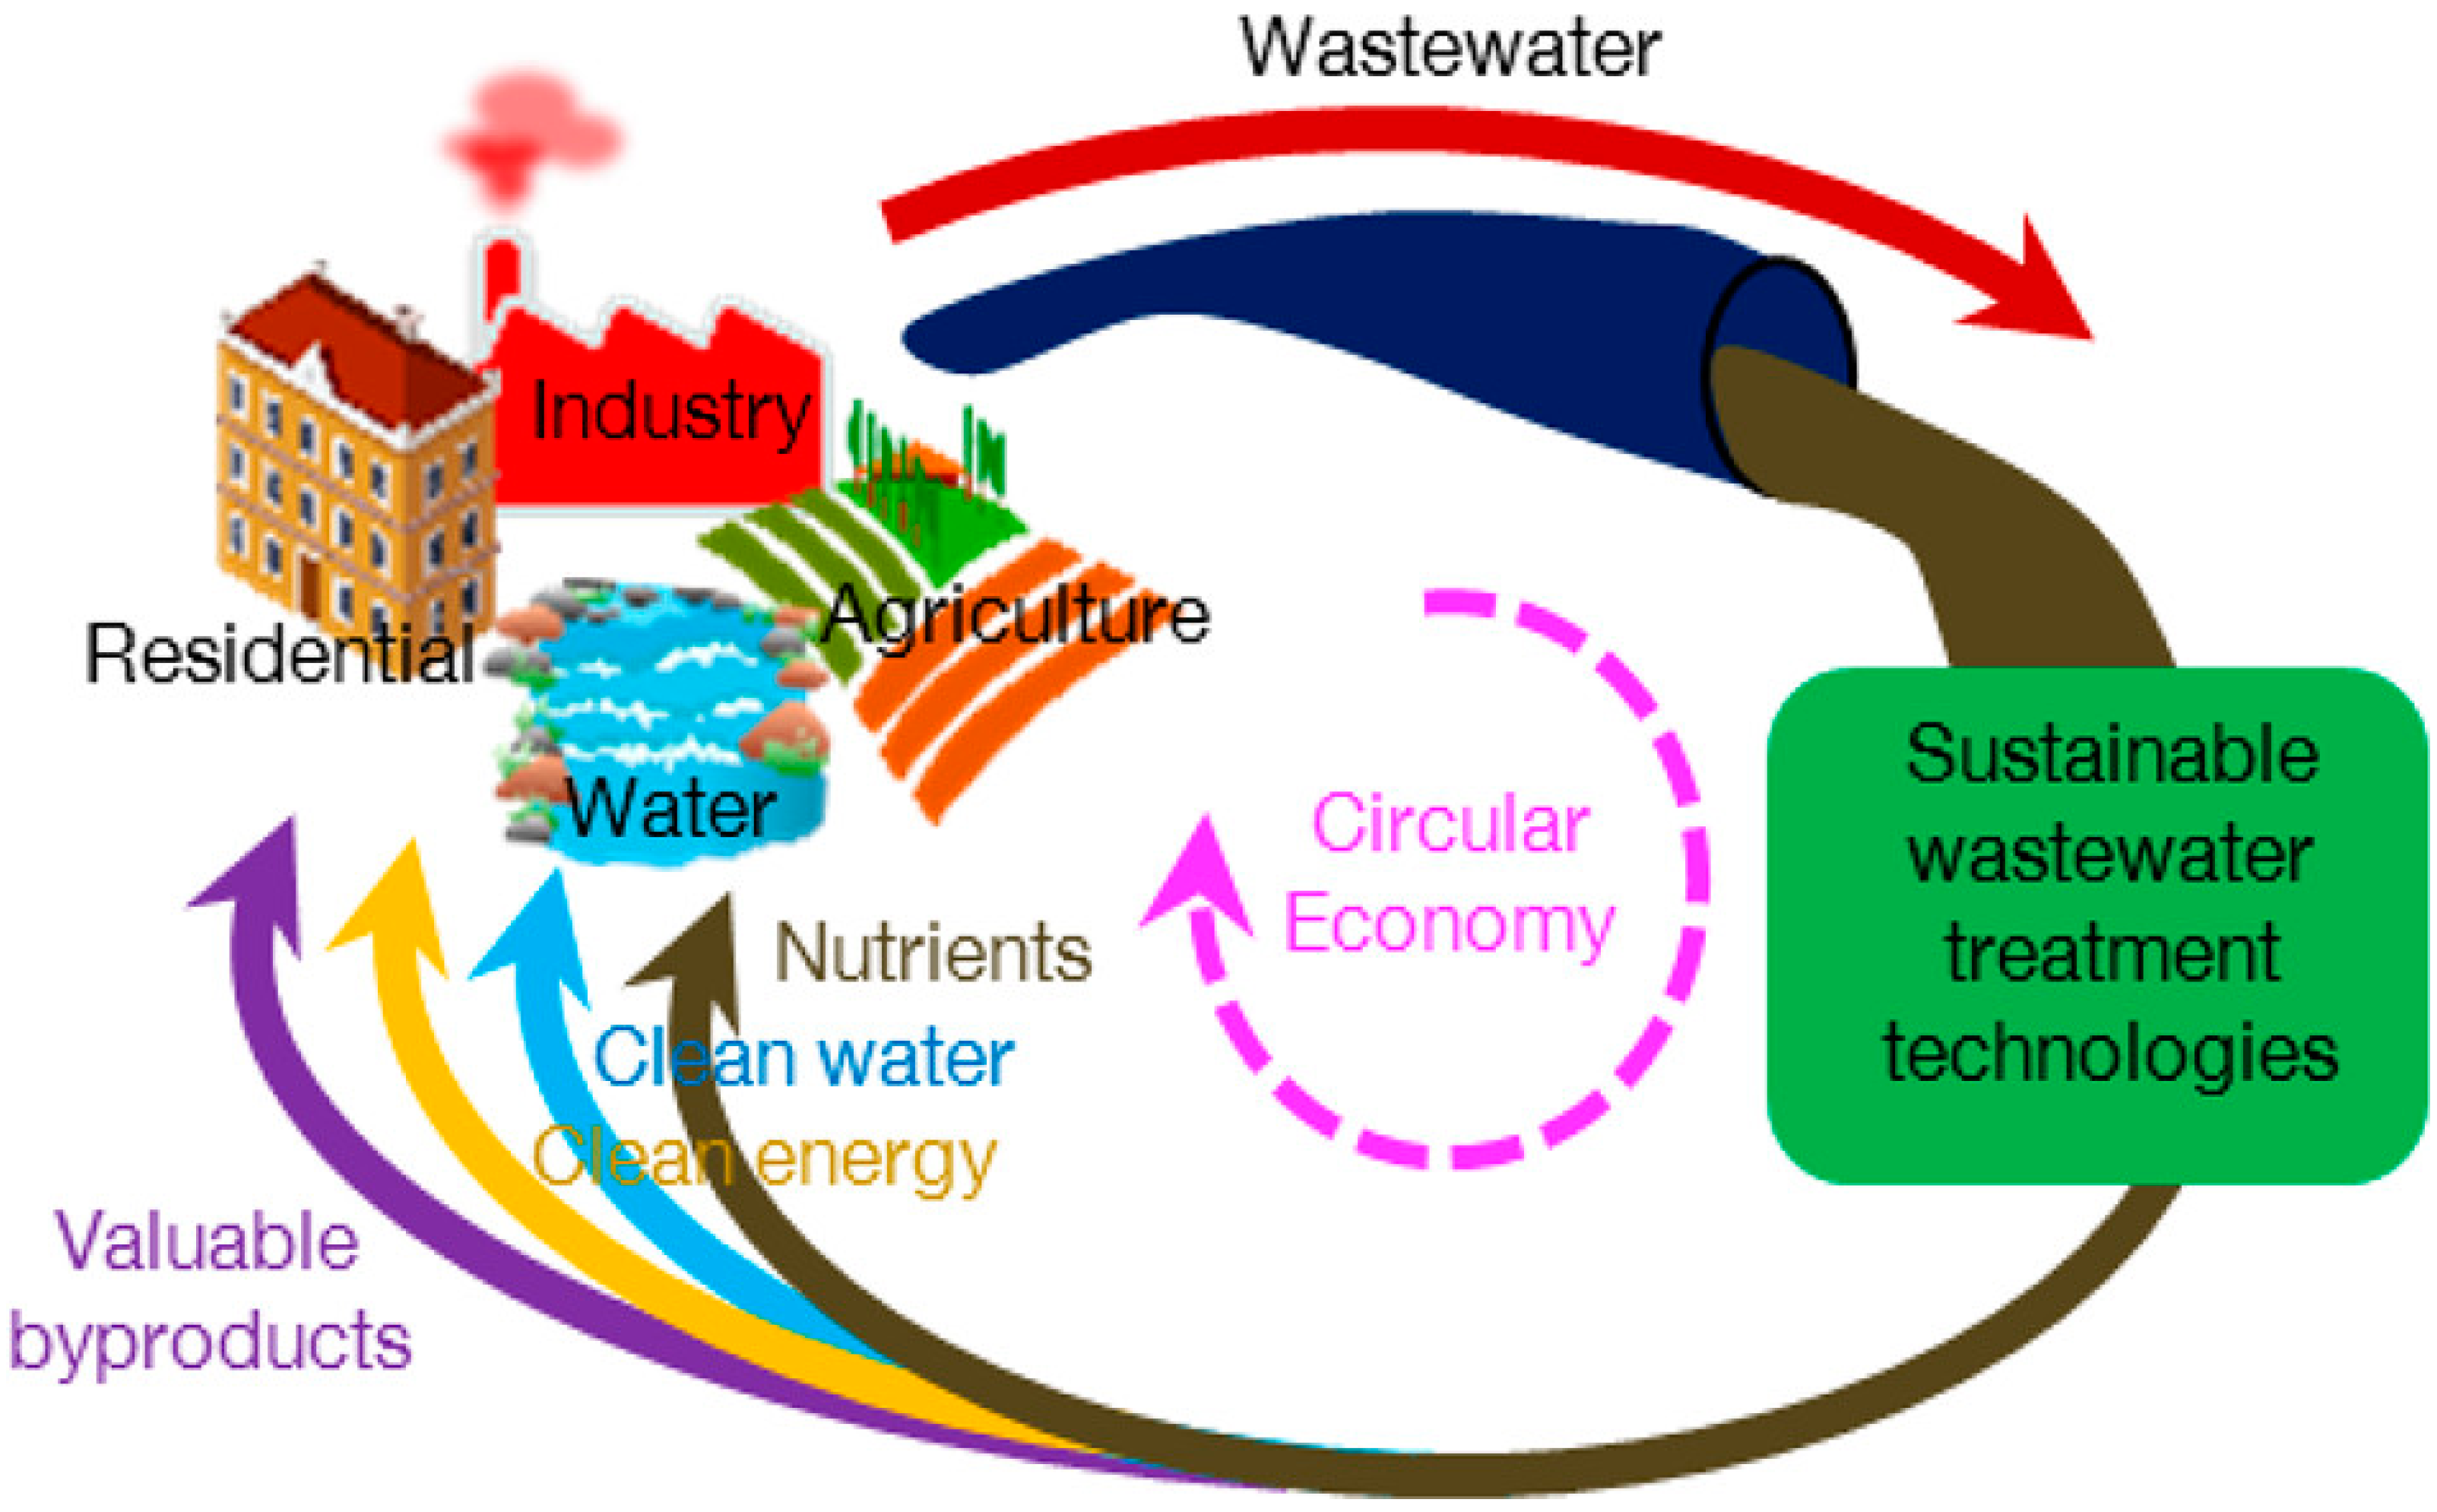
The focus of this state-of-the-art will be the integrated management of industrial wastewater in the food sector. This paper will review the water consumption and wastewater generation in several food-processing industries and the operating conditions. This paper will discuss the choice of the optimum integrated wastewater management system considering water consumption, sustainable food production, and environmental protection, as shown in Figure 2.

2. Integrated Industrial Wastewater Management

Table 1 illustrates the projected wastewater quantities generated by different food products considering water requirements per product and their global production volume. Since washing and cleaning are the steps where the most water is consumed in the food industry, which are considered non-process use, the water consumed is turned into wastewater. In the sugar, edible oil, and grain milling industries, part of the consumed water is used for process-related applications, primarily for adjusting the raw materials’ humidity. Humidity levels are crucial in the grain milling and edible oil production industries. In addition, water can be used as a raw material throughout the production process. Creating various sugars such as glucose or fructose starting with the grains is one of the standard processes where water is used as a reactant [36].

2.1. Food Processing Units

The food processing units can be categorized into eight industries, including meat production, fish and seafood, fruit and vegetables, edible oils, dairy products, grain mill products, bakery, and other food products (such as coffee, tea, sugar, and prepared and canned meals). Food industries are the central part of the food supply chain and play an essential role in sustainable development goals and improving the socioeconomic indicators. However, the food industry is a large water consumer and consumes around 30% of the total water used by the industry [37].

2.1.1. Meat Production Industries

Meat represents the essential protein source in the human diet. The meat processing industry is one of the vital industries in the food supply chain, with around 325 million tons annually, including poultry, beef, pork, and sheep raw materials [38]. In a typical meat processing unit, animals are slaughtered and then washed, followed by meat cutting, processing the meat into other products such as sausage or burgers, and finally packing, as shown in Figure 3.
Water demand varies considerably based on the processed animal and the final product. In poultry production, an average of 11.5 L of freshwater is needed per animal, while 1325 L is required per animal in beef processing units. Most of the water is used for washing purposes [39]. As shown in Figure 3, the evisceration step consumes around 44–60% of the unit water demand, subdivided into offal washing, approximately 7–40%, and casings, such as washing hair and fats, with around 9–20%. The animal prewashing step is conducted using water sprays or in water pools, using 7–22% of the process water. Approximately 25–50% of the water is consumed during meat cleaning. Wastewater discharged from meat processing units may reach around 98% of the total water used [40]. Table 2 shows the meat processing unit characteristics for each meat production unit. As shown in Table 2, the wastewater is highly polluted effluent containing organic loads, nutrients, and suspended solids such as blood, debris, meat, and bones.
Proteins in blood and debris are responsible for high total nitrogen (TN). Biological treatment methods are usually recommended for meat-processing wastewater to facilitate the removal of organic loads and nutrients effectively compared to other treatment methods. Table 3 shows the latest wastewater treatment processes used in the meat production industry [40].
Due to their ability to remove all contaminants, biological methods are more effective for treating wastewater from meat processing, such as sequencing batch reactor and algal treatment. However, physiochemical treatment methods, such as filtration, coagulation, and flotation, can be used effectively to reduce grease and oil and total suspended solids. Physiochemical treatment methods are less complicated and cheaper compared to biological processes. Treated wastewater can be reused for washing, which improves water reuse and resource recovery in meat processing.

2.1.2. Fish and Seafood Industries

Fish consumption increased from 9.9 kg to 16.7 kg per person annually from 1960 to 2016 [41]. In the last 10 years, the consumption of processed fish products, representing 90% of the global market, has increased sharply. During fish processing, chilling and freezing, salting, smoking, drying, and canning are the most popular fish processing steps [42]. In addition, immediate processing steps are needed after catching until processing to facilitate transportation, including slime removal, cutting heads/fins, washing, scaling and gutting, bone separation, and cutting into steaks and fillets. Figure 4 shows the schematic process of fish processing.
Fish processing units are usually near aquatic environments to minimize processing time and transportation costs. Water consumption depends on the process’s nature and operating conditions. Around 11 m3 of water is used to process 1 ton of prepared fish. The generated wastewater is usually discharged directly into aquacultures. Preparation steps, including slime removal, cutting heads, and washing, require considerable water and create an effluent contaminated with blood, high turbidity, BOD5, and TSS [43,44]. Table 4 shows the typical characteristics of the wastewater generated during fish preparation.
As shown in Figure 4, a large amount of wastewater is produced from non-process uses. The nature and amount of wastewater are dependent on the nature of the final product. Table 5 recaps the water consumed in fish and seafood canning processing units at distinct stages of the process.
The wastewater generated during fish processing is characterized by high salinity and organic loads and ranges between 8 and 18 m3 per ton of product [45]. Table 6 summarizes the characteristics of wastewater generated during canned fish production.
Fish-processing wastewater contains high organic loading (BOD5 and COD) and total solids. To meet legislative demands, several treatment methods should be implemented. The high organic content is attributed to the presence of guts, blood, and minces within fish-processing effluent. The cooking stage drains a large number of nutrients into the effluent. At high temperatures, the flesh proteins denature, releasing N2 [45]. Total solids can be subdivided into dissolved (TDS) from washing with seawater and suspended (TSS) solids from discharging fish flesh minces, debris, skin, and scales. Combining physiochemical and biological methods is required to eliminate all fish-processing wastewater contaminants effectively. Table 7 shows the developed treatment methods used for fish-processing wastewater.

2.1.3. Fruit and Vegetable Processing Industry

With valuable vitamins and minerals, fruits represent a remarkable portion of everyday diets. Processed fruits and vegetables represent a considerable share of the food market. In 2021, the global market of processed fruits and vegetables was around USD 105 billion, which is forecasted to increase steadily [46]. Fruit and vegetable processing aims to produce juice and other products and to extend the lifetime of raw materials through canning and drying. Figure 5 presents the various steps in the processing of fruits and vegetables.
The washing steps are the water-consuming steps in fruit and vegetables processing units, as shown in Figure 5. Primary washing, main washing, and rinsing consume around 18%, 53%, and 17% of the process water consumption, respectively. Domestic use and equipment cleaning are approximately 12% of the total water consumption. The water consumption in fruit and vegetable processing may range 1.5–5 m3 for each ton of product according to the feedstock and final product characteristics.
The wastewater contains suspended solids from soil and dirt, organic loads from biological elements such as leaves, branches, and rotten fruits, TN and TP from fertilizers, and COD from pesticides [47,48]. Table 8 recaps the characterizations of the wastewater produced during fruit and vegetable processing. Wastewater from fruit and vegetable processing units is highly polluted and requires efficient treatment before it can be discharged into the environment or recycled for further use. Combining biological and chemical treatment methods are needed to accomplish the desired removal and treatment efficiency. Table 9 displays wastewater treatment processes used in fruit and vegetable processing units. The highest removal efficiency can be achieved using hybrid biological-physiochemical methods.

2.1.4. Edible Oils Industry

Edible oils are used for daily cooking, produced from natural or synthetic sources (synthesized fats). Edible oils from natural sources are more widely used since they are associated with fewer health risks and a simple production process compared to edible oils from synthetic fats [49]. Statistics indicate an increasing demand for soybean, palm, and rapeseed oil. In 2019, the consumption of palm, soybean, and rapeseed reached 71.48, 55.46, and 45.27 million tons, respectively [50,51].
Extraction of edible oil from seeds and vegetables takes place in three main steps, including pretreatment (preparation), pressing (extraction), and refining [52,53]. Figure 6 shows a diagram of the general procedure of edible oil extraction from seeds and vegetables.
During the pretreatment step, biological and chemical substances that may interfere with oil extraction are removed, including optimizing the humidity content and cell wall breakage. During the pressing/extraction step, lipids are separated from the seeds, which can be achieved using high-pressure extraction, thermal treatment, milling, solvent extraction, milling, or enzymatic extraction. Finally, the smoking point, color, and clarity are improved during the refining step, which can be achieved using physical and chemical processes such as bleaching, neutralization, degumming, dewaxing, and deodorizing [54,55]. Water consumption mostly takes place in the pretreatment and refining steps. The process water is used for steam generation, cooling, and washing. Table 10 summarizes the average water consumption and wastewater generation in the edible oil extraction process.
The wastewater generated during edible oil extraction is characterized by high levels of COD, BOD5, TN, TP, TDS, TSS, oil, and grease. Wastewater generated during edible oil extraction is a nontoxic waste since edible oil extraction does not involve any chemical use. Table 11 shows characterizations of wastewater in various oil extraction units. Due to the existence of fatty acids in edible oils, BOD5, COD, oil, and grease levels are quite high in the edible oil extraction effluent. In contrast, proteins in seeds lead to a higher level of TN. Higher levels of TN and TP are attributed to the fertilizers used during seed/vegetable farming. The presence of TSS is attributed to soil, debris from trees, fruit, and dust washed out during the washing step.
A combination of biological and physiochemical treatment methods is necessary for developing an efficient treatment of wastewater generated during edible oil extraction. As indicated by the low biodegradability index of wastewater (low ratio of BOD5/COD), a single-step biological treatment method will not be enough to achieve efficient wastewater treatment [50]. Table 12 indicates various treatment methods in this field.

2.1.5. Dairy Industries

Due to the significant variation in dairy products, including, milk, cheese, cream, butter, yogurt, and powdered milk, several production methods and processes are used. Figure 7 illustrates the flow diagram of a dairy production process to produce primary dairy products [56,57,58,59,60]. To understand the variety in dairy processes, around 500 types of cheese are produced globally, resulting in several wastewater treatment processes based on the initial feedstock and the final product. The whey generated in the cheese industry varies in quantity based on the type of cheese produced; for hard cheese such as cheddar cheese, whey is produced in large amounts, whereas the whey generated during soft cheese production is quite limited.
The wastewater generated during the dairy industry may range between 0.5 and 20.5 L per kg of the dairy product. The wide range of wastewater production indicates significant variation in the dairy industry based on the composition and variety of the ultimate products. Table 13 shows water consumption and wastewater generation for different dairy production units [61,62,63,64,65]. Developing wastewater management methods and strategies is essential due to the large water consumption and the contaminants’ varying load and nature. Table 14 shows the characteristics of a multi-product dairy processing factory effluent, as the typical specifications of wastewater in milk processing units [66].
The wastewater generated from the dairy processing units will include high COD, BOD5, and TN, resulting primarily from cheese production [67]. Several parameters may affect the nature and loading of wastewater, including the processed milk amount, product type, production processes, and washing mechanism [68,69,70]. Due to the high TN, COD, and BOD5, biological treatment methods are very common in the dairy processing unit. Physicochemical treatment methods, including gravitational methods, membrane-based methods, and adsorption, are used to improve the effectiveness of the treatment method as an auxiliary process for biological treatment methods [71].
Advanced oxidation processes can efficiently treat the high COD effluent from dairy wastewater units. Activated sludge, SBRs, aerated lagoons, up-flow anaerobic sludge blankets (UASB), and anaerobic filters are biological methods that can efficiently reduce TN [72,73]. Algal treatment and microalgae cultivation units are necessary for managing dairy processing unit wastewater treatment to reduce the high concentration of nutrients. Table 15 summarizes the biological methods used for dairy processing wastewater treatment.

2.1.6. Grain Milling Industry

Corn, wheat, and rice, the most consumed grains, produced globally in 2019 were about 1100, 735, and 496 × 106 tons, respectively. Grains are used to produce starch, flour, proteins, carbohydrates, and animal food. Milled grains are produced and used in several types of foods, such as pasta and bread [74].
Grain milling can be categorized into dry milling using cylinder or disc mills; wet milling using cylinder or disc mills; and wet milling with stone mills. Water demand and wastewater generation vary considerably based on the nature of the grain milling process. Figure 8 illustrates the schematic of the general grain milling process.
Water demand is determined based on seed humidity. The grain humidity should be in the range of 14–16% by weight. In dry grain milling, water is used for product tempering and conditioning and the seeds are separated from the endosperm. Wastewater generation in dry mills is lower compared to wet milling, and water use is limited to site and device washing. In wet milling, a huge quantity of water is used in the washing stage, generating a large quantity of wastewater. Table 16 displays water demand and wastewater generation during the corn, wheat, and rice wet milling [75,76].
The wastewater generated from grain milling contains high loadings of COD, BOD5, TDS, TSS, oil, and grease. The high loadings are expected due to the presence of proteins and carbohydrates mainly produced during the washing step. Table 17 summarizes the wastewater characteristics for different grain seed milling processes.
Wastewater generated during grain milling is characterized by high loadings of organics, chemicals, and solids; different treatment methods are needed to achieve efficient treatment of wastewater, as shown in Table 18. Corn contains higher concentrations of carbohydrates and protein, leading to higher concentrations in the generated wastewater during corn milling, which requires more extensive wastewater treatment. The ion exchange process can be used to enhance the glucose and fructose syrup’s clarity in corn refineries, resulting in higher TDS [12].
As shown in Table 18, biological treatment methods are more efficient for corn milling wastewater treatment, while physical treatment methods are more appropriate for wheat milling wastewater treatment. Algal treatment methods are proposed for grain processing wastewater characterized by high levels of nutrients and almost no heavy metals. Algal biomass can be used in several industries such as the food and pharmaceutical industries and as a feedstock for biofuel production.

2.1.7. Bakery Industry

The bakery industry has a remarkable place in daily diets around the globe [77]. The bakery industry is estimated at USD 311 billion in the United States. The feedstock used in the bakery industry includes sugar, flour, yeast, oil, water, salt, and preservatives [78]. Figure 9 shows the diagram of a typical bakery industry process.
The bakery unit usually includes the following production steps: mixing, fermentation, baking, and storage. Equipment washing is the main wastewater-producing activity. Based on the factory capacity and the products’ range, water demand varies from 38 to 1140 m3/day [78]. The ratio of water used for the bakery product in weight is around 10. Half of the water demand is used for non-process functions such as washing and cooling, usually discharged as wastewater. The bakery industry wastewater is biodegradable, containing an elevated organic loading resulting from a high proportion of BOD5:N:P and BOD5/COD. Carbohydrates and lipids are the major contaminants in wastewater from bakery industries, with a weight percentage of around 70% carbohydrates and 20% lipids, indicating the presence of high loadings of BOD5 and COD. However, the carbohydrates and lipids recovered provide an excellent opportunity to develop an economical/cost-saving treatment method [79,80,81]. Table 19 displays the specification of wastewater from the bakery unit.
The ratio of BOD5/COD for bakery effluent is usually around 0.5; this ratio indicates the wastewater’s biodegradability and the effectiveness of biological treatment of the effluent. The presence of high TSS and TDS indicates the need for pretreatment methods and physical treatment methods. Aerobic and anaerobic biological treatment will be needed, as noted in the TN and TP levels, as shown in Table 19. Table 20 demonstrates the outstanding accomplishments in bakery wastewater treatment [85].
Bakery effluent treatment is not discussed in the literature in detail, which raises the need for more work to implement the circular economy concept for treating the bakery units’ wastewater. This wastewater could be a source of valuable materials such as fats, oils, and carbohydrates.

2.2. Other Food Processing Industries

In addition to the seven main food industry categories discussed previously, other food industries such as tea, sugar, cocoa, seasoning coffee, and prepared meals are usually classified as other food processing industries. Sugar, tea, and coffee will be reviewed due to their potential importance in the world food chain supply. Each industry is unique regarding water demand and wastewater generated through the process.

2.2.1. Sugar Production

A total of 174 million tons of sugar is produced annually. Around 80% of global sugar is produced from cane, and the remaining originates from beets [86,87]. The nature of the sugar extraction process may vary depending on the feedstock, affecting water demand and wastewater generation. Figure 10 shows the sugar production process from cane and beets, including water consumption and wastewater generation.
During sugar extraction from beets, water is used for beet washing and transportation, generating an effluent that contains high levels of BOD5 and TSS (from beetroots covered with mud and soil). Recently, dry cleaning and mechanical conveyors have been developed to minimize energy and water demand. During sugar extraction from sugarcane, water consumption occurs mostly during the wet milling of sugarcane when the imbibition water is added [88]. The water consumption in sugar production may range from 1.3 to 4.36 and from 3 to 10 m3 per ton for sugarcane and beet extraction, respectively. The water demand varies according to the initial conditions of the feedstock, involving humidity and dust. Around 20% of the water demand is discharged as wastewater when sugar is extracted from sugarcane, whereas 80% is discharged when sugar is produced from beets. High COD, BOD5, COD, TSS, and unpleasant odor characterize the wastewater generated during sugar extraction from beets. Table 21 shows the wastewater characteristics generated in sugar processing factories [88].
Biological treatment methods or a combination of physiochemical and biological treatment methods should be employed for treating the wastewater generated from the sugar industry since this wastewater is characterized by high levels of BOD5, COD, and TSS.

2.2.2. Tea Industry

Tea is produced from the leaves of the tea plant [89]. Tea leaves are the primary feedstock for producing tea products, including post-fermented and black tea. Figure 11 indicates the tea production process schematically. Around 1.4 m3 of water is consumed for each ton of tea produced, usually during oxidation and machine cleaning. The consumed water is discharged chiefly as wastewater. The wastewater is usually characterized by intense color and turbidity, including organic/inorganic chemicals starting from unprocessed and treated tea, grease/oil, detergents, and metallic particles, as demonstrated in Table 22.
Physiochemical treatment methods are recommended for treating in the tea industry, considering the low COD and BOD5 and associated minimal operating cost. For removing dyes and other components, such as phenols, AOPs showed the best removal efficiency [89].

2.2.3. Coffee Industry

Around 10 million tons of coffee is consumed annually worldwide, and this is increasing annually by 1.5% [90]. Two different methods of coffee processing are used: (1) the dry process and (2) the wet process, which varies considerably in terms of water and energy demands. Figure 12 shows the coffee processing phases.
Coffee bean processing involves the husks of coffee cherries removal and the beans drying. In dry coffee production, the husks of cherries are removed mechanically, and the drying is achieved using solar energy over two weeks. During wet coffee production, water is used in large amounts for sorting, skin removal, and washing coffee cherries [91]. Then, pulp removal can be achieved using machine-assisted aqua-pulping or the classic ferment-and-wash method. In the ferment-and-wash method, a large amount of water is used for bean fermentation and washing. Finally, coffee beans are washed in tanks or washing machines. During the wet process, around 12.5 m3 of water is used per ton of green coffee. The amount of wastewater generated is estimated at 3 m3 of highly polluted wastewater per ton of green coffee used. Table 23 shows the wastewater characteristics of coffee processing [92].
A perceptible quantity of BOD5 and COD generated during coffee processing necessitates advanced methods for wastewater treatment compared to the treatment method used in tea factories. Table 24 shows the most recent research on sugar, tea, and coffee processing/production wastewater treatment.

2.3. Different Wastewater Treatment Solutions

2.3.1. Treatment Unit Inlet Composition

The primary contaminants in food-processing wastewater are the organic molecules, which can be considered a nontoxic effluent [93]. However, low concentrations of cleaning products and other toxic compounds could be found unsuitable for regular treatment methods. For example, soybean processing generates around 10 L of wastewater, and tofu curd residues as a solid waste around 0.25 kg. Tofu-containing wastewater contains complex polysaccharides rich in nitrogen and contains low carbon, requiring a pretreatment step before conventional biological and physical treatment methods. Whey produced during cheese production is rich in lactose that cannot be fermented using traditional fermentation methods [94].
During potato processing, wastewater contains remarkable levels of starch, which can be used for alcohol production [95]. Tomato, grape, and apple processing waste generate a pomace that can be used as animal feed [96]. However, many of these wastes have some degree of utilization. Recently, several technologies have been developed to reduce pomace [97]. One of the most promising technologies is converting pomace into alcohol. However, choosing the optimum treatment method depends on the waste’s organic composition, which is vital for producing valuable products. Higher oxygen demand and carbohydrate content substrate will require an extensive treatment process, and the substrate can be used for generating alcohol. The optimum sugar concentration of substrates used for alcohol production should be 15–20%. Higher sugar concentration substrates can be diluted or pretreated using acid hydrolysis, heat treatment, or enzymatic hydrolysis [98].
A balanced carbon-to-nitrogen ratio (C/N) should be maintained before the substrate is fed to fermentation to avoid antagonistic effects. The balance can be kept by mixing several wastewater streams, such as the co-fermentation of corn with soy skim milk [99,100]. In many cases, food-processing wastewater does not have enough nitrogen content, which may require the addition of other supplements to ensure a balanced substrate for microorganisms during the fermentation process. Adding lipids improves the production of ethanol by around 14% [101]. However, adding lipids to the substrate should be considered based on the nature of the wastewater; for example, a low concentration of lipids in molasses stimulated ethanol production. In general, studying the composition of the wastewater will help in the careful design of an optimum process.
The following Table 25, Table 26 and Table 27 show the primary physical and chemical properties and composition of organic molecules usually found in wastewater generated during food processing. Wastewater rich in carbohydrates is an ideal substrate for alcohol production—usually, carbohydrates in food-processing wastewater range from 0.45% w/v to 4.3% w/v. thus, sugar or nitrogen sources should be added to provide enough nutrients for the microorganisms. The solid-containing wastewater contains a higher carbohydrate content of 29.2% w/w to 54.6% w/w; this wastewater represents an excellent raw material for alcohol production. Liquid effluents with low hydrocarbon content act as dilution agents or replacements for process water. However, nitrogen supplements could be needed to meet the growth requirements of the microorganism [102].
Solid-rich waste and liquid wastewater establish a perfect medium for producing alcohol. An economic analysis should be conducted before developing such an industrial-scale process.

Organic Contents

The organic content of food-processing waste is affected by several metal ions, which play a primary part in the metabolism of microorganisms. Metal ions participate in bio-catalytic reactions within growth enzymes, keeping the cell osmotic pressure. The deficiency or overload of mineral ions may result in cell death and limit alcohol production. Consequently, the concentration of minerals in the waste directly affects alcohol production. Whey substrate requires the addition of ferrous sulfate or ferric chloride, which could increase the butanol yield from 0.06 to 7.13 g/L and 4.32 g/L, respectively [103].

Inorganic Content (Minerals)

Adding minerals to the substrate is essential to maintain a high yield and to increase the selectivity of the desired product, such as the butanol-to-acetone ratio in whey fermentation. Minerals are essential for yeast strain stability and for improving ethanol production. A higher yield of the desired product is essential for reducing the energy demand of the process. The optimum concentration of mineral ions can be determined using the statistical design of the experiment. To optimize the concentration, several studies were found in the literature exploring ethanol production from molasses, seaweed, and bagasse [103].
Metal absorption is the limiting step in alcohol tolerance levels [103]. The tables above show the mineral composition of various FPWs. Mineral concentrations are higher in waste streams rich in solids; such waste can be used as a complete production medium for alcohol, with a limited need for adding mineral ions. Magnesium and zinc play a significant role in the glycolytic pathway and cell stability and regulate yeast stress during ethanol fermentation. Usually, solid waste does not have enough zinc to maintain the microorganisms’ growth, except grape pomace. For all food wastes listed except grape pomace, zinc supplements must be added to streams that may contain some solid waste.

2.3.2. Technologies for Food Industry Wastewater Treatment and Reuse

Water is a crucial component in various industrial processes worldwide. However, it is important to implement appropriate treatment techniques to prevent the release of contaminants into the environment [103,104,105]. Shockingly, nearly 80% of global wastewater remains insufficiently treated. Industrial pollutants such as suspended solids, grease, oil, and particles contribute to elevated COD, pH, BOD5, and turbidity, ultimately leading to surface and groundwater pollution. Such hazardous pollution poses a severe threat to human health. Therefore, it is imperative to develop effective treatment methods to avoid the discharge of industrial pollutants into the environment.
Figure 13 gives a brief outline of the different technologies currently being used to process food industry wastewater. As described by the Council Directive 2020/741/EC [106], a single technology or a group of numerous technologies can be used in conjunction with one another to meet the discharge criteria established for various physical, chemical, and biological parameters. The technology to be used typically depends on the extent of contaminants present in the wastewater [104].
Figure 13 provides a concise overview of the various technologies presently employed for food industry wastewater treatment. According to Council Directive 2020/741/EC, either a single technology or a combination of multiple technologies can be employed synergistically to achieve compliance with the set discharge standards concerning diverse physical, chemical, and biological parameters. The selection of the appropriate technology usually hinges on the concentration of contaminants found in the wastewater [104].
Food industry wastewater treatment technologies and reuse, including physical, chemical, and biological treatment methods, are shown in Figure 13. Physical treatment involves the removal of large particles through sedimentation or filtration. The chemical treatment uses chemicals such as coagulants and flocculants to remove dissolved contaminants. Biological treatment uses microorganisms to break down organic pollutants. Advanced treatment technologies such as membrane filtration and ozone treatment can further treat wastewater to meet stringent reuse standards. The processed water can be reprocessed for non-potable purposes such as irrigation or industrial processes, thus reducing the strain on freshwater resources and promoting sustainable water management practices in the food industry [103,104,105].

2.4. Challenges and Factors for Selecting the Optimum Treatment Method

When selecting the optimum treatment method for wastewater, several challenges and factors must be considered: the wastewater characteristics, the type and amount of contaminants present, the size and scale of the treatment facility, and the available resources. Factors such as cost, energy requirements, and maintenance needs must also be considered, as they can affect the long-term viability and sustainability of the chosen treatment method. Furthermore, regulatory requirements and environmental concerns are critical factors that must be considered when selecting a wastewater treatment method. Wastewater management is a crucial part of food industries to enhance productivity and reduce environmental effects. Process integration methods are practical tools to decrease water demand and wastewater generation by considering the physiochemical characteristics of the system under study, including water demand and minimum acceptable threshold for particular contaminants [104].
Water pinch analysis and mathematical optimization are standard process integration methods to reduce water demand and wastewater generation [98]. To achieve sustainability in food industries, the process should be modified to ensure higher productivity, lower resource consumption, and minimal environmental destruction [104,105]. Recently, process integration methods have attracted significant attention in food industries. Mixed integer nonlinear programming to manage water/wastewater in milk-processing units reduced water demand and wastewater generation by around 33 and 85%, respectively, by examining each unit’s needs and integrating the overall process [82]. The literature highlights the necessity to gather complete qualitative and quantitative information on water/wastewater flow rates, quality, and placement in the production unit. By employing water pinch analysis and mathematical optimization, 30% of water demand and wastewater generation were reduced in a corn refinery by developing a wastewater management system, which could be an ideal start for other food processing units [105]. Using a similar analogy, BOD5 was used as the critical contaminant for developing a wastewater management system, reducing water demand and wastewater generation by around 43 and 66%, respectively [82,107]. Figure 14 Advantages and disadvantages of the different nutrient recovery processes.
Conventional wastewater treatment has the following advantages: conventional methods such as sedimentation and primary treatment are often cost-effective and require less complex infrastructure. These methods effectively remove solid particles and suspended solids from wastewater. They generally have lower energy requirements compared to advanced treatment methods. On the other side, conventional methods are less effective at removing contaminants such as nutrients (nitrogen and phosphorus) and organic matter. They may not completely eliminate pathogens and microorganisms from the water. Conventional treatment processes produce significant amounts of sludge, which must be managed properly.
Chemical treatment methods can efficiently remove a wide range of contaminants, including heavy metals, organic pollutants, and nutrients. Chemical treatments, such as chlorination, can effectively disinfect and kill pathogens. Chemical treatment processes can be adjusted to target specific pollutants, making them versatile. On the other side, the procurement and handling of chemicals can be expensive. Chemical treatments often produce chemical residuals that need disposal, which can be environmentally challenging. Handling and storage of chemicals pose potential health and safety risks to workers. Some chemical treatments can introduce harmful byproducts or affect aquatic ecosystems. In addition, advanced chemical treatment processes can be complex to design and operate.
In practice, wastewater treatment units must combine both conventional and chemical methods to address a broad spectrum of contaminants effectively while considering cost and environmental impact. The choice of method depends on the specific wastewater composition and treatment goals [82].

2.4.1. Environmental Hazards of Industrial Wastewater

Industrial wastewater discharge into water bodies may result in severe water pollution and negatively impact humans and the ecosystem. Several contaminants are usually present in food-processing wastewater, including organic matter, hydrocarbons, suspended solids, inorganic dissolved salts, heavy metals, surfactants, and detergents. Contaminated water is unsuitable for drinking and irrigation and adversely affects humans, animals, plants, and aquatic life.

2.4.2. Water Quality

Water quality is the main parameter for developing wastewater management systems. Wastewater treatment scenarios, efficiency, and techniques are designed to address the characteristics of wastewater and water consumed by each unit. The water quality and characteristics are essential to using water pinch or optimization techniques. In wastewater management systems, treated wastewater streams are referred to as “sources” of water, while units in which water is used are commonly referred to as “sinks”. The minimum acceptable threshold of the water used in any sink process is essential to design a treatment method.
The operating conditions such as pressure, temperature, device materials, and porosity determine the minimum acceptable threshold of water required for each sink process [83,84]. Understanding the production process limitations is vital to determine acceptable water quality. As the wastewater characterizations such as contaminants (e.g., TSS, BOD5, COD) grow, applying water management strategies becomes more demanding and costly. Treatment methods that address specific contaminants are more favorable to use than other nonspecific wastewater treatment methods, considering their design and practice. However, applying such processes in food-processing wastewater treatment is problematic since treatment methods/processes are usually sensitive to different contaminants, and multiple-contaminant approaches are then suggested [94,108].

2.5. Development and Integrated Management

Treatment of food-processing wastewater will help recycle and reuse water, recover resources, and protect the environment. Industrial wastewater, in general, is divided into gray, white, and black water according to the wastewater characteristics and reuse potential. Graywater treatment is simple and requires solids removal before reusing [83]. White water can be reused for industrial applications without any treatment since the quality of white water is quite similar to fresh drinking water.
Graywater contains raw materials and products, increasing the potential for recovering resources and reusing water. Physical treatment methods are usually preferred for graywater treatment, as the organic wastewater loadings increase, including COD, BOD5, and other nutrients. Further complicated treatment processes are needed, and such wastewater is no longer considered graywater. Membrane-based techniques have shown efficient treatment of graywater produced from food processing units compared to standard physical methods considering water, energy, and land requirements [84].

2.5.1. Industrial Wastewater Treatment Levels

Industrial wastewater treatment is categorized into the following levels in Figure 15. The raw wastewater is treated first using preliminary and primary treatment methods to remove coarse materials and suspended particles. Then, the refined wastewater is treated using secondary/biological treatment methods [109].

2.5.2. Operations of Wastewater Treatment Processes

The treatment processes consist of several unit operations Figure 16.

2.5.3. Membrane Separation Techniques

Membrane separation techniques can separate valuable chemicals and raw materials with high efficiency and minimum energy requirement [110,111,112,113]. Due to the expected membrane fouling and the high concentration of suspended solids in food processing effluent, membrane fabrication, and regeneration were modified significantly to reduce the fouling effect. New research trends are directed toward manufacturing specific contaminants membranes, which can be used to remove specific contaminants at high efficiency. For example, several selective nanocomposite membranes were developed to remove heavy metals, ions, and pathogens.
Reducing the concentration of contaminants is essential to minimize the harmful effect on the environment. Several harmful compounds are released into the environment if food waste is not adequately treated, including organic solvents, phenolic compounds, sweeteners, artificial dyes, and food preservatives. The maximum permissible amount (MPA) of COD and BOD5 discharge is 120 and 40 mg·L−1, respectively. Usually, COD and BOD5 levels in food-processing waste could reach around 20 times the allowable MPA. Biological treatment methods must be used to reduce the high levels of COD and BOD5 discharged from the food industry.
TDS and TSS negatively impact unit operations, leading to membrane fouling, erosion, and environmental impacts. TDS and TSS are used, and non-soluble suspended matter is present to index the soluble and non-soluble suspended matter in the wastewater. TSS affects the membrane processes commonly used in the food industry and increases the membrane fouling rate [113]. COD, and insoluble chemicals such as pesticides from the TSS in food processing industries. Several treatment strategies and conventional treatment methods are necessary to reduce TDS and TSS. Several water management strategies rely on minimizing physical and organic contaminants from the source, such as separation-from-origin and preventing wastewater mixing.
Membrane treatment technology is one of the promising technologies for treating wastewater from food industries. However, membrane operation suffers from unavoidable fouling problems and high operating and initial costs. To use membrane technology effectively for wastewater treatment, the two significant challenges must be addressed. Fouling is the primary reason for the considerable delay in implementing membrane separation processes since it leads to high operating and maintenance expenses and lower separation efficiency, leading to a higher restoration frequency of membranes. Fouling occurs due to continued solids deposition on the membrane surface or the subsequent blocking of the membrane pores.
Nitrogen- and phosphorus-containing nutrients are the third challenging group of contaminants in food-processing wastewater treatment. N and P compounds originate from protein compounds and agricultural fertilizers such as N-NH3, N-NO3, and PO4 [104]. Controlling nitrogen and phosphorous content in the wastewater is important to maintain the biological treatment methods in good operating conditions. Higher levels of nitrogen may increase the chances of algal bloom. Harmful algal blooms (HABs) are the sudden and unrestrained wild species growth of algae. This type of algae is destructive to the ecosystem, releases toxic substances, and decreases dissolved oxygen, and increases fish and aquatic animal mortality [82]. Some forms of nitrate and nitrite may lead to a negative impact on human health. The MPA in the discharged wastewater of TN and TP is 40 mg/L. Several algal methods have been developed recently for treating meat, dairy, and edible oil processing units’ effluents. The cultivated algae are used later for producing biofuels. The algae processes are still under development, and further research is needed. Figure 17 illustrates the ladder of growing value proposition for water reuse as the water quality/the value chain investment increases.

3. New Integrated Methods and Technologies

3.1. Microbial Fuel Cells

Microbial fuel cells (MFC) can be used to recover valuable chemicals and energy by treating food industry wastewater. A direct product of MFC is clean electricity. MFC was used successfully to treat dairy industry wastewater for more than 75 days [114]. A 95% removal efficiency of BOD5 was achieved, resulting in a power density of 27 W.m3 [115,116]. MFC was used for treating the effluent of the vegetable oil industry using 20 samples for 72 h. The results indicated that MFC could play an influential role in treating effluent. MFC is improved with time and temperature at COD removal efficiency of 80%. MFC uses microorganisms to generate electricity, which affects the MFC performance; a plant-based rhizosphere microbial community can be employed to avoid such issues.

3.2. Recovery of Proteins and Lipids

Dairy industry wastewater contains high COD and BOD5 ladings due to lipids, proteins, and hydrocarbons. Na-lignosulphonate can recover valuable chemicals from wastewater and remove the BOD5. In total, 96 and 46% of the lipids and proteins were recovered at a BOD5 removal efficiency of 73% at 22 °C [117,118]. Algal photo-reactors represent an efficient method for recovering lipids and proteins and can be used for water-containing toxins, which can be treated using microalgae. Solvent extraction of lipids did not show interesting results in scaling the process to an industrial scale [119]. Lipids can also be produced by treating fish-processing wastewater using microalga cultivation of Chlorella vulgaris. This process can be developed further for producing lipids from fish-processing wastewater inside a bio-refinery process [120]. High turbidity could affect microalgae growth, so the TSS should be reduced before the biological treatment [121].

3.3. Recovery of Ammonium and Phosphate

Composting of food-processing waste generates struvite to recover ammonium and phosphate. The process can be combined with food-processing waste and sewage sludge ash. The precipitate consists of mostly struvite with a percentage of ~72%, demonstrating elevated P-bioavailability and heavy-metal traces [122]. Schizochytrium sp. is used for treating tofu whey wastewater to produce docosahexaenoic acid. COD, TN, and TP removal were 64.7, 59.3, and 66%, respectively [123]. Several processes were developed to recover ammonium and phosphate separately by using electrodialysis. A monovalent anion-selective membrane can prevent the contamination of phosphorus streams by ammonium or other single-charged anions [124,125,126,127].

3.4. Production of Biopolymers

Biopolymers are used in several applications. Biopolymers can be produced from food industry wastewater through extraction or fermentation without requiring pretreatment. Food industry waste, containing high organic content, is a potential feedstock for biopolymer production. Cupriavidus necator is used to convert brewery waste stream to produce poly-3-hydroxybutyrate biopolymer. The maximum biopolymer yield and volumetric productivity achieved were 0.28 g g−1 and 0.022 g L−1 h−1, respectively [128]. The process is still not economically viable due to the need for sterilization requirements and pure microbial cultures. The high production cost of biopolymer production procedures compared to traditional plastic production methods hindered the commercialization of the process.

3.5. Production of Xanthan

Biosynthesis of xanthan species while treating challenging winery wastewater is a viable option for recovering valuable resources from wastewater from food processing units. Maximum xanthan production was 23.85 g L−1. The conversion efficiency of sugar, nitrogen, and phosphorus was 90.8, 71.7, and 83.1%, respectively. This process can be employed for winery wastewater treatment and recovering valuable resources as feedstock for the xanthan production industry [129,130].

3.6. Biogas Production by Anaerobic Digestion

Anaerobic digestion (AD) of municipal solid waste was studied in detail for producing combined heat and power (CHP) [131,132]. AD of food industry wastewater and sewage sludge was conducted using two parallel anaerobic digestion reactors at a scale of 8500 m3 for each reactor [133,134]. In total, 8300 m3 d−1 of biogas was produced from each reactor; the unit was operated for 12 months. Around 0.048 m3 d−1 of biogas is produced from dairy-processing wastewater treatment using a reactor volume of 0.28 m3 using microwave and ultrasonic generators. Future work should target the process economics and pretreatment methods needed to improve the quality of feedstock [135,136].

3.7. Heat Recovery

Heat recovery from wastewater streams is not studied in detail. There is a potential to recover a considerable amount of heat from wastewater streams. In general, heat exchangers are employed in the food processing units to eliminate microbial activity and to increase the products’ shelf life. In addition, heat exchangers can condition products/streams before filling or drying [137,138]. Recovering the heat by heating up cold streams will minimize process energy demand. The optimum heat recovery process can be developed based on the operating temperature and wastewater volume. Several heat transfer systems have been developed and used in the food industry. Water was preheated to 60 °C in a whey facility by using heat in a stream at 230 °C, achieving 35–55% in energy efficiency. Heat recovery in the food industry can be achieved using gravity film and plate heat recovery methods.

3.8. Mining of Resources from Wastewater

Several valuable compounds are available in wastewater, so wastewater can be used to generate valuable natural resources. Resource reuse is more attractive when the re-source, remake, and rethink concept is applied for creating new added-value products from waste streams. Figure 18 shows the possibilities of resource recovery from wastewater [82].
Several methods can be used for nutrient recovery from wastewater streams, including chemical, biological, and membrane bioreactors, bio-electrochemical systems, and membrane photo-bioreactors. The recovery using chemical processes includes either adsorption or precipitation steps. The precipitation step is performed using magnesium- and calcium-based compounds to facilitate the precipitation process. The adsorption step is performed using either ion exchange, electrostatic attraction, or surface precipitation. Nutrient recovery using membrane systems is conducted using forward osmosis or electrodialysis. Nutrient recovery within the bio-electrochemical system and photo-bioreactor is performed by employing microbes and algae. An efficient nutrient recovery can be achieved by combining the forward osmosis process and the bio-electrochemical system. The membrane photo-bioreactor can be developed by combining combined photo-bioreactor with a membrane technology [139].

4. Water Management Framework

In the circular economy framework, economic development is directly proportional to resource conservation and environmental sustainability. Adopting the circular economy concept in wastewater management promotes resource recovery as a central element and provides a strategy to improve water supply. Water systems management to harmonize the circular economy concept is based on three principles: (i) design out waste externalities treatment process, (ii) keep resources in use, and (iii) regenerate natural capital [140]. There is a need to address both economic and environmental concerns associated with food-processing effluent. The optimum solution must align with sustainability goals.
Within the context of the circular economy framework, economic growth is closely tied to the conservation of resources and the sustainability of the environment. In the realm of wastewater management, embracing the circular economy concept places a strong emphasis on resource recovery and offers a strategy to enhance the water supply. The management of water systems, in alignment with circular economy principles, revolves around three core principles: (i) eliminating the creation of waste externalities in treatment processes, (ii) maintaining the utilization of resources, and (iii) rejuvenating our natural capital [140].
Consequently, the sustainable reclamation of resources from wastewater holds the potential to generate revenue by creating marketable products, ensuring the safety of water reuse, and upholding water quality standards tailored to specific applications and economic objectives [141]. To effectively integrate circular economy (CE) principles into the wastewater sector, besides technological advancements, various other factors such as financial viability, societal impact, environmental considerations, risk assessment, and energy efficiency must be carefully weighed. Moreover, it necessitates proper environmental education, heightened awareness, and a comprehensive understanding of CE principles to facilitate the adoption of a CE model. Therefore, the adoption of circular and sustainable solutions by companies and wastewater operators can significantly expedite the transition toward a CE model [142].
Food industry waste can be recycled to create a circular economy in agri-food fields. Waste recycling of food industry residues can produce value-added products since the waste contains valuable nutrients and is rich in renewable energy. Several useful products, such as biofuels, bioenergy, and bio-fertilizers, can be generated from food industry waste. In addition, metal compounds and nutrients can be extracted and reused in several applications. A circular economy concept in the food industry will help circulate resources and nutrients in a closed loop, minimizing discharging streams to the environment. Food waste can generate valuable chemicals and nutrients in addition to energy. In comparison, biodegradable materials can be recycled further to produce other biodegradable products, alternatively, as an end-of-life option in lieu of carbon capture for CO2 sequestration. To explore the opportunities for developing a circular economy in sustainable food waste management, understanding existing food waste situations worldwide is a crucial cornerstone [143].
Figure 19 illustrates the feasible route for recovering value-added products from food wastewater, improving the revenue generated.

4.1. Resource Recovery

Food-processing effluent contains valuable materials, including proteins and lipids, alongside low concentrations of heavy metals and toxicants. This emphasizes the importance of developing integrated management systems to recover these resources, improving the economic value of the process.
The resource recovery (4R concept) was developed based on the following four steps: REDUCE, REUSE, RECYCLE, and RECOVER. Around 20–30% of food is wasted during the pre-harvest step in developing countries due to several supply chain constraints. This ratio may reach up to 72% in some cases. It is crucial to develop technologies capable of recycling and repurposing food industry waste. Packing and containers made of plastic can be reused and recycled [144]. Considering economic and operating boundaries, waste cooking and palm shells can be converted into biodiesel [114]. Corncob is another food waste that can produce biofuels through pyrolysis. The produced fuel can be employed as a biofuel in addition to producing other valuable chemicals [145]. Three principles govern the circular economy: protecting and enhancing regular capital; the reorganization of resources by remanufacturing, restoring, and reusing materials inside their technical and biological cycles; and, finally, the utilization of food manufacturing byproducts and nutrients [146]. Implementing the circular economy instead of conventional WWT methods ensures valuable RR, including water and raw materials. In addition, the circular economy will reduce GHG emissions from food industrial activities [111].

4.2. (4R) Scheme

The 4R scheme can manifest in various forms: in-process reusing of IWW (industrial waste works) with/without treatment; IWW recycling, related to the water recovery for drinking by substituting or improving the existing treatment plant; resource recovery from wastewater generated during food processing, including inorganic nutrients such as nitrogen and phosphorus, organic fertilizers, biopolymers, energy, biogas, heavy metals, and salts [147]. These scheme strategies in IWW are designed to close industrial water cycles and obtain invaluable components that require a combination of wastewater treatment methods, as shown in Figure 20. However, wastewater comprises several contaminants, particular pollutants, elevated organic matter contents, and nonbiodegradable components, which make this task tedious [148].

5. Case Studies

5.1. Slaughterhouse Wastewater Management and Resource Recovery

Actual samples of municipal wastewater (SWW) were collected from licensed MPPs (Municipal Pollution Plants) in Ontario, Canada. These samples had average concentrations of 1950 mg/L for COD (Chemical Oxygen Demand), 1400 mg/L for BOD5 (Biochemical Oxygen Demand), 850 mg/L for TOC (Total Organic Carbon), 750 mg/L for TSS (Total Suspended Solids), 200 mg/L for TN (Total Nitrogen), and 40 mg/L for TP (Total Phosphorus). Additionally, anaerobic and aerobic sludge inocula were obtained from the Ash-bridges Bay Municipal Wastewater Treatment Plant in Toronto, Canada. The concentrations of these inocula were 40,000 mg/L and 3000 mg/L, respectively. These inocula underwent a 60-day acclimatization process. The combined ABR-AS-UV/H2O2 system used in the study included a 36-L Anaerobic Baffled Reactor (ABR) with five equal-volume chambers and individual biogas collection, a 12.65-L aerobic Activated Sludge (AS) reactor with controlled airflow to maintain dissolved oxygen (DO) concentrations at 2 mg/L, and a 1.35-L UV-C photoreactor with recycle. The UV photoreactor had an output power of 6 W and ensured uniform light distribution [149].
The meat processing industry is faced with the imperative of integrating waste minimization and resource recovery into its strategies for managing wastewater (SWW). This entails recognizing the portion of waste and byproducts within the industry that can be potentially recovered for direct reuse, including valuable nutrients and methane as a biofuel source. Figure 21 provides a schematic representation of the ideal operational flow within a meat processing plant and its supply chain, encompassing activities from animal farming and raw material acquisition to final product creation, waste disposal, and the reclamation of recoverable resources. In light of escalating environmental concerns and the call for sustainable practices, meat processing plants should prioritize cleaner production methods. This involves classifying and reducing waste generation at its source, with an emphasis on on-site treatment as the preferred approach for both water reuse and harnessing potential energy resources. Consequently, careful consideration must be given to adequately treating SWW effluents to align with these objectives.

5.2. Recycling and Reuse of Fish Processing [150,151]

The wastewater management concept aims to develop a management cycle or system to control the wastewater flow from several units and through the flowing streams. Disposal of untreated or poorly treated wastewater has severe consequences for health and the environment. The wastewater management cycle usually contains four essential interconnected steps/stages:
  • The reduction or mitigation of pollution at its source, considering both the pollution load and the volume of wastewater generated. This involves prohibiting or regulating the use of certain pollutants to prevent or restrict their entry into wastewater streams through various means, including regulatory and technical measures. Additionally, this step encompasses initiatives to minimize the quantity of generated wastewater, such as demand management and enhancing water use efficiency.
  • The elimination of pollutants from wastewater streams: Implement processes that can treat and eliminate wastewater contaminants, environmental consequences, or negative effects, generating a safe-to-use/discharge treated water stream without any environmental consequences or negative effects. The optimum treatment process is chosen based on the concentration and nature of contaminants and the end use of the treated water.
  • Wastewater reuse: Reusing treated/untreated wastewater can be done only in a monitored process to ensure safe use. Usually, treated water is used for irrigation, while with existing advanced treatment technologies, adequately treated water can be utilized in several applications after.
  • The valuable resources recovery: Wastewater contains several valuable compounds and nutrients that can be separated from wastewater either directly, such as heat and organic matter, or using extraction methods such as biofuels, in addition to nitrogen and phosphorus, which can be used for producing fertilizer. Impact of wastewater discharged to the environment as shown in Table 28.
Another crucial function of the wastewater management cycle is to alleviate adverse effects on human health, the economy, and the environment. When we consider the numerous advantages of enhanced wastewater management, many of these processes can be deemed cost-effective, thereby enhancing the overall value throughout the wastewater management cycle. This, in turn, supports the continued development of water supply and sanitation systems. Building on the premise that it is feasible to align water quality requirements with specific water use locations, the implementation of multiple-use systems with cascading reuse of water, moving from higher to lower water quality levels, can render water reuse more economically viable compared to establishing extensive water treatment facilities at each point of water extraction within a river basin. E.g., Potential recycling and reuse of effluents in the fish-processing industry as shown in Figure 22.
Recent market studies indicate a favorable trajectory in investments for water and wastewater treatment in developing countries. Globally, utilities’ annual capital expenditures for water infrastructure and wastewater infrastructure have been approximated at USD 100 billion and USD 104 billion, respectively.
The increasing demand for water resources underscores the necessity for a more efficient utilization of wastewater. Factors such as population growth, urbanization, shifting consumption patterns, climate change, biodiversity loss, economic expansion, and industrialization collectively influence water resources and wastewater streams, subsequently impacting atmospheric, terrestrial, and aquatic pollution. A more effective approach to wastewater management holds the potential to alleviate the consequences of some of these pressures. Regarding resource sustainability (as depicted in Figure 23), effective wastewater management mandates supportive policies: the implementation of policies that proactively reduce pollution at the source; tailored technologies: the utilization of customized technologies that facilitate treatment tailored to specific purposes, optimizing resource utilization; and resource recovery consideration: the acknowledgment of the advantages associated with resource recovery. By addressing these aspects, sustainable wastewater management can play a pivotal role in mitigating the impact of various environmental and societal challenges.
Taking a Best Available Technology (BAT) standpoint, adopting an approach that minimizes water, energy, and chemical usage while optimizing waste recovery is highly advantageous. Given the substantial demand for fish proteins in the fish industry and animal production, this approach can significantly enhance profit margins. In the case of filleting oily fish, the standard production process typically involves:
For a unit of 25,000 tons/year of herring (oily fish) to fillet:
  • Water:
Water consumption5–8 m3/ton fish processed
COD discharge85 kg/ton fish processed
Tot-N discharge2.5 kg N/ton fish processed
PO4-P discharge0.1–0.3 kg P/ton fish processed
  • Energy:
Filleting2–5 kWh/ton fish processed
Freezing50–70 kWh/ton fish processed
Chemicals Antioxidants100 kg/ton fish processes
Solid waste50% of processing amount
  • Recovered byproducts (as depicted in Figure 24).
Additionally, fish-processing plants improve economics significantly by recovering valuable materials such as protein, fat, and oil. Several BAT units around the world do not produce any waste, supporting the development of better waste treatment systems.
The fish-processing industry actively adopts waste recovery, reuse, and water-saving solutions. Local conditions, where there are no vulnerable recipients for nutrients or organic loading, have led the industry to adopt water treatment technologies that are not overly complex. However, the growing market for higher-value byproducts is likely to push Best Available Technology (BAT) solutions into a new era, where novel technologies will be employed to recover proteins and fat from the industry’s operations.
Furthermore, in the future, we may witness increasing interest in nutrient recovery, particularly phosphorus and nitrogen. Fish proteins are a valuable resource, and the reutilization of byproducts is not only economically advantageous but is also expected to drive BAT practices within this industry toward exciting new developments.
It is worth emphasizing that an effective implementation of BAT should serve as a pivotal tool in stimulating the advancement of a diverse and cutting-edge market for water and energy-efficient technologies and products. As a result, both governments and enterprises are evolving in their approach to managing processing activities, recognizing the importance of these sustainability initiatives.

6. Conclusions

The depletion of natural resources is a pressing global concern. A shift from a linear economic model to a circular one is imperative to address this challenge. In this context, wastewater emerges as a promising and regenerative source for sustainable water and resource recovery. However, there is a significant lack of awareness and understanding regarding the potential of wastewater treatment. It is crucial to acknowledge that wastewater facilities have the capacity to function as closed-loop wastewater bio-refineries. They can recover valuable resources such as chemicals, nutrients, bioplastics, enzymes, metals, and water, all of which serve as useful inputs for various industries and agriculture. This approach aligns with society’s increasing demand for water, resources, food, and energy, as it promotes the recycling and reuse of treated wastewater. Resource recovery fosters socioeconomic growth and mitigates environmental challenges stemming from waste generation. Therefore, embracing a circular economy approach in wastewater management holds the promise of addressing multiple societal and environmental needs.
Wastewater represents a valuable secondary resource that can yield more than just energy generation; it also offers an opportunity for extracting metals. Moreover, wastewater can be repurposed as a fertilizer, thereby diminishing the global environmental impact associated with the industrial production of such substances. Although water reuse carries numerous benefits, there remains a notable gap in its promotion and implementation. Effective water reuse necessitates a holistic approach founded on scientifically sound solutions, a robust legislative framework, stringent regulatory measures, and an enabling institutional environment. Industrial symbiosis presents a sustainable approach for managing the wastewater generated, fostering resource synergy. In this context, the concept of a circular economy emerges as the most promising strategy for handling wastewater. It leverages advanced integrated technologies, diverging from traditional treatment methods while concurrently advancing toward self-sustainability, carbon neutrality, and the attainment of Sustainable Development Goals (SDGs) for a more prosperous world.
One of the primary objectives of the 2030 Sustainable Development Goals for Water is to significantly reduce pollution, eliminate the practice of dumping waste, minimize the release of hazardous chemicals, cut global untreated wastewater in half, and promote greater recycling and safe reuse of water. This marks a substantial shift in the approach to wastewater management, moving away from a focus solely on “treatment and disposal”. This evolved perspective on wastewater management not only addresses critical concerns related to public health and the environment but also plays a pivotal role in ensuring food and energy security while mitigating the impacts of climate change. Embracing this new concept offers a multitude of benefits. Wastewater emerges as a plentiful source of valuable and sustainable resources within the framework of a circular economy, effectively harmonizing economic growth with the preservation of natural resources.
This is a state-of-the-art review of the capacity of global production, water demand, and wastewater generated by food processing industries worldwide. The primary approach is implementing sustainable food production in the food processing industries. Recent trends in process integration and water management highlight water reuse and recycling by using wastewater as a nonconventional water source. Nevertheless, implementing wastewater management systems requires collecting technical information about food processing industries. Water consumption, wastewater generation, and feasible wastewater treatment methods were reviewed initially.
The food processing industries use large amounts of water, which may negatively impact the environment and require several treatment methods before discharging the wastewater. To diminish the negative impacts, an integrated approach should be implemented, considering higher process productivity, water, and environmental protection to reduce water demand and generation of wastewater. A detailed systematic review was presented for sustainable wastewater management strategies by reusing and recovering the water and valuable resources. The ultimate goal of sustainable operation in food processing industries is increasing productivity, reducing operating costs, and eliminating environmental consequences. This article investigated the recovery of valuable resources to foster socioeconomic growth and to mitigate environmental challenges stemming from waste generation, enabling a circular economy approach in wastewater management.
Due to the limited availability of natural resources, including water, wastewater represents a great opportunity to recover valuable nutrients and resources. As a result of extended suburbanization and utilization of limited natural resources, better resource management tools and measures should be implemented. Several valuable chemicals and nutrients are present in wastewater generated from food industries, including organic materials, metals, nutrients, and chemicals. The management of such valuable resources can be achieved by implementing a transformation model for value-added materials recovery. The circular economy through a “closed-loop” process by reusing and recovering materials and energy was discussed in detail by identifying the emerging technologies available for treating food industry wastewater to recover resources. Biological treatment methods for food industry wastewater can treat the effluent and recover resources such as lipids and proteins, approaching the circular economy concept.
Technologies used for conventional wastewater treatment and advanced treatment technologies, including anammox technology, algal treatment, and microbial fuel cells, have been reviewed. In addition, recovering the energy contained in the wastewater streams in the form of biogas and biofuels was discussed as a tool for generating clean energy from wastewater streams. New trends in wastewater treatment and recovery processes, such as other single-cell proteins, biopolymers, and metals, were deliberated. The state-of-the-art highlighted the use of wastewater after adequate treatment in agriculture, fisheries, aquaponics, and algal cultivation. A critical assessment of adopting the circular economy in the food industry was discussed. Resource recovery from food industry wastewater through the integration of wastewater management systems will ensure efficient utilization of resources.
However, research is needed to develop more robust treatment systems that can handle the variation of food industry loadings and composition. In addition, it improves the performance of innovative treatment technologies such as pyrolysis reactors and microbial fuel cells. In future work, it is recommended to develop more robust technologies to valorize the wastewater resources. This review suggests that for future research directions, the development of more robust treatment systems, particularly pyrolysis reactors and microbial fuel cells, should be explored to effectively address variations in food industry loadings and composition. These systems can play a significant role in managing the wastewater generated by the food industry.

Funding

This research received no external funding.

Institutional Review Board Statement

Not applicable.

Data Availability Statement

No new data were created or analyzed in this study. Data sharing is not applicable to this article.

Conflicts of Interest

The authors declare no conflict of interest.

Abbreviations

ADAnaerobic digestion
BATBest available technologies
BOD5Biological oxygen demand
CHPCombined heat and power
CODChemical oxygen demand
HABHarmful algal blooms
IWWIndustrial Waste works
MFCMicrobial fuel cell
MPAMaximum permissible amount
O&GOil and grease
SBRSequence Batch Reactor
SGDSustainable development goals
TNTotal nitrogen
TPTotal phosphorus
TSTotal solids
TDSTotal dissolved solids
TSSTotal suspended solids
UASBUp-flow anaerobic sludge blankets
WWTPsWastewater treatment plants
UFUltrafiltration
ROReverse Osmosis
NFNanofiltration
RFBBRing Fixed Bed Bioreactor
ECElectro-coagulation
HCPBHollow-centered packed bed
MBRMembrane bioreactor
FPWsFood process wastewater
IMIntegrated Management
CECircular Economy
VAValue Added
RRResource Recovery
4RReduce, Reuse, Recycle, And Recover
SWWSlaughterhouse wastewater
SCSupply chain
WHOWorld Health Organization
UNICEFUnited Nations International Children’s Emergency Fund
UNEPUnited Nations Environment Program
WWWWorldwide Water

References

  1. Sedlak, D.L. Water 4.0: The Past, Present, and Future of the World’s most Vital Resource; Yale University Press: New Haven, CT, USA, 2019. [Google Scholar]
  2. Water.org. Water Crisis—Learn about the Global Water Crisis. 2021. Available online: https://water.org/our-impact/water-crisis (accessed on 7 August 2023).
  3. CDC. Global Wash Fast Facts. Centers of Disease Control and Prevention. 2021. Available online: https://www.cdc.gov/healthywater/global/wash_statistics.html (accessed on 31 May 2022).
  4. Singh, P. Why Delhi Is Staring at a Water Crisis—Delhi News—Times of India. 2018. Available online: https://timesofindia.indiatimes.com/city/delhi/why-delhi-is-staring-at-a-water-crisis/articleshow/64228440.cms (accessed on 19 May 2018).
  5. Vergine, P.; Salerno, C.; Libutti, A.; Beneduce, L.; Gatta, G.; Berardi, G.; Pollice, A. Closing the water cycle in the agro-industrial sector by reusing treated wastewater for irrigation. J. Clean. Prod. 2017, 164, 587–596. [Google Scholar] [CrossRef]
  6. FAO. The State of Food and Agriculture 2020. Revealing the True Cost of Food to Transform Agrifood Systems. Available online: http://www.fao.org/state-of-food-agriculture/en (accessed on 31 May 2022).
  7. Barbera, M.; Gurnari, G. Wastewater Treatment and Reuse in the Food Industry; Springer Briefs in Molecular Science; Springer: Cham, Switzerland, 2018. [Google Scholar]
  8. Mateus, A.; Torres, J.; Marimon-Bolivar, W.; Pulgarin, L. Implementation of magnetic bentonite in food industry wastewater treatment for reuse in agricultural irrigation. Water Resour. Ind. 2021, 26, 100154. [Google Scholar] [CrossRef]
  9. European Commission. Drinking Water Legislation—Environment. 2021. Available online: https://environment.ec.europa.eu/topics/water_en (accessed on 7 August 2023).
  10. Water, Wastes Digest. Heineken Pledges to Reduce Water Use. 2021. Available online: https://www.wwdmag.com/industrial-wastewater-recyclingreuse/heineken-pledges-reduce-water-use (accessed on 7 August 2023).
  11. Piesse, M. Global Water Supply and Demand Trends Point Towards Rising Water Insecurity; Future Directions International, APO: 2020. Available online: https://apo.org.au/node/276976 (accessed on 7 August 2023).
  12. Shrivastava, V.; Ali, I.; Marjub, M.M.; Rene, E.R.; Soto, A.M.F. Wastewater in the food industry: Treatment technologies and reuse potential. Chemosphere 2022, 293, 133553. [Google Scholar] [CrossRef]
  13. Negm, A.M.; Omran, E.-S.E.; Abdel-Fattah, S. Update, conclusions, and recommendations for the “unconventional water resources and agriculture in Egypt. In Unconventional Water Resources and Agriculture in Egypt; Negm, A.M., Ed.; Springer: Cham, Switzerland, 2018; pp. 509–532. [Google Scholar]
  14. Awad Abouelata, A.M.; Abdallah, S.M.A.; Sorour, M.H.; Shawky, N.A.; Abdel-Fatah, M.A. Modification and ionic stimulation of hollow fiber membrane by electric field for water treatment. J. Appl. Polym. Sci. 2020, 37, 49190. [Google Scholar] [CrossRef]
  15. Oki, T.; Quiocho, R.E. Economically challenged and water scarce: Identification of global populations most vulnerable to water crises. Int. J. Water Resour. Dev. 2020, 36, 416–428. [Google Scholar] [CrossRef]
  16. Darban, A.; Shahedi, A.; Taghipour, F.; Jamshidi-Zanjani, A. A review on industrial wastewater treatment via electrocoagulation processes. Curr. Opin. Electrochem. 2020, 22, 154–169. [Google Scholar]
  17. Malik, S.N.; Ghosh, P.C.; Vaidya, A.N.; Mudliar, S.N. Hybrid ozonation process for industrial wastewater treatment: Principles and applications: A review. J. Water Process Eng. 2020, 35, 101193. [Google Scholar] [CrossRef]
  18. Meneses, Y.E.; Stratton, J.; Flores, R.A. Water reconditioning and reuse in the food processing industry: Current situation and challenges. Trends Food Sci. Technol. 2017, 61, 72–79. [Google Scholar] [CrossRef]
  19. Nguegan, C.A.; Mafini, C. Supply chain management problems in the food processing industry: Implications for business performance. Acta Commer. 2017, 17, 1–15. [Google Scholar] [CrossRef]
  20. Aderibigbe, D.O.; Giwa, A.A.; Bello, I.A. Characterization and treatment of wastewater from food processing industry: A review. Imam J. Appl. Sci. 2017, 2, 27–36. [Google Scholar]
  21. Abdel-Fatah, M.A.; Hawash, S.I.; Shaarawy, H.H. Cost-effective Clean Electrochemical Preparation of Ferric Chloride and its Applications. Egypt. J. Chem. 2021, 64, 3841–3851. [Google Scholar] [CrossRef]
  22. Saxena, G.; Purchase, D.; Bharagava, R.N. Environmental hazards and toxicity profile of organic and inorganic pollutants of tannery wastewater and bioremediation approaches. In Bioremediation of Industrial Waste for Environmental Safety; Saxena, G., Bharagava, R.N., Eds.; Springer: Singapore, 2020; pp. 381–398. [Google Scholar]
  23. Natasha; Shahid, M.; Khalid, S.; Murtaza, B.; Anwar, H.; Shah, A.H.; Sardar, A.; Shabbir, Z.; Niazi, N.K. A critical analysis of wastewater use in agriculture and associated health risks in Pakistan. Environ. Geochem. Health 2020, 45, 5599–5618. [Google Scholar] [CrossRef]
  24. Udugama, I.A.; Petersen, L.A.; Falco, F.C.; Junicke, H.; Mitic, A.; Alsina, X.F.; Mansouri, S.S.; Gernaey, K.V. Resource recovery from waste streams in a water-energy-food nexus perspective: Toward more sustainable food processing. Food Bioprod. Process. 2020, 119, 133–147. [Google Scholar] [CrossRef]
  25. Narasimmalu, A.; Ramasamy, R. Food Processing Industry Waste and Circular Economy. IOP Conf. Ser. Mater. Sci. Eng. 2020, 955, 012089. [Google Scholar] [CrossRef]
  26. Morseletto, P. Targets for a circular economy. Resour. Conserv. Recycl. 2020, 153, 104553. [Google Scholar] [CrossRef]
  27. Dantas, T.; de-Souza, E.; Destro, I.; Hammes, G.; Rodriguez, C.; Soares, S. How the combination of Circular Economy and Industry 4.0 can contribute towards achieving the Sustainable Development Goals. Sustain. Prod. Consum. 2021, 26, 213–227. [Google Scholar] [CrossRef]
  28. Pukšec, T.; Foley, A.; Markovska, N.; Duić, N. Life cycle to Pinch Analysis and 100% renewable energy systems in a circular economy at sustainable development of energy, Water and Environment Systems 2017. Renew. Sustain. Energy 2019, 108, 572–577. [Google Scholar] [CrossRef]
  29. Skouteris, G.; Ouki, S.; Foo, D.; Saroj, D.; Altini, M.; Melidis, P.; Cowley, B.; Ells, G.; Palmer, S.; O’Dell, S. Water footprint and water pinch analysis techniques for sustainable water management in the brick-manufacturing industry. J. Clean. Prod. 2018, 172, 786–794. [Google Scholar] [CrossRef]
  30. Wong, C.Y.; Foo, D.C.; Sin, L.T. Design and optimization of water recovery system for a polylactide production process. Process Integr. Optim. Sustain. 2020, 4, 149–161. [Google Scholar] [CrossRef]
  31. Foo, D.C.; El-Halwagi, M.M.; Tan, R.R. Process integration for sustainable industries. In Encyclopedia of Sustainable Technologies; Abraham, M., Ed.; Elsevier Science: Amsterdam, The Netherlands, 2017; pp. 117–124. [Google Scholar]
  32. Valencia-Arredondo, J.A.; Hernández-Bolio, G.I.; Cerón-Montes, G.I.; Castro-Muñoz, R.; Yáñez-Fernández, J. Enhanced process integration for the extraction, concentration and purification of di-acylated cyanidin from red cabbage. Sep. Purif. Technol. 2020, 238, 116492. [Google Scholar] [CrossRef]
  33. Nemati-Amirkolaii, K.; Romdhana, H.; Lameloise, M.-L. Pinch methods for efficient use of water in food industry: A survey review. Sustainability 2019, 11, 4492. [Google Scholar] [CrossRef]
  34. Varbanov, P.S.; Klemeš, J.J.; Wang, X. Methods optimization, Process Integration and modelling for energy saving and pollution reduction. Energy 2018, 146, 1–3. [Google Scholar] [CrossRef]
  35. Ghimire, U.; Sarpong, G.; Gude, V.G. Transitioning Wastewater Treatment Plants toward Circular Economy and Energy Sustainability. ACS Omega 2021, 6, 11794–11803. [Google Scholar] [CrossRef]
  36. Amin, A.; Al Bazedi, G.; Abdel-Fatah, M.A. Experimental study and mathematical model of coagulation/sedimentation units for the treatment of food processing wastewater. Ain Shams Eng. J. 2021, 12, 195–203. [Google Scholar] [CrossRef]
  37. Yang, X.; Martinson, A.B.F.; Elam, J.W.; Shao, L.; Darling, S.B. Water treatment based on atomically engineered materials: Atomic layer deposition and beyond. Matter 2021, 4, 3515–3548. [Google Scholar] [CrossRef]
  38. FAO. Food and Agriculture Organization of the United Nations Agricultural Outlook 2019–2028; Gurria, A., da Silva, J.G., Eds.; FAO: Rome, Italy, 2019; pp. 166–180. [Google Scholar]
  39. Fornarelli, R.; Bahri, P.; Moheimani, N. Utilization of Microalgae to Purify Waste Streams and Production of Value Added Products; Australian Meat Processor Corporation: North Sydney, Australia, 2017. [Google Scholar]
  40. Abdel-Fatah, M.A.; Hawash, S.I.; Abd El Maguid, A. Treatment of Meat Processing Wastewater Using Coagulation and Sedimentation Techniques. ARPN J. Eng. Appl. Sci. 2020, 15, 2812–2819. [Google Scholar]
  41. Asgharnejad, H.; Nazloo, E.K.; Larijani, M.M.; Hajinajaf, N.; Rashidi, H. Comprehensive review of water management and wastewater treatment in food processing industries in the framework of water-food-environment nexus. Compr. Rev. Food Sci. Food Saf. 2021, 20, 4779–4815. [Google Scholar] [CrossRef]
  42. FAO. The State of World Fisheries and Aquaculture 2018–Meeting the Sustainable Development Goals; Fisheries and Aquaculture Department, Food and Agriculture Organization of the United Nations: Rome, Italy, 2018. [Google Scholar]
  43. Renuka, V.; Remya, S.; Jha, A.; Joseph, T. Nature and Composition of Fish Processing Industrial Waste and Handling Protocols; Veraval Research Centre of ICAR-Central Institute of Fisheries Technology: Kochi, Kochi, 2019. [Google Scholar]
  44. Bell, J.D.; Sharp, M.K.; Havice, E.; Batty, M.; Charlton, K.E.; Russell, J.; Adams, W.; Azmi, K.; Romeo, A.; Wabnitz, C.C.C.; et al. Realising the food security benefits of canned fish for Pacific Island countries. Mar. Policy 2019, 100, 183–191. [Google Scholar] [CrossRef]
  45. Ching, Y.C.; Redzwan, G. Biological treatment of fish processing saline wastewater for reuse as liquid fertilizer. Sustainability 2017, 9, 1062. [Google Scholar] [CrossRef]
  46. Compton, M.; Willis, S.; Rezaie, B.; Humes, K. Food processing industry energy and water consumption in the Pacific north-west. Innov. Food Sci. Emerg. Technol. 2018, 47, 371–383. [Google Scholar] [CrossRef]
  47. Fenech, M.; Amaya, I.; Valpuesta, V.; Botella, M.A. Vitamin C content in fruits: Biosynthesis and regulation. Front. Plant Sci. 2019, 9, 2006. [Google Scholar] [CrossRef]
  48. Chen, H.; Zhang, H.; Tian, J.; Shi, J.; Linhardt, R.J.; Ye, T.D.X.; Chen, S. Recovery of High Value-Added Nutrients from Fruit and Vegetable Industrial Wastewater. Compr. Rev. Food Sci. Food Saf. 2019, 18, 1388–1402. [Google Scholar] [CrossRef]
  49. Valta, K.; Damala, P.; Panaretou, V.; Orli, E.; Moustakas, K.; Loizidou, M. Review and Assessment of Waste and Wastewater Treatment from Fruits and Vegetables Processing Industries in Greece. Waste Biomass Valor 2017, 8, 1629–1648. [Google Scholar] [CrossRef]
  50. Tapera, M. Towards greener preservation of edible oils: A mini-review. Asian J. Appl. Chem. Res. 2019, 4, 1–8. [Google Scholar] [CrossRef]
  51. Khillari, S. Edible Oil and Fat Market Size; Share|Global Research Report; MarketsandMarkets™ Research Private Ltd: Pune, India, 2020. [Google Scholar]
  52. Pacheco, P.; Schoneveld, G.; Dermawan, A.; Komarudin, H.; Djama, M. Governing sustainable palm oil supply: Disconnects, complementarities, and antagonisms between state regulations and private standards. Regul. Gov. 2020, 14, 568–598. [Google Scholar] [CrossRef]
  53. Sun, Z.; Scherer, L.; Tukker, A.; Behrens, P. Linking global crop and livestock consumption to local production hotspots. Glob. Food Secur. 2020, 25, 100323. [Google Scholar] [CrossRef]
  54. Ochando-Pulido, J.M.; Corpas-Martínez, J.R.; Martinez-Ferez, A. About two-phase olive oil washing wastewater simultaneous phenols recovery and treatment by nanofiltration. Process Saf. Environ. Prot. 2018, 114, 159–168. [Google Scholar] [CrossRef]
  55. Cassano, A.; Conidi, C.; Galanakis, C.; Castro-Muñoz, R. Recovery of polyphenols from olive mill wastewaters by membrane operations. In Membrane Technologies for Biorefining; Figoli, A., Cassano, A., Basile, A., Eds.; Elsevier: Amsterdam, The Netherlands, 2016; pp. 163–187. [Google Scholar]
  56. Gotor, A.A.; Rhazi, L. Effects of refining process on sunflower oil minor components: A review. OCL 2016, 23, D207. [Google Scholar] [CrossRef]
  57. Kerr, W.L. Food drying and evaporation processing operations. In Handbook of Farm, Dairy and Food Machinery Engineering; Kutz, M., Ed.; Elsevier: Amsterdam, The Netherlands, 2019; pp. 353–387. [Google Scholar]
  58. Trichia, E.; Luben, R.; Khaw, K.-T.; Wareham, N.J.; Imamura, F.; Forouhi, N.G. The associations of longitudinal changes in consumption of total and types of dairy products and markers of metabolic risk and adiposity: Findings from the European Investigation into Cancer and Nutrition (EPIC)–Norfolk study, United Kingdom. Am. J. Clin. Nutr. 2020, 111, 1018–1026. [Google Scholar] [CrossRef]
  59. Janssen, E.; Swinnen, J. Technology adoption and value chains in developing countries: Evidence from dairy in India. Food Policy 2019, 83, 327–336. [Google Scholar] [CrossRef]
  60. Bortoluzzi, A.C.; Faitão, J.A.; Di Luccio, M.; Dallago, R.M.; Steffens, J.; Zabot, G.L.; Tres, M.V. Dairy wastewater treatment using integrated membrane systems. J. Environ. Chem. Eng. 2017, 5, 4819–4827. [Google Scholar] [CrossRef]
  61. Owusu-Sekyere, E.; Jordaan, H.; Chouchane, H. Evaluation of water footprint and economic water productivities of dairy products of South Africa. Ecol. Indic. 2017, 83, 32–40. [Google Scholar] [CrossRef]
  62. Atasoy, M.; Eyice, O.; Cetecioglu, Z. A comprehensive study of volatile fatty acids production from the batch reactor to anaerobic sequencing batch reactor by using cheese processing wastewater. Bioresour. Technol. 2020, 311, 123529. [Google Scholar] [CrossRef]
  63. Wang, Y.; Serventi, L. Sustainability of dairy and soy processing: A review on wastewater recycling. J. Clean. Prod. 2019, 237, 117821. [Google Scholar] [CrossRef]
  64. Chen, Z.; Luo, J.; Hang, X.; Wan, Y. Physicochemical characterization of tight nanofiltration membranes for dairy wastewater treatment. J. Membr. Sci. 2018, 547, 51–63. [Google Scholar] [CrossRef]
  65. Falahati, F.; Baghdadi, M.; Aminzadeh, B. Treatment of dairy wastewater by graphene oxide nanoadsorbent and sludge separation, using In Situ Sludge Magnetic Impregnation (ISSMI). Pollution 2018, 4, 29–41. [Google Scholar]
  66. Afsharnia, M.; Kianmehr, M.; Biglari, H.; Dargahi, A.; Karimi, A. Disinfection of dairy wastewater effluent through solar photocatalysis processes. Water Sci. Eng. 2018, 11, 214–219. [Google Scholar] [CrossRef]
  67. Bruguera-Casamada, C.; Araujo, R.M.; Brillas, E.; Sirés, I. Advantages of electro-Fenton over electrocoagulation for disinfection of dairy wastewater. Chem. Eng. J. 2019, 376, 119975. [Google Scholar] [CrossRef]
  68. Jaltade, A.S.; Mokadam, A.M.; Gulhane, M.L. Treatment of dairy wastewater using the Fenton’s oxidation process (FOP). In Global Challenges in Energy and Environment; Sivasubramanian, V., Subramanian, S., Eds.; Springer: Singapore, 2020; pp. 131–137. [Google Scholar]
  69. Panahi, A.H.; Meshkinian, A.; Ashrafi, S.; Khan, M.; Naghizadeh, A.; Abi, G.; Kamani, H. Survey of sono-activated persulfate process for treatment of real dairy wastewater. Int. J. Environ. Sci. Technol. 2020, 17, 93–98. [Google Scholar] [CrossRef]
  70. Chandra, R.; Castillo-Zacarias, C.; Delgado, P.; Parra-Saldívar, R. A biorefinery approach for dairy wastewater treatment and product recovery towards establishing a biorefinery complexity index. J. Clean. Prod. 2018, 183, 1184–1196. [Google Scholar] [CrossRef]
  71. Daneshvar, E.; Zarrinmehr, M.J.; Koutra, E.; Kornaros, M.; Farhadian, O.; Bhatnagar, A. Sequential cultivation of microalgae in raw and recycled dairy wastewater: Microalgal growth, wastewater treatment and biochemical composition. Bioresour. Technol. 2019, 273, 556–564. [Google Scholar] [CrossRef]
  72. Kumar, A.; Sharma, S.; Shah, E.; Parikh, B.; Patel, A.; Dixit, G.; Gupta, S.; Divecha, J. Cultivation of Ascochloris sp. ADW007-enriched microalga in raw dairy wastewater for enhanced biomass and lipid productivity. Int. J. Environ. Sci. Technol. 2019, 16, 943–954. [Google Scholar] [CrossRef]
  73. Daneshvar, E.; Zarrinmehr, M.J.; Hashtjin, A.M.; Farhadian, O.; Bhatnagar, A. Versatile applications of freshwater and marine water microalgae in dairy wastewater treatment, lipid extraction and tetracycline biosorption. Bioresour. Technol. 2018, 268, 523–530. [Google Scholar] [CrossRef]
  74. Ozturk, A.; Aygun, A.; Nas, B. Application of sequencing batch biofilm reactor (SBBR) in dairy wastewater treatment. Korean J. Chem. Eng. 2019, 36, 248–254. [Google Scholar] [CrossRef]
  75. USDA. Grain: World Markets and Trade; World Production, Markets, and Trade Reports; United States Department of Agriculture: Washington, DC, USA, 2020. [Google Scholar]
  76. Bavar, M.; Sarrafzadeh, M.-H.; Asgharnejad, H.; Norouzi-Firouz, H. Water management methods in food industry: Corn refinery as a case study. J. Food Eng. 2018, 238, 78–84. [Google Scholar] [CrossRef]
  77. Nougadère, A.; Sirot, V.; Cravedi, J.-P.; Vasseur, P.; Feidt, C.; Fussell, R.J.; Hu, R.; Leblanc, J.-C.; Jean, J.; Rivière, G. Dietary exposure to pesticide residues and associated health risks in infants and young children–results of the French infant total diet study. Environ. Int. 2020, 137, 105529. [Google Scholar] [CrossRef]
  78. Struk-Sokolowska, J.; Tkaczuk, J. Analysis of bakery sewage treatment process options based on COD fraction changes. J. Ecol. Eng. 2018, 19, 226–235. [Google Scholar] [CrossRef]
  79. Mohan, S.; Vivekanandhan, V.; Priyadharshini, S. Performance evaluation of modified UASB Reactor for treating bakery effluent. Int. J. Appl. Environ. Sci. 2017, 12, 1883–1894. [Google Scholar]
  80. Vistanti, H.; Malik, R.A.; Mukimin, A. Performance of a full-scale anaerobic digestion on bakery wastewater treatment: Effect of modified distribution system. J. Ris. Teknol. Pencegah. Pencemaran Ind. 2020, 11, 12–18. [Google Scholar] [CrossRef]
  81. Abdel-Fatah, M.A.; Sherif, H.O.; Hawash, S.I. Design parameters for waste effluent treatment unit from beverages production. Ain Shams Eng. J. 2017, 8, 305–310. [Google Scholar] [CrossRef]
  82. Ye, Y.; Ngo, H.H.; Guo, W.; Chang, S.W.; Nguyen, D.D.; Zhang, X.; Zhan, J.; Liang, S. Nutrient recovery from wastewater: From technology to economy. Bioresour. Tech. Rep. 2020, 11, 100425. [Google Scholar] [CrossRef]
  83. Amann, A.; Zoboli, O.; Krampe, J.; Rechberger, H.; Zessner, M.; Egle, L. Environmental impacts of phosphorus recovery from municipal wastewater. Resour. Conserv. Recycl. 2018, 130, 127–139. [Google Scholar] [CrossRef]
  84. Bouzas, A.; Martí, N.; Grau, S.; Barat, R.; Mangin, D.; Pastor, L. Implementation of a global P-recovery system in urban wastewater treatment plants. J. Clean. Prod. 2019, 227, 130–140. [Google Scholar] [CrossRef]
  85. Carboneras, M.B.; Cañizares, P.; Rodrigo, M.A.; Villaseñor, J.; Fernandez-Morales, F.J. Improving biodegradability of soil washing effluents using anodic oxidation. Bioresour. Technol. 2018, 252, 1–6. [Google Scholar] [CrossRef]
  86. Hubertus, G. OECD-FAO Agricultural Outlook 2019–2028; OECD Publishing: Paris, France, 2019. [Google Scholar]
  87. FAO. OECD-FAO Agricultural Outlook 2018–2027; OECD Publishing: Paris, France, 2018. [Google Scholar]
  88. Asgharnejad, H.; Sarrafzadeh, M.-H. Studying the process of sugar extraction from sugarcane and proposing solutions to reduce water consumption through water reuse. J. Water Wastewater Sci. Eng. (JWWSE) 2019, 4, 50–60. [Google Scholar]
  89. Peiter, F.S.; Hankins, N.P.; Pires, E.C. Evaluation of concentration technologies in the design of biorefineries for the recovery of resources from vinasse. Water Res. 2019, 157, 483–497. [Google Scholar] [CrossRef]
  90. Zhang, L.; Ho, C.T.; Zhou, J.; Santos, J.S.; Armstrong, L.; Granato, D. Chemistry and biological activities of processed Camellia sinensis teas: A comprehensive review. Compr. Rev. Food Sci. Food Saf. 2019, 18, 1474–1495. [Google Scholar] [CrossRef]
  91. FAO. Food and Agriculture Organization of the United Nations, Viale delle Terme di Caracalla 00153 Rome, Italy. 2020. Available online: http://www.fao.org/faostat (accessed on 7 August 2023).
  92. Cassano, A.; Conidi, C.; Ruby-Figueroa, R.; Castro-Muñoz, R. Nanofiltration and tight ultrafiltration membranes for the recovery of polyphenols from agro-food by-products. Int. J. Mol. Sci. 2018, 19, 351. [Google Scholar] [CrossRef]
  93. Piotr Konieczka, P.; Aliaño-González, M.J.; Ferreiro-González, M.; Barbero, G.F.; Palma, M. Characterization of Arabica and Robusta coffees by ion mobility sum spectrum. Sensors 2020, 20, 3123. [Google Scholar] [CrossRef]
  94. Gasper, D.; Shah, A.; Tankha, S. The framing of sustainable consumption and production in SDG 12. Glob. Policy 2019, 10, 83–95. [Google Scholar] [CrossRef]
  95. Amos, R.; Lydgate, E. Trade, transboundary impacts and the implementation of SDG 12. Sustain. Sci. 2019, 15, 1699–1710. [Google Scholar] [CrossRef]
  96. Momblanch, A.; Papadimitriou, L.; Jain, S.K.; Kulkarni, A.; Ojha, C.S.; Adeloye, A.J.; Holman, I.P. Untangling the water-food-energy-environment nexus for global change adaptation in a complex Himalayan water resource system. Sci. Total Environ. 2019, 655, 35–47. [Google Scholar] [CrossRef]
  97. Buabeng-Baidoo, E.; Mafukidze, N.; Pal, J.; Tiwari, S.; Srinivasan, B.; Majozi, T.; Srinivasan, R. Study of water reuse opportunities in a large-scale milk processing plant through process integration. Chem. Eng. Res. Des. 2017, 121, 81–91. [Google Scholar] [CrossRef]
  98. Ahmad, T.; Guria, C.; Mandal, A. A review of oily wastewater treatment using ultrafiltration membrane: A parametric study to enhance the membrane performance. J. Water Process Eng. 2020, 36, 101289. [Google Scholar] [CrossRef]
  99. Balla, W.H.; Rabah, A.A.; Abdallah, B.K. Pinch analysis of sugarcane refinery water integration. Sugar Tech. 2018, 20, 122–134. [Google Scholar] [CrossRef]
  100. Francisco, F.S.; Mirre, R.C.; Calixto, E.E.; Pessoa, F.L.; Queiroz, E.M. Water sources diagram method in systems with multiple contaminants in fixed flowrate and fixed load processes. J. Clean. Prod. 2018, 172, 3186–3200. [Google Scholar] [CrossRef]
  101. Castro-Muñoz, R. Retention profile on the physicochemical properties of maize cooking by-product using a tight ultrafiltration membrane. Chem. Eng. Commun. 2020, 207, 887–895. [Google Scholar] [CrossRef]
  102. Pichardo-Romero, D.; Garcia-Arce, Z.P.; Zavala-Ramírez, A.; Castro-Muñoz, R. Current advances in biofouling mitigation in membranes for water treatment: An overview. Processes 2020, 8, 182. [Google Scholar] [CrossRef]
  103. Javadinejad, S.; Mariwan, R.; Hamah, A.; Jafary, S.F. Analysis of gray water recycling by reuse of industrial wastewater for agricultural and irrigation purposes. J. Geogr. Res. 2020, 3, 20–24. [Google Scholar] [CrossRef]
  104. Hegde, S.; Lodge, J.S.; Trabold, T.A. Characteristics of food processing wastes and their use in sustainable alcohol production. Renew. Sustain. Energy Rev. 2018, 81, 510–523. [Google Scholar] [CrossRef]
  105. Hemalatha, M.; Sravan, J.S.; Min, B.; Venkata Mohan, S. Microalgae-biorefinery with cascading resource recovery design associated to dairy wastewater treatment. Bioresour. Technol. 2019, 284, 424–429. [Google Scholar] [CrossRef]
  106. Regulation (EU) 2020/741; the European Parliament and of the Council of 25 May 2020 on Minimum Requirements for Water Reuse. European Parliament: Strasbourg, France, 2020.
  107. Dong, W.; Gu, X.; Shu, Y.; Cao, D.; Yu, J.; Abdel-Fatah, M.A.; Fu, H. Pulse electrocoagulation combined with a coagulant to remove antimony in wastewater. J. Water Process Eng. 2022, 47, 102749. [Google Scholar] [CrossRef]
  108. Fu, H.; Zhong, L.; Yu, Z.; Liu, W.; Abdel-Fatah, M.A.; Li, J.; Zhang, M.; Yu, J.; Dong, W.; Lee, S.S. Enhanced adsorptive removal of ammonium on the Na+/Al3+ enriched natural zeolite. Sep. Purif. Technol. 2022, 298, 121507. [Google Scholar] [CrossRef]
  109. Singh, R.L.; Singh, R.P. Introduction. In Advances in Biological Treatment of Industrial Waste Water and their Recycling for a Sustainable Future. Applied Environmental Science and Engineering for a Sustainable Future; Singh, R., Singh, R., Eds.; Springer: Singapore, 2019. [Google Scholar] [CrossRef]
  110. Zhang, Y.; Zhang, C.; Qiu, Y.; Li, B.; Pang, H.; Xue, Y.; Huang, X. Wastewater treatment technology selection under various influent conditions and effluent standards based on life cycle assessment. Resour. Conserv. Recycl. 2020, 154, 104562. [Google Scholar] [CrossRef]
  111. Castro-Muñoz, R.; Díaz-Montes, E.; Cassano, A.; Gontarek, E. Membrane separation processes for the extraction and purification of steviol glycosides: An overview. Crit. Rev. Food Sci. Nutr. 2021, 61, 2152–2174. [Google Scholar] [CrossRef]
  112. Abdel-Fatah, M.A. Nanofiltration systems and applications in wastewater treatment. Ain Shams Eng. J. 2018, 9, 3077–3092. [Google Scholar] [CrossRef]
  113. Faragò, M.; Damgaard, A.; Madsen, J.A.; Andersen, J.K.; Thornberg, D.; Andersen, M.H.; Rygaard, M. From wastewater treatment to water resource recovery: Environmental and economic impacts of full-scale implementation. Water Res. 2021, 204, 117554. [Google Scholar] [CrossRef]
  114. Guerra-Rodríguez, S.; Oulego, P.; Rodríguez, E.; Singh, D.N.; Rodríguez-Chueca, J. Towards the implementation of circular economy in the wastewater sector: Challenges and opportunities. Water 2020, 12, 1431. [Google Scholar] [CrossRef]
  115. Kiselev, A.; Magaril, E.; Magaril, R.; Panepinto, D.; Ravina, M.; Zanetti, M.C. Towards circular economy: Evaluation of sewage sludge biogas solutions. Resources 2019, 8, 91. [Google Scholar] [CrossRef]
  116. Cecconet, D.; Molognoni, D.; Callegari, A.; Capodaglio, A.G. Agro-food industry wastewater treatment with microbial fuel cells: Energetic recovery issues. Int. J. Hydrogen Energy 2018, 43, 500–511. [Google Scholar] [CrossRef]
  117. Firdous, S.; Jin, W.; Shahid, N.; Bhatti, Z.A.; Iqbal, A.; Abbasi, U.; Mahmood, Q.; Ali, A. The performance of microbial fuel cells treating vegetable oil industrial wastewater Environ. Technol. Innovat. 2018, 10, 143–151. [Google Scholar]
  118. Maddalwar, S.; Nayak, K.K.; Kumar, M.; Singh, L. Plant microbial fuel cell: Opportunities, challenges, and prospects. Bioresour. Technol. 2021, 341, 125772. [Google Scholar] [CrossRef]
  119. Kurup, G.G.; Adhikari, B.; Zisu, B. Recovery of proteins and lipids from dairy wastewater using food grade sodium lignosulphonate. Water Resour. Ind. 2019, 22, 100114. [Google Scholar] [CrossRef]
  120. Zhao, Z.; Xue, R.; Fu, L.; Chen, C.; Ndayisenga, F.; Zhou, D. Carbon dots enhance the recovery of microalgae bioresources from wastewater containing amoxicillin. Bioresour. Technol. 2021, 335, 125258. [Google Scholar] [CrossRef]
  121. Kumar, M.; Sun, Y.; Rathour, R.; Pandey, A.; Thakur, I.S.; Tsang, D.C. Algae as potential feedstock for the production of biofuels and value-added products: Opportunities and challenges. Sci. Total Environ. 2020, 716, 137116. [Google Scholar] [CrossRef]
  122. Nguyen, T.D.P.; Nguyen, D.H.; Lim, J.W.; Chang, C.-K.; Leong, H.Y.; Tran, T.N.T.; Vu, T.B.H.; Nguyen, T.T.C.; Show, P.L. Investigation of the relationship between bacteria growth and lipid production cultivating of microalgae Chlorella vulgaris in seafood wastewater. Energies 2019, 12, 2282. [Google Scholar] [CrossRef]
  123. Chai, W.S.; Tan, W.G.; Munawaroh, H.S.H.; Gupta, V.K.; Ho, S.H.; Show, P.L. Multifaceted roles of microalgae in the application of wastewater biotreatment: A review. Environ. Pollut. 2021, 269, 116236. [Google Scholar] [CrossRef]
  124. Zin, M.M.T.; Tiwari, D.; Kim, D.J. Maximizing ammonium and phosphate recovery from food wastewater and incinerated sewage sludge ash by optimal Mg dose with RSM. J. Ind. Eng. Chem. 2020, 86, 136–143. [Google Scholar] [CrossRef]
  125. Kedwell, K.C.; Jørgensen, M.K.; Quist-Jensen, C.A.; Pham, T.D.; Van der Bruggen, B.; Christensen, M.L. Selective electrodialysis for simultaneous but separate phosphate and ammonium recovery. Environ. Technol. 2021, 42, 2177–2186. [Google Scholar] [CrossRef]
  126. Malila, R.; Lehtoranta, S.; Viskari, E.L. The role of source separation in nutrient recovery—Comparison of alternative wastewater treatment systems. J. Clean. Prod. 2019, 219, 350–358. [Google Scholar] [CrossRef]
  127. Wu, Y.; Luo, J.; Zhang, Q.; Aleem, M.; Fang, F.; Xue, Z.; Cao, J. Potentials and challenges of phosphorus recovery as vivianite from wastewater: A review. Chemosphere 2019, 226, 246–258. [Google Scholar] [CrossRef]
  128. Wang, S.K.; Wang, X.; Tian, Y.T.; Cui, Y.H. Nutrient recovery from tofu whey wastewater for the economical production of docosahexaenoic acid by Schizochytrium sp. S31. Sci. Total Environ. 2020, 710, 136448. [Google Scholar] [CrossRef]
  129. Micari, M.; Moser, M.; Cipollina, A.; Tamburini, A.; Micale, G.; Bertsch, V. Towards the implementation of circular economy in the water softening industry: A technical, economic and environmental analysis. J. Clean. Prod. 2020, 255, 120291. [Google Scholar] [CrossRef]
  130. Amini, M.; Yousefi-Massumabad, H.; Younesi, H.; Abyar, H.; Bahramifar, N. Production of the poly-hydroxy-alkanoate biopolymer by Cupriavidus necator using beer brewery wastewater containing maltose as a primary carbon source. J. Environ. Chem. Eng. 2020, 8, 103588. [Google Scholar] [CrossRef]
  131. Trivunović, Z.; Mitrović, I.; Puškaš, V.; Bajić, B.; Miljić, U.; Dodić, J. Utilization of wastewaters from red wine technology for xanthan production in laboratory bioreactor. J. Food Process. Preserv. 2022, 46, e15849. [Google Scholar] [CrossRef]
  132. Rončević, Z.; Grahovac, J.; Dodić, S.; Vučurović, D.; Dodić, J. Utilisation of winery wastewater for xanthan production in stirred tank bioreactor: Bioprocess modelling and optimization. Food Bioprod. Process. 2019, 117, 113–125. [Google Scholar] [CrossRef]
  133. Kumar, M.; Dutta, S.; You, S.; Luo, G.; Zhang, S.; Show, P.L.; Sawarkar, A.D.; Singh, L.; Tsang, D.C. A critical review on biochar for enhancing biogas production from anaerobic digestion of food waste and sludge. J. Clean. Prod. 2021, 305, 127143. [Google Scholar] [CrossRef]
  134. Mishra, A.; Kumar, M.; Bolan, N.S.; Kapley, A.; Kumar, R.; Singh, L. Multidimensional approaches of biogas production and up-gradation: Opportunities and challenges. Bioresour. Technol. 2021, 338, 125514. [Google Scholar] [CrossRef]
  135. Choi, G.; Kim, H.; Lee, C. Long-term monitoring of a thermal hydrolysis-anaerobic co-digestion plant treating high-strength organic wastes: Process performance and microbial community dynamics. Bioresour. Technol. 2021, 319, 124–138. [Google Scholar] [CrossRef]
  136. Dębowski, M.; Zieliński, M.; Kisielewska, M.; Kazimierowicz, J. Evaluation of anaerobic digestion of dairy wastewater in an innovative multi-section horizontal flow reactor. Energies 2020, 13, 2392. [Google Scholar] [CrossRef]
  137. Aziz, N.I.H.A.; Hanafiah, M.M.; Gheewala, S.H. A review on life cycle assessment of biogas production: Challenges and future perspectives in Malaysia. Biomass Bioenergy 2019, 122, 361–374. [Google Scholar] [CrossRef]
  138. Kavouras, K. Moving the Needle: Exploring Thermal Savings at Heineken by Targeting on Waste Heat Recovery Systems. Master’s Thesis, University of Twente, Enschede, The Netherlands, 2020. [Google Scholar]
  139. Başaran, A.; Yılmaz, T.; Çivi, C. Application of inductive forced heating as a new approach to food industry heat exchangers. J. Therm. Anal. Calorim. 2018, 134, 2265–2274. [Google Scholar] [CrossRef]
  140. Garver, K. The Latest in Heat Exchangers for Food Processing Process Expo. Chemosphere 2022, 293, 133553. [Google Scholar]
  141. Sánchez-Contreras, M.I.; Morales-Arrieta, S.; Okoye, P.U.; Guillén-Garcés, R.A.; Sebastian, P.J.; Arias, D.M. Recycling industrial wastewater for improved carbohydraterich biomass production in a semi-continuous photo-bioreactor: Effect of hydraulic retention time. J. Environ. Manag. 2021, 284, 112065. [Google Scholar] [CrossRef]
  142. Smol, M.; Adam, C.; Preisner, M. Circular economy model framework in the European water and wastewater sector. J. Mater. Cycles Waste Manag. 2020, 22, 682–697. [Google Scholar] [CrossRef]
  143. Carus, M.; Dammer, L. The “Circular Bioeconomy” Concepts, Opportunities and Limitations. Ind. Biotechnol. 2018, 14, 83–91. [Google Scholar] [CrossRef]
  144. López-Gómez, J.P.; Venus, J. Potential role of sequential solid-state and submerged-liquid fermentations in a circular bioeconomy. Fermentation 2021, 7, 76. [Google Scholar] [CrossRef]
  145. Gomes, D.; Cruz, M.; de Resende, M.; Ribeiro, E.; Teixeira, J.; Dominques, L. Very high gravity bioethanol revisited: Main challenges and advances. Fermentation 2021, 7, 38. [Google Scholar] [CrossRef]
  146. Lafortune, G.; Fuller, G.; Bermont-Diaz, L.; Kloke-Lesch, A.; Koundouri, P.; Riccaboni, A. Achieving the SDGs: Europe’s Compass in a Multipolar World; Europe Sustainable Development Report 2022; SDSN and SDSN Europe: Paris, France, 2022. [Google Scholar]
  147. Ehalt Macedo, H.; Lehner, B.; Nicell, J.; Grill, G.; Li, J.; Limtong, A.; Shakya, R. Distribution and characteristics of wastewater treatment plants within the global river network. Earth Syst. Sci. Data 2022, 14, 559–577. [Google Scholar] [CrossRef]
  148. Mejía-Marchena, R.; Maturana-Córdoba, A.; Gómez-Cerón, D.; Quintero-Monroy, C.; Arismendy-Montes, L.; Cárdenas-Pérez, C. Industrial wastewater treatment technologies for reuse, recycle, and recovery: Advantages, disadvantages, and gaps. Environ. Technol. Rev. 2023, 12, 205–250. [Google Scholar] [CrossRef]
  149. UNESCO. The United Nations World Water Development Report 2019: Wastewater, The Untapped Resource; UNESCO: Paris, France, 2020. [Google Scholar]
  150. Ferraciolli, L.; de Bem Luiz, D.; Naval, L. Potential for reuse of effluent from fish-processing industries. Rev. Ambient. Água 2017. [Google Scholar] [CrossRef]
  151. Ahmed, Z. Treatment and Reuse of Wastewater of Fish Processing Industry; U.S.—Pakistan Center for Advanced Studies in Water (USPCAS-W), MUET: Jamshoro, Pakistan, 2019. [Google Scholar]
  152. Farooq, R.; Ahmad, Z. Slaughterhouse Wastewater: Treatment, Management, and Resource Recovery. In Physico-Chemical Wastewater Treatment and Resource Recovery; InTech Open Access Publisher: Rijeka, Croatia, 2017. [Google Scholar] [CrossRef]
Figure 1. The nominal percentage of water consumed in different food industry sectors [12].
Sustainability 15 16193 g001
Figure 2. Interconnection between water demand, environmental protection, and enhancing food productivity [35].
Sustainability 15 16193 g002
Figure 3. Meat processing industry, water demand, and wastewater generation.
Sustainability 15 16193 g003
Figure 4. Shows the schematic process of fish processing.
Sustainability 15 16193 g004
Figure 5. Diagram of fruit (A) and vegetable (B) processing.
Sustainability 15 16193 g005
Figure 6. Edible oil production diagram.
Sustainability 15 16193 g006
Figure 7. Process diagram of the dairy industry.
Sustainability 15 16193 g007
Figure 8. Diagram of the grain milling process.
Sustainability 15 16193 g008
Figure 9. Diagram of the bakery industry.
Sustainability 15 16193 g009
Figure 10. Sugar production from (A) beets and (B) sugarcane.
Sustainability 15 16193 g010
Figure 11. Diagram of tea production.
Sustainability 15 16193 g011
Figure 12. Diagram of coffee processing.
Sustainability 15 16193 g012
Figure 13. An outline of the different wastewater treatment technologies [12].
Sustainability 15 16193 g013
Figure 14. Advantages and disadvantages of different nutrient recovery processes [82].
Sustainability 15 16193 g014
Figure 15. Treatment of industrial wastewater [109].
Sustainability 15 16193 g015
Figure 16. Wastewater treatment operations [109].
Sustainability 15 16193 g016
Figure 17. Ladder of increasing value propositions for reuse with increasing investments in water quality or the value chain [82].
Sustainability 15 16193 g017
Figure 18. Different aspects of resource recovery from wastewater [82].
Sustainability 15 16193 g018
Figure 19. The feasible route for generating value-added products from wastewater [82].
Sustainability 15 16193 g019
Figure 20. 4R scheme [148].
Sustainability 15 16193 g020
Figure 21. Presents a schematic illustration of the ideal operation of a meat processing plant and supply chain.
Sustainability 15 16193 g021
Figure 22. Potential recycling and reuse of effluents in the fish-processing industry [149].
Sustainability 15 16193 g022
Figure 23. Resource perspective.
Sustainability 15 16193 g023
Figure 24. Normal inputs/outputs from the filleting of oily fish [152].
Sustainability 15 16193 g024
Table 1. Estimated volume of wastewater produced for various food products [36].
ProductWastewater (m3/ton)COD (kg/m3)
Dairy6.51.5–5.2
Fish132.5
Meat and poultry132–7
Sugar refining111–6
Starch111.5–42
Fruits, vegetables, and juices212–10
Vinegar28.50.7–3
Table 2. Characteristics of meat production wastewater [40].
MeatCOD mg/LBOD5 mg/LTN mg/LTSS mg/LO&G mg/L
Beef422012094271164na
Poultry95040080240120
Pork4310na2751240125
Table 3. Technologies used for the treatment of wastewater in the meat processing industry.
MethodParameterRemoval Efficiency (%)
Up-flow anaerobic sludge blanket (UASB)COD78–80
Oil and grease (O&G)68–70
Coagulation/FloatationTotal Solid (TS)85
O&G85
BOD562–78.8
COD74.6–79.5
Algal Treatment(NH3-N)68.75–90.38
Total Nitrogen (TN)30.06–50.94
Total Phosphorus (TP)69
TN67
COD91
A2O BioreactorTP83.48
TN90.48
COD98.33
Algal TreatmentBOD597
COD94
TP94
Anaerobic Baffled Reactor with
Activated Sludge
Total Organic Carbon (TOC)85
TN72
Total Suspended Solids (TSS)>95
Algal TreatmentNH3-N89.74–99.03
Phosphate (PO43−)92.39–99.93
Sequence Batch Reactor (SBR)COD98
BOD597
TSS89
TN91
TP86
Table 4. Wastewater characteristics of fish preparation [43].
ParameterR (1)R (2)R (3)
BOD5 (mg/L)3163858
COD (mg/L)1518 ± 584.43325
Total Nitrogen (mg/L)112 ± 34.5410
Turbidity (NTU))64.9
TSS (mg/L)418 ± 487.2703770
pH7.6775.5–8.5
Table 5. Water demand during the production of canned fish.
ProductWater Requirement (m3/h Normalized for 1 Ton of Raw Fish)
Thawing/WashingCooking/Can WashingSterilizationAdditional UseTotal
Tuna8412832
Sardines6412628
Salmon410216
Shrimp86216
Table 6. Wastewater characterization in canned fish industries [40].
ProductBOD5
(mg/L)
COD
(mg/L)
Conductivity (mS·cm−1)TSS
(mg/L)
TN
(mg/L)
Tuna4569831324.83150471
Tuna330055539.211575440
Shrimp9801595na44363
Sardines1065132012.3490336
Table 7. Wastewater treatment processes in fish-processing industries [45].
Treatment ProcessParameterRemoval %
CrystallizationCOD40.1
TSS21.6
TN93.8
Sedimentation/FloatationBOD590
COD60
TSS95
NH4+-N50
Ultrafiltration (UF)BOD524.4
COD35.2
Reverse Osmosis (RO)/UV DisinfectionDOC99.9
O&G99.8
TSS98.4
Hetero-trophics100
Ring Fixed Bed Bioreactor (RFBB)BOD577
COD80
NH4+-N42
Algal TreatmentCOD99.9
TDS19.4
NH4+-N93.1
Moving Bio-Bed Reactor/UASB/Fluidized Immobilized Catalytic Carbon Oxidation/Chemo Autotrophic Activated CarbonCOD99
Protein99
Lipid100
O&G100
Table 8. Characterizations of wastewater generated during fruit and vegetable processing.
ParameterR (1)R (2)R (3)
COD (mg/L)22,30021,04010,913
BOD5 (mg/L)14,30013,9006900
TS (mg/L)12,40045902100
TN (mg/L)220na252
TP (mg/L)46512.420.8
Table 9. Technologies employed in fruit and vegetable industry for the treatment of wastewater.
MethodParameterRemoval (%)
Aqueous phase reformingCOD79.7
TOC94.9
FentonCOD70.2
Polyphenol36.1
ElectrocoagulationCOD66
Color98
Fenton/CoagulationCOD80
Turbidity99
TSS95
Up-flow anaerobic stage reactor and Activated sludgeCOD97.5
BOD599.2
TSS94.5
O&G98.9
Aerobic with CoagulationCOD99.6
Turbidity94.4
Immobilized Cell BioreactorCOD89.5
PlasmaCOD93.3
Endotoxin90.2
Table 10. Average water requirement and wastewater generation.
OilWater Needed for Each Ton of Produced Oil (m3)Wastewater Generated per Ton of Seed (m3)
Palm2.4500.87
Soybean3.3658.5
Rapeseed1.8600.85
Table 11. Characteristics of edible oil wastewater [51].
ParameterPalm OilSoybean OilRapeseed Oil
pH3.4–5.24.26.3–7.2
BOD5 (mg/L)10,250–43,75043404300–4650
COD (mg/L)15,000–100,00017,00013,800–15,000
TS (mg/L)5000–54,00067003800–4100
TN (mg/L)180–1400nana
TP (mg/L)180na62
O&G (mg/L)400015503600–3900
Table 12. Edible oil effluent treatment processes.
ProcessOilParameterRemoval (%)
Magnetic field and AdsorptionPalmColor39
TSS61
COD46
Microbial fuel cells + Biological aerated filtersPalmNH3-N93.6
COD96.5
UASB–Hollow-centered packed bed (HCPB)PalmCOD86.7
UASB-HCPBPalmBOD590
COD88
FlocculationPalmTSS82.97
Turbidity88.62
COD53.23
Color91.76
Algal TreatmentPalmCOD71
Fenton advanced oxidation process (AOP)PalmCOD85
Electrocoagulation—PeroxidationPalmColor96.8
TSS100
COD71.3
SBRPalmBOD596
COD98
TSS99
Ultrafiltration + AdsorptionPalmTDS47
TSS71
COD42
BOD563
Turbidity63.3
Algal ProcessPalmTN86
Phosphate85
TOC77
COD48
The integrated 2-phase anaerobic reactorSoybeanCOD80
Yeast TreatmentSoybeanCOD94
Internal circulation-anoxic/oxic
coupling reactor
SoybeanCOD90
TN98
Continuous aerobic/anaerobic in MBBRSoybeanCOD94.4
TN76
Algal treatmentSoybeanCOD77.8
TN89
Electrocoagulation and
Electro-oxidation
RapeseedCODs99
TSS100
DOC95
Electrochemical PeroxidationRapeseedCODs77
TSS100
DOC86
Photo-FentonRapeseedCOD80
TOC70
Hybrid TiO2
/UV/ultrafiltration
RapeseedCOD82
O&G86
Microbial fuel cellVegetableCOD90
TSS64
Phosphate73.6
Turbidity91.5
Table 13. Water demand in dairy processing.
ProductWater UtilizationUnit
Milk and dairy drinks0.5–4.1L W/L milk
Cheese0.6–2.9L W/L milk
Powdered products0.1–2.7L W/L milk
Frozen milk products15.7L W/kg of product
Cream3.3L W/kg of product
Butter4L W/kg of product
Yogurt and fluid products1.2L W/kg of product
Table 14. Wastewater characterization in dairy production.
Parameter (mg/L)RangeAverage
COD1906–25132131
BOD51372–18091536
TN246–297273
TP55–7360
TN218–241233
NO3-N22–4838
Table 15. Biological treatment processes employed in dairy wastewater treatment.
MethodParameterTreatment (%)
Algal TreatmentCOD76.77
TN92.15
Phosphate100
COD95.1
NO3-N79.7
TP98.1
TDS22.8
Algal TreatmentCOD64.47
TN86.21
Phosphate89.83
SBBRCOD81.8
Phosphate94
NH3-N85.1
SBRCOD63.5
Phosphate88
NH4+-N66
UAASBCOD71.27
Phosphate96.54
NH4+-N95.88
Airlift reactor with aerobic granular sludgeCOD81–93
BOD585–94
TN52–80
Combined UASB and Membrane bioreactor (MBR)COD95–99
Hybrid MBRCOD95
MBRCOD94.1
BOD598
NH4+-N100
Floating activated sludgeCOD77
Up-flow anaerobic/aerobic/anoxic bioreactorCOD>90
TN>50
TP>50
Aerobic sequencing batch flexible fiber biofilm reactorCOD98
TSS99
Airlift bioreactorCOD99
TN79
TP63
Table 16. Water demand and wastewater generation in grain wet milling units.
GrainWater Requirement
(m3 per Ton of Grain)
Wastewater Generation
(m3 per Ton of Grain)
Corn43.6
Wheat0.070.06
Rice1.30.3
Table 17. Wastewater characteristics for different grain milling processes.
GrainProcessBOD5
(mg/L)
COD
(mg/L)
TSS
(mg/L)
TDS
(g/L)
O&G
(mg/L)
pH
CornWet26,000106,6001095.2
WheatWet61416808181.810387
WheatDry80154940.3Nil7.5
RiceWet1200135011000.77.5
Table 18. Wastewater treatment processes in grain milling units.
GrainProcessSource of WastewaterParameterEfficiency of
Removal (%)
WheatFiltration+ centrifugation+
filtration column + UV
Washing wastewaterBOD545
DO71
Conductivity13
Turbidity82
WheatOzone oxidationEntire wastewaterPhenols80
WheatCoagulationEntire wastewaterTurbidity98
Cornmicro-electrolysis + two-phase
anaerobic-aerobic + electrolysis
Modified and oxidized starch wastewaterCOD96
CornInternal circulation anaerobic + two-stage AO biochemical
+ modified Fenton
Starch wastewaterCOD99.8
NH3-N98.7
TN99
CornSedimentation + microfiltration
+ reverse osmosis
Starch washing wastewaterTSS99.3
TS99.6
BOD5100
CornAlgal treatmentCationic starch wastewaterTSS80
TP33
RiceUltrafiltrationTotal wastewaterCOD63
Color67
RiceAlgal treatmentParboiled rice wastewaterTP93.9
NH3-N100
BOD598.7
COD91.6
TDS93.5
RiceAlgal treatmentEntire wastewaterTP68.12
TN49.32
Table 19. Wastewater characteristics of the bakery industry.
Parameter, (mg·L−1)[82][83][84]
pH64.7–5.13.5–3.8
TSS11806000881–1124
TDS3600
BOD225032001603–3389
COD570070003984–9672
TN60–9036
TP30–1007
O&G96820
Table 20. Technologies for treating wastewater from bakery industry.
ProcessStageParameterRemoval Efficiency (%)
ElectrochemicalPre-treatmentCOD6–8
Turbidity32–98
Constructed wetlandBiological treatmentTKN57
TP65
BOD592
TSS69
O&G99
UASBBiological treatmentCOD83.1
UASBBiological treatmentCOD92
Table 21. Wastewater characteristics in the sugar production industry.
ParameterBeetCane
CODt (mg/L)6621 ± 113.2965–11,640
CODs (mg/L)6165 ± 517.1799–10,640
BOD5 (mg/L)38371939–2347
TKN (mg/L)1020–43
TP (mg/L)2.73–31
TSS (mg/L)665 ± 21.2288–5030
VSS (mg/L)335 ± 7.1110–1990
pH6.824.4–4.6
Table 22. Wastewater characteristics in tea industries.
ParameterR (1)R (2)
Turbidity (NTU)11,5499210
COD (mg/L)9850628
BOD5 (mg/L)na193.4
TSS (mg/L)8945na
TOC (mg/L)5057na
pHna6.69
Conductivity (μS·cm−1)na317
Table 23. Characteristics of wastewater from coffee processing.
TypepHBOD5 (g/L)COD (g/L)TS (g/L)TP (mg/L)TN (g/L)
Arabica3.9–4.13.6–15.26.2–31.55.4–13.45–8.80.1–0.12
Robusta4.1–4.610.8–13.215–18.16.3–124–7.30.02–0.04
Table 24. Technologies used for treating wastewater generated in sugar, tea, and coffee industries [50].
Characteristics of WastewaterMethodParameterRemoval Efficiency (%)
SugarUASBCOD78–82
SugarElectrochemicalCOD84
Turbidity86
SugarAnaerobic granular sludgeCOD92–95
SugarElectrochemical peroxidationCOD65
COD64
TOC66
TOC63
SugarChemical oxidation + electro-oxidationCOD81
Turbidity83.5
SugarElectrochemical reactorCOD90
Turbidity93.5
SugarAlgal treatmentCOD37.91
BOD525.69
TDS48.51
Turbidity39.2
TeaMembrane treatmentTurbidity>99.9
COD>99.9
TOC>99.9
TeaPhoto-FentonCOD88–99.3
TeaUV photo-FentonTOC96
COD100
Polyphenol97
TeaAdsorption + AOPColor98
CoffeeUV photo-FentonTOC93
CoffeePhoto-Fenton + UASBBOD595
CoffeeChemical flocculation + AOPCOD87
CoffeeAdsorptionCOD99
BOD599
CoffeeMembrane treatmentCOD97
Conductivity99
CoffeeChemical coagulation +
electro-oxidation
TOC95
COD97
CoffeeFenton’s + coagulationTOC76.2
COD76.5
BOD566.3
Table 25. Characteristics of food processing liquid effluent.
ParametersTofu Processing EffluentSweet WheyAcid WheyPotato Processing EffluentSweet Beverage (Soda)
MedMeanSDNMedMeanSDNMedMeanSDNMedMeanSDNMedMeanSDN
Carbohydrates [g/L]6.68.37.1433.533.113.11043.741.56.0816.816.80.324.58.08.83
Proteins, g/L1.21.20.864.54.92117.97.61.782.43.32.54 0.2 1
Lipids, g/L 3.8 13.93.92.6105.55.62.57 0.2 1 0
pH55.20.454.24.40.99 4.7 15.85.50.759.89.80.86
Ash, %w/w1.71.70.430.71.00.670.50.50.170.20.2020.10.10.15
Total solids,% w/w1.7 26.76.30.966.46.60.560.81.01.04 0.1 2
COD, g/L19.922.613.3769.367.14.84 79.5 15.96.03.847.41.31.38
ParametersTomato PomaceApple PomaceGrape PomaceSpent Coffee GroundsBread Waste
MedMeanSDNMedMeanSDNMedMeanSDNMedMeanSDNMedMeanSDN
Carbohydrates, %w/w33.936.110.3942.84461029.228.15.0549.551.26.5654.658.914.46
Proteins, %w/w2116.49.1134.34.31.31110.59.92.5716.4174.6811.8112.18
Lipids, %w/w13.411.35.372.72.91.296.76.91.872422.25.781.81.80.44
pH 2.9 1 3.9 1 4.40.82 5.30.62
Ash, %w/w4.15.02.161.51.51.094.84.82.061.51.50.251.801.70.57
Total solids, % w/w14.517.87.1327.728.32.24 35.0 129.228.37.748980.713.47
COD, g/kg87.086.79.5314.314.46.13 14.4 1 160 1
Med: Median, SD: Standard deviation, N: number of reported values.
Table 26. Mineral content associated with liquid effluents.
Mineral
Content, mg/L
Tofu Processing EffluentSweet WheyAcid WheyPotato Processing EffluentSweet Beverage (Soda)
MedMeanSDNMedMeanSDNMedMeanSDNMedMeanSDNMedMeanSDN
Calcium34.6 134134084411001110854 100 13.71
Magnesium16.3224955223 230 1 91.2 13.11
Sodium127 1386366824 178522 40 121.61
Potassium861 1130012502403140013671533 35 14.31
Iron912 2 1 0 0.2 101
Manganese0 1 0 0.1 1 0.2 101
Phosphorous15124407005213540540198316926829531.31
Sulfur224011 0 058673033001
Zinc0.502 0.3 2 2.2 1 0.5 101
Table 27. Minerals in water-rich solid stream.
Mineral
Content, mg/kg
Tofu Processing EffluentSweet WheyAcid WheyPotato Processing EffluentSweet Beverage (Soda)
MedMeanSDNMedMeanSDNMedMeanSDNMedMeanSDNMedMeanSDN
Calcium57005297192276758083666440045701164377710206255135812525536
Magnesium 2310 238839017461500164368241900151582057007315194
Sodium 1820 2100855104554404209232673172824315034386444
Potassium 8740 2230030982649518802027711381007635306251600227015215
Iron 384 23030635041.3313851361314932302395
Manganese 366 2672410610634333346.74 1.7 1
Phosphorous475054661921885097343553400307711203153414423945189019454204
Sulfur 0 1100 1 890 1160020008725
Zinc 54 1131164 9800 112123 20.582
Table 28. Impact of wastewater discharged to the environment.
Impacts onExamples of Impacts
Health
  • Increased burden of disease due to reduced drinking water quality
  • Increased burden of disease due to reduced bathing water quality
  • Increased burden of disease due to unsafe food (contaminated fish, vegetables and other produce irrigated)
  • Increased risk of disease when working or playing in wastewater-irrigated area
Environment
  • Decreased biodiversity
  • Degraded aquatic ecosystems (e.g., eutrophication and dead zones)
  • Foul odors
  • Diminished recreational opportunities
  • Increased greenhouse gas emissions
  • Increased water temperature
  • Bioaccumulation of toxins
Economy
  • Reduced industrial productivity
  • Reduced agricultural productivity
  • Reduced market value of harvested crops, it unsafe wastewater is being used tor irrigation
  • Reduced opportunities tor water-based recreational activities (reduced number of tourists, or reduced willingness to pay for recreational services)
  • Reduced fish and shellfish catches, or reduced market value of fish and shellfish
  • Increased financial burden on healthcare
  • Increased barriers to international trade (exports)
  • Higher costs of water treatment (for human supply and other uses)
  • Reduced prices of properties near contaminated water bodies
Disclaimer/Publisher’s Note: The statements, opinions and data contained in all publications are solely those of the individual author(s) and contributor(s) and not of MDPI and/or the editor(s). MDPI and/or the editor(s) disclaim responsibility for any injury to people or property resulting from any ideas, methods, instructions or products referred to in the content.

