1. Introduction
To date, climate change has been one of the most crucial and urgent global issues, driven by the increased usage of fossil fuels, which underpin approximately 90% of all carbon dioxide and 75% of all global greenhouse gas emissions, according to the United Nations (UN) [
1]. The production of energy, manufacturing of goods, the clearing of forests, transportation, the production of food, and the lighting of buildings are cited as the primary causes of emissions and climate change. Making decisions which influence these supply chains involves deciding which contractors or vendors (counterparts) to use and how much of each commodity to purchase. Therefore, it is important to carefully consider counterpart selection attributes and the definition of environmental goals, for which a variety of quantitative and qualitative factors need to be considered in an effective counterpart selection process [
2]. As global warming attracts more attention, each company has a responsibility to set solid goals and standards that are aligned with the Sustainable Development Goals (SDGs) promoted by the UN. This situation is highly relevant to the oil and gas (O&G) industry, which is one of the heaviest carbon-emitting industries. An example of how this issue is coming to the fore emerged when the second-largest shareholder of ExxonMobil, Black Rock Inc., voted against the re-election of two directors in favor of an independent chairperson in 2020 [
3]. It can be thus observed that the environmental point of view is becoming more of a priority in many cases, and a clear commitment to environmentally friendly management for companies is an expectation of stakeholders.
Technical innovation has also been prioritized within companies, which have evolved ecological mindsets through their corporate governance. These types of managerial decisions tend to be favored by stakeholders, influencing aspects such as corporate value. In view of this, each company seeks to identify environmentally friendly business partners with whom to form joint ventures (JVs) and to secure vendors and sub-vendors to procure equipment [
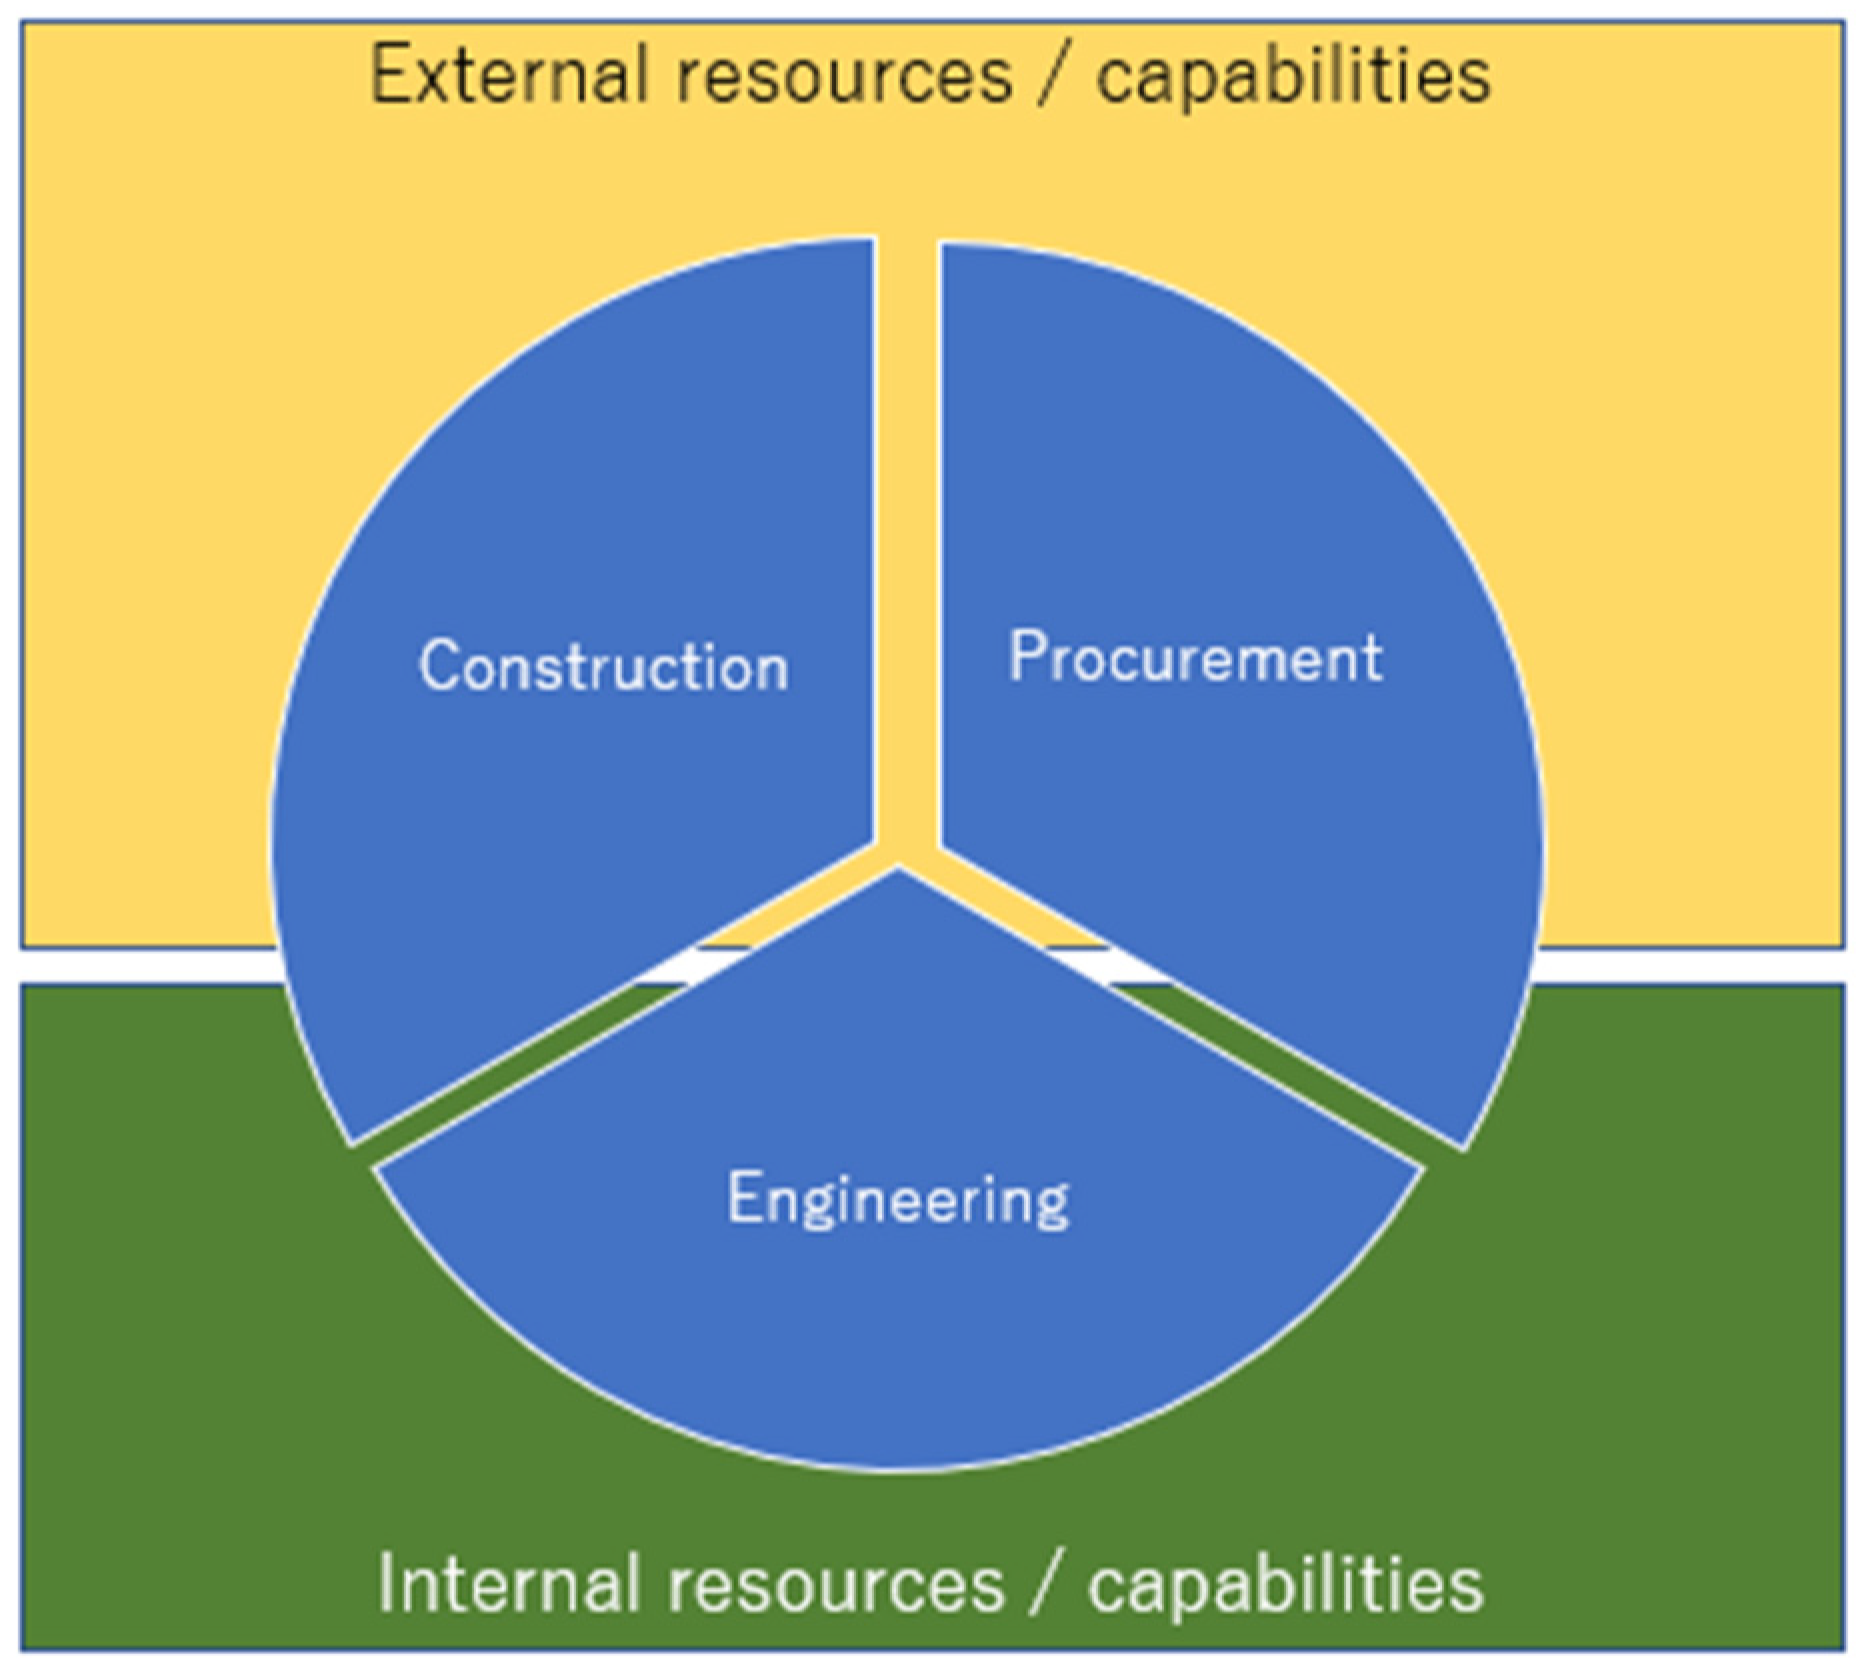
4]. Business partners are evaluated and selected using both quantitative and qualitative factors. In the O&G business sector, in response to these developments, environmentally friendly management policies, including engineering, procurement, and construction (EPC) contractors, who build specific plants from the grassroots level, are predominantly in charge of engineering, procurement, and construction, as the abbreviation suggests, and tend to form JV alliances to separate working fields so as to minimize the risk on the execution of each project. This tendency is stronger as scales and project risks increase [
5]. Due to the nature of EPC contractors, procurement is often heavily affected by external factors. Yusuf et al. identified that, given that purchased goods and services make up 50 to 70 percent of the potential value of manufacturing companies, a company’s competitive edge is primarily determined by the relationships it develops with outside organizations rather than its own internal skills [
6], as detailed in
Figure 1.
In particular, the O&G industry is heavily affected, as might be expected, by energy policy matters due to their outputs, which account for large amounts of carbon dioxide, described in the discussion. According to Hill [
7], value creation within one company derives from differentiation and low cost, according to the roots of competitive advantage, also suggested by [
8], whereby a company can leverage these qualities to achieve above-average performance, as detailed in
Figure 2.
It has also been clarified that 50 to 70% of the potential value or capabilities of a manufacturing company derive from purchased goods, engineering skills, and services, while the portions allocated to procurement and construction rely heavily on sub-contractors and vendors’ resources and capabilities [
6]. It was also revealed that the O&G business is characterized by high complexity, transportation challenges, a long supply chain, as well as inflexibility characterized by high infrastructure needs, reduced vertical integration, and significant market competitiveness [
9]. High operating costs, price volatility, a labor shortage, and environmental concerns are additional difficulties that the O&G sector must contend with.
This paper seeks to clarify the ways in which companies evaluate their business partners (e.g., JV counterparts, vendors, sub-vendors, etc.) from an environmental point of view, incorporating both quantitative and qualitative factors, focusing on the O&G industry, which is struggling to make a paradigm shift toward a decarbonized business scheme. The major focus of this study will be vendors who manufacture the major components of electrified equipment, such as electric motors, generators, transmission boards, transformers, uninterrupted power systems, DC chargers, etc., and supply them to EPC contractors. The reason that electric (ELE) vendors are selected is that they play a significant and important role in the O&G plant operation in terms of decarbonization. It was reported that one of the major pillars of global energy system decarbonization is electrification, and this is also true within this industry [
10]. For example, an LNG plant usually operates numerous rotating machines such as compressors and, as an example, in one case, a refinery replaced three steam turbines for driving centrifugal gas compressors with super-high-speed inverter drive motors, with the replacement resulting in the energy-saving effects shown in
Table 1.
The rest of this paper is organized as follows.
Section 2 provides a thorough literature review on green supply chain management, incorporating factors, such as carbon cap and trade, carbon offsets, renewable energy, regulations, finance, and counterpart selection, utilizing a systematic review approach, relevant to the O&G industry. Identified gaps and important lessons for future research are detailed in
Section 3, with conclusions given in
Section 4.
2. Literature Review and Methodology
Green Supply Chain Management (GSCM) considers the incorporation of environmental issues in the management of the supply chain [
8]. As was identified in [
4], greening the supply chain is a way of integrating internal processes and involving external partners to increase the GSCM engaging company’s ability to (1) handle risk, (2) address external environmental regulations, (3) improve innovation and competitiveness, and (4) contribute to a circular economy. This paper focuses on counterpart selection and contrasts this approach with an additional five approaches to environmental improvement for the O&G industry, including carbon cap and trade and carbon offsets, renewable energy deployment, regulations, and financial approaches. The scope of our systematic literature review is detailed in
Figure 3.
Carbon emissions have a strong relationship with cost and company pricing policies because of the cost impacts of introducing less-emission-intensive technologies and equipment. According to a life cycle assessment of electricity sources [
12], most of the carbon emissions from the O&G industry result from coal extraction and natural gas production, whereas those for renewable energy result from electric equipment, such as generators, blades, silicon and cell production, and storage systems, as well as construction-related emissions from foundations and towers. Achieving net zero emissions benefits society if the cost of offsetting is low enough in comparison to the societal cost of pollution caused by corporate carbon footprints [
13]. Existing and untrained consumption and production patterns are the main factors that contribute to the continuous deterioration of the world ecosystem [
14]. Supposing that the cost of compensation is sufficiently low and carbon emissions are offset, both business and the climate may benefit [
13]. Likewise, competitive scenarios that realize a net zero emission society can create a win–win–win outcome for organizations (e.g., corporate), the climate, and society, as long as the offset outcome is effective enough [
13]. Furthermore, as national and local spending to reduce emissions affects the costs and benefits on a company’s balance sheet, investors are accounting for future returns from that spending in their valuations [
15]. It has also been revealed that increasing the price of carbon decreases total prices, total emissions, and total inventories, with the breadth of the emission reduction being greater at cyclical service levels and a higher coefficient of variation in demand [
16]. There have been several theoretical and empirical studies on the relationship between energy use, carbon emissions, and economic growth in both developed and developing nations [
17].
An alternative approach to revealing the nature of these relationships was also studied; for example, Pao investigated an Emissions–Energy–Output framework over the period from 1991 to 2016 to estimate the Kuznets Curve of carbon and the elasticity of clean energy and fossil energy consumption toward carbon emission demand, causal linkages between emissions, energy, and the economy, so as to propose options for decoupling environmental pressures from economic development [
18].
There is extensive literature in several research fields that incorporates environmental concerns, so, here, we investigate the abovementioned four environmental impact reduction options of carbon cap and trade and carbon offsets, renewable energy, regulations and financial options, as well as an overview of the O&G industry and counterpart selection as an environmental impact reduction option. The selected literature is evaluated from the viewpoint of whether GSCM metrics are considered, as well as their future feasibility. The specific factors investigated under the context of GSCM are detailed in
Figure 4.
Systematic literature review (SLR) is a method used to identify articles and documents that are relevant to our analysis topics and research agenda. Scopus and Google Scholar databases were used to identify appropriate literature, following the methodology detailed in
Figure 5, utilizing the keywords shown in
Table 2. To identify specific literature, text clustering was utilized to scan abstracts and select articles in order to review only those which are highly relevant to our area of interest [
20].
2.1. Carbon Cap and Trade and Carbon Offsets
Carbon pricing, carbon trading, and carbon offsetting are all widespread and effective carbon reduction measures employed in many nations [
22]. Carbon emission trading (CET) has emerged as one of the most important strategies utilized by many nations and regions to meet their emission reduction objectives. The carbon offset mechanisms are a collection of guidelines that regulate the issuance of Certified Emission Reductions (CERs), and carbon offsets are the number of CERs acquired on the market by business transactions to offset their actual emissions [
23]. Wang and Wang sorted carbon offsetting mechanisms under various carbon emission trading (CET) systems [
23]. Based on the most current information,
Table 3 provides an overview of regions and offset caps, where O&G industries are prevalent. This system enables all parties to achieve independent reductions by increasing their investment in energy conservation and cleaner production to keep their emissions within limits. Another option is the purchase of surplus emission quotas from other enterprises. Thirdly, they can purchase CERs from certain types of projects via carbon offsetting mechanisms. Through a quantitative study using Nash’s equilibrium, Wang and Wang found that there is a negative correlation between a company’s carbon intensity and the output of product markets in equilibrium, leading to the implication of a threshold for the relative size of the carbon intensity of duopolies.
Precedential studies focusing on carbon cap and trade were analyzed cognizant of the inventory lot-sizing problem [
16], where it was identified that sustainable product-inventory models may pose issues of cooperation as well as competition [
22], a multi-item production planning problem [
25], etc., regarding corporate internal analyses. Cap-and-trade programs achieve various levels of pollution reduction efficiency considering both pricing and emission reduction policies, pure competition models, and co-petition (cooperation and competition) models, where the optimal price for companies depends on the unit price of carbon emissions trading [
26]. One study presented an advanced futures purchasing heuristic for firms requiring allowances through auctions, which lessens the brunt of acquiring allowances on the financial performance of a corporation [
27]. Hence, companies design their products with carbon footprint and price in climate-sensitive markets in mind. Also, several studies have found that growing climate concerns reduce the carbon footprint of products, business, profits, and demand but do not have a clear impact on price [
13]. Watari studied the effect of the impact of carbon offsets to assess the effects of large-scale energy transitions on resource flows, including both direct and hidden flows such as mining waste [
28]. Babonneau conducted research on taxes and came to the conclusion that the price at which emission allowances must be traded on the market, or the tax that the regulator should levy, is extremely high and likely unrealistic because, as a system approaches zero emissions, its incremental cost for reducing CO
2 emissions rises significantly. Thereby, investing in CCS technology is beneficial, even at the highest estimated cost [
29].
Table 4 details the LCA impacts from 1 kWh of electricity generated in Europe in 2020 for both the O&G sector and for renewable energy, which clarifies the significant role of CCS in reducing emissions.
It is widely acknowledged that carbon capture is a crucial method for reducing emissions, specifically those from thermal power plants. The high initial and ongoing capital and operational costs of current capturing methods are the primary issue. Consequently, analyzing a carbon-capturing system based on ammonia in order to produce ammonium bicarbonate as an economically viable alternative when renewable energy is used as the power source was undertaken in a previous study [
30]. With the intention of including carbon emissions in production inventory and routing decisions, Qiu investigated a model for a pollution production-routing problem under carbon cap-and-trade regimes [
31]. A threshold for the relative magnitude was found to exist between firms’ carbon intensity and their product market equilibrium output [
23]. To the author’s best knowledge, there are no studies of carbon cap-and-trade approaches that focus on a company’s evaluation perspectives, even though GSCM metrics were considered extensively in the literature.
2.2. Renewable Energy
There are several types of renewable energy that can reduce carbon dioxide in the energy generation sector, including solar, wind, geothermal, hydropower, ocean, and bioenergy [
32]. As such, it is important to carefully analyze the feasibility of the introduction of renewable energy sources. According to the International Renewable Energy Agency (IRENA), renewable energies are already being heavily adopted in developed countries [
33]. Zoundi came to the conclusion that renewable energy, which reduces CO
2 emissions and has a greater long-term impact, remains an effective alternative to conventional energy generation based on fossil fuels [
34]. Technically, under the macro perspective, renewable energy systems are not only possible but are also already financially workable and getting cheaper every year [
35]. In addition, some scholars studied the feasibility of 100% renewable energy-sourced power operation, with Esteban et al. evaluating the possibility to do so in Japan and finding it feasible utilizing a smart grid system, a substantial amount of battery storage, and a large increase in solar power levels [
36]. According to the Ministry of Economy, Trade and Industry (METI), Japan, the contribution of RE toward total energy generation in Japan was approximately 18% as of 2019 [
37]. On the other hand, Zappa et al. explored the feasibility of 100% renewable energy options in Europe, concluding that it is necessary to expand generation capacity and to enable cross-border transmissions in order to achieve 100% generation levels [
38]. However, due to the outbreak of the Russian invasion of Ukraine in February 2022, Mišík identified that, despite efforts to reduce greenhouse gas emissions, use renewable energy sources, and improve energy efficiency, EU member states have continued to import fossil fuels from abroad.
Although the energy transition is far from complete, renewable energy sources continue to contribute to domestic energy production, although there are currently no viable alternatives to fossil fuels in all cases or nations [
39]. Dong looked into China’s Environmental Kuznets Curves (EKCs) for CO
2 emissions and found that the EKC turning point will occur around 2028. This means that China will not change its current policies to go green in the short term. However empirical results also show that nuclear and renewable energies play a key role in reducing short-term and long-term CO
2 emissions, while fossil fuel consumption is the largest cause of CO
2 emissions. In addition, the study found that renewable energy will continue to make a major contribution to reductions in CO
2 emissions in the future because nuclear energy has a much smaller mitigation impact on CO
2 emissions than renewable energy [
40].
From the micro perspective, the impacts of renewable energy need to be verified on a per capita basis and, according to the findings of Chen and Pata’s investigation into the relationship that exists between non-renewable energy, renewable energy, GDP, and CO
2 emissions per capita, renewable energy consumption is a significant means of reducing CO
2 emissions over time [
41,
42]. Morvaj et al. investigated urbanization, focusing on the relationship between financial development, carbon dioxide emissions, and per capita GDP. They believe that energy systems in cities, which account for 80% of global carbon emissions [
43], will likely serve as a starting point for reducing greenhouse gas emissions. According to Pata, the greatest increases in CO
2 emissions were caused by economic expansion, followed by urbanization and financial development [
41]. Here, our review also clarifies that there are currently no studies of renewable energy that focus on company evaluation perspectives or GSCM metrics.
2.3. Regulations
As detailed in
Section 2.1,
Table 3 shows the carbon cap-and-trade mechanisms and the basis of associated laws and regulations worldwide. Aside from CET mechanisms, the (STIRPART) model of stochastic impacts by regression on population, wealth, regulation, and technology is also of interest in our analysis. STIRPART is advocated by [
42], in which they challenged the traditional STIRPAT model by adding the perspective and analysis of regulations. The Stochastic Impacts by Regression on Population, Affluence and Technology model (STIRPAT) was created by Rosa and Dietz [
43], predicting the environmental impact based on the key driving forces and also estimating the causal impact between these driving forces [
44]. Hashmi [
42] developed the concept of observing how regulations affect CO
2 emissions, as shown in
Figure 6.
Hashmi verified that regulatory effects are slightly more impactful to carbon emission reductions than environmental technology effects. The difficult task of striking a balance between the public (ensuring a safe and dependable energy supply at the lowest possible cost) and private (achieving a reasonable investment return) objectives presents a challenge to energy company regulation [
45]. Recent events, such as an increase in the cost of energy and fears of a natural gas supply shortage in the winter of 2021–2022 have shown that the European Union’s current energy security measures are limited [
39]. Environmental regulations and legal instruments were found to be extremely relevant explanatory factors in some studies, accounting for more variance than any of the tested company-level variables, with the exception of size [
46]. Zhao et al. investigated the specific effects of environmental regulation in China and empirically tested the Porter hypotheses effect for China’s carbon-intensive industries. The findings led the researchers to the conclusion that the EKC in China relevant to domestic industries may be occurring in the same way as that for other nations [
47]. Mulatu reviewed studies relevant to environmental regulation and international competitiveness to identify two broad notions (neoclassical economics and competitiveness) of competitiveness and elaborated on the fundamental tenets underlying each notion [
48]. Their critical review came to the conclusion that a test of the Porter hypothesis that is fully valid should emphasize the impact that well-designed environmental policies have on “high-value sectors” of the economy. They also raised concerns about international competitiveness, which may lead governments to use environmental policies as the world economy becomes more integrated through a series of trade agreements.
2.4. Financial Theory
The financial system may be understood as a complex aggregate of transactions and institutions, each having its own internal dynamics and a relationship to the economy through projects, assets, and policy tools, as they affect the economic health of each company [
49]. Misani found that companies that implement environmental procedures have a moderate impact on this relationship, as better stakeholder management improves the financial performance, which is strongest if the carbon performance of the company is neither low nor high but intermediate. Despite this contradictory evidence, which indicates that companies often do not absorb the costs of low-carbon performance, companies that achieve positive environmental results and have exceptional procedures also enjoy a net financial gain [
50]. Another method involving the study of carbon emission performance (CEP) and corporate financial performance (CFP) also revealed the connection between environmental and financial performance. While Ferrat argued that corporations would not be able to cover costs, others have argued that improved environmental performance should lead to greater profitability and competitive advantage. The findings suggested that CEP had a negative impact on short-term CFP and businesses with a high level of materiality would ultimately achieve higher CFP [
51]. In terms of cash flow, both a retailer-led Stackelberg (RS) structure and a manufacturer-led Stackelberg (MS) structure were used in Tang and Yang’s research on operational decisions within the supply chain. The effects of bank loans and early payments in low-carbon supply chains involving a retailer with a lot of capital and a manufacturer with little capital were examined. In a retailer-led power structure, it was discovered that early payments could result in fewer emissions of carbon dioxide and greater social welfare. However, in a manufacturer-led structure, the environment and social welfare were harmed due to a conflict between profitability and environmental goals [
52]. Further, Charfeddine discovered that CO
2 emissions and economic growth, particularly in Middle Eastern and North African nations, are only partially explained by the consumption of renewable energy sources and financial development. Additionally, they examined the connection between the growth of the economy, the use of renewable energy, and CO
2 emissions. They discovered that financial development had no significant negative effects on environmental degradation. Second, they discovered that economic expansion was also slightly aided by the use of renewable energy. Finally, they discovered that the level of capital deteriorates environmental quality [
53]. Ding et al. raised research concerns regarding two prevalent macro perspectives of environmental finance: environmental, social, and governance (ESG) issues as well as planetary boundaries. They discovered that, beyond performance benefits, little research has examined how companies and industries are affected by planetary boundary issues, and that the ESG literature is just beginning to take into account the extremely diverse nature of ESG investment [
54]. Some scholars pointed out that the majority of the research on environmental issues was conducted through individual case studies that looked at specific areas, rather than at the global level, and focused on investigating empirical linkages among environmental degradation, considering the economy and financial issues [
55].
Previous scholarship tended to focus on both positive and negative effects from a financial perspective; however, to the author’s best knowledge, few studies have focused on GSCM metrics, and none have considered the evaluation perspectives of companies.
2.5. Oil and Gas (O&G) Industry
For the O&G industry, the focus of this study, most endeavors are on the scale of mega projects, involving survey, exploration, development, production, gas processing (platform), LNG liquefaction, etc., for upstream transportation, either through a pipeline or tanker for the midstream, and petrochemical processing and retail in the downstream, as shown in
Figure 7.
The O&G industry, a carbon-intensive industry, has been studied intensively recently, with the main aim of decreasing carbon emissions [
47]. Varna clarified the distinguishing characteristics of the O&G industry including the complexity and tangled-up nature of the industry, including issues, such as industry processes, inflammability, contamination, bulk volumes, high transportation costs, and long supply chains [
56]. A noteworthy study was completed focusing on the UK North Sea O&G industry and its supply chain agility, especially on the upstream, categorizing the dimensions of agility in four levels [
6]. A company and supply chain’s ability to respond and adapt to a business environment marked by constant and dynamic change is referred to as agility [
57]. Yusuf mainly evaluated the end-user’s point of view, and, therefore, additional research is required for EPC and vendors viewpoints, as these key actor’s resources are essential for commercial activity. Yusuf also utilized empirical interviews in a case study of Ghana’s natural gas supply chain and discovered that businesses use both financial and non-financial performance measures to scale performance [
9]. Florescu et al. studied the impact of supply chain management activities, such as planning, execution, coordination, and collaboration, on sustainable supply chain management strategies, such as supplier selection, product stewardship, and logistics management, in the oil and gas distribution business [
58]. Sustainable supply chain management strategies were summarized as follows: supply chain management (SCM) functions in the four dimensions of planning, execution, coordination, and collaboration, which were then systematically examined with a focus on Romanian businesses. These functions included a strategy for selecting suppliers, a strategy for stewarding products, and logistics management. According to the study, O&G distributors can use certifications, codes of conduct, and standards to evaluate the social or environmental impact of their suppliers.
Table 5 details the major standards used by oil companies. These codes allow for the identification of compliant players and, at the same time, maintain a barrier to those who are unable to comply, excluding additional entrants to the industry.
Menhat also explored empirical and interview-based studies to show how multiple external factors affect the O&G industry, outlining how to maximize the potential for activities in the supply chain to improve overall company performance, as well as the impacts of the availability of crude oil, fluctuations in the price of oil, high transportation costs, and exposure to a number of uncertainties [
59]. On the execution and operation side, Lee and Chong discovered that while parties without a past working connection are more likely to employ contractual control, parties with a prior working relationship are more likely to use contingency adaptability to boost project performance. This discussion occurred because EPC contractors tend to avoid risk during the execution and counterpart selection processes, etc., as mega-project execution often lasts from years to a decade, meaning that unavoidable additional expenditure may be encountered during the execution [
5]. A study was undertaken using the Multi-Criteria Decision-Making (MCDM) model utilizing Supply Chain Operations Reference metrics (SCOR metrics), the Analytic Hierarchy Process (AHP) model, and the Technique for Order of Preference by Similarity to Ideal Solution (TOPSIS) approach for supplier evaluation and selection in the oil and gas (O&G) sector. It was found that the supply chain has challenges with achieving sustainable production levels, cost reduction, and on-time delivery. One of the best ways to address these problems was found to be choosing and assessing raw material providers; hence, a novel hybrid MCDM model was developed for supplier selection in the oil and gas sector [
60].
Based on this literature review, we were unable to identify any focused study on the downstream aspects of O&G supply chain management and the selection methods for GSCM metrics from company’s evaluation perspectives. In fact, most studies in this space focused on the upstream aspects of GSCM metrics and supply chains of finished products and raw materials such as crude oil, etc.
2.6. Counterpart Selection Relevant to ELE Vendors
Finally, partner selection such as ELE vendors in the O&G business, as detailed above, is critical for all aspects of plant systems, a major resource for contractors, and, therefore, important to include in this literature review. During the discussion of carbon offsets, sub-vendor selection is also identified as one of the key issues [
61]. In this context, some studies showed that ‘environmental costs’, ‘product quality’, ‘product price’, ‘occupational health and safety systems’, and ‘environmental competencies’ have been ranked as the top five sustainable supplier selection criteria for sub-vendor selection [
62]. As innovation capital has a significant impact on company value, it was found to be an essential component in establishing a competitive advantage in research and development [
63]. Nevertheless, after envisaging the characteristics of the company and the risk factors, innovative intensity was not found to be significant for predicting future returns [
64]. Since the environment surrounding the supply chain is now more dynamic and erratic than it was in the past, it must be extremely adaptable to quickly adjust to changes in the environment [
61]. Abdollahi researched a method for selecting suppliers in order to increase market competition based on organizational and product characteristics and adapt to potential changes in demand, supply, and other factors. The same characteristics identified in this study as ‘Lean and Agile’ criteria apply to both organizations and products [
61]. Benjaafar demonstrated that, in some cases, operation adjustments alone can lead to significant reductions in emissions without increasing costs by integrating carbon emissions issues into operation procurement, production, and inventory management decisions using relatively simple models. The findings also demonstrated that it is impossible to assess the full impact of various regulatory policies without taking into account any operational adjustments that financial institutions might make in response to regulations [
65]. Fontoura et al. investigated the efficacy of green supply chain integration (GSCI), supply chain leadership (SCL), and supply chain followership (SCF) in the context of green new product development (GNPD). SCL, SCF, and GSCI all have a positive effect on GRI, and GNPD has a positive effect on performance, according to their three hypotheses. They also mentioned that green innovation and orientation may depend on supplier participation, especially when considering the contributions of knowledge management to green innovation and those of industry partners, which link internal capabilities to external sources of innovation [
4]. Using the MCDM model, a survey was conducted in a subsequent study for efficient supplier selection [
60]. In the initial stage, businesses defined research objectives and criteria for supplier selection and evaluation using SCOR metrics because they must comprehend the criteria for evaluating suppliers. In the second stage, the weight of each factor was determined using an AHP model, and in the final stage, the TOPSIS model was used to present the best supplier [
60]. After surveying the impact of carbon regulation mechanisms on the decision-making process of replenishment in the supply chain of biofuels, Palak found that transportation accounts for almost 19% of global energy consumption and 25% of carbon dioxide emissions associated with energy. The effects of various carbon regulation mechanisms on the supply chain of biofuels’ transport and inventory replenishment decisions are expected to continue to increase, so it is expected that freight transportation will continue to grow [
66].
Based on our literature review, it was found that the O&G industry has not been evaluated sufficiently from the viewpoints of the lower supply chain (including ELE vendors), contractor selection (e.g., EPC contractors, JV counterpart, licensors, system integrator, vendors, sub-vendors, etc.), and GSCM metrics.
3. Discussion
This research uncovered the importance of the capabilities of counterparts in the O&G field and that of counterpart selection and also suggested the importance of Green Supply Chain Management procedures in this field, which can contribute significantly toward sustainability, even in traditional oil and gas industries. A lot has been written about the carbon footprint of supply chains in academic papers and other public sources. Non-profits, industry associations, and government agencies have also addressed this issue. However, only recently has the operations and supply chain management research community begun to pay attention to this area, and even fewer have paid attention to green vendor and contractor selection, especially in the O&G market. One of the major global sources, with immediate warming effects, is methane emissions from the supply networks for coal, gas, and oil. The fossil fuel industry has the greatest potential to reduce methane emissions; around one-third of all technological mitigation measures are financially viable, with the oil and gas industry accounting for the biggest share [
67].
Figure 8 illustrates the impact of GHG emissions from the oil and gas sectors, identifying that 13% of GHG emissions overall come from this field. According to [
68], 15% of global energy-related emissions come from oil and gas activities, and there is pressure on the sector to contribute more toward sustainable energy transitions.
A broad body of literature has detailed the specific features of the O&G industry, including its conservativeness, rigid requirements on codes of standard, a specific and unique group of vendors approved by each end-user, numerous points of view, equipment types used, and specific equipment required for each process. Further, in addition to the requirements of sub-vendors, there is also a specific need in this industry that most electrical products need to be designed and deployed on a case-by-case basis. It is, therefore, difficult to evaluate and detail the permutations of vendor selection utilizing GSCM metrics, due to industry-specific factors, such as multistage lot-sizing models [
69], multilocation newsvendor models [
70], the economic order volume model, the multi-period probabilistic inventory model, and the supply chain coordination and contract model, all of which employ different metrics [
65].
In addition to the literature review, an extraction of the motivation and identified gaps found by this study, the current array of qualitative and quantitative analysis, GSCM metrics used, and key conclusions are summarized in
Supplementary Materials. Comparing the key academic literature across the six evaluated study area groups, it was found that a carbon cap-and-trade approach has a broad framework under CET and has a close correlation with financial viewpoints. Many scholars have developed advanced numeric analysis methods; however, few have undertaken qualitative analysis, perhaps due to the maturity of statistical analysis approaches in this field. Numerous studies also focused on GSCM metrics; however, due to the nature of these metrics, a large number of studies in this field tended to prioritize financial aspects, such as potential profits to be extracted from engaging a carbon trade market, accounting for costs, etc. In this context, the market for GHG emissions is much more mature and ready to accept commercial-level decarbonization.
Table 6 indicates the overall evaluation of the employment of variables within qualitative, quantitative, and GSCM metric analyses.
Considering renewable energy, several conditions need to be met in order to achieve a 100% renewable energy system. Under the current Paris Agreements, this will not be achieved, unless voluntarily pursued. Therefore, a complementary method to decrease carbon emissions is likely to be required, e.g., carbon capture and storage (CCS), energy storage technologies, such as Liquid Air Energy Storage (LAES), methanation technologies, etc. Significant discussion has been undertaken weighing up economic stability issues alongside environmental concerns. In addition, technical developments and enabling technologies will likely be required, as clarified by [
71]. Energy storage technologies should be divided into five categories: mechanical (e.g., LAES, CAES), electrical (e.g., capacitor, etc.), electrochemical (e.g., batteries), chemical (e.g., hydrogen), and thermal storage. It was concluded that some of these technologies are mature; however, most of them are underdeveloped. Smart grid electric power systems offer a cost-efficient solution for improving the coordination of energy sources, aiming to create a more efficient way to balance supply and demand and ensure the reliable delivery of sustainable, economically viable, and secure electricity. It is necessary to deploy such technologies and realize their application in the real world, such that the smart grid is easily operated. The concept of the EKC was heavily studied, most often in case studies across a broad range of literature, though only at the national level. Less work was undertaken at the micro level, and it was identified that GSCM metrics in this field need to be further investigated and clarified.
With regard to regulations, many scholars scrutinized how regulations or green policies affect carbon abatement. This issue is particularly relevant today in light of the Russian invasion of Ukraine, limiting supplies of Russian gas, particularly to sanctioning nations in Europe.
As for the O&G industry, perhaps due to its conservative and reclusive nature, a broad range of review literature was not available. Some scholars completed qualitative analysis based on research surveys and questionnaires, etc., and conducted quantitative analysis based on these results. One surprising issue was the dearth of literature relating to ELE vendors in the O&G industry, even though they are among the main drivers of this industry. As can be seen in
Section 2.6, the majority of discussion focuses on bulk materials rather than critical electric components, so future studies may choose to analyze how greening of the environment can be achieved through the deployment of emerging technologies by counterpart such as ELE vendors, etc., in the O&G industry. As observed by many scholars, the O&G industry is extremely complex in its production processes and supply chain, so it is very important to take a holistic and comprehensive view of the industry quantitatively and to consider future trends also in terms of technical points of view to identify how much ELE vendors can contribute toward decarbonization. Some limitations of the study include the availability of detailed studies and data on O&G businesses, due to their conservative and reclusive nature. Also, this research considered the ELE vendors as a priority, excluding other aspects including licensed process products, or JV counterparts of EPC, system integrators, or rotating machinery OEM manufacturers, etc. To increase the possibility of drawing conclusions from the literature review and proving distinct causalities, the linkages between these topics need to be investigated utilizing real-world case studies and longitudinal studies, which employ quantitative methods.
A key finding of this review is that for studies regarding the presence and influence of ELE vendors, a major component of the technology and drivers of O&G industries are insufficient both in number and detail. These vendors will likely be responsible for the implementation of new concepts, such as environment-friendly technologies. Finally, it was identified that the incorporation of GSCM metrics was insufficient vis a vis regulations and counterpart selection in the O&G industry, although these metrics appear to be a positive approach for evaluating the industry. This study’s findings may be able to provide insights into other axes of counterpart selection to evaluate their capabilities toward contributions toward sustainability, not only the from a commercial and technical point of view but also to inform industry professionals and policymakers alike.
4. Conclusions and Future Work
This paper investigated whether green strategies (i.e., GSCM, etc.) can be a key axis of contractor or counterpart selection evaluation through a review of precedential studies across six themes, including carbon cap and trade, renewable energy, regulations, finance, the O&G industry, and counterpart selection theory, and clarified which aspects have been thoroughly evaluated to date. After a thorough review of the available literature, it was found that although each group utilizes specific methodologies, GSCM metrics are generally understudied. This is particularly true for the O&G industry, and studies that consider the electric vendor’s role and technical contributions are lacking.
The majority of the extant literature attempted to balance environmental and financial issues. This trend should be applied to the O&G field, particularly due to its carbon-intensive nature and the ever-present need to decrease CO2 emissions in line with international goals. Finally, it is apparent that further technical development and investment will be required to enable a more environmentally friendly industry and positive flow on effects to the economy. Therefore, future research would do well to investigate the combined effect of clean energy procurement, the carbon and clean energy balance, and the deployment of CCS, for example. Further, in light of the identified geopolitical risks, it will be essential to identify which emerging technologies are most likely to contribute to the achievement of carbon-neutral goals while securing a stable supply of energy.


