Article

Removal of Magnesium in Zinc Hydrometallurgical System via Freezing Crystallization: From Laboratory Experiments to Industrial Application

1
Faculty of Metallurgical and Energy Engineering, Kunming University of Science and Technology, No. 68, Wenchang Road, 121 Street, Kunming 650093, China
2
Chengtun Mining Co., Ltd., Xiamen 600711, China
3
Sichuan Sihuan Zn & Germanium Technology Co., Ltd., Ya’an 625400, China
*
Author to whom correspondence should be addressed.
Sustainability 2023, 15(23), 16275; https://doi.org/10.3390/su152316275
Submission received: 10 October 2023 / Revised: 9 November 2023 / Accepted: 17 November 2023 / Published: 24 November 2023

Abstract

:
Magnesium (Mg) is not only a typical impurity but also an important valuable metal in the zinc (Zn) hydrometallurgical process. This study proposed the use of freezing crystallization to recover Mg and reduce the Mg2+ concentration in waste electrolyte solutions, meeting the requirements of Zn hydrometallurgy. The experimental results indicated that the Mg2+ concentration decreased from 23.60 g/L to 14.28 g/L under optimal conditions at a temperature of 263.15 K, holding time of 90.00–120.00 min, H2SO4 concentration of 143.00 g/L, crystal seed addition of 50.00 g/L, and agitation speed of 300.00 rpm. The crystallization mother liquor was returned to the Zn hydrometallurgical process. The crystallization product was a mixture of MgSO4·7H2O and ZnSO4·7H2O with an aspect of 17. Notably, this method resulted in no discharge of waste gas, waste liquid, or waste residue. Additionally, during the industrial application process, the average removal efficiency of Mg2+ was 40.15%. The concentration of Mg2+ in waste electrolyte was reduced from 25.00–27.00 g/L to 13.00–15.00 g/L. These results indicated that the method effectively controlled the concentration of Mg2+ in the waste electrolyte and facilitated the recovery of Mg resources from Zn hydrometallurgy.

1. Introduction

The enrichment of magnesium (Mg2+) has a significant influence on the zinc (Zn) hydrometallurgical process due to the increased viscosity of the solution. The Zn hydrometallurgical process primarily consists of the leaching–purification–Zn electrolysis stages. Specifically, in the Zn electrolysis process, the presence of Mg2+ results in “plate-burning” and promotes the hydrogen evolution reaction [1,2]. The issue of Mg is a common and unsolved problem in the Zn hydrometallurgical process. Therefore, it is of great significance to study the removal and recovery of Mg [3].
Currently, Zn concentrate pre-treatment involves various methods. Dilute sulfuric acid leaching, Mg fluoride precipitation [4,5,6], the lime neutralization process [2,7], and solvent extraction [8,9,10] are the main approaches used to remove Mg from the Zn hydrometallurgical system. In the Zn concentrate dilute sulfuric acid leaching process, MgO and MgCO3 are dissolved along with ZnO and ZnCO3, resulting in the loss of Zn. Furthermore, during the fluoride salts precipitation process, the fluoride ions act as ligands, which react with Mg to form MgF2 with low solubility, precipitating the removal of Mg. However, this process affects the Zn electrolysis and poses risks to equipment and operators during industrial operations [11]. The lime neutralization method relies on the difference in hydrolysis pH between Zn and Mg, regulating the pH to 10–11 by adding Ca(OH)2 solution. This process consumes a significant amount of lime, and the by-product, gypsum residue, requires further treatment. Solvent extraction is an effective method for separating special metals from polymetallic solutions. Nevertheless, the organic phase partially remains in the aqueous phase during the extraction process, and reagent costs may limit its application [12,13,14]. Presently, considering economic and environmental concerns, the loss of Zn, the introduction of fluoride ions, the enrichment of residual organic phases, the deterioration in the working environment caused by ammonia, and the reagent costs are vital problems during the Mg removal process. The freezing crystallization method, which employs no additional reagents, emerges as a promising trend in the purification processes of Mg solutions for Zn hydrometallurgical plants. Jiang et al. utilized a two-stage heat exchange precooling technology to separate and recover zinc magnesium sulfate complex salt from sulfate solution. The filtered crystallization mother liquor was returned to the precooler as the precooling medium, achieving the crystallization separation of magnesium in sulfate solution with low energy consumption [15].
The key to Mg removal via freezing crystallization lies in the difference in the solubilities of Zn2+ and Mg2+ at various temperatures, and this process involves no impurity ions. Additionally, this method offers the following advantages [16,17,18]: (1) it is cost-effective because waste electrolyte serves as the raw material for the preparation of MgSO4 product, and the crystallized solution is returned to the Zn hydrometallurgical system, significantly reducing the raw material cost and wastewater emissions; (2) it is efficient as it eliminates the need for reagents and reduces operational steps, achieving the removal of Mg2+ in a single step; and (3) the method features low energy consumption and a rapid process without the addition of ammonium compounds (NH3·H2O, (NH4)2CO3, NH4·Cl, etc.), thereby preventing harm from ammonium volatilization to both human health and the environment. Ultimately, it leads to a decrease in Mg2+ concentration in the Zn hydrometallurgical system and the recycling of waste electrolytes.
In the freezing crystallization process, MgSO4·12H2O forms in the crystallizer, and spontaneous recrystallization into Mg sulfate heptahydrate (MgSO4·7H2O) occurs during subsequent filtration and drying above 273.55 K. The MgSO4·7H2O crystals exhibit a needle-like morphology [19]. In the sulfuric acid leaching of high-magnesium borate minerals, more than 90.00% of Mg2+ can be removed in the form of the MgSO4⋅H2O crystalline phase from sulfuric leachate via the cooling crystallization method [20]. Nevertheless, the scale-up test and industrial application of these reported findings have not been conducted.
To determine the optimal experimental conditions for freezing crystallization, investigations were conducted on the effects of temperature, holding time, H2SO4 concentration, and the quantity of added crystal seeds on the Mg removal efficiency. Verification experiments were conducted at different temperatures. Moreover, the industrial application of freezing crystallization was realized. The chemical compositions, mineral morphological characteristics, and phase identification of the crystallization products were thoroughly characterized. This approach ultimately achieved the removal of Mg2+ from waste electrolytes and the recovery of Mg resources from Zn hydrometallurgy.

2. Methodology

2.1. Materials

The waste electrolyte was provided by Sichuan Sihuan Zn & Germanium Technology Co., Ltd. (Sichuan, China), and the primary chemical components are listed in Table 1. As shown in Table 1, the waste electrolyte mainly contained Zn, Mg, Mn, Pb, and SiO2. The concentration of Mg2+ was 23.60 g/L, which exceeded the allowable value of 15.00 g/L for Mg2+ concentration in some Zn hydrometallurgical plants during the Zn electrowinning process. Thus, it is imperative to remove Mg from the waste electrolyte.

2.2. Characterization

The concentration of Zn2+ and Mg2+ in the crystallization solution system, as well as the Zn and Mg content in the crystallization product, were determined using the ethylenediaminetetraacetic acid (EDTA) titration method. In the industrial application process, %Mg and %Zn contents were measured via ICP (inductively coupled plasma optical emission spectroscopy, ICP-OES, Prodigy, Leeman, Hudson, NH, USA), and the average removal efficiency was assessed. The crystalline structures of the equilibrium solid, obtained from the solid–liquid equilibrium study process, and the crystal products, were characterized via X-ray diffraction (XRD) (Empyrean, PANalytical, Almelo, The Netherlands) in the 2θ range of 20–80° at a scanning rate of 8°/min operated at a 40 kV accelerating voltage and a 40 mA current with a Cu Kα radiation source. The morphology and elemental compositions of the crystallization products were characterized via Scanning Electron Microscopy (SEM)/Energy-Disperse X-ray Spectroscopy (EDS) (TESCAN MIRA LMS, Brno, Czech Republic), with an accelerating voltage range of 200 eV–30 keV. The samples were prepared through dispersion in ethanol: a drop of the dispersion was placed on a carbon-coated copper grid and allowed to dry before analysis.

2.3. Feasibility Analysis

The principle of freezing crystallization for Mg2+ removal in waste electrolytes was based on the trend of MgSO4 equilibrium solubility decreasing with a certain temperature range. This approach achieved the removal of Mg in the Zn hydrometallurgical system. In our previous work, the solubility of MgSO4 in the quaternary system MgSO4-ZnSO4-H2SO4-H2O at different temperatures was measured, as shown in Figure 1 during preliminary research [21]. The results indicated that the solubility of MgSO4 decreased with decreasing temperature <343.15 K. According to Figure 1, when the temperature was < 323.15 K, both ZnSO4·7H2O and MgSO4·7H2O appeared in the equilibrium solid phase of the quaternary system MgSO4-ZnSO4-H2SO4-H2O. Consequently, the crystallization products consisted of Zn and Mg co-crystallization products in the process of freezing crystallization of waste electrolytes, thereby achieving the removal of Mg2+.

2.4. Experiment Procedures

The removal of Mg from waste electrolytes through the freezing crystallization method includes the following steps: (1) A 200.00 mL waste electrolyte in a beaker was measured and placed in a low-temperature reactor. The magnetic stirring device was activated, and the solution was gradually cooled to the specified experimental temperature. (2) After the reaction was completed, the stirring device was deactivated, allowing for heat preservation and sedimentation. After the crystals were completely settled, the supernatant was extracted using a Millipore filter for the analysis of metal ion concentration. (3) The crystal slurry using a centrifugal filter was separated to obtain a crystallization product and the solution was devoid of Mg2+. (4) The solid product was washed with ethanol and subsequently placed in an oven for 24 h at 25 °C for drying. The solid products were analyzed via XRD, SEM/EDS, and chemical element composition. Additionally, the crystallization mother solution was returned to the Zn hydrometallurgical system, and the crystallization products were subjected to dissolution and neutralizing precipitation to separate Zn and Mg. This process was important in the utilization of Mg resources.

3. Results and Discussion

3.1. Optimization of Freezing Crystallization Experimental Conditions

To determine the optimal experimental parameters for the efficient removal of Mg2+ from waste electrolytic solution through the freezing crystallization method, the effects of temperature, holding time, H2SO4 concentration, and the amount of crystal seed added on the removal efficiency of Mg2+ were investigated. The results are shown in Figure 2. Moreover, the crystallization products were characterized via chemical composition, XRD, and SEM-EDS.

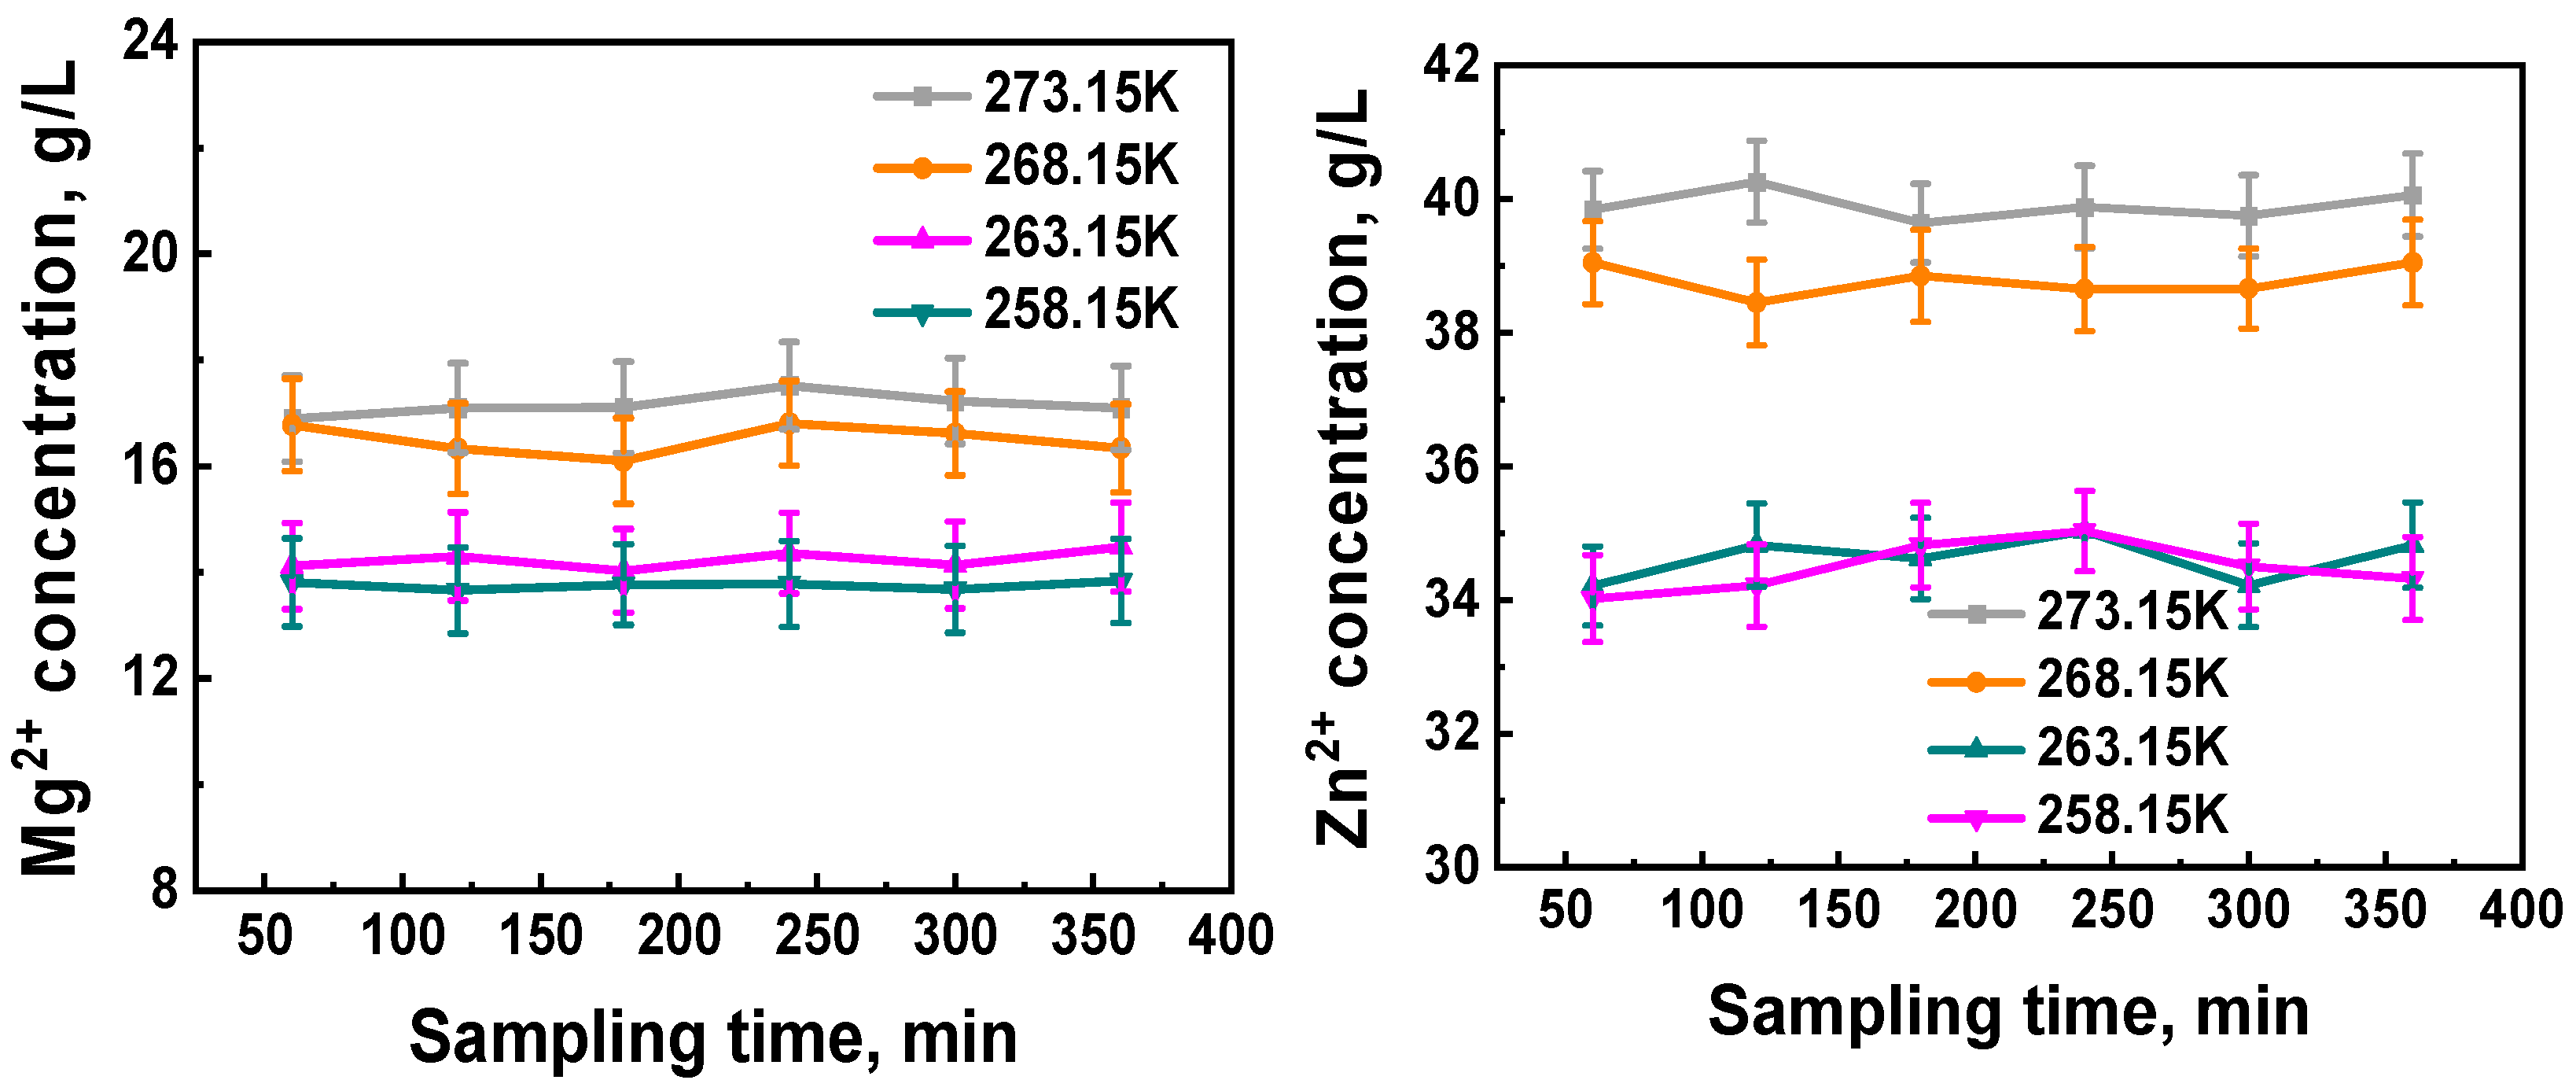
3.1.1. Effect of Temperature on the Mg Removal Efficiency

The crystal temperature is a crucial parameter in the freezing crystallization process for waste electrolytes. Different crystallization temperatures lead to variations in the solubility of MgSO4 and the equilibrium solid phase. Under specific conditions of initial H2SO4 concentration of 163.70 g/L, holding time of 120.00 min, and agitation speed of 300.00 rpm, the effect of crystal temperature on the removal efficiency of Mg was investigated. Then, the crystal slurry was subsequently subject to solid–liquid separation via the centrifugal filtration method. The concentration of Zn2+ and Mg2+ in the crystallized solution was determined through EDTA titration.
As shown in Figure 2A, the concentration of Mg2+ decreased from 23.60 g/L to 8.50 g/L as the temperature decreased from 298.15 K to 243.15 K. The crystallization of Zn and Mg was influenced by decreasing the crystal temperature. However, the freezing point of the system used in this study was 242.15 K. At a temperature of 243.15 K, the system became cloudy due to the co-crystallization of ice, Mg2+, and Zn2+. This system was unfavorable for Mg2+ removal. The concentration of Mg2+ in the post-crystallization solution at 263.15 K was 13.58 g/L, which was <15.00 g/L threshold required for the Zn electrowinning process for Mg2+ concentration.
The crystallization products obtained through the freezing crystallization of waste electrolytes at different temperatures were dried at room temperature for 24.00 h. SEM images of the crystal products are shown in Figure 3. These images revealed that the crystallization products were all short rod-shaped crystals, with variations in their length and thickness. Specifically, Figure 3A shows the morphology of the freezing crystallization products obtained at 278.15 K. In detail, the aspect ratio of crystallization product was measured by the ratio scale in SEM images. Results show that the aspect ratios of crystallization obtained from 278.15 K, 273.15 K, and 263.15 K were 2.4, 12, and 14, respectively. Thus, the aspect ratio of the crystallization product obtained at 263.15 K was larger than those obtained at 278.15 K and 273.15 K.

3.1.2. Effect of Time on the Mg Removal Efficiency

The holding time of the crystal is another significant factor in the freezing crystal process. Under conditions with an initial H2SO4 concentration of 163.70 g/L, agitation speed of 300.00 rpm, and crystal temperatures of 268.15 K, 263.15 K, and 258.15 K, the effect of holding time on the Mg2+ remove efficiency was investigated. The concentration of Mg2+ was measured, and the results are shown in Figure 2B. Figure 2B displays that the residual Mg2+ concentration was 15.50–16.50 g/L at 268.15 K, 14.00–15.00 g/L at 263.15 K, and 13.00–14.00 g/L at 258.15 K. It was observed that the concentration of Mg2+ in the crystallization mother liquor fluctuated within a range of 1.00 g/L as the reaction time extended at various temperatures. Thus, considering the comprehensive energy consumption, the optimal holding time for crystallization ranged from 90 min to 120 min.

3.1.3. Effect of H2SO4 Concentration on the Mg Removal Efficiency

Under the conditions of a crystal temperature of 263.15 K and an agitation speed of 300.00 rpm, the effect of initial H2SO4 concentration on the removal efficiency of Mg2+ was investigated. The initial H2SO4 concentration of waste electrolyte was regulated by adding CaO, resulting in the initial H2SO4 concentrations of 183.00 g/L, 203.00 g/L, and 223.00 g/L, respectively. The residual Mg ion concentration in the crystallized solution is shown in Figure 2C. The residual Mg2+ concentration in the crystallized solution gradually decreased with an increased initial H2SO4 concentration of the waste electrolyte (Figure 2C).
For instance, when the initial H2SO4 concentration was 163.70 g/L, the reaction was conducted at 263.15 K for 120.00 min, and the Mg2+ concentration in the crystallized solution was 13.95 g/L. Thus, increasing the H2SO4 concentration to 223.00 g/L reduced the Mg2+ concentration in the crystallized solution to 10.21 g/L. The increase in H2SO4 concentration reduced the solubility of MgSO4 due to the common-ion effect of sulfate anion (SO42−) [22]. This effect positively influenced the Mg2+ removal via crystallization. Waste electrolytes of different Zn hydrometallurgical plants, which typically exhibited H2SO4 concentrations of 160.00–200.00 g/L in the production practice, exhibited excellent adaptability and higher Mg2+ removal efficiency. This indicated that the freezing crystallization Mg removal technology has universal applicability and effectiveness for waste electrolytes produced using different Zn hydrometallurgical plants.
The crystalline products obtained through the freezing crystallization of waste electrolytes at different initial H2SO4 concentrations were characterized via SEM analysis. The results are shown in Figure 4. It was observed that the low-temperature frozen crystallization products produced from waste electrolytes under different H2SO4 concentrations all exhibited rod-shaped crystals. At the same magnification, the crystals with an H2SO4 concentration of 143.00 g/L exhibited a significant difference in diameter compared the crystals with H2SO4 concentrations of 163.70. g/L and 223.00 g/L, and the crystal thickness was uneven. Moreover, the aspect ratios of crystallization product were 5, 14, and 7.14 at initial H2SO4 concentration of 143.00 g/L, 163.70 g/L, and 223.00 g/L, respectively. The results indicated that the optimal H2SO4 concentration during the freezing process is 163.7 g/L.

3.1.4. Effect of Adding Amount of Crystal Seed on the Mg Removal Efficiency

Crystal seed preparation: The crystal seed was prepared at a crystal temperature of 263.15 K, agitation speed of 300.00 rpm, and holding time of 120.00 min. The seed contained 52.78% MgSO4·7H2O and 45.92% ZnSO4·7H2O.
The crystal seed played a crucial role in the industrial crystal process. The effect of the amount of crystal seeds added on the Mg2+ removal efficiency was investigated (Figure 2D). As shown in Figure 2D, the amount of crystal seeds added exhibited little effect on the residual Mg2+ concentration in the crystallized solution, and the average concentration of Mg2+ was 13.00–14.00 g/L, regardless of whether the added amount of crystal seed was 10.00 g/L, 25.00 g/L, 50.00 g/L, 75.00 g/L, or 100.00 g/L. Moreover, seed addition induced the crystallization of MgSO4·7H2O and ZnSO4·7H2O, which was beneficial for Mg2+ removal.
Figure 5 depicts the SEM images of the crystalline products obtained from different experiments conducted with varying amounts of crystal seed. In Figure 5, the morphology of the freezing crystalline product was consistently rod shaped, indicating that the freezing crystalline products of the waste electrolyte exhibited minimal variation under different seed addition conditions. In Figure 5B, the aspect ratio of the crystallization product is about 17. To obtain MgSO4 with a well-defended crystal form and a higher aspect ratio, an additional amount of 50.00 g/L crystal seeds was selected.

3.1.5. Effect of Agitation Intensity on the Mg Removal Efficiency

Under the conditions of crystalline temperature of 263.15 K, holding time of 90.00–120.00 min, H2SO4 concentration of 143.00 g/L, and adding amount of crystal seed of 50.00 g/L, the effects of agitation speed (100.00 rpm, 200.00 rpm, 300.00 rpm, 400.00 rpm, 500.00 rpm) on the removal efficiency of Mg and crystalline product morphology were investigated; the results are shown in Figure 2E. As shown in Figure 2E, the average residual concentration of Mg2+ in the crystallized solution is 12.00–14.00 g/L at different agitation speeds; these results verify that the agitation intensity has little effect on the removal of Mg2+.
Figure 6 shows the SEM images of crystal products obtained from different stirring speeds. In Figure 6, the morphology of crystal products is cylindrical. However, there are some differences in the diameter of the crystal at different stirring speeds. The reasons for this could be the following: (1) increasing the stirring speed can promote the migration of solute molecules to the crystal surface, which is beneficial for crystal nucleation and growth; (2) increasing the agitation intensity can increase the fluid shear stress, breaking the crystals, resulting in the crystal diameter becoming shorter at higher agitation intensity [23].

3.2. Verification Experiments

To verify the experimental parameters for freezing crystallization of Mg2+ removal from waste electrolytes and the stability of the Mg2+ removal effect, repeated validation experiments (parallel experiments) were conducted under the optimized experimental conditions. These conditions included crystal temperatures of 273.15 K, 268.15 K, 263.15 K, and 258.15 K; a holding time of 90.00–120.00 min; an initial H2SO4 concentration of 143 g/L; a crystal seed amount added of 50.00 g/L; and an agitation speed of 300.00 rpm. The verification experiments were conducted under these conditions, and the residual Mg2+ concentration at different crystal temperatures is listed in Table 2 and shown in Figure 7.
As shown in Table 2 and Figure 7, the residual Mg2+ concentrations were in the ranges of 17.00–18.00 g/L, 16.00–17.00 g/L, 14.00–15.00 g/L, and 13.00–14.00 g/L at 273.15 K, 268.15 K, 263.15 K, and 258.15 K, respectively, in the verification experiments. The Zn2+ concentrations were within the ranges of 39.00–40.00 g/L, 38.00–39.00 g/L, and 34.00–35.00 g/L, respectively. The Zn concentration remained relatively consistent at 263.15 K and 258.15 K. The average content of Mg in the crystallization product ranged from 5.4% to 6.0%, while the average content of Zn ranged from 11.60% to 12.00%. The concentration of Mg2+ and Zn2+ in the crystallized solution and the average content of crystallization products remained relatively stable under various temperature conditions. This indicated that lower freezing crystallization temperatures resulted in excellent Mg2+ removal efficiency.
The XRD pattern and SEM/EDS images of the crystalline product obtained from the verification experiment are shown in Figure 8. Figure 8A,B show the XRD pattern and SEM/EDS analysis of the crystalline products, respectively. Figure 8A depicts that the primary phases of the crystalline products are MgSO4·7H2O and ZnSO4·7H2O. Figure 8B shows that the micro-structures of the freezing crystallization products were rod shaped with a dense structure. The EDS pattern confirmed that Mg and Zn elements were evenly distributed within the crystal, indicating that the crystallization product was a double salt composed of MgSO4 and ZnSO4, containing crystal water.
The chemical composition of the crystalline product is detailed in Table 3. Combining the data from Figure 8 and Table 3, the analysis indicated that the primary phases of the crystalline products were MgSO4·7H2O and ZnSO4·7H2O, consisting of between 53.37% and 43.79% of the composition, respectively. The results corresponded with the single-factor experiment.
This indicated that the experimental parameters obtained via freezing crystallization of Mg2+ from waste electrolytes in the Zn hydrometallurgical process, as determined through optimization experiments, exhibited excellent stability. The findings suggest promising potential for the industrial application of Mg2+ removal through freezing crystallization of waste electrolytes in the Zn hydrometallurgical process.

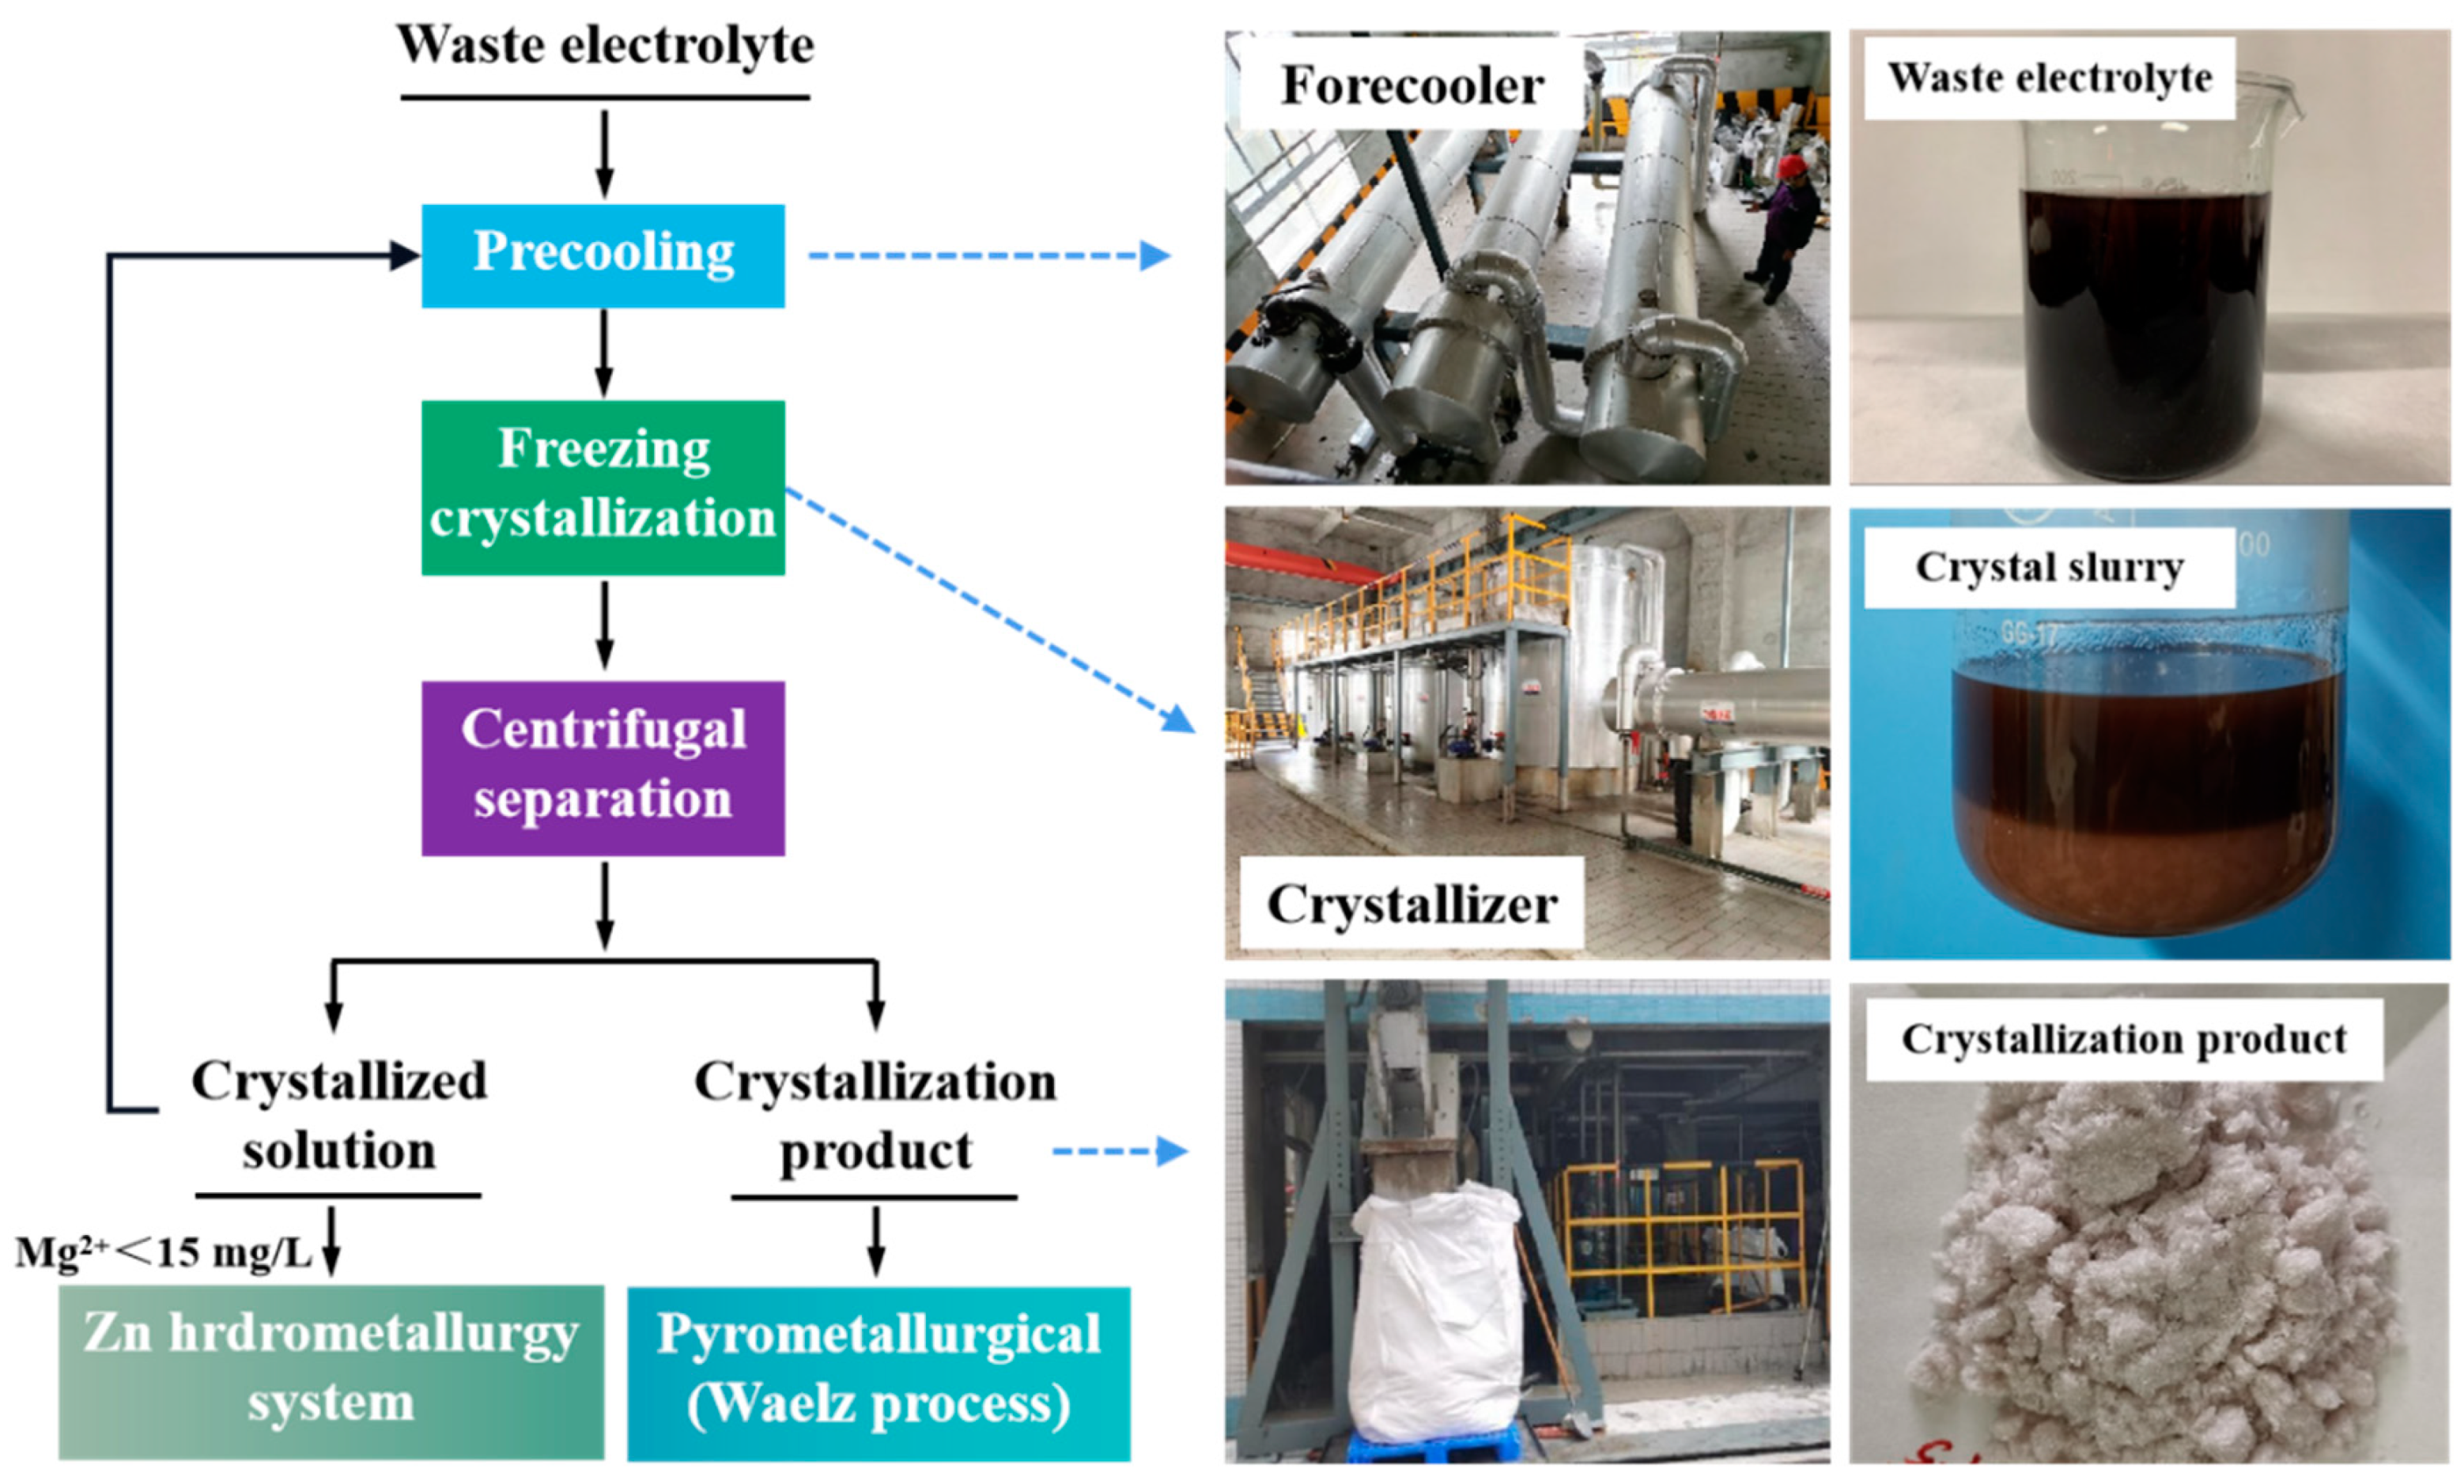
3.3. Industrial Application

The development of the technology for removing Mg via freezing crystallization involved a series of exploratory experiments, verification experiments, and scale-up tests. The industrial application of the freezing crystallization method was conducted at Sichuan Sihuan Zn & Germanium Technology Co., Ltd. (Sichuan, China). The diagram of the freezing crystallization process and the primary device are shown in Figure 9.
Construction of the production workshop began on 18 March 2021. It was completed at the end of July 2021. It commenced commissioning and trial operation on 1 August 2021. At this time, it was successfully commissioned and operated. In the industrial application process, the waste electrolyte initially passes through a fore cooler to reduce its temperature. The temperature of the waste electrolyte was reduced from 311.15–313.15 K to 293.15–298.15 K through precooling. The waste electrolyte was transferred to the crystallizer, and the temperature control of the crystallizer was 263.15 K ± 0.50 K. Centrifugation was employed to achieve liquid–solid separation of the crystal slurry, and the obtained crystallized liquid was returned to the precooler.
Additionally, it was observed that a highly energy efficient and environmentally friendly treatment method for freezing crystallization products involved a wet method, such as hydrothermal synthesis of magnesium sulfate whiskers [24]. However, for enterprises implementing this research project, the fire treatment method was more convenient. The existing rotary kiln device of the enterprise was used to directly recover Mg2+, and the emission SO2 was collected effectively and utilized to prepare H2SO4, while reducing the investment cost of the device.
Consequently, the solid recovery was accomplished through pyrometallurgical processes using the Waelz method for Zn recycling and Mg recovery. During the industrial application process, the crystallized solution with an Mg2+ concentration of <15.00 g/L was returned to the Zn hydrometallurgical system. The main indexes during the industrial application process are listed in Table 4.
As shown in Table 4, the initial concentrations of Mg2+ varied, owing to changes in the material content during the industrial application process. For example, the Mg and Zn content changed in the Zn concentrates. Additionally, the Mg removal device operated for a total of 114.00 days, processing 10,990.00 m3 of waste electrolyte and producing 77.77 t of Mg metal (measured via factory data). Furthermore, the average concentration of Mg2+ in the waste electrolyte was reduced from 25.00–27.00 g/L to 13.00–15.00 g/L, and the average content of Mg in the crystallization product was 8.00%–10.00%.
However, the freezing crystallization device was intermittently operated in the Zn hydrometallurgical process. When the Mg removal device operated for some time, the Mg concentration in the wet Zn smelting system was reduced to 15.00 g/L. The Mg removal device ceased operation until the Mg concentration in the system was re-enriched to ≥ 25.00 g/L. The Mg removal device was reactivated at this point. This cyclic operation enabled the open circuit and recovery of Mg in the Zn hydrometallurgical system.

4. Conclusions

In summary, the results of this study demonstrated the feasibility of removing Mg2+ and producing MgSO4·7H2O and ZnSO4·7H2O from the Zn hydrometallurgical process via freezing crystallization. First, the solubility of MgSO4 in the quaternary system MgSO4-ZnSO4-H2SO4-H2O at different temperatures was measured, and the thermodynamic analysis results indicated that the Mg2+ in the waste electrolyte was effectively removed via freezing crystallization. Second, the effects of initial H2SO4 concentration, crystal temperature, holding time, the amount of added crystal seed, and agitation speed on the removal efficiency of Mg2+ were explored. Additionally, the verification experiments under optimized conditions were conducted. The experimental results indicated that the Mg2+ concentration decreased from 23.60 g/L to 14.28 g/L under the optimal conditions at a crystal temperature of 263.15 K, holding time of 90.00–120.00 min, initial H2SO4 concentration of 143.00 g/L, crystal seed addition of 0.05 g/mL, and agitation speed of 300.00 rpm. The residual Mg2+ concentration in the post-crystallization waste electrolyte met the requirements of Zn hydrometallurgy. XRD and SEM/EDS analysis results indicated that the crystalline product was a co-crystallization of MgSO4·7H2O and ZnSO4·7H2O, with a regular columnar microstructure and aspect ratio of 17. Furthermore, the industrial application of the freezing crystallization method was conducted and operated for 114.00 days. In this study, 10,990.00 m3 of waste electrolyte was processed, resulting in the production of 77.77 t of Mg metal. Notably, the average concentration of Mg2+ in the waste electrolyte decreased from 25.00–27.00 g/L to 13.00–15.00 g/L, and the average Mg content in the crystallization product ranged from 8.00% to 10.00%.
This study achieved effective control of Mg2+ concentration and the recovery of Mg resources from Zn hydrometallurgical was realized, with minimal emissions of waste gases and waste residues during the freezing crystallization process.

Author Contributions

Investigation, X.J. and Y.Z.; Resources, C.W., Z.D. and M.L.; Visualization, M.D.; Supervision, X.L. (Xingbin Li) and X.L. (Xingguo Luo). All authors have read and agreed to the published version of the manuscript.

Funding

This project was financially supported by the National Natural Science Foundation of China (Grant No. 52164039), Yunnan Provincial Science and Technology Plan Project (Grants Nos. 202101AT070091, 202001AT070079), Yunnan Major Scientific and Technological Projects (Grant Nos. 202302AG050008, 202302AB080012).

Institutional Review Board Statement

Not applicable.

Informed Consent Statement

Not applicable.

Data Availability Statement

No new data were created or analyzed in this study. Data sharing is not applicable to this article.

Conflicts of Interest

The authors declare that the research was conducted in the absence of any commercial or financial relationships that could be construed as a potential conflict of interest.

References

  1. Booster, J.; Van Sandwijk, A.; Reuter, M. Mg removal in the electrolytic Zn industry. Miner. Eng. 2000, 13, 517–526. [Google Scholar] [CrossRef]
  2. Matthew, I.; Newman, O.; Palmer, D. Water balance and magnesium control in electrolytic zinc plants using the E.Z. selective zinc precipitation process. Metall. Trans. B 1980, 11, 73–82. [Google Scholar] [CrossRef]
  3. Johnson, A.; Matthew, I.G.; Hall, P.G. The development and application of the selective zinc precipitation process for controlling impurities in electrolytic zinc plant circuits. In Papers Presented at the Tasmania Conference 1977; The Australasian Institute of Mining and Metallurgy: Carlton, Australia, 1977; pp. 299–307. [Google Scholar]
  4. Eksteen, J.; Pelser, M.; Onyango, M.; Lorenzen, L.; Aldrich, C.; Georgalli, G. Effects of residence time and mixing regimes on the precipitation characteristics of CaF2 and MgF2 from high ionic strength sulphate solutions. Hydrometallurgical 2008, 91, 104–112. [Google Scholar] [CrossRef]
  5. Shibata, N.; Sato, H.; Sakaki, S.; Sugita, Y. Theoretical study of Mg fluoride in aqueous solution. J. Phys. Chem. B 2011, 115, 10553–10559. [Google Scholar] [CrossRef]
  6. Georgalli, G.; Eksteen, J.; Pelser, M.; Lorenzen, L.; Onyango, M.S.; Aldrich, C. Fluoride based control of Ca and Mg concentrations in high ionic strength base metal sulphate solutions in hydrometallurgical circuits. Miner. Eng. 2008, 21, 200–212. [Google Scholar] [CrossRef]
  7. Sharma, K. An approach to reduce magnesium from zinc electrolyte with recovery of zinc from disposed residue of an effluent treatment plant. Hydrometallurgical 1990, 24, 407–415. [Google Scholar] [CrossRef]
  8. Tsakiridis, P.; Agatzini, S. Simultaneous solvent extraction of cobalt and nickel in the presence of manganese and Mg from sulfate solutions by Cyanex 301. Hydrometallurgical 2004, 72, 269–278. [Google Scholar] [CrossRef]
  9. Ji, L.; Zhang, L.; Shi, D. Mechanism and process for the extraction of lithium from the high Mg brine with N,N-bis(2-ethylhexyl)-2-methoxyacetamide in kerosene and FeCl3. J. Ind. Eng. Chem. 2022, 113, 254–263. [Google Scholar] [CrossRef]
  10. Guimarães, A.; Mansur, M. Selection of a synergistic solvent extraction system to remove calcium and magnesium from concentrated nickel sulfate solutions. Hydrometallurgical 2018, 175, 250–256. [Google Scholar] [CrossRef]
  11. Speight, J. Lange’s Handbook of Chemistry, 16th ed.; McGraw-Hill, Inc.: New York, NY, USA, 2005. [Google Scholar]
  12. Cheng, C. Purification of synthetic laterite leach solution by solvent extraction using D2EHPA. Hydrometallurgical 2000, 56, 369–386. [Google Scholar] [CrossRef]
  13. Pakarinen, J.; Paatero, E. Effect of temperature on Mn-Ca selectivity with organophosphorus acid extractants. Hydrometallurgical 2011, 106, 159–164. [Google Scholar] [CrossRef]
  14. Haghighi, H.; Moradkhani, D.; Salarirad, M.M. Separation of zinc from manganese, magnesium, calcium and cadmium using batch countercurrent extraction simulation followed by scrubbing and stripping. Hydrometallurgical 2015, 154, 9–16. [Google Scholar] [CrossRef]
  15. Jiang, G.; Jin, X.; Li, X.; Zhen, Y.; Wei, C.; Deng, Z.; Li, M. New process for removing magnesium from waste electrolytes of zinc hydrometallurgical using freezing crystallization. J. Cent. South Univ. (Sci. Technol. Min. Metall.) 2021, 52, 4219–4226. [Google Scholar]
  16. Lin, Q.; Gu, G.; Wang, H.; Wang, C.; Liu, Y.; Zhu, R.; Fu, J. Separation of manganese from calcium and magnesium in sulfate solutions via carbonate precipitation. Trans. Nonferrous Met. Soc. China 2016, 26, 1118–1125. [Google Scholar] [CrossRef]
  17. Pagnanelli, F.; Garavini, M.; Veglio, F.; Toro, L. Preliminary screening of purification processes of liquor leach solutions obtained from reductive leaching of low grade manganese ores. Hydrometallurgical 2004, 71, 319–327. [Google Scholar] [CrossRef]
  18. Farrah, h.; Lawrancel, G.; Wanless, E. Solubility of calcium sulfate salts in acidic manganese sulfate solutions from 30 to 105 °C. Hydrometallurgical 2007, 86, 13–21. [Google Scholar] [CrossRef]
  19. Himawan, C.; Kramer, H.; Witkamp, G. Study on the recovery of purified MgSO4·7H2O crystals from industrial solution by eutectic freezing. Sep. Purif. Technol. 2006, 50, 240–248. [Google Scholar] [CrossRef]
  20. Liu, Y.; Shi, P.; Mei, X.; Jiang, M. Separation of boron and magnesium by stepwise crystallization of sulfuric acid leachate of high-magnesium borate minerals. Hydrometallurgical 2021, 204, 105703. [Google Scholar] [CrossRef]
  21. Jin, X.; Li, X.; Zhen, Y.; Luo, X.; Wei, C.; Deng, Z.; Li, M. Determination of the solubility of MgSO4 in the Zinc hydrometallurgical system within the temperature range of 263.15 K–293.15 K. Can. Metall. Q. 2023, 1–9. [Google Scholar] [CrossRef]
  22. Sirbu, F.; Iulian, O.; Ion, A.; Ion, I. Activity Coefficients of Electrolytes in the NaCl + Na2SO4 + H2O Ternary System from Potential Difference Measurements at (298.15, 303.15, and 308.15) K. J. Chem. Eng. Data 2011, 56, 4935–4943. [Google Scholar] [CrossRef]
  23. Turner, D. Molecular Self-Assembly, Nucleation Kinetics And Cluster Formation Associated With Solution Crystallization. Ph.D. Thesis, University of Leeds, Leeds, UK, 2015. [Google Scholar]
  24. Tang, Z.; Zhu, C.; Fan, F.; Qing, B.; Shao, F.; Lei, F.; Deng, X. Green synthesis of the excellent magnesium oxysulfate whiskers under controlled reaction conditions. Mater. Chem. Phys. 2017, 195, 143–148. [Google Scholar] [CrossRef]
Figure 1. The solubility curve of MgSO4 in the MgSO4-ZnSO4-H2SO4-H2O system at different temperatures and H2SO4 concentrations.
Sustainability 15 16275 g001
Figure 2. Effect of different experimental conditions on the Mg2+ concentration in the crystallized solution: (A) temperature, (B) time, (C) H2SO4 concentration, (D) added amount of crystal seed, and (E) stirring speed.
Sustainability 15 16275 g002
Figure 3. SEM images of crystal products obtained at different temperatures: (A) 278.15 K, (B) 273.15 K, and (C) 263.15 K.
Sustainability 15 16275 g003
Figure 4. SEM image of crystal products obtained from different H2SO4 concentrations: (A) 143.00 g/L, (B) 163.70 g/L, and (C) 223.00 g/L.
Sustainability 15 16275 g004
Figure 5. SEM images of crystalline products obtained with different amounts of crystal seeds: (A) 10.00 g/L, (B) 50.00 g/L, and (C) 100.00 g/L.
Sustainability 15 16275 g005
Figure 6. SEM images of the crystal products were obtained from different stirring speeds. (A) 100.00 rpm, (B) 300.00 rpm, and (C) 500.00 rpm.
Sustainability 15 16275 g006
Figure 7. The relationship between concentrations of Mg2+, Zn2+, and crystallization time.
Sustainability 15 16275 g007
Figure 8. (A) XRD pattern and (B) SEM/EDS images of crystal products obtained from the verification experiments.
Sustainability 15 16275 g008
Figure 9. Diagram of the freezing crystallization and primary device used in the industrial application process.
Sustainability 15 16275 g009
Table 1. The contents of the main chemical components in the waste electrolysis/(g/L).
ZnMgH2SO4MnPbSiO2
52.5023.60163.704.500.0020.082
Table 2. Zn and Mg average concentration and content in the crystallization mother solution and crystal product during the variation experiment.
ComponentsPre-CrystallizationCrystallized Solution
273.15 K268.15 K263.15 K258.15 K
Mg2+ concentration/(g/L)23.6017.1616.5014.2413.76
Zn2+ concentration/(g/L)52.5039.9138.7934.6234.49
Mg content/%-5.965.655.565.42
Zn content/%-11.6711.9111.6611.73
Table 3. The primary chemical composition of crystal products was obtained from the verification experiments (%).
PhaseMgSO4∙7H2OZnSO4∙7H2OMnSO4PbSiO2
Content/%53.3743.790.970.18 × 10−30.62 × 10⁻³
Table 4. The main indexes of freezing crystallization during the industrial application process.
DateMg2+ Concentration in Waste Electrolyte (g/L)Mg2+ Concentration in Crystalized Solution (g/L)Wet Weight of Crystal Product (t)Mg Content in Crystal Product (%)Yield of Metal Mg (t)Total Waste Electrolyte Volume (m3)Periods
(Days)
August 202127.2013.64155.065.989.01660.0022.00
September 202125.4014.01363.089.7021.751975.0023.00
October 202126.4313.23350.708.7019.683000.0028.00
November 202126.3714.22257.528.8013.962833.0021.00
December 202127.0614.21210.629.2013.372522.0020.00
Disclaimer/Publisher’s Note: The statements, opinions and data contained in all publications are solely those of the individual author(s) and contributor(s) and not of MDPI and/or the editor(s). MDPI and/or the editor(s) disclaim responsibility for any injury to people or property resulting from any ideas, methods, instructions or products referred to in the content.

