
Spectral Heterogeneity Analysis and Soil Organic Matter Inversion across Differences in Soil Types and Organic Matter Content in Dryland Farmland in China

Abstract
:1. Introduction
2. Materials and Methods
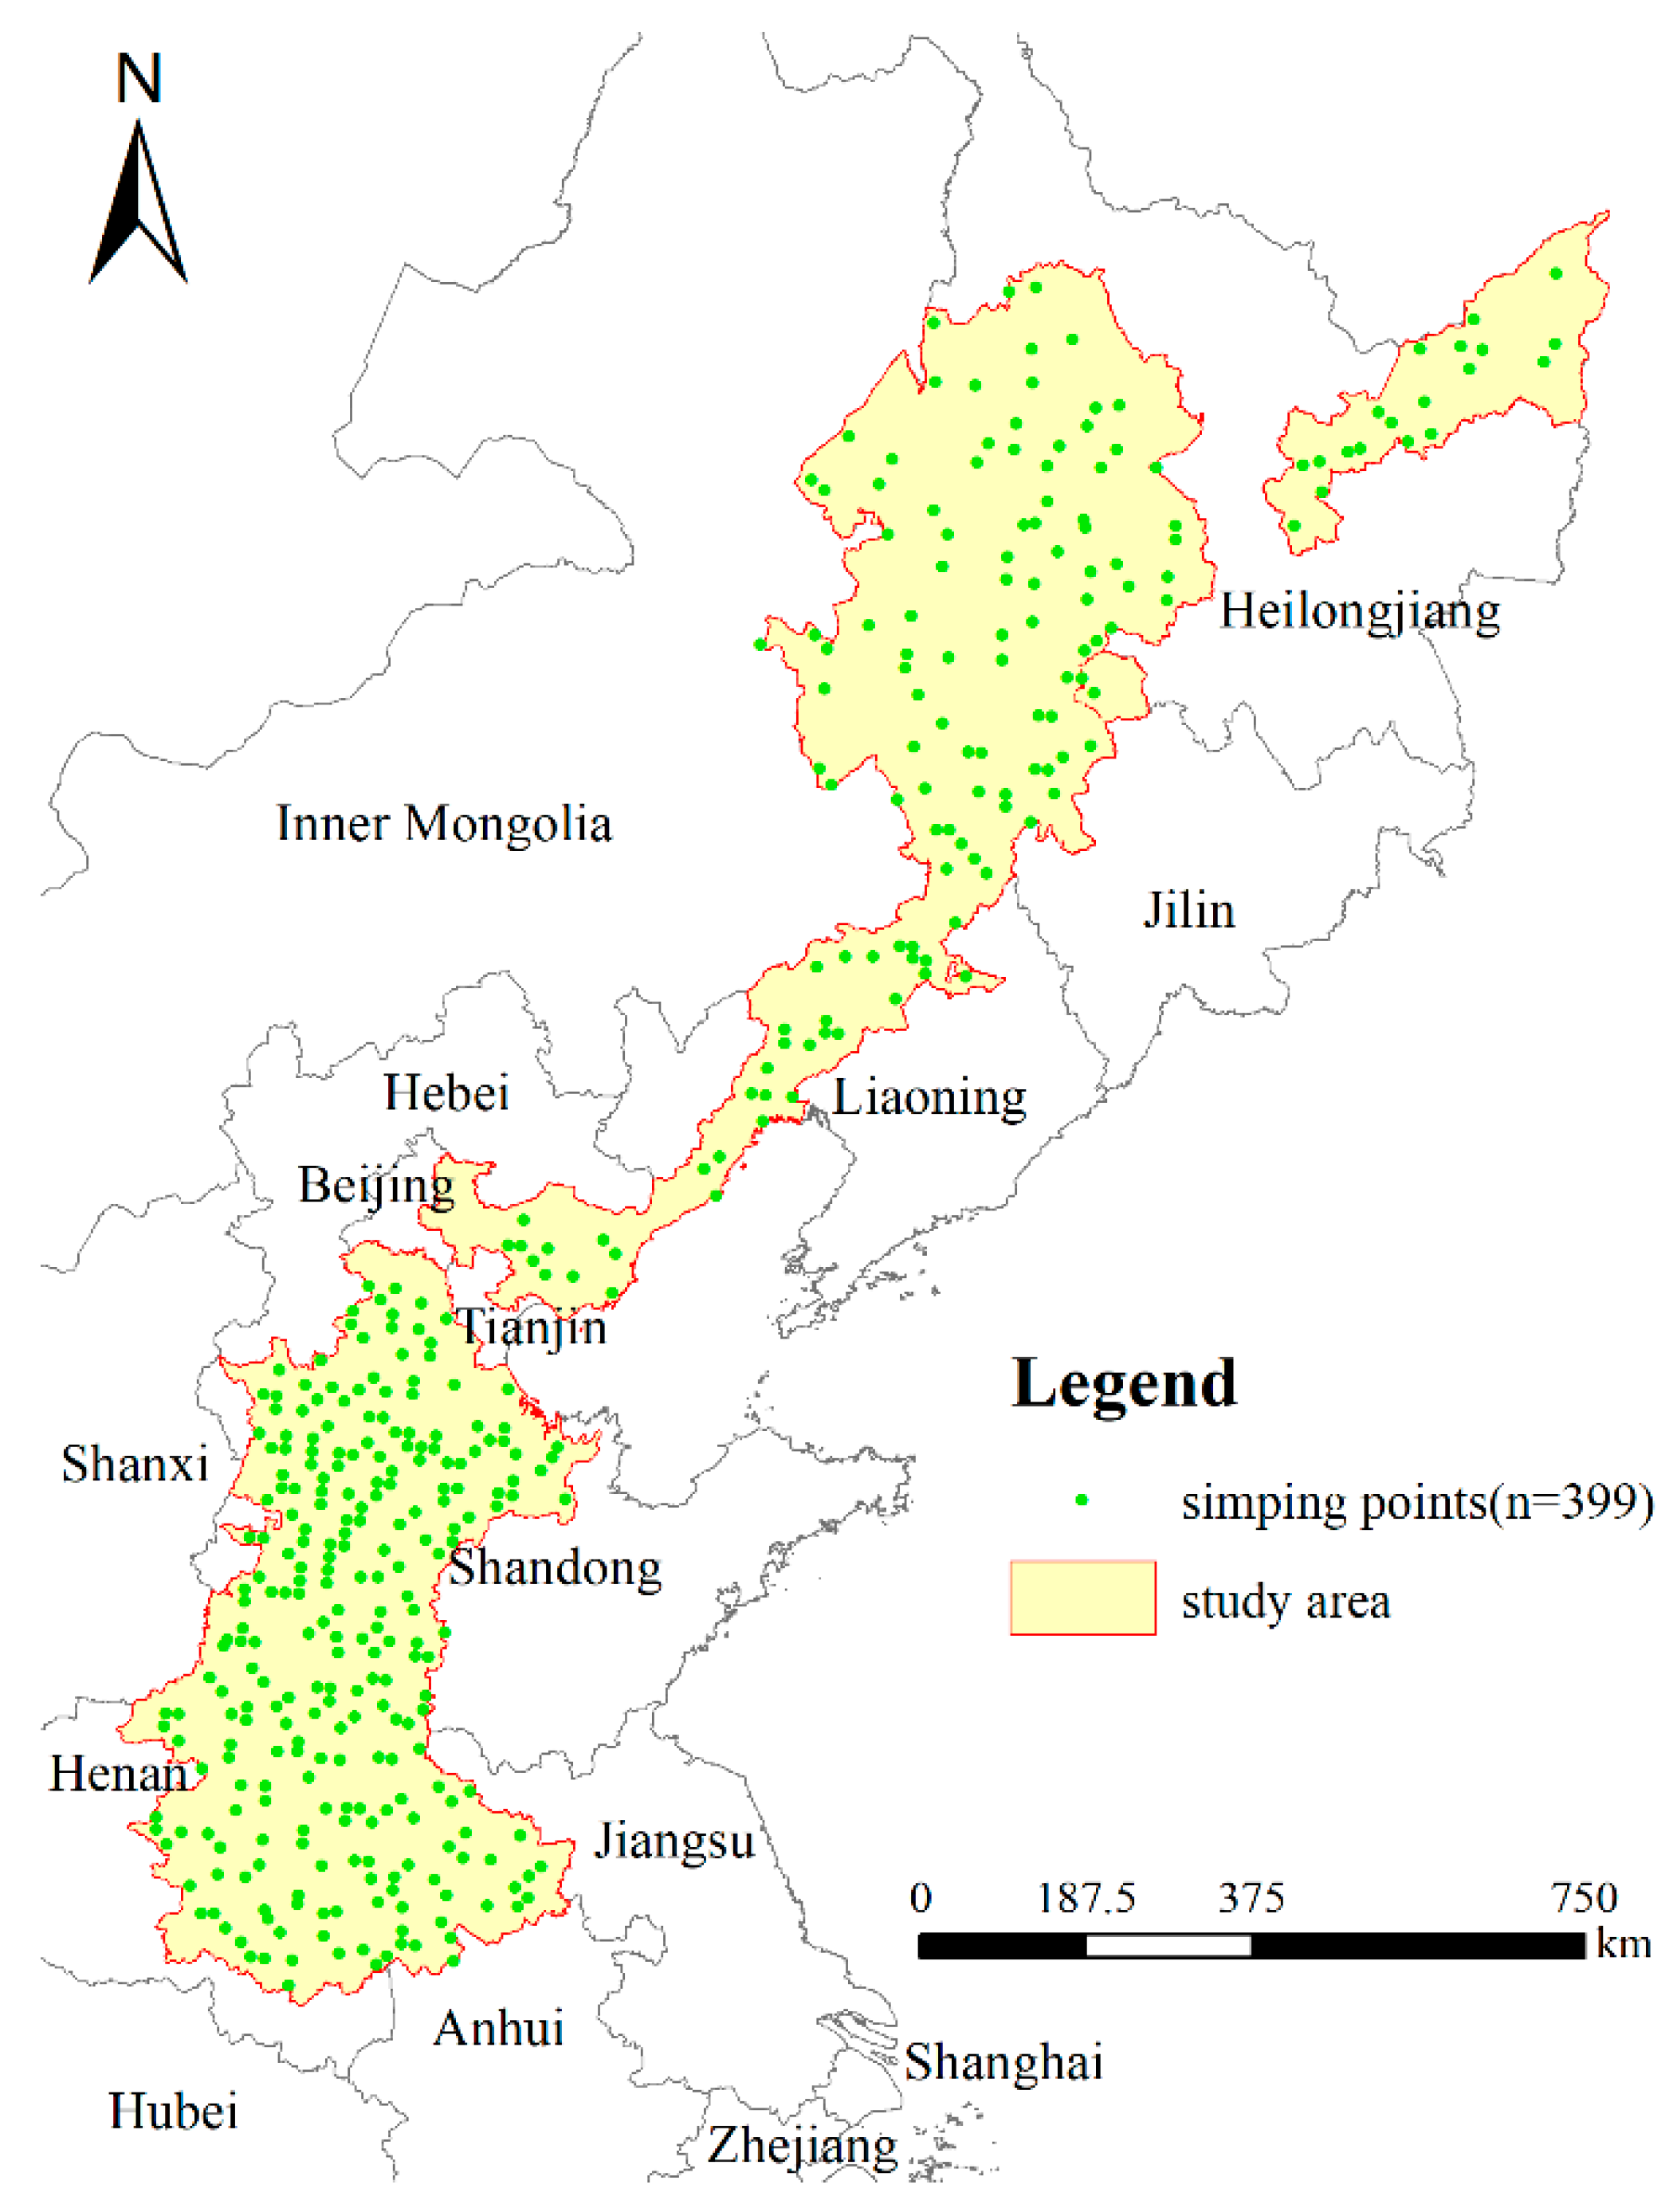
2.1. Study Area
2.2. Data Acquisition
2.3. Research Methods
2.3.1. Spectral Data Preprocessing
2.3.2. Partial Least Squares Regression (PLSR)
2.3.3. Random Forest Regression (RFR)
2.4. SOM Mapping
3. Results
3.1. Soil Attributes Descriptive Statistics
3.2. Analysis of Soil Spectral Characteristics
3.3. SOM Inversion Using Hyperspectral Data
3.3.1. Modeling and Analysis
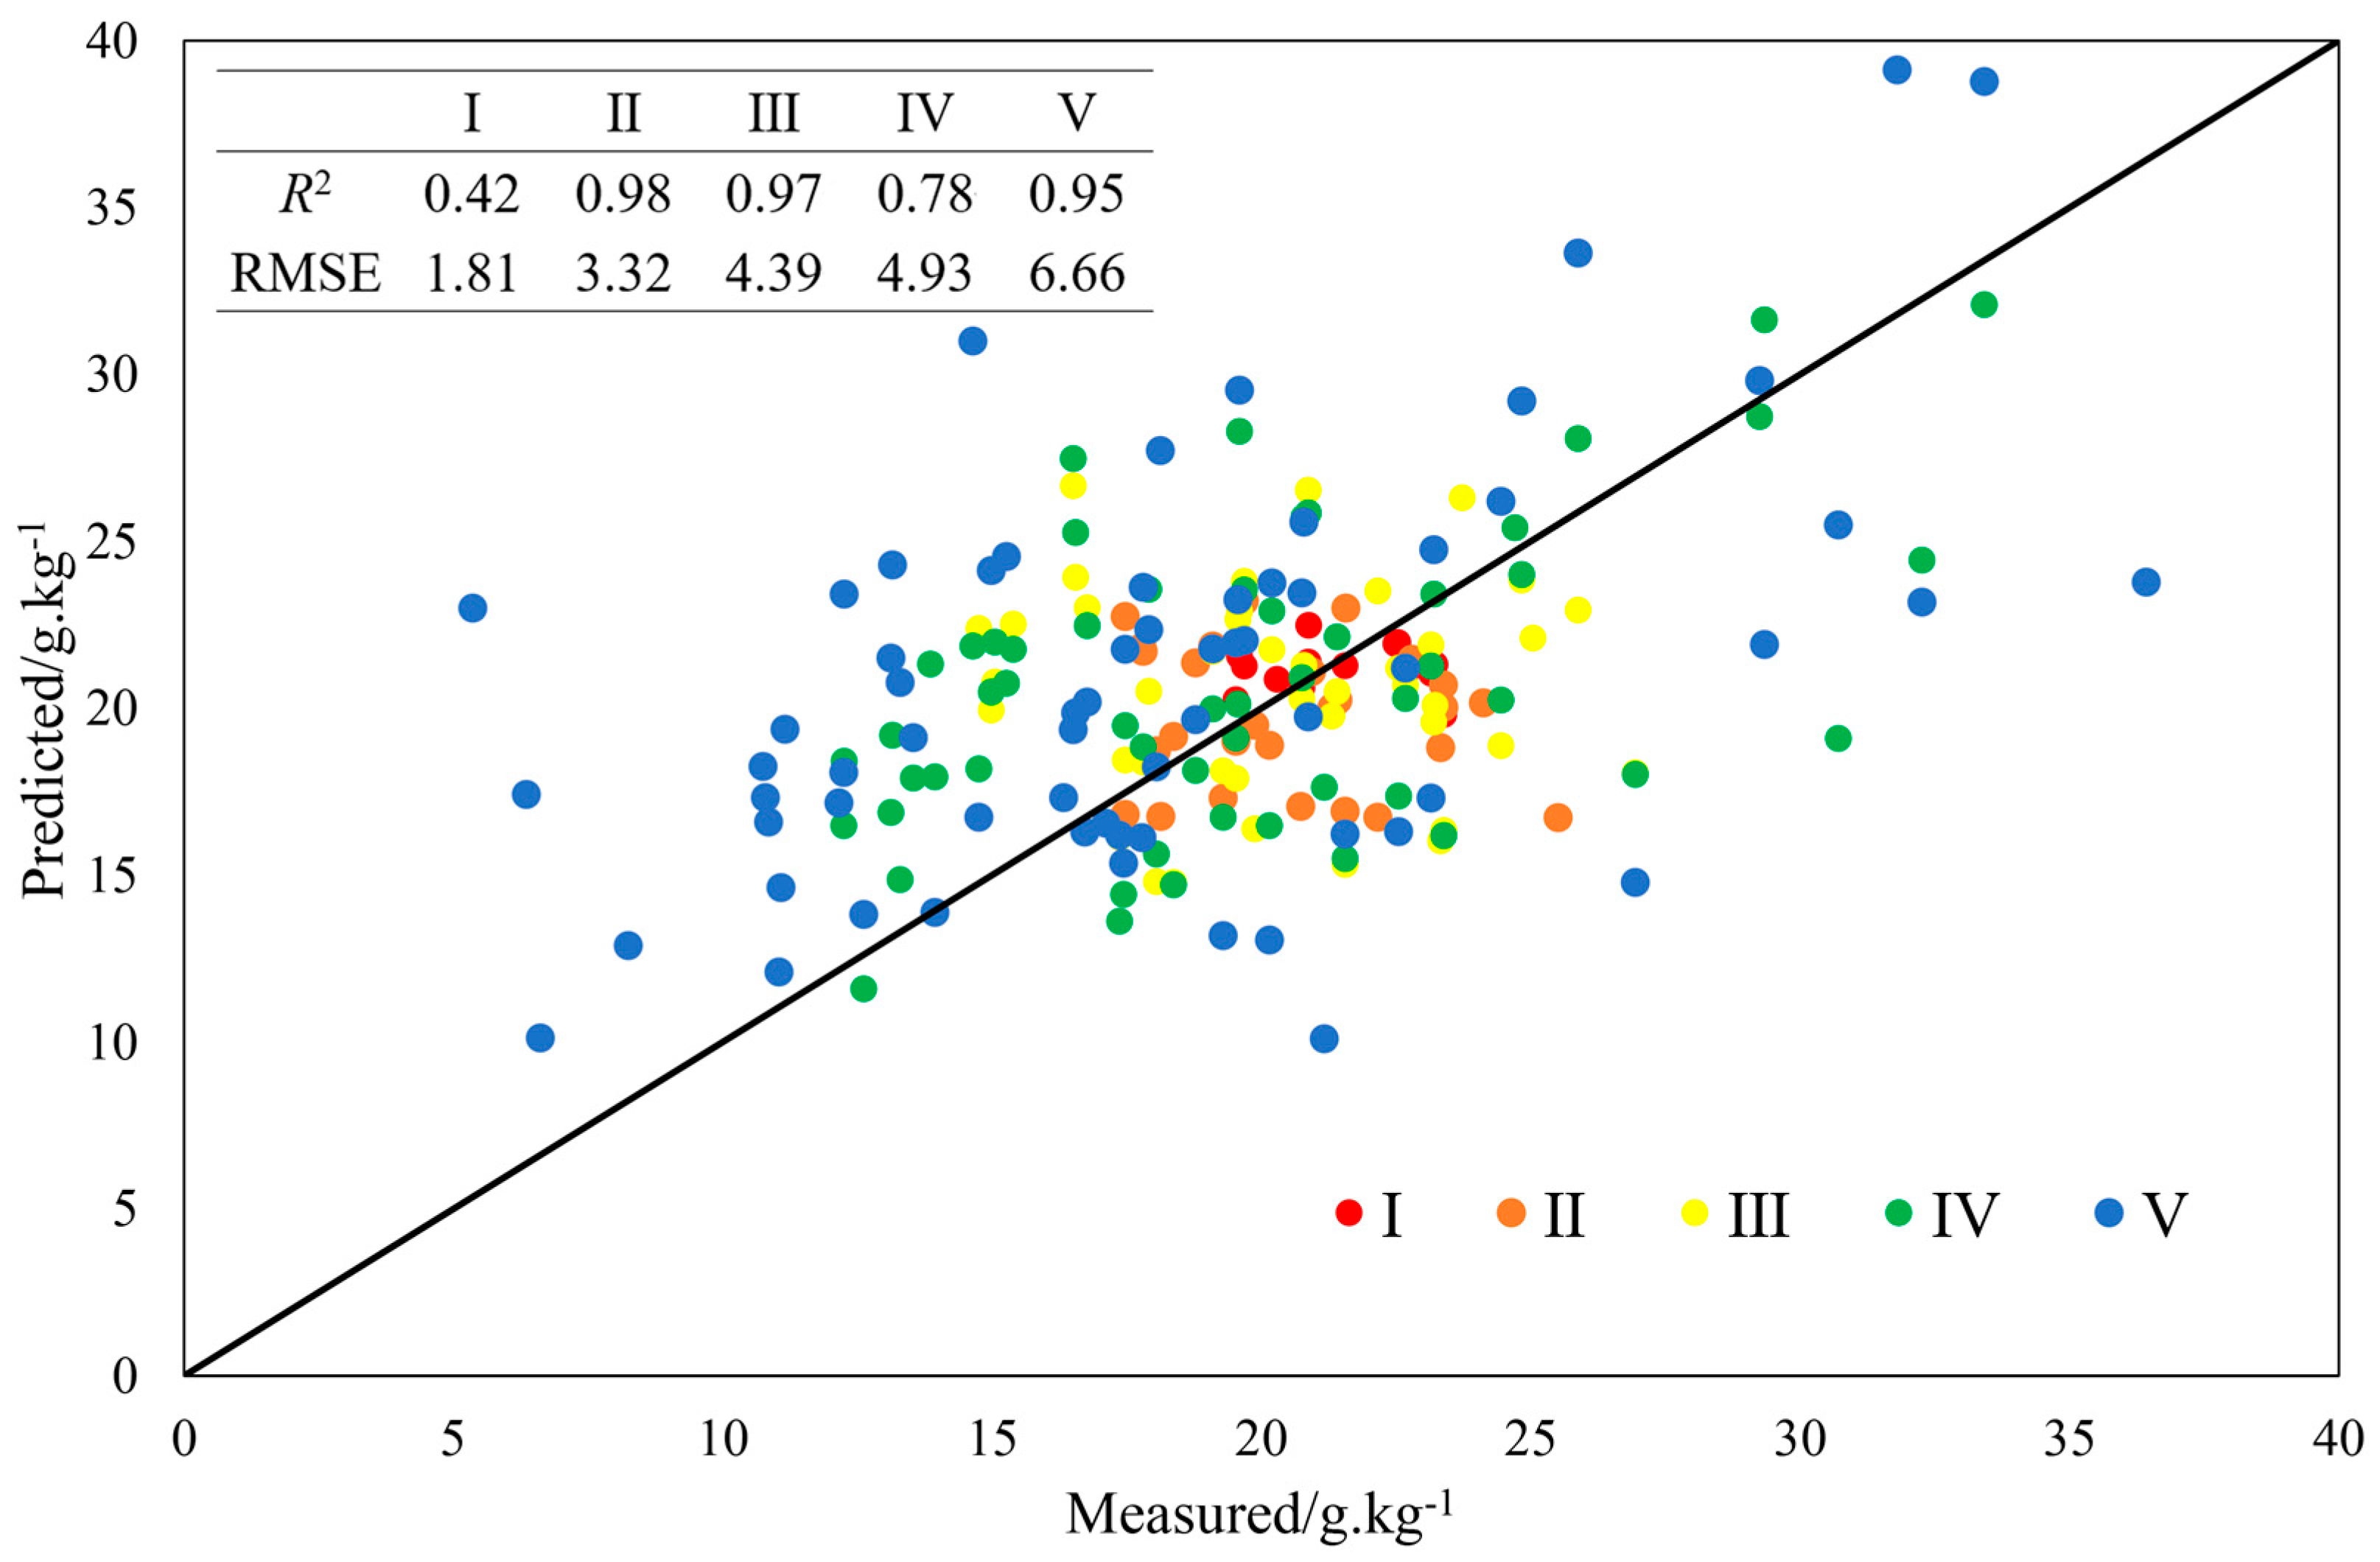
3.3.2. Effect of Content Differences on Inversion of SOM of Fluvo-Aquic Soil
3.4. Spatial Distribution of SOM in Dry Farmland
4. Discussion
4.1. Feasibility of Inverse SOM Using Hyperspectral Data
4.2. Influence of a Large Areas on SOM Hyperspectral Inversion
5. Conclusions
Author Contributions
Funding
Institutional Review Board Statement
Informed Consent Statement
Data Availability Statement
Conflicts of Interest
References
- Lavallee, J.M.; Soong, J.L.; Cotrufo, M.F. Conceptualizing soil organic matter into particulate and mineral-associated forms to address global change in the 21st century. Glob. Chang. Biol. 2020, 26, 261–273. [Google Scholar] [CrossRef] [PubMed]
- Augusto, L.; Boca, A. Tree functional traits, forest biomass, and tree species diversity interact with site properties to drive forest soil carbon. Nat. Commun. 2022, 13, 1097–1108. [Google Scholar] [CrossRef] [PubMed]
- State Council of the PRC. Circular of the State Council on the Issuance of the National Plan for Agricultural Modernization (2016–2020); State Council of the PRC: Beijing, China, 2016.
- Wang, S.; Guan, K.Y.; Zhang, C.H.; Lee, D.; Margenot, A.J.; Ge, Y.F.; Peng, J.; Zhou, W.; Zhou, Q.; Huang, Y.Z. Using soil library hyperspectral reflectance and machine learning to predict soil organic carbon: Assessing potential of airborne and spaceborne optical soil sensing. Remote Sens. Environ. 2022, 271, 112914. [Google Scholar] [CrossRef]
- Liu, F.; Rossiter, D.G.; Zhang, G.L.; Li, D.C. A soil colour map of China. Geoderma 2020, 379, 114556. [Google Scholar] [CrossRef]
- Gupta, N. Development of Staring Hyperspectral Imagers. In Proceedings of the 2011 IEEE Applied Imagery Pattern Recognition Workshop (AIPR), Washington, DC, USA, 11–13 October 2011; pp. 1–8. [Google Scholar] [CrossRef]
- Kamil, S.; Helena, Ł.; Rafał, P.; Andrzej, D.; Łukasz, G.; Mateusz, Ł.; Anna, R.P.; Jan, S.; Bogusław, U. Agricultural Drought Monitoring by MODIS Potential Evapotranspiration Remote Sens Data Application. Remote Sens. 2020, 12, 3411. [Google Scholar] [CrossRef]
- Lu, X.; Yong, H.; Yu, W.; Long, G.; Tiezhu, S.; Yi, L.; Qinghu, J.; Teng, F.; Yaolin, L.; Abdul, M.M.; et al. Estimation of Organic Carbon in Anthropogenic Soil by VIS-NIR Spectroscopy: Effect of Variable Selection. Remote Sens. 2020, 12, 3394. [Google Scholar] [CrossRef]
- Liu, L.; Shen, R.; Ding, G. Studies on the Estimation of SOM Content Based on Hyper-Spectrum. Spectrosc. Spectr. Anal. 2011, 31, 762–766. [Google Scholar] [CrossRef]
- Bowers, S.A.; Hanks, R.J. Reflection of Radiant Energy from Soils. Soil Sci. 1965, 100, 130–138. [Google Scholar] [CrossRef]
- Sha, J.M.; Chen, P.C.; Chen, S.L. Characteristics Analysis pf Soil Spectrum Response Resulted from Organic Material. Res. Soil Water Conserv. 2003, 10, 21–24. [Google Scholar] [CrossRef]
- Qi, Y.B.; Qie, X.; Qin, Q.R.; Shukla, M.K. Prediction of soil calcium carbonate with soil visi-ble-near-infrared reflection (Vis-NIR) spectral in Shaanxi province, China: Soil groups vs. spectral groups. Int. J. Remote Sens. 2021, 42, 2502–2516. [Google Scholar] [CrossRef]
- Wei, L.F.; Yuan, Z.R.; Wang, Z.X.; Zhao, L.Y.; Zhang, Y.X.; Lu, X.Y.; Cao, L.Q. Hyperspectral Inversion of Soil Organic Matter Content Based on a Combined Spectral Index Model. Sensors 2020, 20, 2777. [Google Scholar] [CrossRef] [PubMed]
- Nayak, A.K.; Rahman, M.M.; Naidu, R.; Dhal, B.; Swain, C.K.; Nayak, A.D.; Tripathi, R.; Shahid, M.; Islam, M.R.; Pathak, H. Current and emerging methodologies for estimating carbon sequestration in agricultural soils: A review. Sci. Total Environ. 2019, 665, 890–912. [Google Scholar] [CrossRef] [PubMed]
- Ustin, S.L.; Middleton, E.M. Current and near-term advances in Earth observation for ecological applications. Ecol. Process. 2021, 10, 1. [Google Scholar] [CrossRef] [PubMed]
- Dou, X.; Wang, X.; Liu, H.J.; Zhang, X.L.; Meng, L.H.; Pan, Y.; Yu, Z.Y.; Cui, Y. Prediction of soil organic matter using multi-temporal satellite images in the Songnen Plain, China. Geoderma 2019, 356, 113896. [Google Scholar] [CrossRef]
- Vaudour, E.; Gomez, C.; Lagacherie, P.; Loiseau, T.; Baghdadi, N.; Urbina-Salazar, D.; Loubet, B.; Arrouays, D. Temporal mosaicking approaches of Sentinel-2 images for extending topsoil organic carbon content mapping in croplands. Int. J. Appl. Earch Obs. Geoinf. 2021, 96, 102277. [Google Scholar] [CrossRef]
- Xiao, Y.F.; Gao, X.H.; Li, G.W. Optimal Selection of Calibration Sample Sets for Predicting SOM Contents from Visible and Near Infrared Reflection Spectrum. Soils 2020, 52, 404–413. [Google Scholar] [CrossRef]
- Angelopoulou, T.; Tziolas, N.; Balafoutis, A.; Zalidis, G.; Bochtis, D. Remote Sensing Techniques for Soil Organic Carbon Estimation: A Review. Remote Sens. 2019, 11, 676. [Google Scholar] [CrossRef]
- Wang, X.P.; Zhang, F.; Kung, H.T.; Johnson, V.C. New Methods for Improving the Remote Sensing Estimation of SOM Content (SOMC) in the Ebinur Lake Wetland National Nature Reserve (ELWNNR) in northwest China. Remote Sens. Environ. 2018, 218, 104–118. [Google Scholar] [CrossRef]
- Gong, Z.N.; Wang, Q.W.; Zhang, C.; Guan, H.L. SOM Estimation Using Hyperspectral Remote Sensing Techniques in a Water-Level-Fluctuating Zone Around Guanting Reservoir, Beijing, China. In Proceedings of the 2019 IEEE International Geoscience and Remote Sensing Symposium, Yokohama, Japan, 28 July–2 August 2019; pp. 6929–6932. [Google Scholar]
- Shen, L.Z.; Gao, M.F.; Yan, J.W.; Li, Z.L.; Leng, P.; Yang, Q.; Duan, S.B. Hyperspectral Estimation of SOM Content using Different Spectral Preprocessing Techniques and PLSR Method. Remote Sens. 2020, 12, 1206. [Google Scholar] [CrossRef]
- Du, C.; Zhou, J. Application of Infrared Photoacoustic Spectroscopy in Soil Analysis. Appl. Spectrosc. Rev. 2011, 46, 405–422. [Google Scholar] [CrossRef]
- Soriano, D.; José, M.; Janik, L.J.; Viscarra, R.R.A.; Macdonald, L.M.; McLaughlin, M.J. The Performance of Visible, Near-, and Mid-Infrared Reflectance Spectroscopy for Prediction of Soil Physical, Chemical, and Biological Properties. Appl. Spectrosc. Rev. 2014, 49, 139–186. [Google Scholar] [CrossRef]
- Sun, Z.X.; Li, Y.; Zhao, Y.; Huang, Y.F.; Guo, X.L.; Cao, M. Analysis on Spatial Distribution Characteristics and Driving Forces of Soil Organic Carbon Density in Dry Farming Region. Trans. Chin. Soc. Agric. Mach. 2019, 50, 255–262. [Google Scholar] [CrossRef]
- Huang, Y.F.; Zhang, S.W. Spatial and Temporal Evolution of Cropland Quality and Charac-Terization of Fertile Tillage in Dryland Farming; Science Press: Beijing, China, 2021. [Google Scholar]
- Liu, W.; Zhao, Z.; Yuan, H.; Song, C.; Li, X. An Optimal Selection Method of Samples of Calibration Set and Validation Set for Spectral Multivariate Analysis. Spectrosc. Spectr. Anal. 2014, 34, 947–951. [Google Scholar] [CrossRef]
- Wang, X.; Li, L.; Liu, H.J.; Song, K.S.; Wang, L.P.; Meng, X.T. Prediction of soil organic matter using VNIR spectral parameters extracted from shape characteristics. Soil Tillage Res. 2021, 216, 105241. [Google Scholar] [CrossRef]
- Cheng, H.; Shen, R.; Chen, Y.; Wan, Q.; Shi, T.; Wang, J.; Wan, Y.; Hong, Y.; Li, X. Estimating Heavy Metal Concentrations in Suburban Soils with Reflectance Spectroscopy. Geoderma 2019, 336, 59–67. [Google Scholar] [CrossRef]
- Nawar, S.; Buddenbaum, H.; Hill, J.; Kozak, J.; Mouazen, A. Estimating the Soil Clay Content and Organic Matter by Means of Different Calibration Methods of vis-NIR Diffuse Reflectance Spectroscopy. Soil Tillage Res. 2015, 155, 510–522. [Google Scholar] [CrossRef]
- Xu, Z.; Chen, S.; Lu, P.; Wang, Z.; Li, A.; Zeng, Q.; Chen, L. Optimizing a Standard Spectral Measurement Protocol to Enhance the Quality of Soil Spectra: Exploration of Key Variables in Lab-Based VNIR-SWIR Spectral Measurement. Remote Sens. 2022, 14, 1558. [Google Scholar] [CrossRef]
- Xu, L.; Li, Q.; Zhu, X.; Liu, S. Hyperspectral Inversion of Heavy Metal Content in Coal Gangue Filling Reclamation Land. Spectrosc. Spectr. Anal. 2017, 37, 3839–3844. [Google Scholar] [CrossRef]
- Tang, H.; Meng, X.T.; Su, X.X.; Ma, T.; Liu, H.J.; Bao, Y.L.; Zhang, M.W.; Zhang, X.L.; Huo, H.Z. Hyperspectral prediction on soil organic matter of different types using CARS algorithm. Trans. Chin. Soc. Agric. Eng. 2021, 37, 105–113. [Google Scholar] [CrossRef]
- Wang, C.; Wu, X.; Li, L.; Wang, Y.; Li, Z. Convolutional Neural Network Application in Prediction of Soil Moisture Content. Spectrosc. Spectr. Anal. 2018, 38, 42–47. [Google Scholar] [CrossRef]
- National Soil Census Office. Soil Classification System in China; Agricultural Publishing House: Beijing, China, 1993. [Google Scholar]
- Geng, Z. Soil Science; Science Press: Beijing, China, 2010. [Google Scholar]
- Liao, Q.; Gu, X.; Li, C.; Chen, L.; Huang, W.; Du, S.; Fu, Y.; Wang, J. Estimation of fluvo-aquic SOM content from hyperspectral based on continuous wavelet transformation. Trans. Chin. Soc. Agric. Eng. 2012, 28, 132–139. [Google Scholar] [CrossRef]
- Chen, W.Q.; Ran, H.F.; Cao, X.Y.; Wang, J.Z.; Teng, D.X.; Chen, J.; Zheng, X. Estimating PM2.5 with High-Resolution 1-km AOD Data and an Improved Machine Learning Model over Shenzhen, China. Sci. Total Environ. 2020, 746, 141093–141103. [Google Scholar] [CrossRef]
- Shi, Y.; Jin, N.; Ma, X.L.; Wu, B.Y.; He, Q.S.; Yue, C.; Yu, Q. Attribution of climate and human activities to vegetation change in China using machine learning techniques. Agric. For. Meteorol. 2020, 294, 108146. [Google Scholar] [CrossRef]
- Gonzalez, S.; Garcia, S.; Del, S.J.; Rokach, L.; Herrera, F. A practical tutorial on bagging and boosting based ensembles for machine learning: Algorithms, software tools, performance study, practical perspectives and opportunities. Inf. Fusion 2020, 64, 205–237. [Google Scholar] [CrossRef]
- Li, Z.; Liu, M.; Ji, S. The Identification of the Origin of Chinese Wolfberry Based on Infrared Spectral Technology and the Artificial Neural Network. Spectrosc. Spectr. Anal. 2016, 36, 720–723. [Google Scholar] [CrossRef]
- Li, P.; Zhu, J.; Ma, Y.; Wu, X. Near Infrared Spectral Analysis Based on Partial Least Squares. J. Geomat. 2015, 40, 53–57. [Google Scholar] [CrossRef]
- Wang, X.M.; Yang, C.; Zhou, M.J. Partial Least Squares Improved Multivariate Adaptive Regression Splines for Visible and Near-Infrared-Based Soil Organic Matter Estimation Considering Spatial Heterogeneity. Appl. Sci. 2021, 11, 566. [Google Scholar] [CrossRef]
- Novacoski, E.J.; Caetano, I.K.; Melquiades, F.L.; Aline, M.G.; Torres, Y.R.; Gonzalez-Borrero, P.P. Spectroscopic based partial least-squares models to estimate soil features. Microchem. J. 2022, 180, 107617. [Google Scholar] [CrossRef]
- Wang, Q.; Chen, B.; Wang, F.; Song, Q.; Dou, Z.; Dai, J.; Xiao, Q.; Yang, X. Inversion for Spatial Distribution Pattern of SOM Based on HJ Image in Oasis Cotton Field. Trans. Chin. Soc. Agric. Eng. 2016, 32, 174–180. [Google Scholar] [CrossRef]
- Xie, X.F.; Wu, T.; Zhu, M.; Jiang, G.J.; Xu, Y.; Wang, X.H.; Pu, L.J. Comparison of random forest and multiple linear regression models for estimation of soil extracellular enzyme activities in agricultural reclaimed coastal saline land. Ecol. Indic. 2021, 120, 106925. [Google Scholar] [CrossRef]
- Azizi, K.; Ayoubi, S.; Nabiollahi, K.; Garosi, Y.; Gislum, R. Predicting heavy metal contents by applying machine learning approaches and environmental covariates in west of Iran. J. Geochem. Explor. 2022, 233, 106921. [Google Scholar] [CrossRef]
- Ewing, J.; Oommen, T.; Jayakumar, P.; Alger, R. Utilizing Hyperspectral Remote Sensing for Soil Gradation. Remote Sens. 2020, 12, 3312. [Google Scholar] [CrossRef]
- Yu, L.; Hong, Y.S.; Zhou, Y.; Zhu, Q. Inversion of SOM Content Using Hyperspectral Data Based on Continuous Wavelet Transformation. Spectrosc. Spectr. Anal. 2016, 36, 1428–1433. [Google Scholar] [CrossRef]
- Chang, R.; Chen, Z.; Wang, D.; Guo, K. Hyperspectral Remote Sensing Inversion and Monitoring of Organic Matter in Black Soil Based on Dynamic Fitness Iner-tia Weight Particle Swarm Optimization Neural Network. Remote Sens. 2022, 14, 4316. [Google Scholar] [CrossRef]
- Du, P.; Kibbe, W.A.; Lin, S.M. Improved Peak Measurement in Mass Spectrum by Incorporating Continuous Wavelet Transform-Based Pattern Matching. Bioinformatics 2006, 22, 2059–2065. [Google Scholar] [CrossRef]
- Guo, H.L.; Zhang, R.R.; Dai, W.H.; Zhou, X.W.; Zhang, D.J.; Yang, Y.H.; Cui, J. Mapping Soil Organic Matter Content Based on Feature Band Selection with ZY1-02D Hyperspectral Satellite Data in the Agricultural Region. Agronomy 2022, 12, 2111. [Google Scholar] [CrossRef]
- Tong, Q.X.; Tian, G.L. Analysis of Typical Chinese Surface Features and Their Characteristics; Science Press: Beijing, China, 1999. [Google Scholar]
- Silvero, N.E.Q.; Di Raimo, L.A.D.; Pereira, G.S.; de Magalhaes, L.P.; Terra, F.D.; Dassan, M.A.A.; Salazar, D.F.U.; Dematte, J.A.M. Effects of Water, Organic Matter, and Iron Forms in Mid-IR Spectra of Soils: Assessments from Laboratory to Satellite-Simulated Data. Geoderma 2020, 375, 114480. [Google Scholar] [CrossRef]
- Wang, J.; He, T.; Li, Y.H. Studying on Extraction Methods for Land Quality Information Based on Hyperspectral Data. J. Remote Sens. 2005, 9, 438–445. [Google Scholar] [CrossRef]
- Sun, W.; Liu, S.; Zhang, X.; Li, Y. Estimation of soil organic matter content using selected spectral subset of hyperspectral data. Geoderma 2022, 409, 115653. [Google Scholar] [CrossRef]
- Gao, J.; Liang, C.; Shen, G.; Lv, J.; Wu, H. Spectral Characteristics of Dissolved Organic Matter in Various Agricultural Soils Throughout China. Chemosphere 2017, 176, 108–116. [Google Scholar] [CrossRef]
- Wang, H.; Zhang, Z.; Karnieli, A.; Chen, J.; Han, W. Hyperspectral Estimation of Desert SOM Content Based on Gray Correlation-Ridge Regression Model. Trans. Chin. Soc. Agric. Eng. 2018, 34, 124–131. [Google Scholar] [CrossRef]
- Wang, X. Spatial Variation of Organic Matter in Horizontal Zonal Soils in China. Sci. Geogr. Sin. 2001, 21, 19–23. [Google Scholar] [CrossRef]
- Zhao, X.; Yang, M. Hyper-spectral Characteristics of Major Types of Soils in Red Soil Region of Jiangxi Province, China. Acta Pedol. Sin. 2018, 55, 31–42. [Google Scholar] [CrossRef]
- Cheng, H.; Wan, Y.; Chen, Y.; Wan, Q.; Shi, T.; Shen, R.; Guo, K.; Hu, J. Study on the Characteristics and Mechanism of Visible and Near Inf rared Reflectance Spectra of Soil Heavy Metals. Spectrosc. Spectr. Anal. 2018, 38, 771–778. [Google Scholar] [CrossRef]
- Shen, Q.; Zhang, S.; Ge, C.; Liu, H.; Zhou, Y.; Chen, Y.; Hu, Q.; Ye, H.; Huang, Y. Hyperspectral Inversion of Heavy Metal Content in Soils Reconstituted by Mining Wasteland. Spectrosc. Spectr. Anal. 2019, 39, 1214–1221. [Google Scholar] [CrossRef]
- Chen, C.M.; Hall, S.J.; Coward, E.; Thompson, A. Iron-mediated organic matter decomposition in humid soils can counteract protection. Nat. Commun. 2020, 11, 2255. [Google Scholar] [CrossRef]
- Lv, Z.Y.; Wang, F.J.; Cui, G.Q.; Benediktsson, J.A.; Lei, T.; Sun, W.W. Spatial-Spectral Attention Network Guided with Change Magnitude Image for Land Cover Change Detection Using Remote Sensing Images. IEEE Trans. Geosci. Remote Sens. 2022, 60, 1–12. [Google Scholar] [CrossRef]
- Kim, H.; Yu, J.; Wang, L.; Jeong, Y.; Kim, J. Variations in Spectral Signals of Heavy Metal Contamination in Mine Soils Controlled by Mineral Assemblages. Remote Sens. 2020, 12, 3273. [Google Scholar] [CrossRef]


| Soil Type | Main Provinces | Sample Points | SOM (g/kg) | |||
|---|---|---|---|---|---|---|
| Max | Min | Mean | Standard Deviation | |||
| Dark-brown earth | Heilongjiang | 15 | 85.77 | 12.53 | 39.66 | 11.65 |
| Fluvo-aquic soils | Heilongjiang, Hebei | 197 | 77.13 | 4.96 | 20.42 | 9.75 |
| Yellow-cinnamon soils | Henan | 11 | 23.94 | 9.54 | 17.65 | 11.14 |
| Cinnamon soils | Hebei, Henan | 61 | 79.28 | 8.22 | 23.72 | 10.07 |
| Chernozems | Heilongjiang, Jilin | 32 | 44.48 | 5.72 | 25.49 | 11.98 |
| Black soils | Heilongjiang, Jilin | 68 | 71.15 | 9.47 | 28.51 | 12.42 |
| Brown earth | Liaoning | 15 | 27.51 | 6.09 | 16.60 | 5.68 |
| Grade | Content Difference (between Max and Min) | SOM (g/kg) | |||
|---|---|---|---|---|---|
| Max | Min | Mean | Standard Deviation | ||
| I | 3.89 | 23.15 | 19.26 | 21.18 | 1.22 |
| II | 8.49 | 25.60 | 17.11 | 21.19 | 2.43 |
| III | 14.58 | 29.46 | 14.88 | 21.37 | 3.93 |
| IV | 23.11 | 35.26 | 12.15 | 21.73 | 5.82 |
| V | 80.81 | 85.77 | 4.96 | 23.21 | 11.65 |
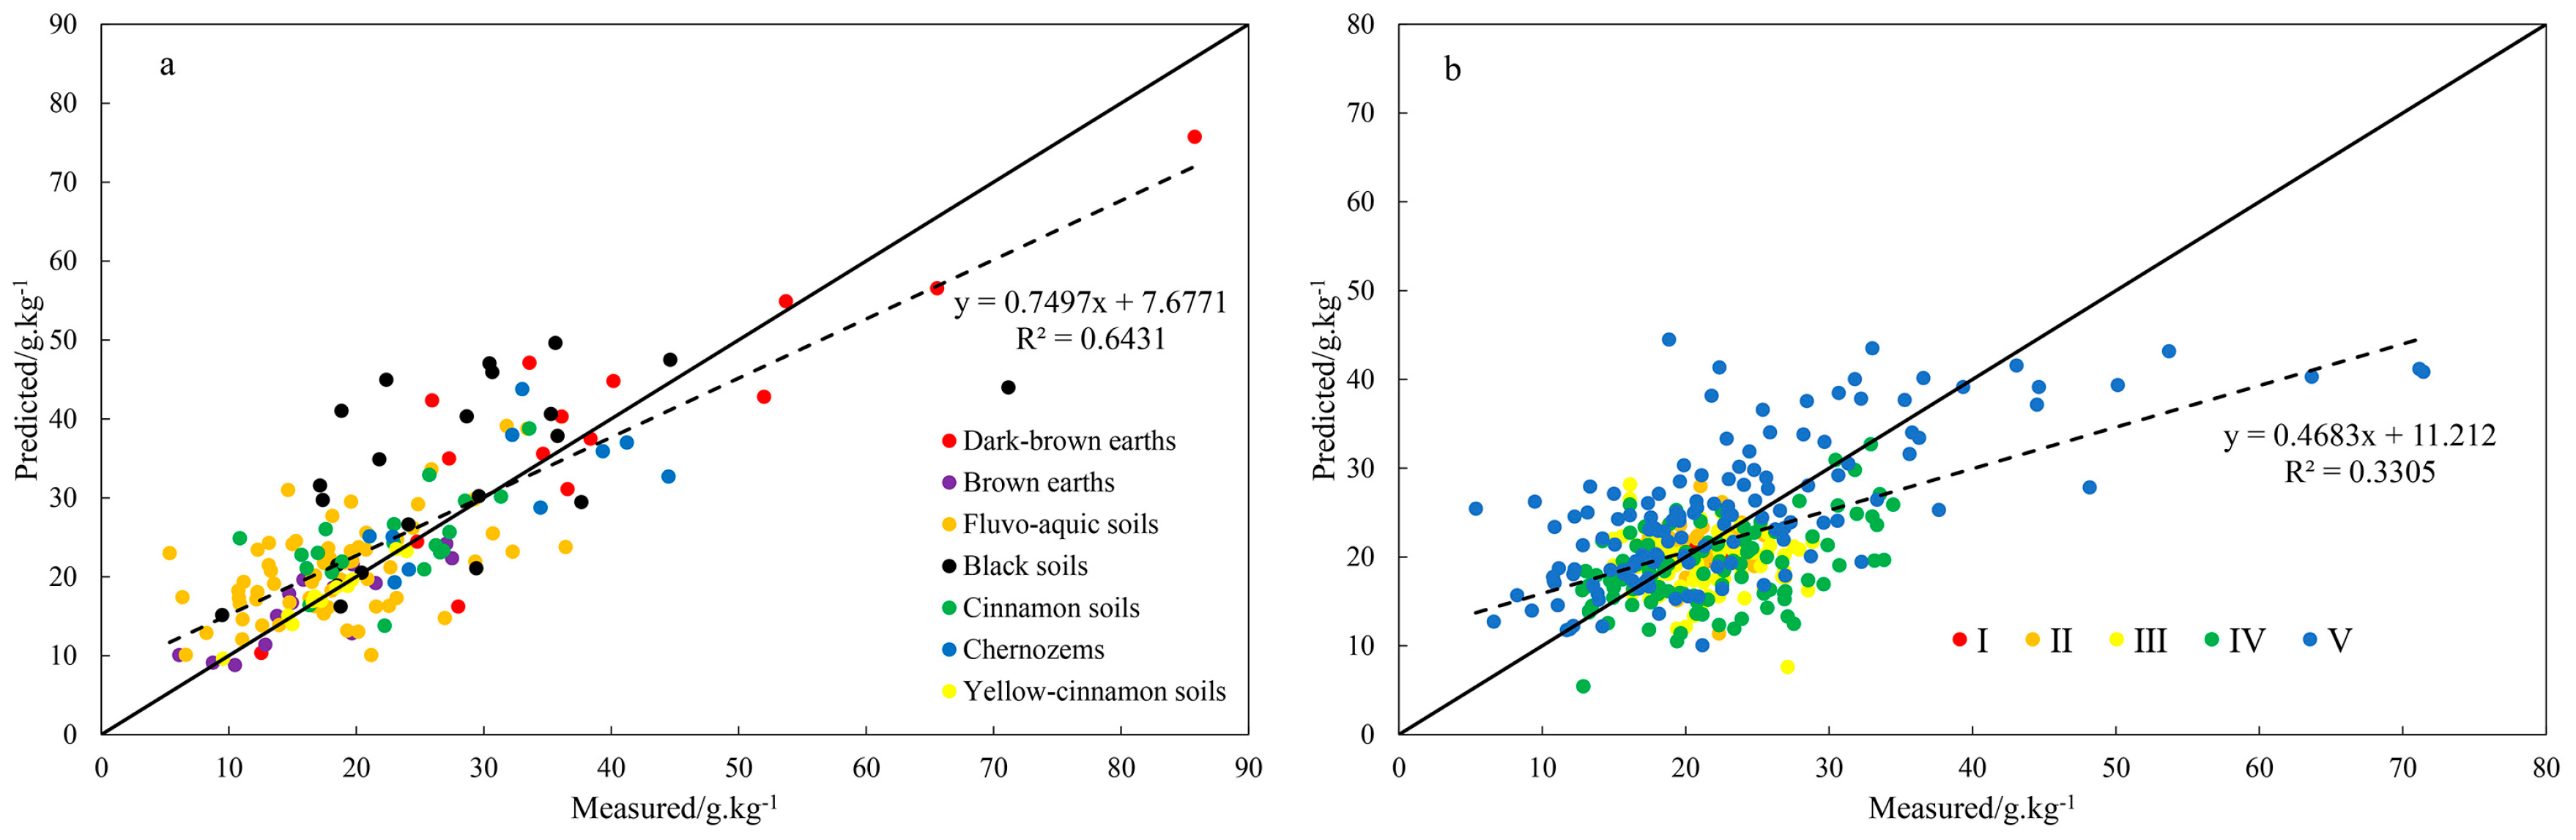
| Soil Types | RFR | PLSR | ||
|---|---|---|---|---|
| R2 | RMSE | R2 | RMSE | |
| All samples | 0.57 | 6.98 | 0.51 | 7.53 |
| Dark-brown earth | 0.24 | 10.91 | 0.79 | 8.14 |
| Fluvo-aquic soils | 0.76 | 6.09 | 0.95 | 6.66 |
| Yellow-cinnamon soils | 0.19 | 2.40 | 0.98 | 0.52 |
| Cinnamon soils | 0.74 | 5.48 | 0.97 | 5.54 |
| Chernozems | 0.94 | 6.26 | 0.92 | 6.29 |
| Black soils | 0.73 | 12.5 | 0.93 | 12.34 |
| Brown earth | 0.33 | 3.40 | 0.70 | 3.18 |
| Grade | RFR | PLSR | ||
|---|---|---|---|---|
| R2 | RMSE | R2 | RMSE | |
| I | 0.24 | 1.14 | 0.51 | 1.21 |
| II | 0.30 | 3.00 | 0.93 | 3.42 |
| III | 0.30 | 4.57 | 0.91 | 5.38 |
| IV | 0.34 | 5.65 | 0.82 | 6.15 |
| V | 0.57 | 6.98 | 0.51 | 7.53 |
| Grade | Content Difference (between Max and Min) | SOM (g/kg) | |||
|---|---|---|---|---|---|
| Max | Min | Mean | Standard Deviation | ||
| I | 3.86 | 23.38 | 19.53 | 21.55 | 1.24 |
| II | 8.41 | 25.88 | 17.46 | 21.59 | 2.31 |
| III | 14.67 | 29.25 | 14.57 | 20.82 | 3.99 |
| IV | 23.71 | 35.95 | 12.24 | 20.82 | 5.61 |
| V | 72.17 | 77.13 | 4.96 | 20.42 | 9.76 |
| SOM (g/kg) | Fe (mg/kg) | Mn (mg/kg) | |
|---|---|---|---|
| Dark-brown earth | 39.66 | 60.48 | 38.64 |
| Fluvo-aquic soils | 20.42 | 13.72 | 16.04 |
| Yellow-cinnamon soils | 17.65 | 24.63 | 22.89 |
| Cinnamon soils | 23.72 | 15.48 | 18.91 |
| Chernozems | 25.49 | 26.47 | 20.61 |
| Black soils | 28.51 | 31.28 | 22.76 |
| Brown earth | 16.60 | 50.15 | 41.54 |
Disclaimer/Publisher’s Note: The statements, opinions and data contained in all publications are solely those of the individual author(s) and contributor(s) and not of MDPI and/or the editor(s). MDPI and/or the editor(s) disclaim responsibility for any injury to people or property resulting from any ideas, methods, instructions or products referred to in the content. |
© 2023 by the authors. Licensee MDPI, Basel, Switzerland. This article is an open access article distributed under the terms and conditions of the Creative Commons Attribution (CC BY) license (https://creativecommons.org/licenses/by/4.0/).
Share and Cite
Shen, Q.; Zhang, S.; Xia, K. Spectral Heterogeneity Analysis and Soil Organic Matter Inversion across Differences in Soil Types and Organic Matter Content in Dryland Farmland in China. Sustainability 2023, 15, 16310. https://doi.org/10.3390/su152316310
Shen Q, Zhang S, Xia K. Spectral Heterogeneity Analysis and Soil Organic Matter Inversion across Differences in Soil Types and Organic Matter Content in Dryland Farmland in China. Sustainability. 2023; 15(23):16310. https://doi.org/10.3390/su152316310
Chicago/Turabian StyleShen, Qiang, Shiwen Zhang, and Ke Xia. 2023. "Spectral Heterogeneity Analysis and Soil Organic Matter Inversion across Differences in Soil Types and Organic Matter Content in Dryland Farmland in China" Sustainability 15, no. 23: 16310. https://doi.org/10.3390/su152316310
APA StyleShen, Q., Zhang, S., & Xia, K. (2023). Spectral Heterogeneity Analysis and Soil Organic Matter Inversion across Differences in Soil Types and Organic Matter Content in Dryland Farmland in China. Sustainability, 15(23), 16310. https://doi.org/10.3390/su152316310