Article

Research on Maize Acreage Extraction and Growth Monitoring Based on a Machine Learning Algorithm and Multi-Source Remote Sensing Data

1
School of Civil and Hydraulic Engineering, Ningxia University, Yinchuan 750021, China
2
College of Hydrology and Water Resources, Hohai University, Nanjing 210098, China
3
The National Key Laboratory of Water Disaster Prevention, Hohai University, Nanjing 210098, China
4
State Key Laboratory of Land Degradation and Ecological Restoration in Northwest China, Yinchuan 750021, China
5
Engineering Technology Research Center of Water-Saving and Water Resource Regulation in Ningxia, Yinchuan 750021, China
*
Author to whom correspondence should be addressed.
Sustainability 2023, 15(23), 16343; https://doi.org/10.3390/su152316343
Submission received: 29 September 2023 / Revised: 8 November 2023 / Accepted: 23 November 2023 / Published: 27 November 2023

Abstract

:
Getting accurate and up-to-date information on the cultivated land area and spatial arrangement of maize, an important staple crop in the Ningxia Hui Autonomous Region, is very important for planning agricultural development in the region and judging crop yields. This work proposes a machine-learning methodology to extract corn from medium-resolution photos obtained from the Sentinel-2 satellite. The Google Earth Engine (GEE) cloud platform is utilized to facilitate the process. The identification of maize cultivation regions in Huinong District in the year 2021 was performed through the utilization of support vector machine (SVM) and random forest (RF) classification techniques. After obtaining the results, they were compared to see if using the random forest classification method to find planting areas for maize was possible and useful. Subsequently, the regions where maize was cultivated were combined with image data from the Moderate Resolution Imaging Spectroradiometer (MODIS), which has a high temporal resolution. The Normalized Difference Vegetation Index (NDVI) contemporaneous difference method, which gives regular updates, was then used to track the growth of maize during its whole growth phase. The study’s results show that using the GEE cloud platform made it easier to quickly map out data about where to plant maize in Huinong District. Furthermore, the implementation of the random forest method resulted in enhanced accuracy in extracting maize planting areas. The confusion matrix’s evaluation of the classification performance produced an average overall accuracy of 98.9% and an average Kappa coefficient of 0.966. In comparison to the statistics yearbook of the Ningxia Hui Autonomous Region, the method employed in this study consistently yielded maize-planted area estimates in Huinong District with relative errors below 4% throughout the period spanning 2017 to 2021. The average relative error was found to be 2.04%. By combining MODIS image data with the NDVI difference model in the year 2021, the high-frequency monitoring of maize growth in Huinong District was successful. The growth of maize in Huinong District in 2021 exhibited comparable or improved performance in the seedling stage, nodulation stage, and the early stage of staminate pulling and spitting, possibly attributed to the impact of climate and other relevant elements. After that, the growth slowed down in August, and the percentage of regions with slower growth rates than in previous years gradually increased. However, overall, the growth of maize in Huinong District during the year 2021 showed improvement relative to the preceding years. The present study introduces a novel approach that demonstrates the capability to accurately extract corn crops in the Huinong District while simultaneously monitoring their growth at a high frequency.

1. Introduction

Looking into the rules, processes, and mechanisms that control how crops’ spatial and temporal patterns change over time is a very new area of research that is receiving a lot of attention in the fields of sustainability science and global change [1,2]. To fully consider and create food security policies and climate change response plans at different regional levels, it is important to have a complete understanding of how agricultural land has been used in the past, how it is being used now, and how it will be used in the future. A good understanding of this is especially important for figuring out the spatial and temporal dynamics that affect where crops grow, as well as for studying the carbon and nitrogen cycles on land, how water is used, and soil erosion.
Maize, as one of the primary agricultural commodities in China, plays a crucial role in ensuring food security and livelihood stability within the country. Specifically, in the Ningxia Hui Autonomous Region, maize holds significant importance as it accounts for over 60% of the total grain output [3]. The grass and cattle business greatly benefits from its crucial contribution to augmenting farmers’ income and facilitating high-quality development. Utilizing satellite remote sensing technology to better understand the spatial and temporal distributions of maize and keep an eye on its growth makes it easier for local agricultural departments to quickly obtain information about crop growth. This holds immense importance for the implementation of refined production management and the assessment of agricultural yields at a regional level.
The conventional approach for determining the maize planting area is based on statistical reporting and local measurements [4]. However, this method is highly vulnerable to human interference and suffers from slow data updating, making it challenging to capture the internal variability characteristics of administrative units. A significant reliance on labor, decreased effectiveness, and a constrained range of activities set the phenomenon apart. The practice of large-scale maize growing has faced challenges in meeting the development demands of modern maize production and management due to rising labor costs and limitations in information collection for such crops [5,6]. The local administration conducts an annual assessment of the cultivated area, employing household visits, field measurements, and traditional instruments like leather rulers. In recent years, the advancement of remote sensing technology has facilitated the utilization of remote sensing for the acquisition of agricultural data. Consequently, agricultural remote sensing has emerged as the primary method for gathering crop-related information. Satellite remote sensing images have a lot of information in them, cover a lot of ground, obtain data quickly, have a lot of spectral bands, and have a lot of spectral information. They have been used a lot in research to help identify plant types and keep an eye on large areas of vegetation. Additionally, these images offer an efficient means of acquiring data on maize planting areas [7]. Recently, researchers from all over the world and in higher education institutions have been working hard on precise target-feature extraction in order to meet the higher accuracy standards needed in real-world applications. Notably, the integration of hyperspectral technology and machine learning methods has yielded substantial advancements in this field. The classification methods of support vector machine (SVM), Maximum Likelihood Classification (MLC), random forest (RF), K-Nearest Neighbor (KNN), and Decision Tree (DT) have been demonstrated to effectively distinguish various plant types in remote sensing data [8,9]. Virnodkar et al. [10] employed the random forest and support vector machine classification methods to categorize seven distinct classes, including sugarcane, maize, bare land, and buildings. This classification was based on the analysis of the Normalized Difference Vegetation Index (NDVI) and Sentinel-2 remotely sensed data. Findings from the study showed that random forest and support vector machine classification methods can be used to sort data from Sentinel-2 remote sensing into different groups. KwaK et al. [11] explored the viability of utilizing texture information derived from the Gray Level Co-occurrence Matrix (GLCM) in the classification of crops. This investigation involved the analysis of time-series photos captured by unmanned aerial vehicles (UAVs) and the application of machine learning classifiers. The findings indicate that using texture information can result in a 7.72% enhancement in the accuracy of categorization. Böhler et al. [12] employed an unmanned aerial vehicle (UAV) platform to capture uncalibrated, small-scale photos of agricultural land in the Swiss Plateau region. These images were subsequently identified using textural characteristics and random forest classification techniques. The findings indicated that the total accuracy reached a value of 66.7% while employing pixel-level crop classification. In the scenario involving the consolidation of a combined group of crops, the overall average (OA) experienced a 7% increase. Lee et al. [13] employed support vector machine and random forest classification algorithms to categorize UAV remote sensing photos. The findings indicated that the support vector machine achieved a producer accuracy of 81.68%, while the random forest algorithm achieved a higher producer accuracy of 96.58%. Previous research has demonstrated that random forests exhibit strong performance in the classification of crops [10,14,15,16].
Google Earth Engine (GEE) is a web-based platform that facilitates geospatial analysis on a global level. It offers a wide range of remote sensing datasets and robust computing capabilities, allowing for users to effectively store, process, and analyze Earth observation data. The GEE platform has the capability to store data at the Pb-level, which is a unit of computer storage. This enables researchers to process many images simultaneously in parallel activities, resulting in a notable enhancement in the efficiency of image processing [17]. GEE has been applied to geospatial mapping at various scales, such as rice distribution mapping [18], fallow land mapping [19], tidal flats mapping [14], and land cover mapping [20]. C-band Sentinel-2 is considered the most promising radar data for crop classification because of its medium temporal and spatial resolution and is freely available to the public [21].
Choosing the right method depends on a number of factors, such as the size of the training set, the number of dimensions in the feature space, the presence of correlated features, and the chance of overfitting [22]. Once these concerns have been resolved, the algorithm can be determined. Therefore, in the majority of classification studies, random forest (RF) and support vector machine (SVM) are commonly acknowledged as the leading classifiers due to their ability to achieve a high accuracy [23]. One great thing about the support vector machine (SVM) method for classification is that it can work well with datasets that have a lot of attributes, even if only a few examples are used for training [24]. Support vector machine (SVM) classification methods do have some problems, though. The training and testing phases of the algorithm are not very good, and there are limits on speed and size when choosing kernel function parameters [25]. Random forests are a new and beneficial classification method that only needs two parameters to be set when making a predictive model: the number of decision trees that are formed (t) and the number of input features that are taken into account when each node of the decision tree is split up (m) [26]. Empirical evidence suggests that the model’s generalization error approaches a limit as the number of trees in the random forest increases indefinitely. Hence, the issue of overtraining is deemed inconsequential [27]. However, reducing the size of m has the effect of decreasing the inter-tree correlation, but at the cost of diminishing the predictive capability of an individual tree. Enhancing the depth of an individual tree amplifies its predictive capacity and concurrently augments the connection among trees [28].
Traditional approaches for growth monitoring involve obtaining measurements through field measurement techniques. The process of manually observing crop growth is characterized by its labor-intensive nature, inefficiency, and the need for a significant level of experience and agricultural knowledge on the part of the observer. This means that the results of manual monitoring methods are very subjective, which means that they are not good for countries like China that have complicated terrains and a lot of crops spread out. Instead, remote sensing methods are better for keeping an eye on the physiological and biochemical conditions of crops and guessing how much food they produce because they are quick, accurate, and do not damage the plants. Since the 1980s, foreign scholars have been at the forefront of initiating research on agricultural growth monitoring through the use of remote sensing technology. Using Landsat data with a high temporal resolution, Crist et al. [29] created a vegetation index growth curve for crops. This showed how the crops were growing. In their study, Schneider et al. [30] employed National Oceanic and Atmospheric Administration (NOAA) data to observe the growing conditions of crops. They highlighted that multi-temporal NDVI data has the ability to indicate several aspects related to crop productivity. In particular, they stressed how important the cumulative NDVI value is as a key indicator for predicting biological output. The utilization of NDVI data enables the inverse analysis of covariates that indicate crop productivity. Among these covariates, the cumulative NDVI value plays a crucial role in forecasting biological output. A study conducted by Tappan et al. [31] used the greenness vegetation index to look at how crops were growing after a locust disaster in the Sahel region of Africa. The parties involved acknowledged the early identification of the impending tragedy relating to food scarcity. Dalezios et al. [32] conducted a study using the Advanced Very High Resolution Radiometer NDVI (AVHRR-NDVI) to see how well the vegetation index recession model could be used to track the growth of cash crops. The researchers also confirmed the effectiveness of NDVI in monitoring the growth and estimating the yearly yield of cotton. Hill et al. [33] used a quantitative growth indicator called Time-integrated NDVI (TINDVI) to look at time-series curves made from AVHRR-NDVI data from more than one year. Their study aimed to elucidate the various sensitivity responses of crop yields to precipitation in the context of western Australia. Sakamoto et al. [34] conducted a study attempting to find a strong linear link between WDRVI values in maize during the silking stage and the final grain yield. This examination was carried out at both the field and regional levels across many states in the United States. To monitor the growth progress, the researchers utilized MODIS-WDRV as an indicator. At present, there is a limited body of research that integrates cloud platforms and machine learning techniques to extract maize data at the city level. When it comes to the extraction of crop area and monitoring of growth, a majority of studies have opted for the utilization of MODIS image data for analysis and monitoring purposes. However, the limited spatial resolution of MODIS data remains a challenge in the application of remote sensing technology for yield prediction. This limitation has a detrimental effect on the accuracy of prediction results [35]. In the context of MODIS multiday composite picture data, it is observed that the resulting images exhibit a combination of diverse features.
This study utilized the Google Earth Engine platform to investigate the Huinong District of Shizuishan City located in the Ningxia Hui Autonomous Region. The focus of the study was to analyze crop data pertaining to the Sentinel-2 image data, which had a resolution of 10 m. Machine learning algorithms were employed to accurately identify and extract the maize planting areas within the Huinong District from 2017 to 2021. Simultaneously, the integration of MODIS image data was employed to observe and assess the growth of maize in Huinong District between April and September 2021. This approach capitalizes on the temporal resolution and frequent revisit rate of MODIS, which enable the accurate recording of crop growth stages. The methodology presented in this research study demonstrates a high level of precision in extracting maize in Huinong District. Additionally, it enables the monitoring of maize development at a high frequency. Consequently, this methodology can serve as a valuable scientific foundation for local governments and agricultural departments, aiding in the organization and guidance of agricultural activities. Using remote sensing monitoring data on crop growth and development at the local level, agricultural production managers can change how crops are managed in their own areas. This enables agricultural decision-makers and extension workers to enhance their communication with local farmers by utilizing remote sensing monitoring maps of crops.

2. Materials and Methods

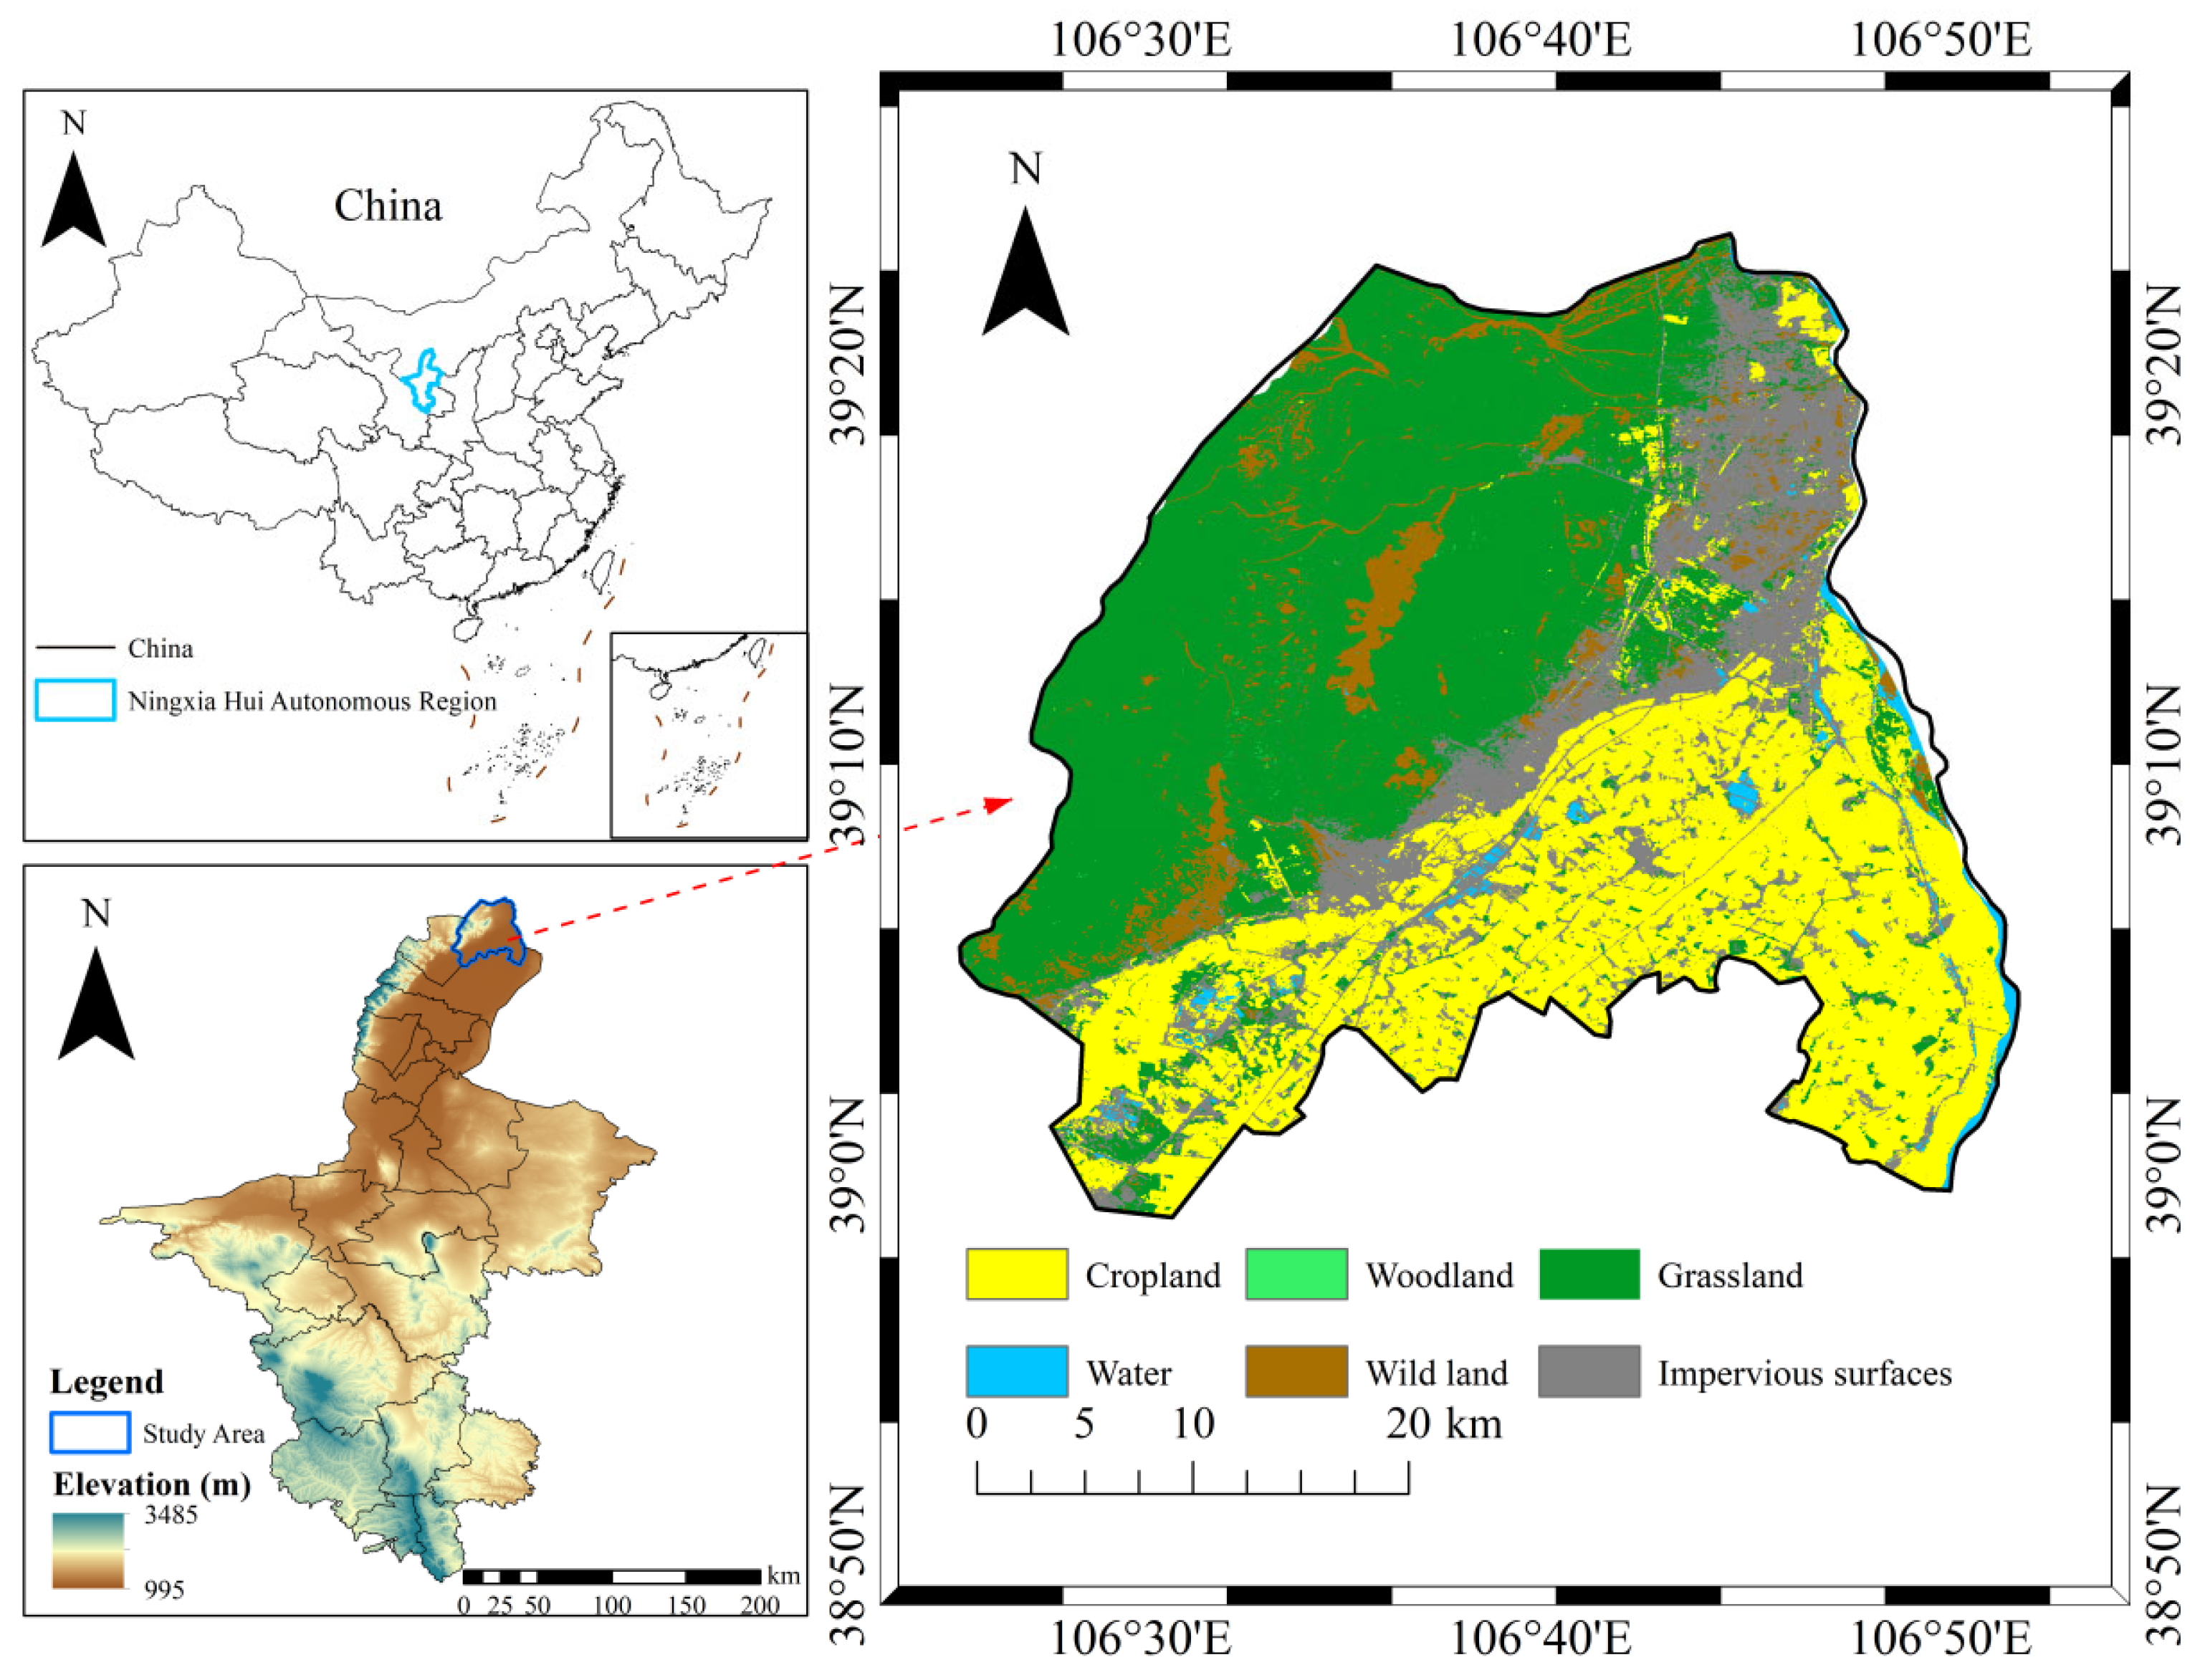
2.1. Study Area and Data Sources

2.1.1. Overview of the Study Area

The Huinong District, situated at coordinates 39.2 °N and 106.8 °E, is geographically positioned inside the Ningxia Hui Autonomous Region. The district’s geomorphology has three distinct units, including the hilly land of Helan Mountain, the tilted plains subject to flooding, and the impact plains shaped by the Yellow River. The area exhibits a temperate continental climate characterized by ample sunlight and warmth, notable diurnal temperature fluctuations, rapid springtime warming, the absence of excessive heat during the summer, cool autumnal weather, and the absence of severe cold in the winter. The region experiences concentrated rainfall throughout the year, a short frost-free period, and intense evaporation, and holds significant importance as a key city inside the yellow economic zone in Ningxia. The mean annual temperature ranges from 8.7 to 10.1 degrees Celsius, while the average annual precipitation ranges from 172.6 to 187.1 millimeters. The sunshine hours range from 2812 to 3049 hours, and the duration of the frost-free period spans from 153 to 208 days. The geographical region in question is characterized by a typical temperate continental climate, commonly seen in arid and semi-arid areas [36].
The region has a cultivated area of 592.47 km2, with 77.33 km2 of registered cultivated land and 173.33 km2 of actual cultivated land. The 607.03 km2 of reclaimed wasteland, mainly on hillsides and riverbanks, are open and flat, which makes it easy for large-scale development and utilization (Figure 1).

2.1.2. Overview and Pre-Processing of Remotely Sensed Image Data

The main data source for this study was Sentinel-2 and MODIS remote sensing image data, which were accessed from the GEE cloud platform. These images were used to find the cultivated area of maize and track its growth in Huinong District, Shizuishan City. The Sentinel-2 mission has two satellites, namely, Sentinel-2A and Sentinel-2B, which are identical in nature. However, it is worth noting that there exists a slight disparity in the spectral widths of Sentinel-2A and Sentinel-2B. The resolution of each band exhibits variation. There is a lot of information about the Sentinel-2 satellite band in Table 1. It has the band name, the center wavelength, the bandwidth, the resolution, and the signal-to-noise ratio. By deploying two satellites, the constellation is able to achieve a revisit time of five days for any given point on the Earth’s surface. At an altitude of 786 km, every satellite is equipped with a Multispectral Instrument (MSI) that captures photographs of the Earth. These images have a resolution of up to 10 meters per pixel and cover a field of view spanning 290 kilometers. The MSI operates throughout thirteen bands, encompassing both the visible and infrared spectrums [37]. The MOD09 product is a surface reflectance dataset derived from the Moderate Resolution Imaging Spectroradiometer (MODIS). It has a temporal resolution of 1 day and a spatial resolution of 250 m. In general, the Sentinel-2 satellite has a very high level of geometric positioning accuracy and data quality, which enables scientists make accurate observations for the purpose of identifying crops. The MODIS sensor exhibits a notable temporal resolution that enables the continuous monitoring of maize growth.
The selection of the imagery period was based on the growth cycle of maize in order to enhance the availability of images, as depicted in Table 2. The use of QA60 band tagging enabled the acquisition of cloud-free Sentinel-2 remote sensing imagery. This approach facilitated the retrieval of images that exhibited a cloud content of less than 30%.
To enhance the legibility of remote sensing images, it is imperative to engage in preprocessing of the image data. This preprocessing encompasses various techniques such as image fusion, image mosaicing, image cropping, radiometric calibration, atmospheric correction, image enhancement, de-clouding, and shading processing, as well as projection transformation. As per the provided description on the GEE platform, the product grade of Sentinel-2 remote sensing image data encompasses two levels: 1C and 2A. The 2A level data, in particular, show the bottom reflectance values that have been corrected for atmospheric conditions and could be used directly in this study. Consequently, the product level of the Sentinel-2 data utilized in this study was Level-2A.

2.2. Research Methodology

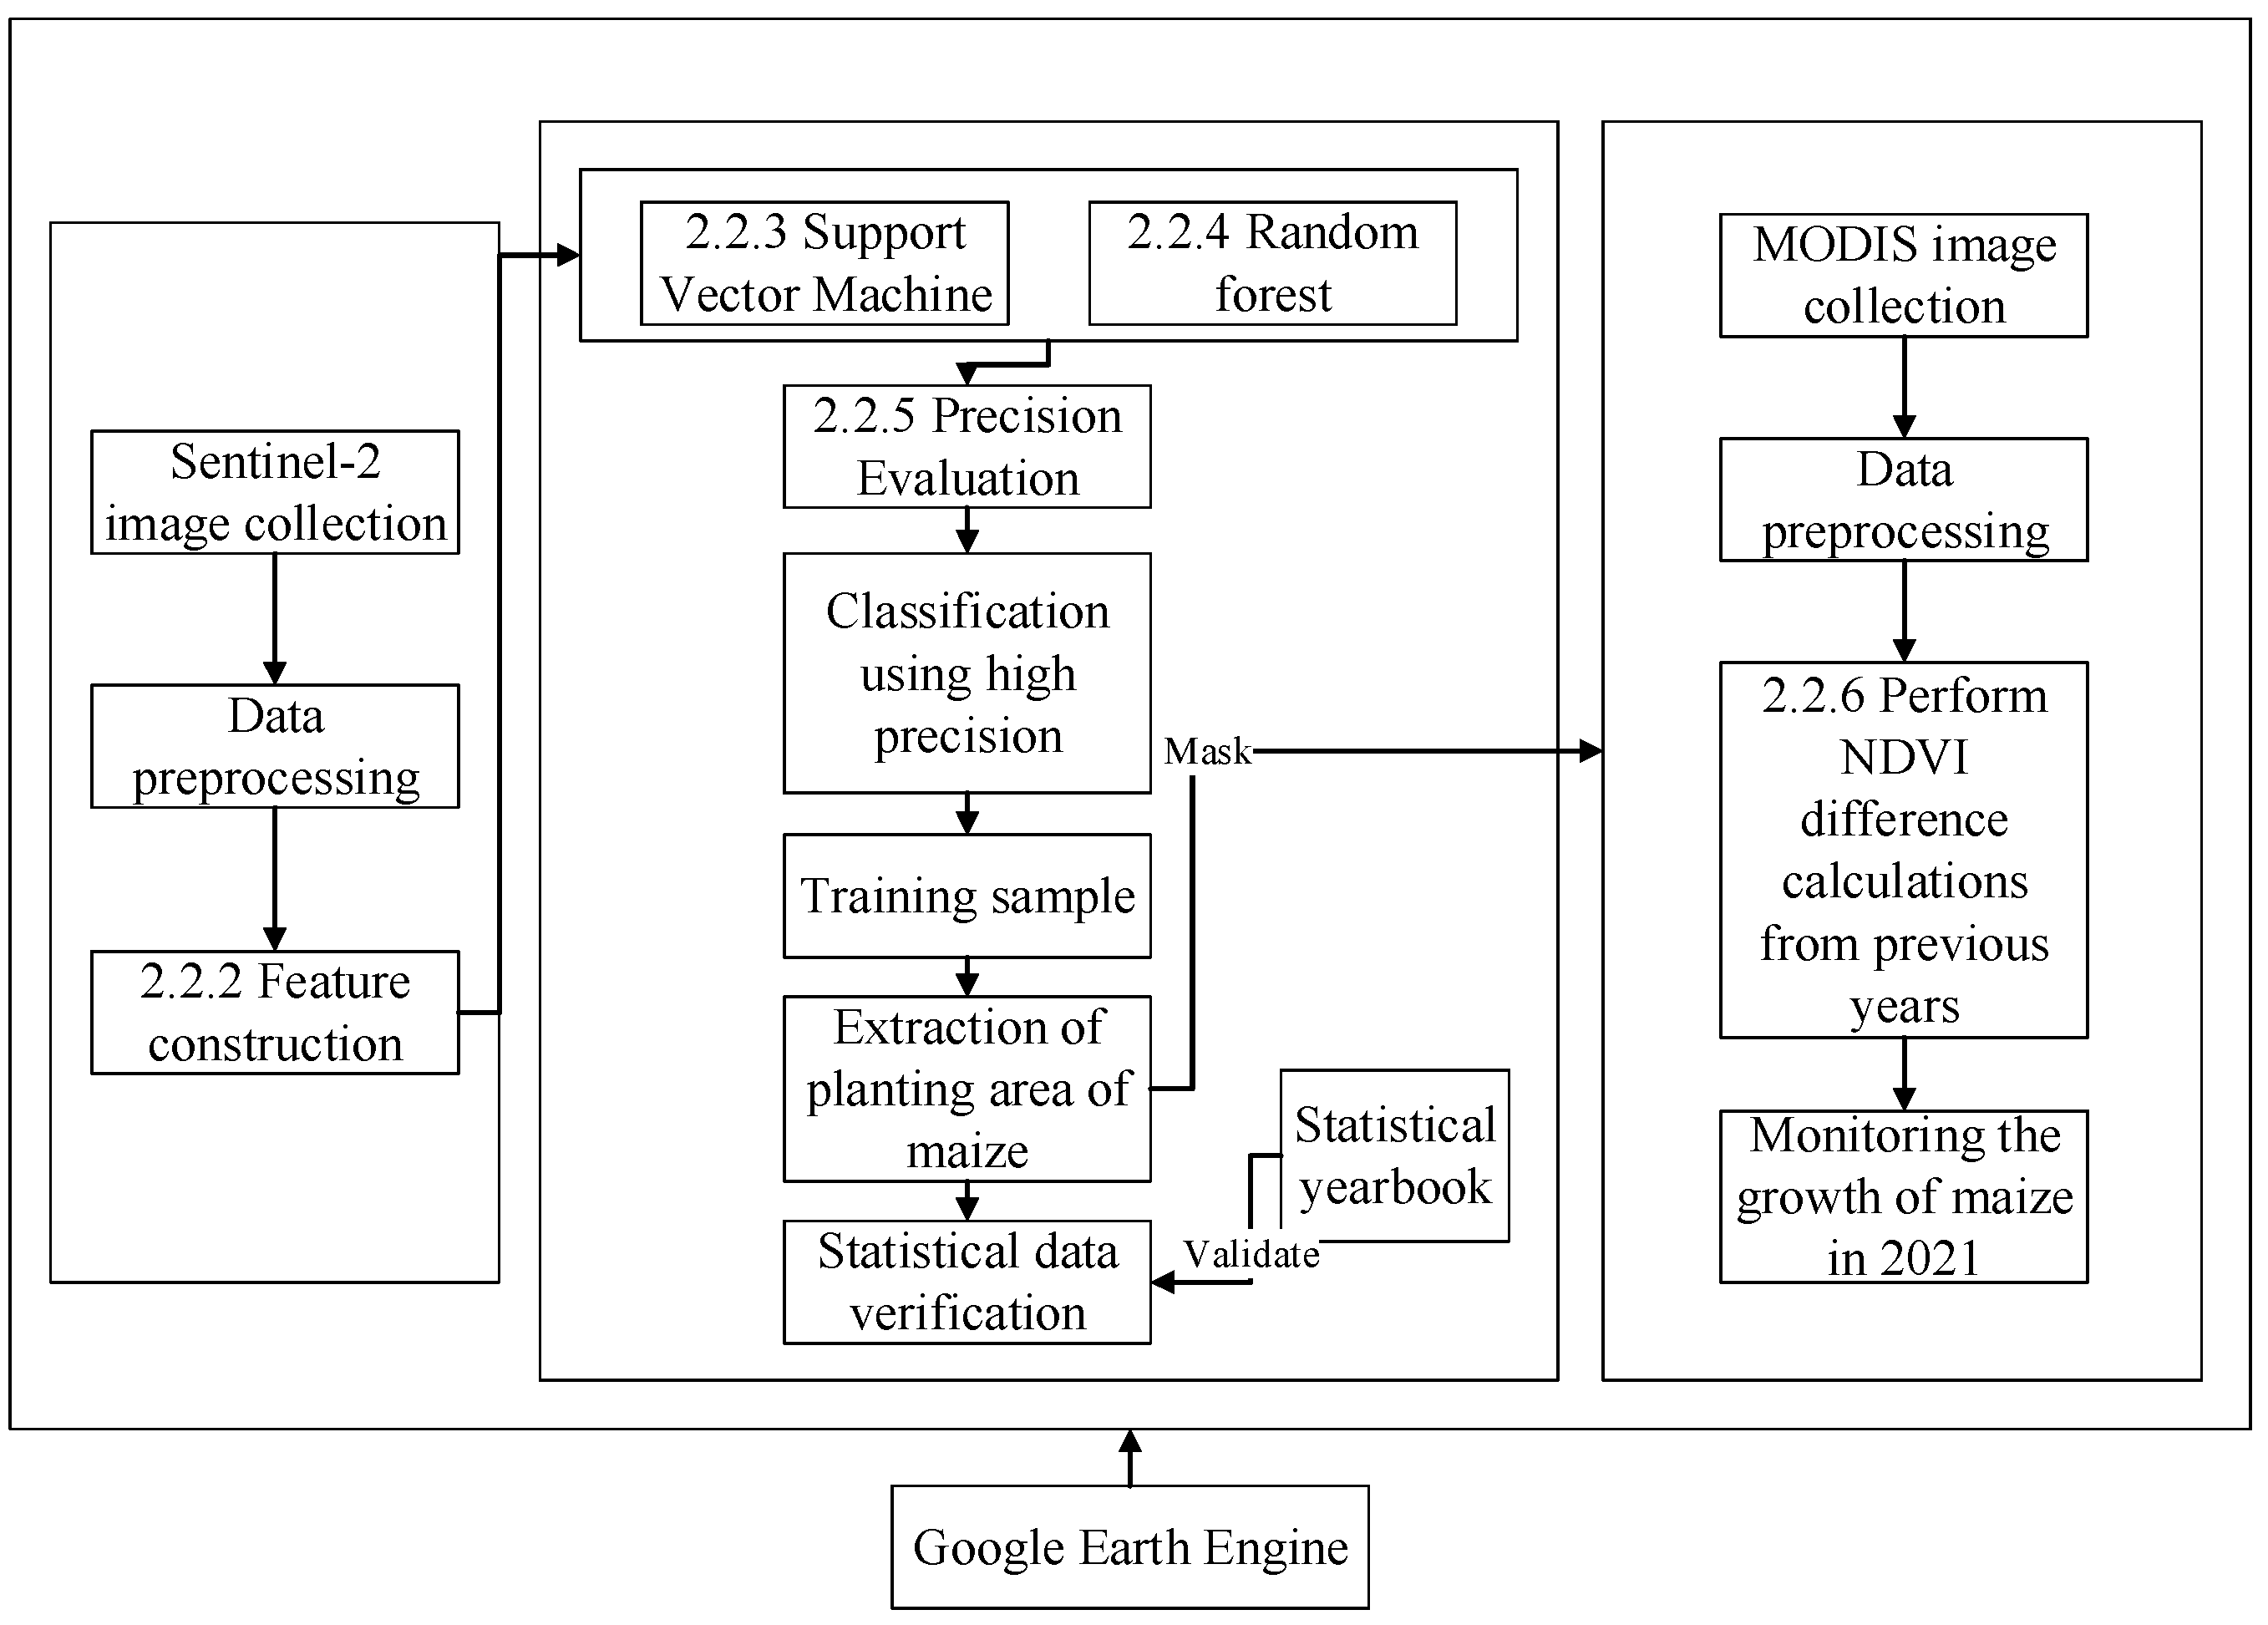
2.2.1. Technical Processes

This study employed Sentinel-2A picture data from the Google Earth Engine (GEE) cloud platform to conduct a classification analysis. The data were put into groups using the support vector machine and the random forest classification methods. The accuracy of the groups was then compared. The algorithm with superior classification accuracy was chosen to extract and compute the corn planting area in Huinong District, spanning the years 2017 to 2021. The Normalized Difference Vegetation Index (NDVI) was then calculated. The NDVI difference was found using MODIS image data from May to September 2021 in the study area. Employing the method of comparing the same time period, the NDVI value of 2021 was contrasted with the NDVI value of the corresponding period in the years 2017–2020, enabling frequent monitoring of corn growth from May to September 2021. The step-by-step procedure is depicted in Figure 2.

2.2.2. Training Sample Construction

The dataset utilized in this study was derived from field observations, with data points specifically selected and gathered using the Google Earth Engine (GEE) platform. The dataset samples serve as the foundation for the supervised categorization of remote-sensing photos. The caliber of the sample points affects the accuracy of supervised classification. Sample points of high quality have the potential to greatly enhance classification accuracy. In the present study, a total of 593 sample points were gathered, followed by the creation of six distinct levels. The sample point names and corresponding response attributes were subsequently entered into these layers. Of the total, there were 110 built-up areas, 81 water bodies, 129 sections of bare ground, 100 roadways, 82 regions designated for maize planting, and 91 mountainous places. The selected training samples and their corresponding descriptions for this classification task are presented in Table 3.

2.2.3. Support Vector Machine Classification Methods

In 1992, Vapnik and his colleagues created support vector machine (SVM). Subsequently, this technique was included in the field of machine learning, where it has emerged as a crucial tool for data mining and machine learning applications.
Historically, traditional machine learning algorithms have struggled to effectively handle non-linear problems. However, the support vector machine (SVM) addresses this limitation by including the concept of kernel mapping. This method makes it easier to move data from a space with fewer dimensions to one with more dimensions. This enables the SVM to perform well in non-linear classification tasks [38]. The theory of support vector machines possesses numerous vital features. Firstly, it effectively addresses the issue of limited training samples. Secondly, it successfully tackles the classification problem in high-dimensional, nonlinear scenarios.
When encountering a situation that cannot be effectively categorized using linear methods, the data are classified by determining a hyperplane for the picture or other classification and using this hyperplane to classify the data. The objective is to maximize the classification interval between the data points [39].
Support vector machine (SVM) exhibit exceptional classification capabilities. However, in practical scenarios, numerous instances are linearly inseparable. To fix this problem, a kernel function is added that changes the data into a higher-dimensional space. This makes it possible to separate the data in a linear way, which fixes the issue [40]. In addition, different combinations of penalty parameters C and polynomial kernel parameters V into parameters (C, V) will achieve different classification results. This study adopted the SVM cross-validation algorithm to optimize the parameters to achieve a high accuracy so that the classifier can correctly predict the unknown data [41].
Cross-validation divides the training data into two parts; one part is utilized for training and the other for testing. If you divide the training data into k equal-sized pieces, one of them is used as the training set and the other k-1 pieces are used as the test set. Then, each piece of data is trained one at a time, and the accuracy of cross-validation is the percentage of correctly categorized data. There were fivefold cross-validation methods used in this study to find the best values for the SVM classifier’s penalty parameter C and its polynomial kernel parameter V. Thirty percent of the labeled samples were used as training samples to find the maize area.

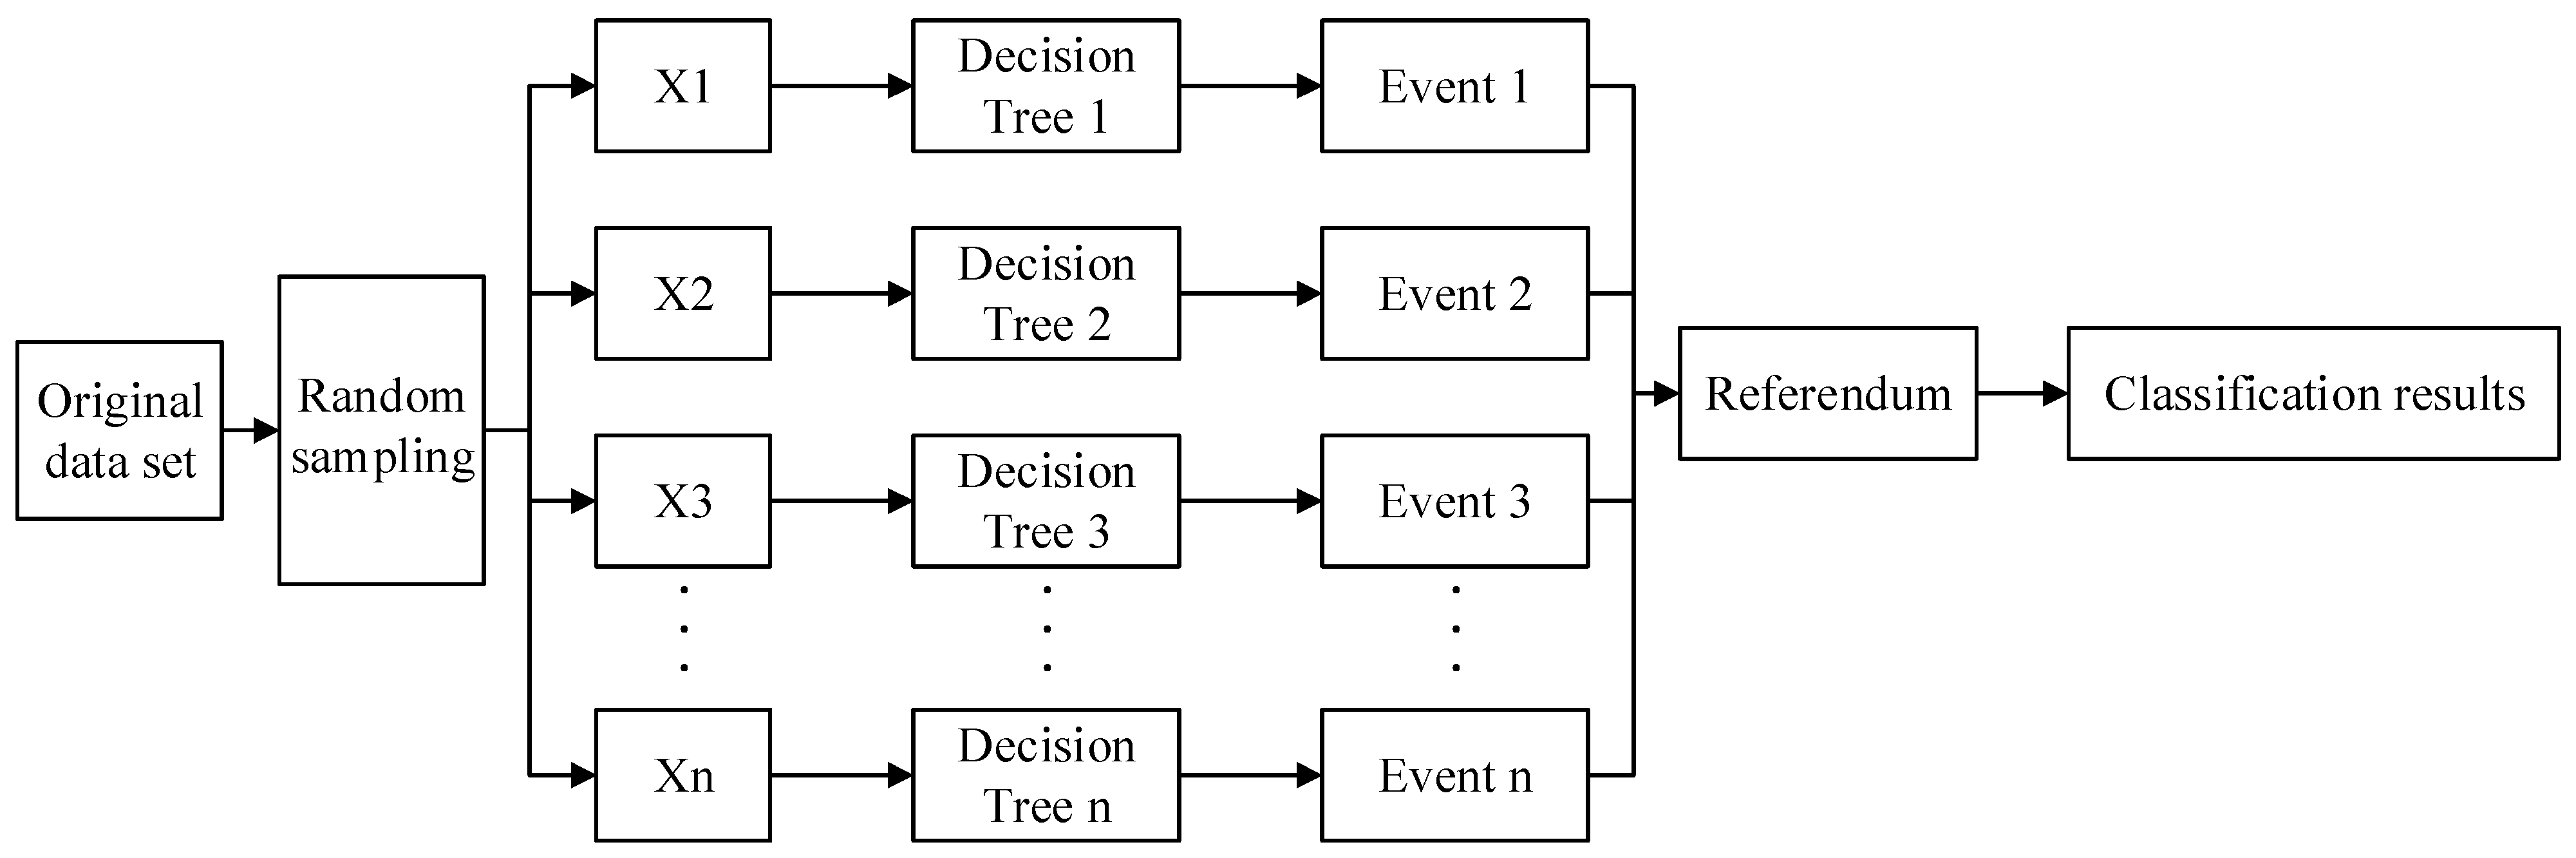
2.2.4. Random Forest Classification Methods

Random forest was first proposed in 2001 as an algorithm that uses a decision tree as the basic unit to assemble multiple decision trees [42,43]. It can handle input samples with high-dimensional features and is insensitive to overfitting [44]. The random forest algorithm can handle input samples with multi-dimensional features and does not require dimensionality reduction, can obtain an unbiased estimate of the internal generation error during the generation process, and obtains good results for the standard problem without much parameter debugging [45].
The random forest algorithm is presently an extensively employed technique in the field of machine learning, specifically within the domain of supervised classification. The overall progression of the method is illustrated in Figure 3. The random forest algorithm is widely utilized in the field of remote sensing for tasks such as picture classification and feature optimization. This is mostly owing to its numerous advantages, which include a quick training speed, reduced danger of overfitting, and its ability to effectively handle diverse datasets [46].
Random forest builds an unbiased error estimate by randomly resampling the data and feature variables and constructing multiple CART decision trees, which have good noise immunity for crop area extraction and are widely used in agricultural mapping research [47,48].

2.2.5. Validation Methods

The results of the maize extraction in Huinong District were proven to be correct by comparing the data on the maize area with real-world data and statistical yearbooks. The classification results of various machine learning classification methods were evaluated using quantitative statistics. Ground validation points were used to establish a confusion matrix, which was then utilized to calculate Overall Accuracy (OA, %), Producer Accuracy (PA, %), User Accuracy (UA, %), and the Kappa coefficient [20]. The Overall Accuracy refers to the proportion of pixels acquired throughout the categorization process compared to the total number of pixels involved. The formula is derived from the calculation of Equation (1). The Producer Accuracy refers to the likelihood that the ground truth reference data for a specific category are accurately classified within a given classification. The formula is computed using Equation (2). The percentage of test points correctly classified within a particular category on the classification map serves as the indicator of User Accuracy. Equation (3) is a representation of this calculation. There are two kinds of consistencies that Kappa coefficients look at: the agreement between the sampling and the reference classification and the agreement between the automatic classification and the reference data. The Kappa coefficient is categorized into five distinct groups to denote varying degrees of consistency: 0.0 to 0.20 represents a very low level, 0.21 to 0.40 indicates an average level, 0.41 to 0.60 signifies a moderate level, 0.61 to 0.80 denotes a high level, and 0.81 to 1.00 represents an almost perfect level of consistency. The calculation formula is presented in Equation (4).
O A = i = 1 n P i i N × 100 %
P A = P i i P + i × 100 %
U A = P i i P i + × 100 %
K a p p a = N × i = 1 n P i i i = 1 n ( P i + × P + i ) N 2 i = 1 n ( P i + × P + i )
where n is the total number of columns in the confusion matrix, which is the total number of categories; N represents the total number of samples used for precision assessment; Pii represents the number of samples in row i and column i of the confusion matrix; P+i represents the total number of samples in column i; Pi+ represents the total number of samples in row i.

2.2.6. Maize Growth Information Extraction

Following the selection of the classification method that yielded higher accuracy, the maize sown area inside the study area was determined. Subsequently, a mask representing the maize sown area in the study region was generated, and the mask area was estimated by integrating the MODIS image data. In order to maintain the integrity of data and mitigate the impact of cloud cover. This work focused on the processing of MODIS data. The re-projection of the image depicting the maize growing season in Huinong District from 2017 to 2021 was conducted based on the Sentinel2 image projection. Subsequently, the image data were amalgamated using the maximum Normalized Difference Vegetation Index (NDVI), followed by the use of the NDVI difference model [49] to assess the growth patterns of maize throughout the 2021 growing season in comparison to the same time frame in prior years (2017–2020). Equation (5) presents the NDVI difference model.
N D V I n = N D V I 2021 N D V I N 1
where NDVIn is the NDVI difference between 2021 and the same period of previous years, NDVI2021, and NDVIN−1 is the maximum NDVI synthetic image value of 2021 and previous years.

3. Results and Analyses

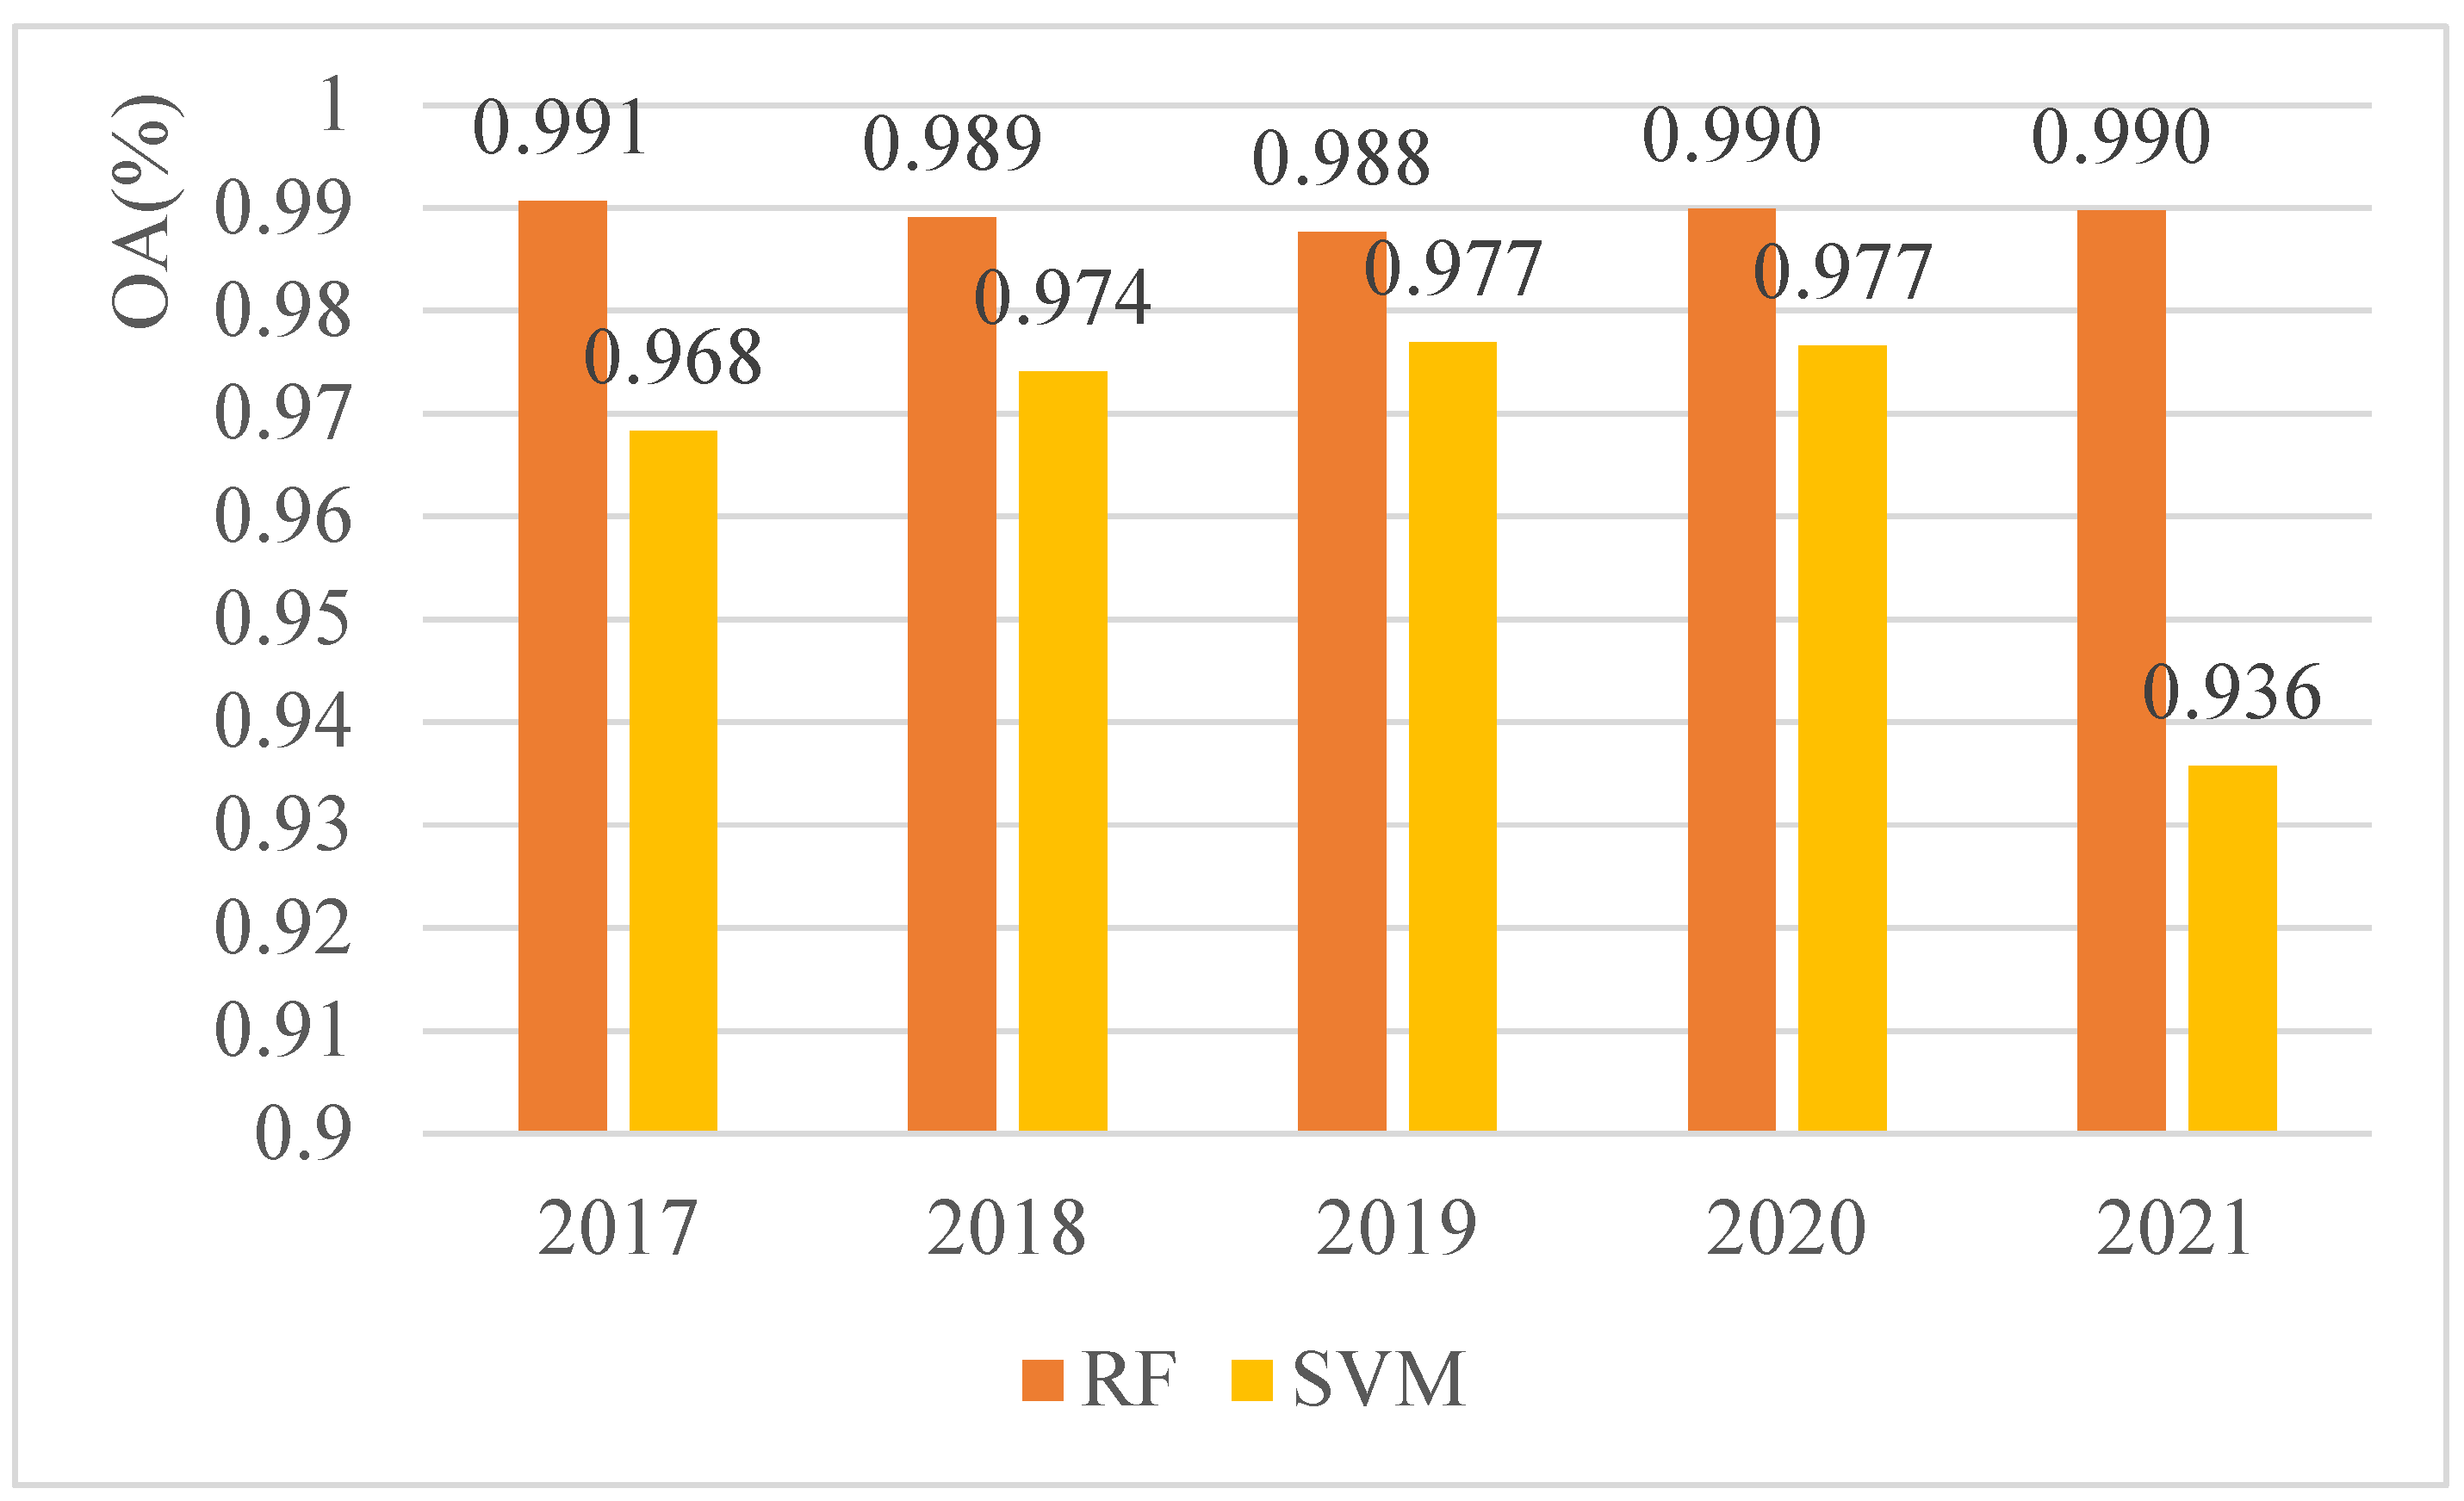
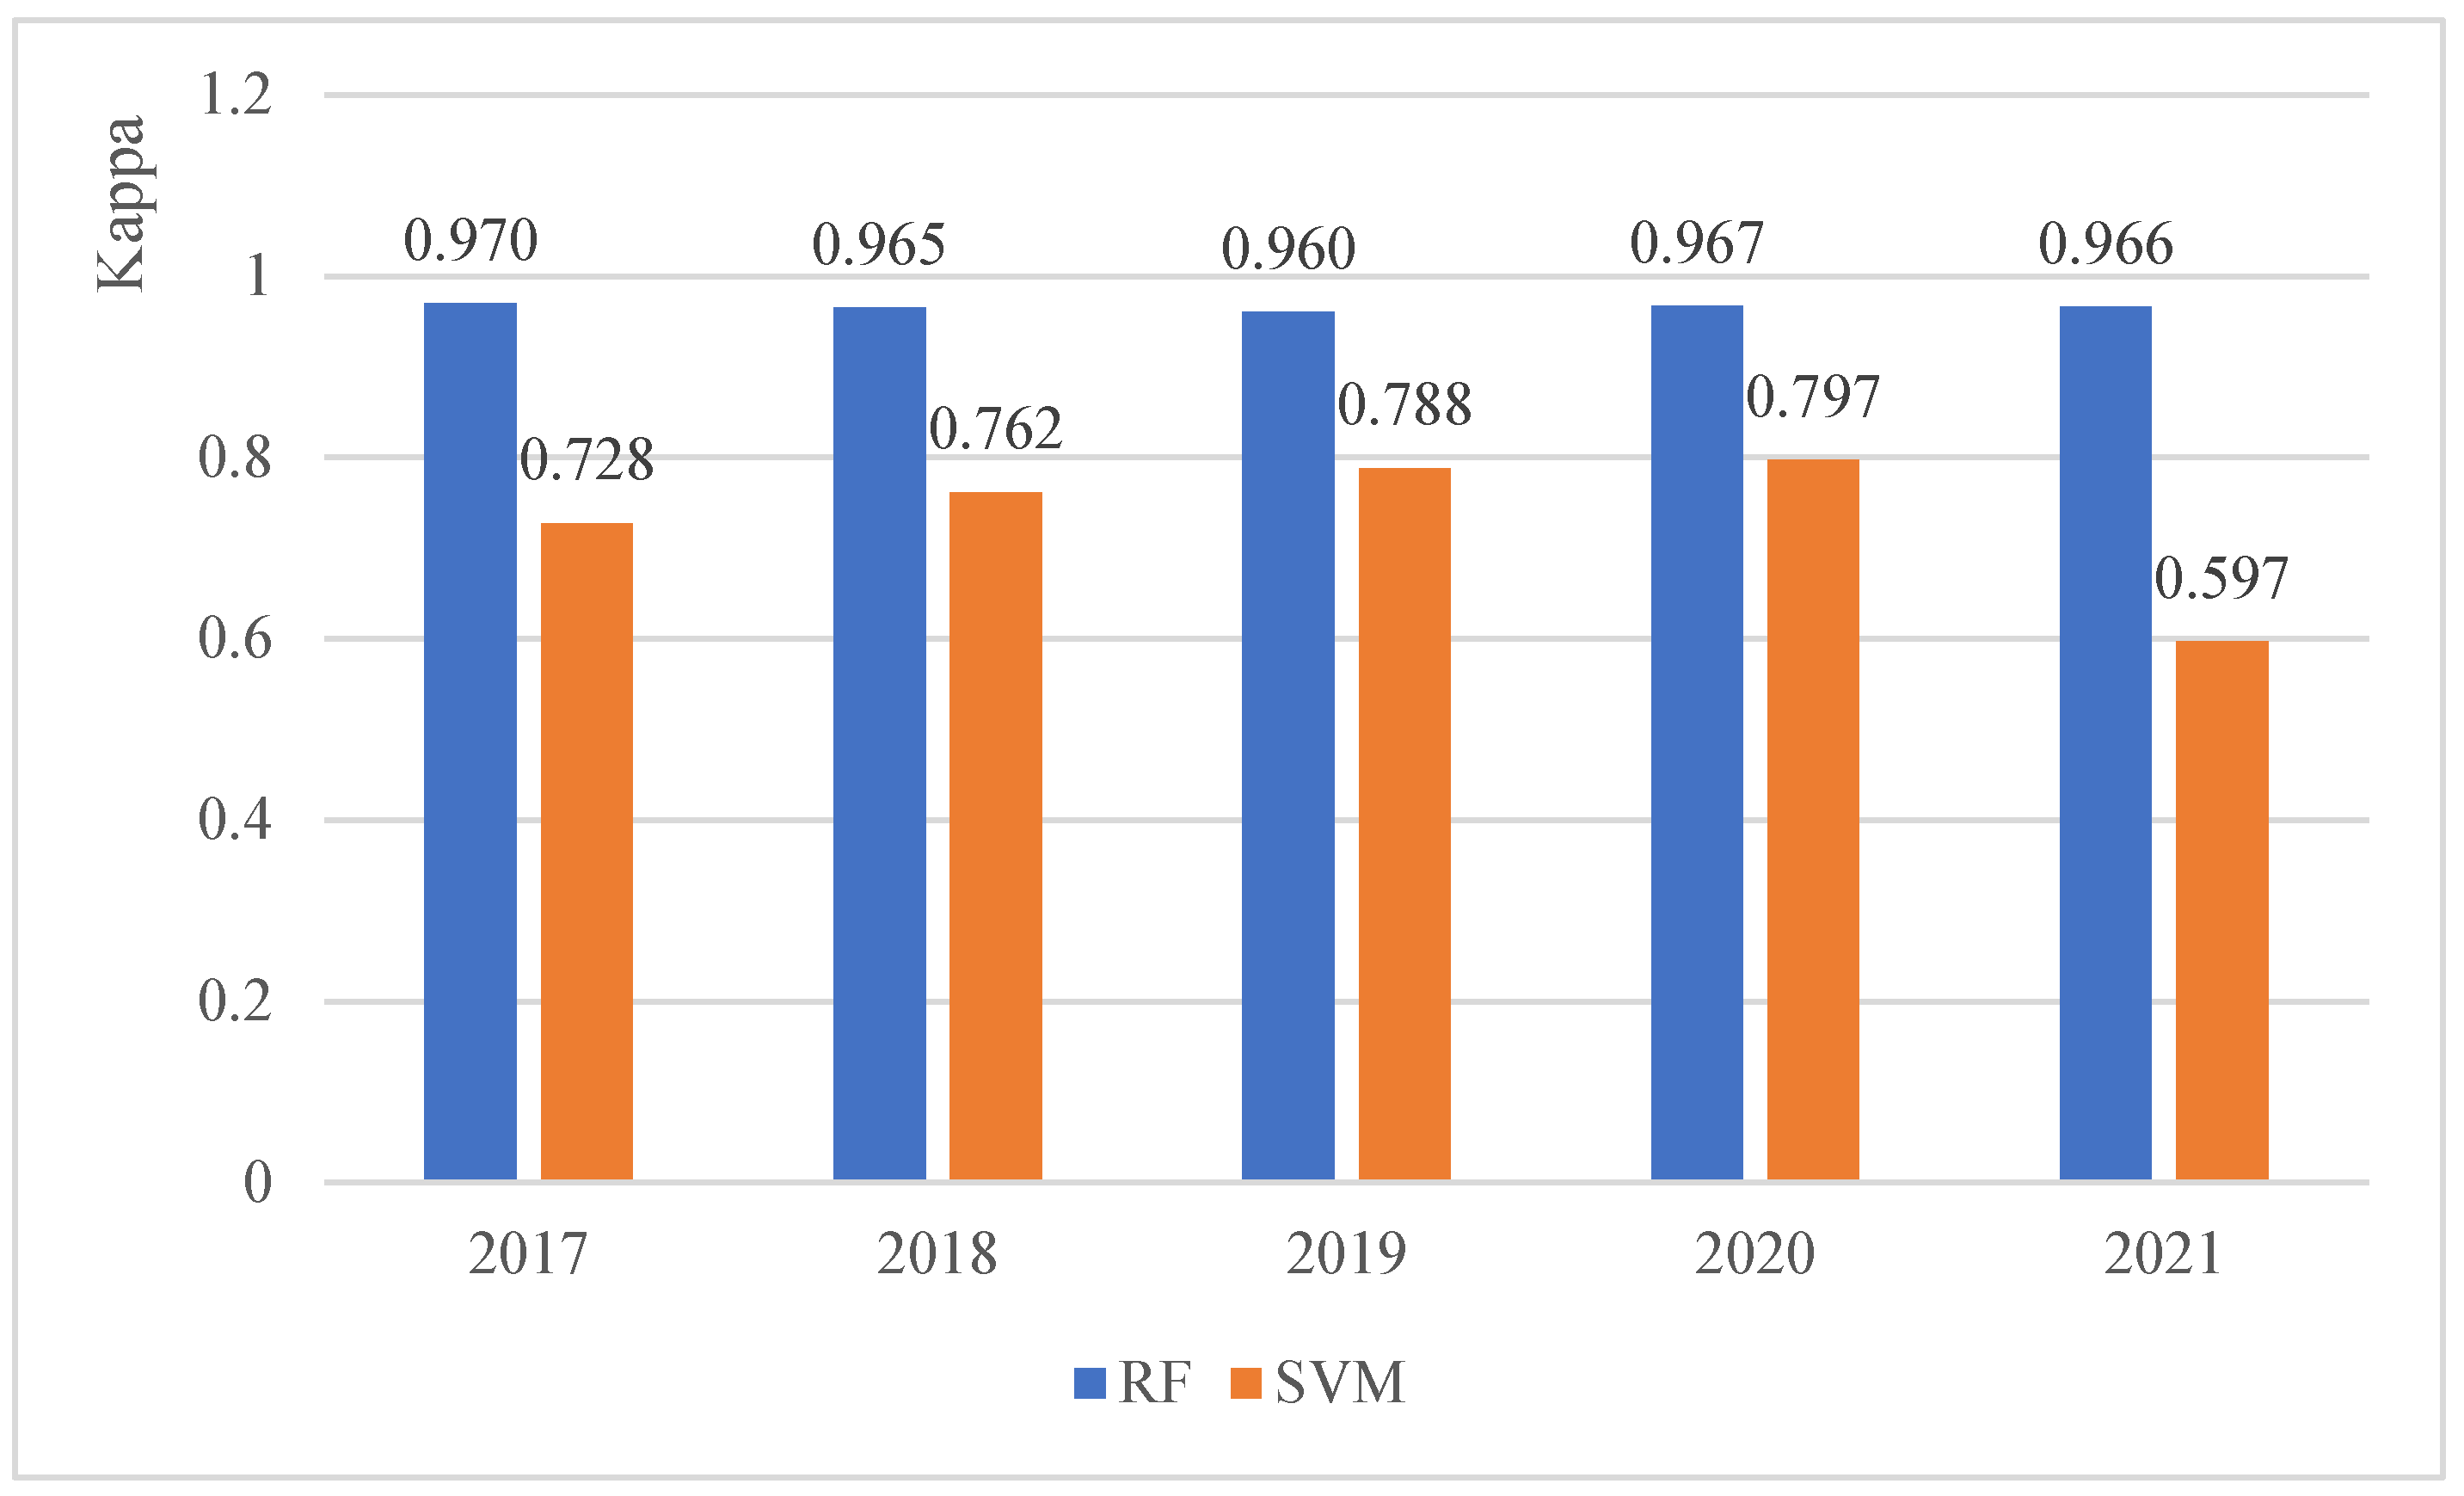
3.1. Comparison of Support Vector Machine and Random Forest Classification Accuracies

The sample point pixels from the study image were picked, and the confusion matrix from the validation samples was used to find the Overall Accuracy, Producer Accuracy, User Accuracy, and Kappa coefficients. The findings are shown Supplementary Information. The metrics of Overall Accuracy and Producer Accuracy were chosen for the purpose of comparison, and their corresponding outcomes are illustrated in Figure 4 and Figure 5, respectively. The findings indicate that the random forest classification approach outperforms the support vector machine (SVM) method. So, in the next study, the results of the classification that comes from combining MODIS images with the random forest method are used to find crop growth.

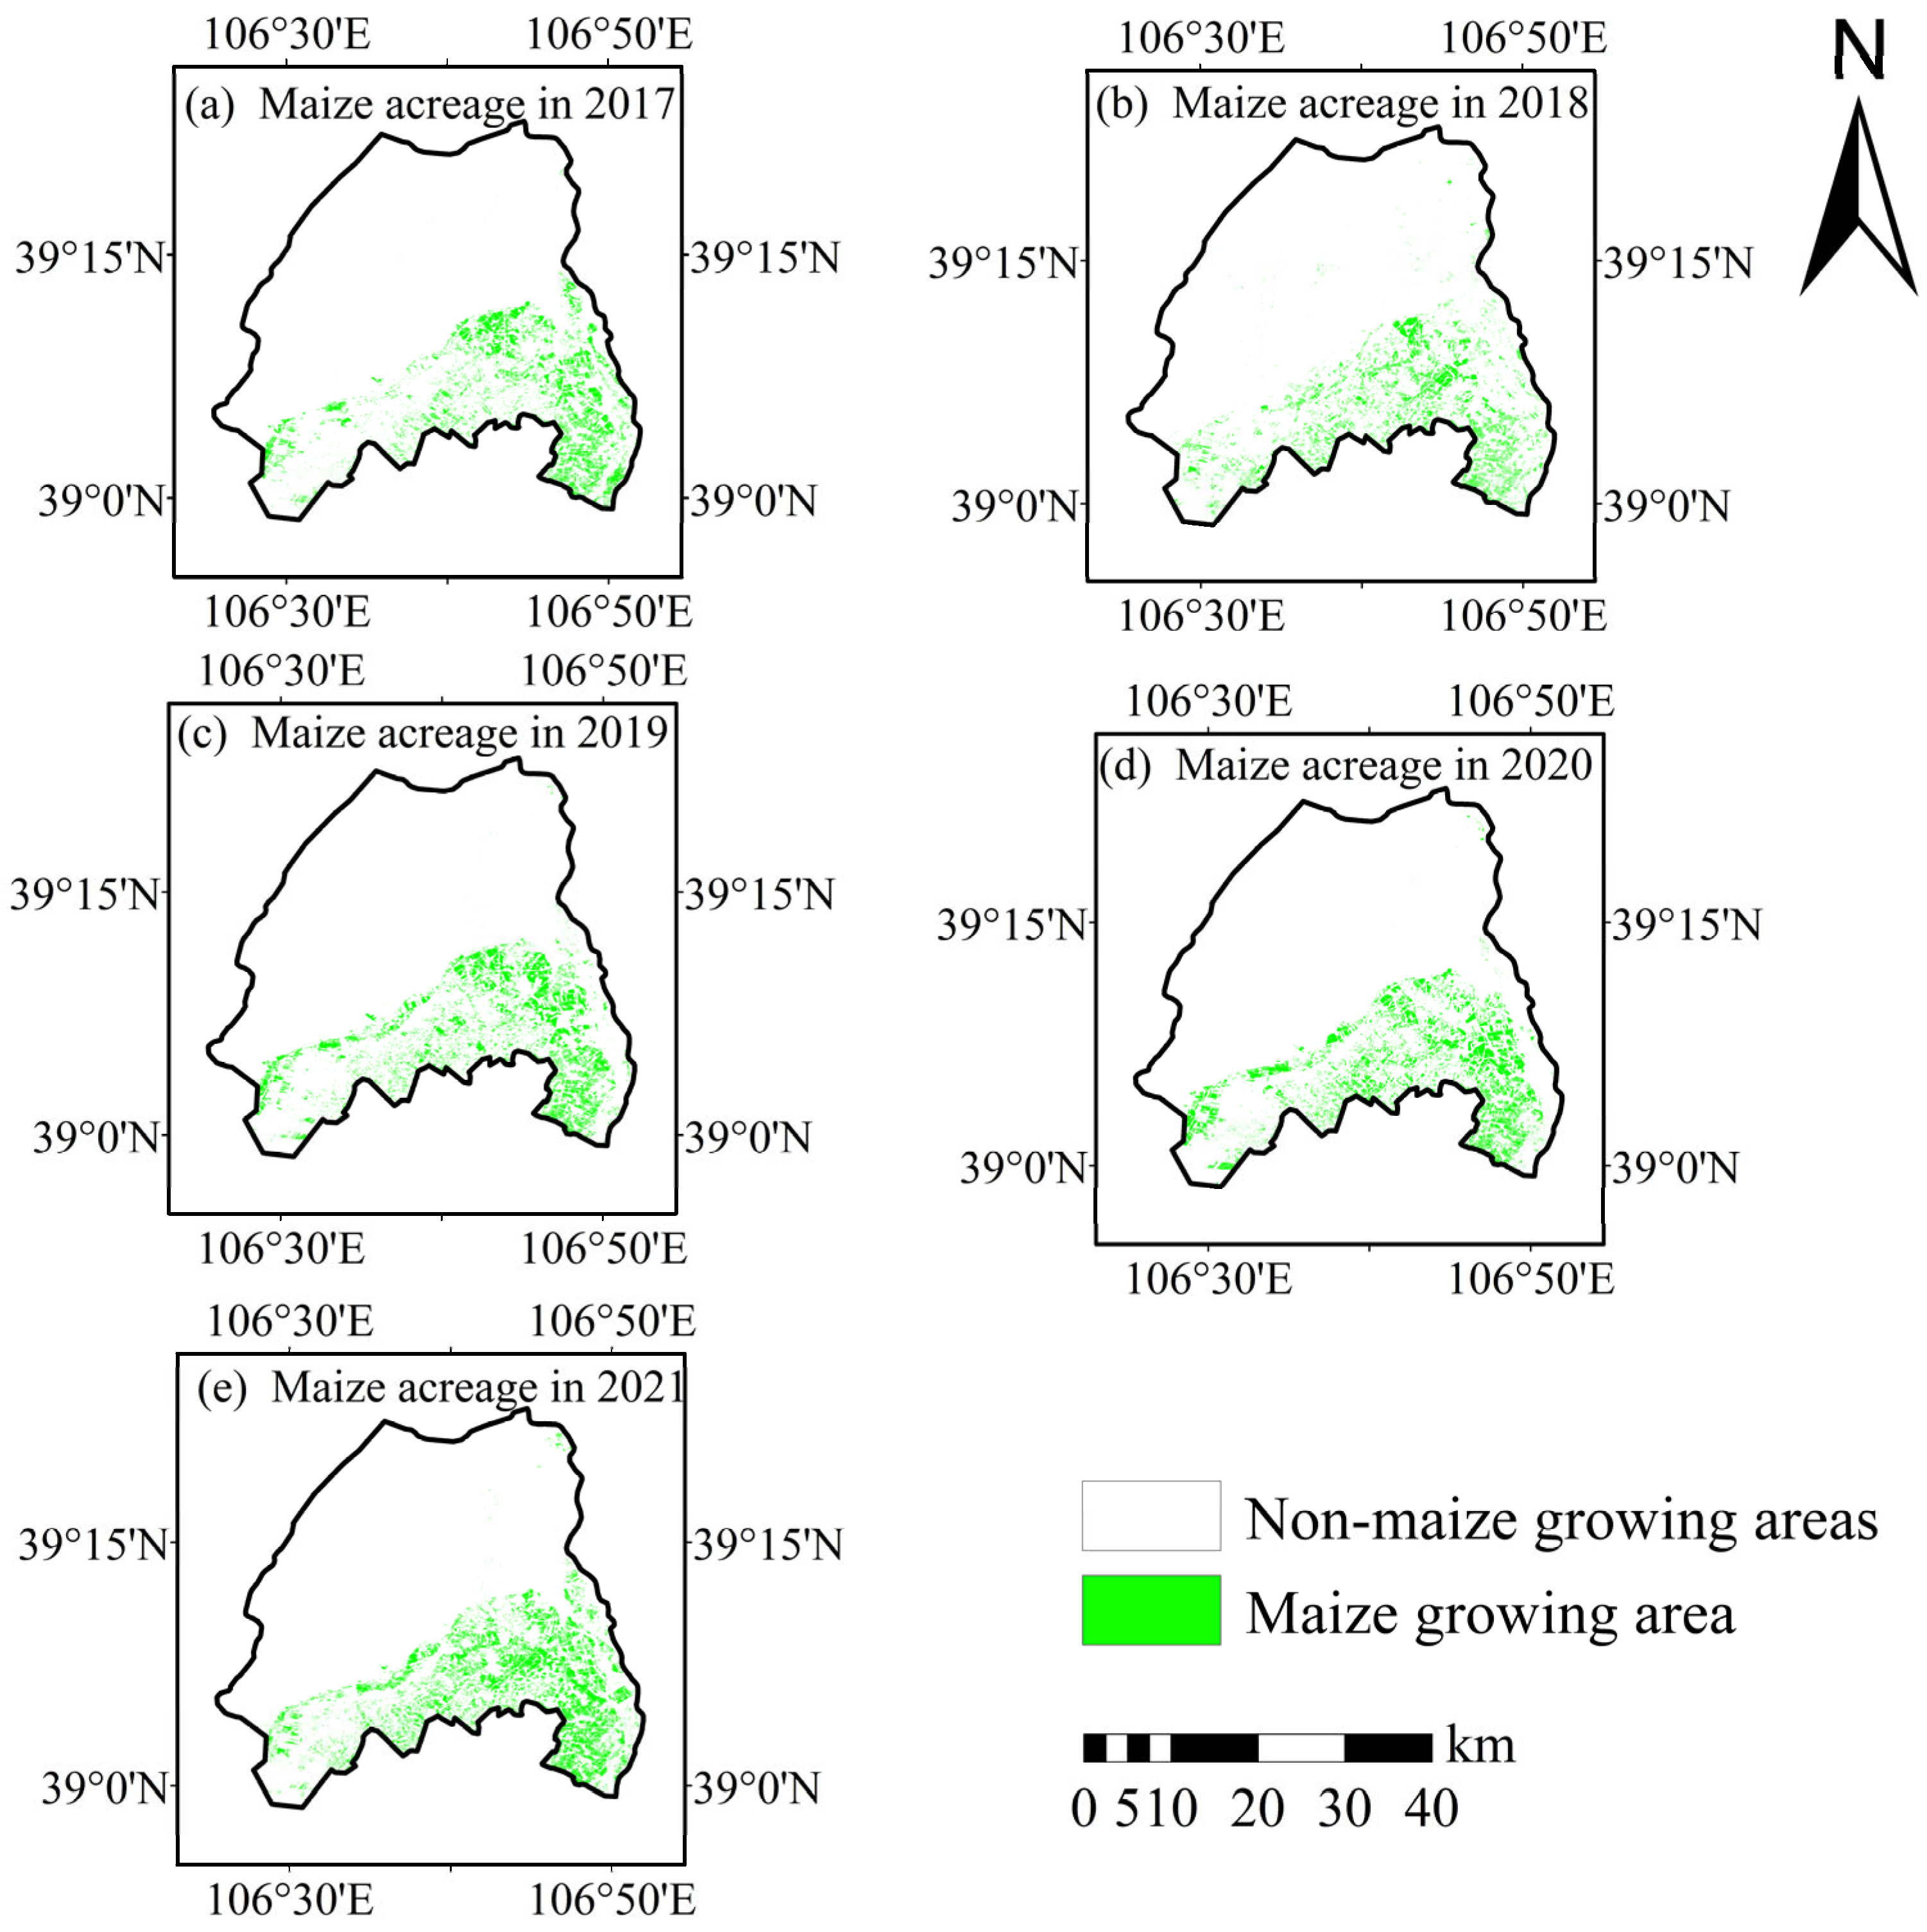
3.2. Area Monitoring Results

The GEE cloud platform was used to create features for Sentinel-2A images, and the random forest classification method was used to find areas in Huinong District where maize could be grown from 2017 to 2021. This approach enables the efficient data pre-processing of remote sensing photos. The researchers were able to efficiently analyze and depict the geographical arrangement of maize cultivation regions inside Huinong District. Figure 6 displays the spatial distribution map of the maize-growing area in Huinong District from 2017 to 2021. The data shown in the figure indicate that the distribution of maize is primarily concentrated in the Yellow River impact plain located in the central and southern regions of Huinong District. Additionally, there are some maize planting places seen along the course of the Yellow River. The western region is characterized by the presence of a steep terrain, primarily attributed to the Helan Mountain range. Consequently, this area exhibits a greater abundance of mountainous hills. On the other hand, the northern region is characterized by a flooded, sloping plain situated on the eastern slopes of Helan Mountain. This particular location is home to numerous industrial parks, resulting in a relatively lower prevalence of maize cultivation. Remote sensing technology has revealed a noticeable increase in the maize sown area in Huinong District, as shown in Table 4. This growth trend aligns with the statistical records on maize cultivation provided by the Bureau of Statistics of the Ningxia Hui Autonomous Region.

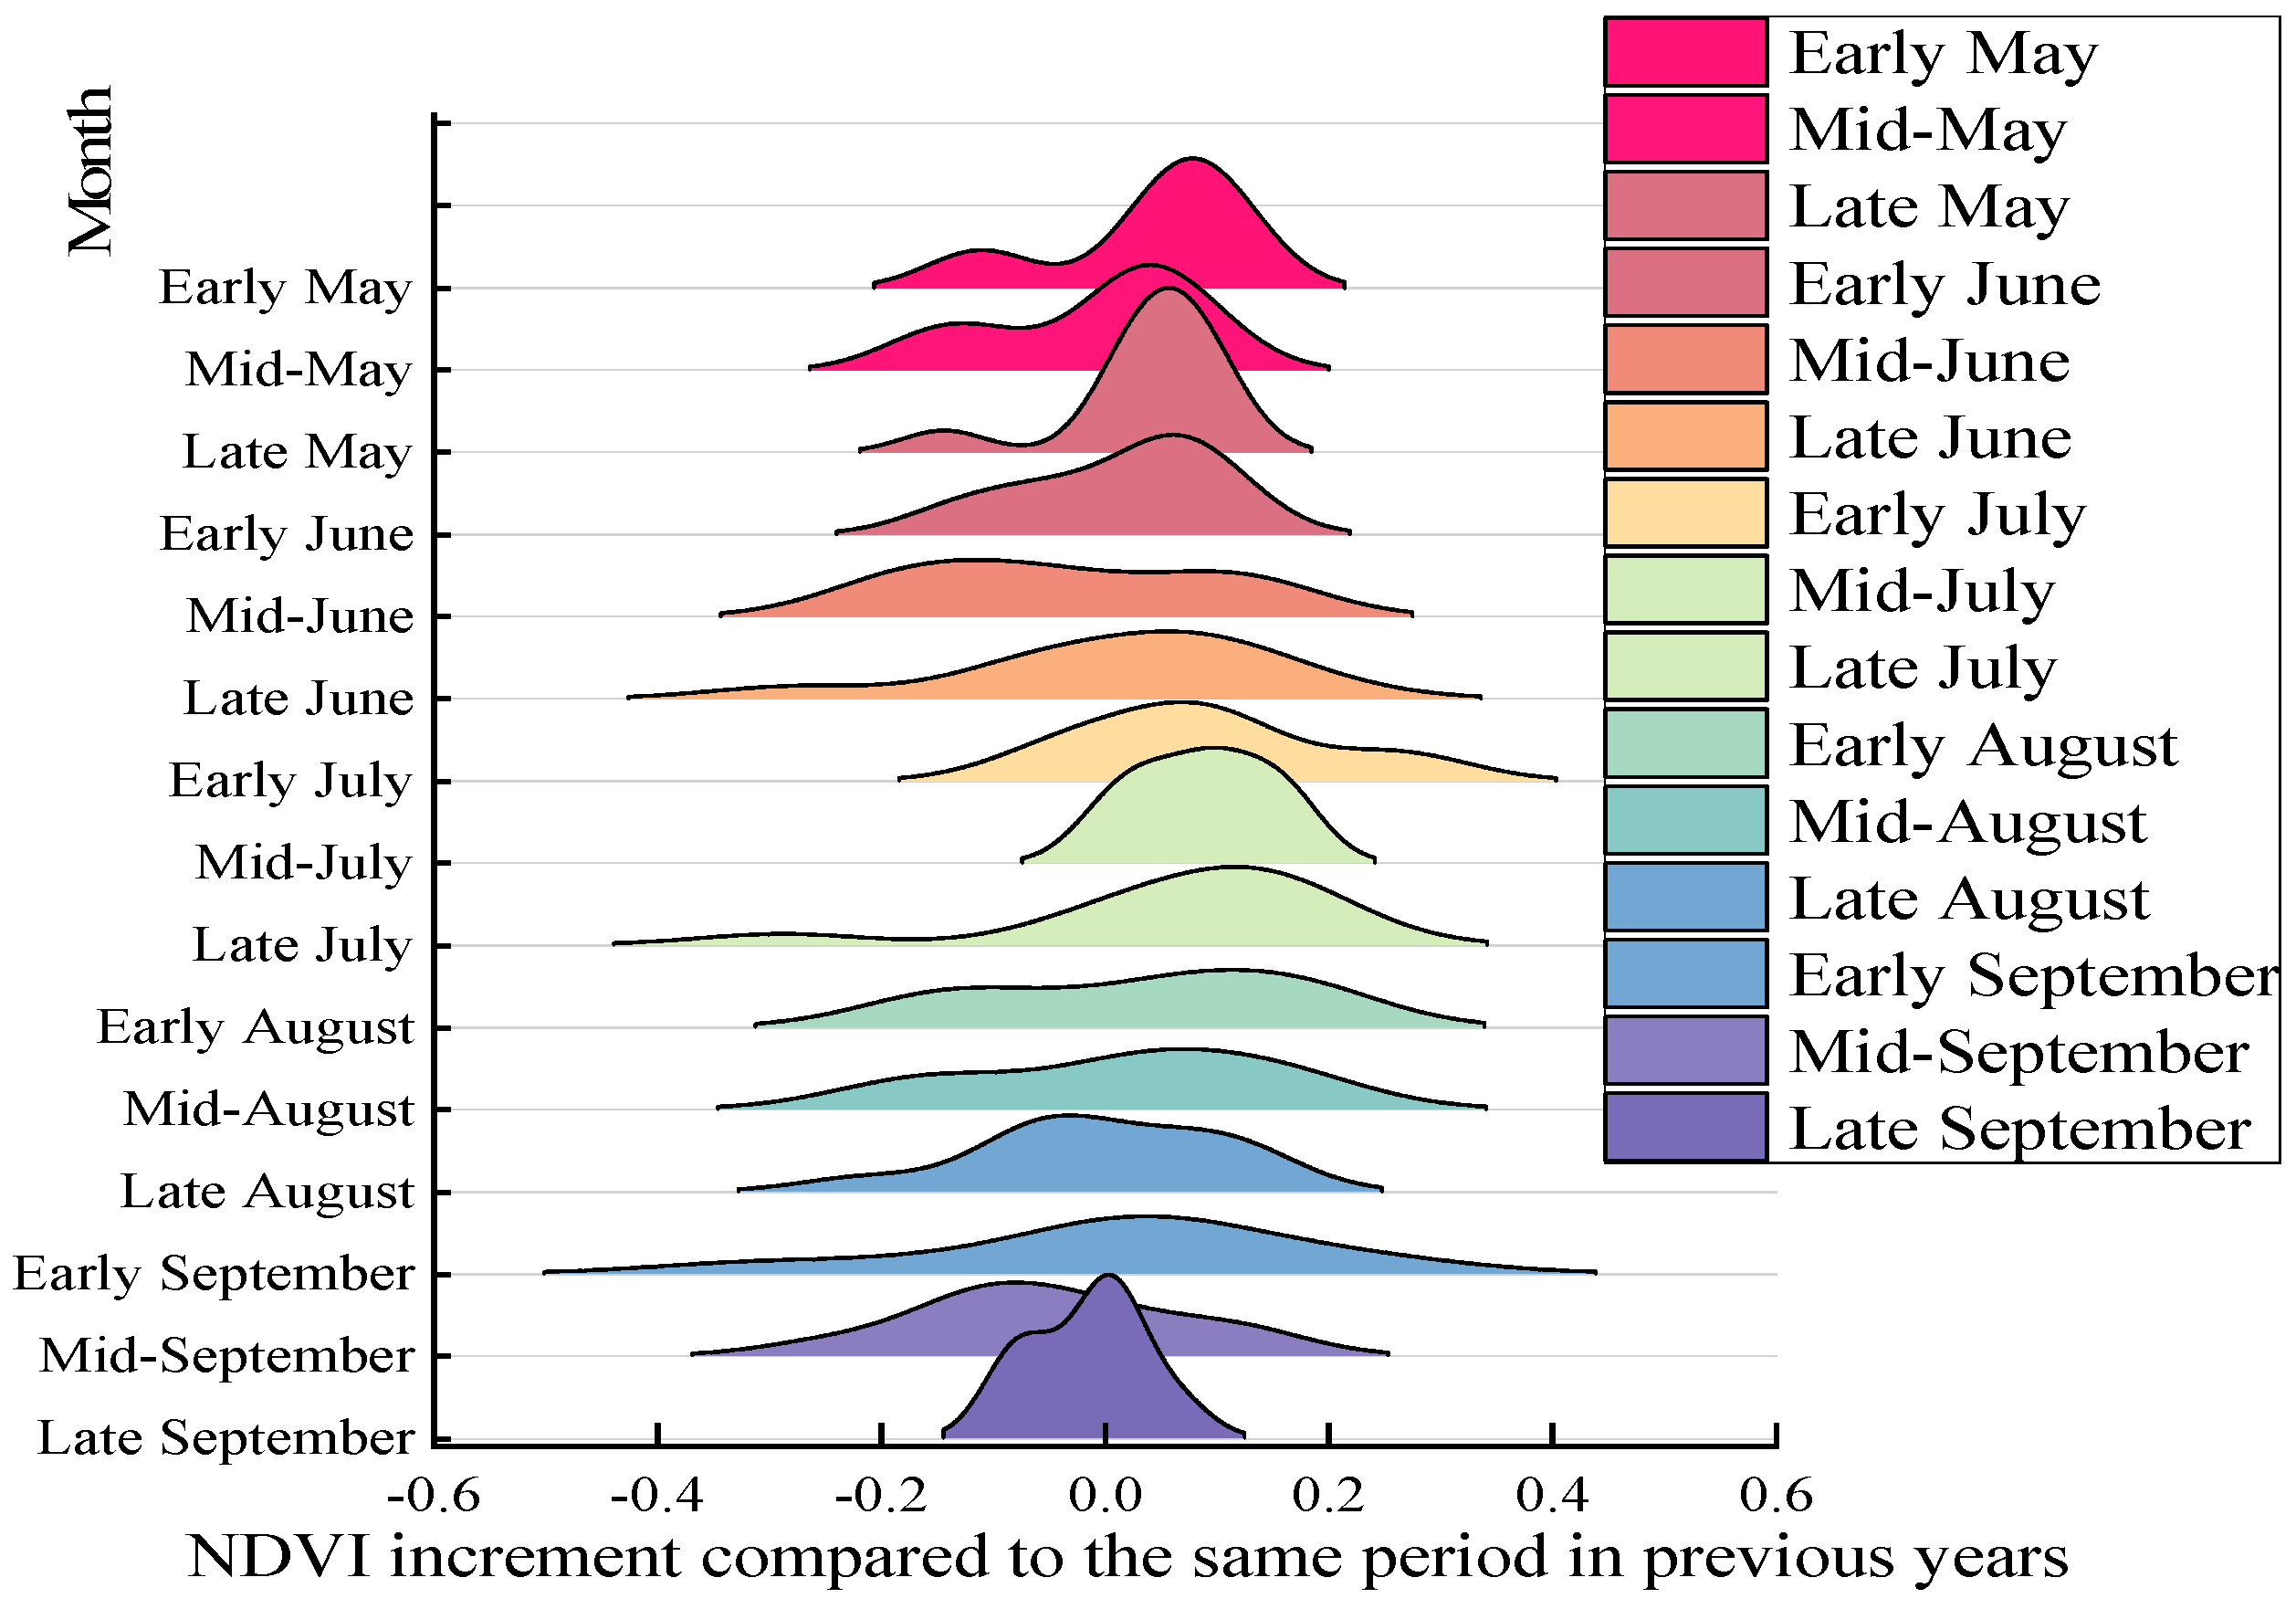
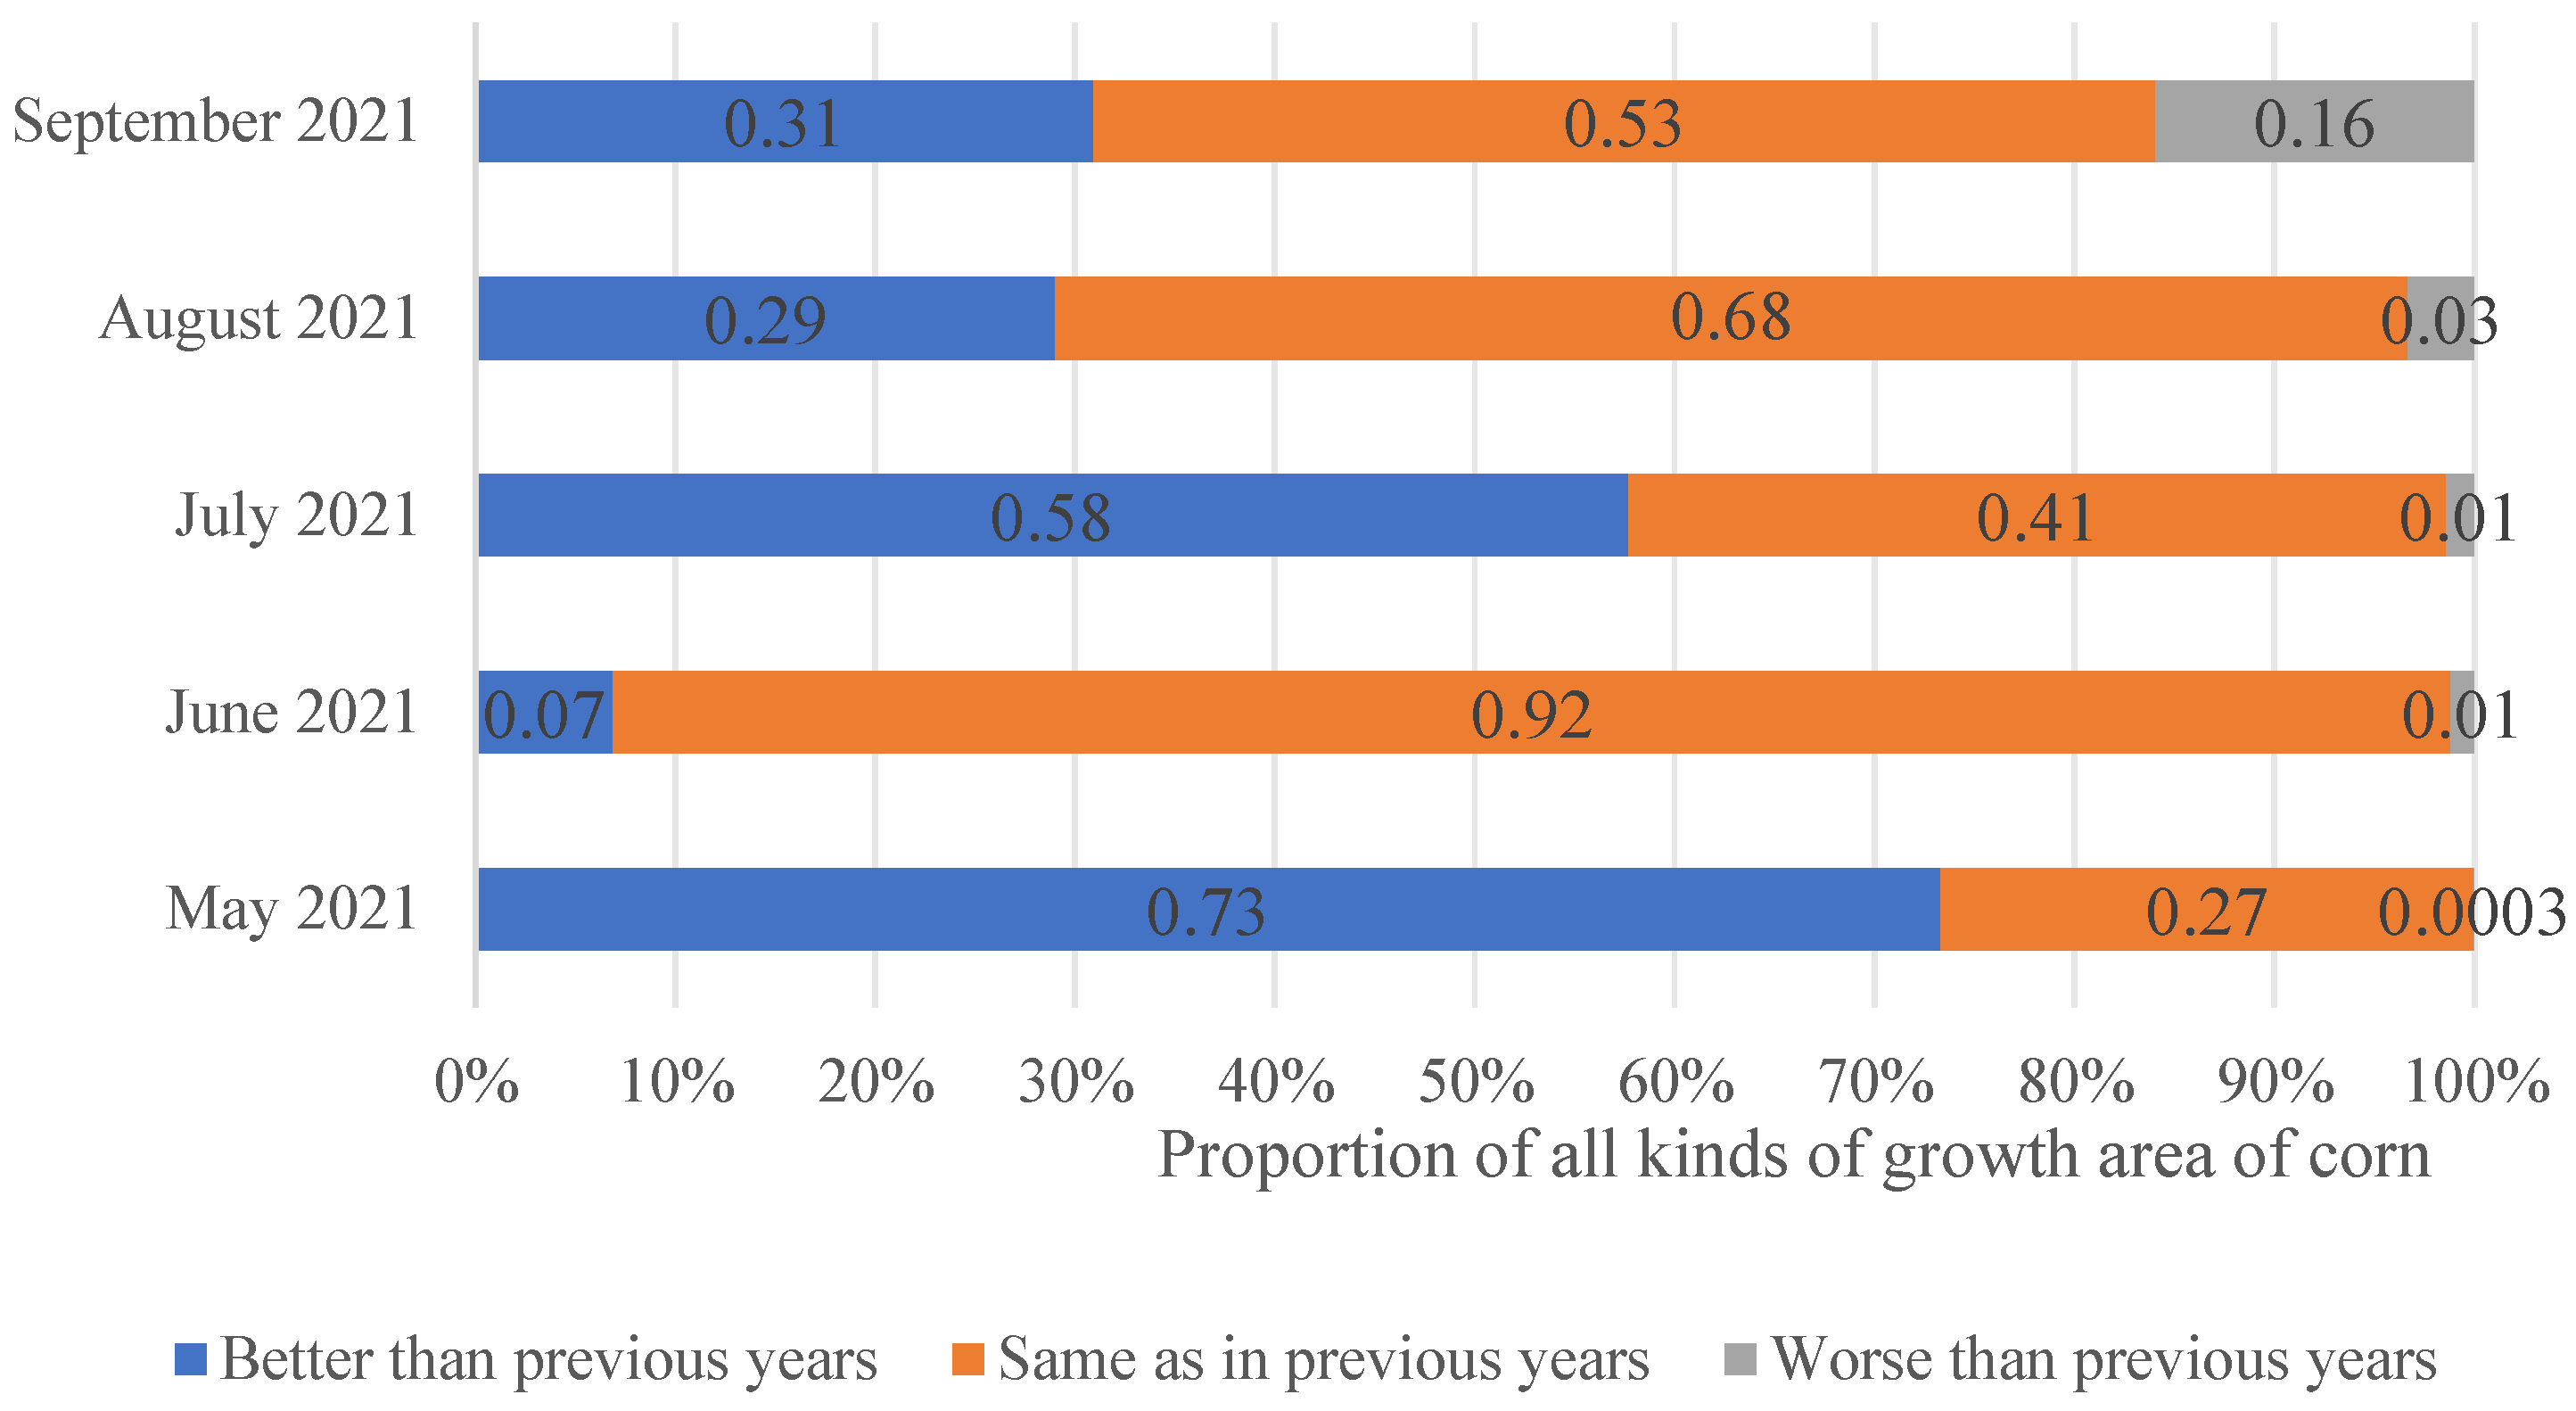
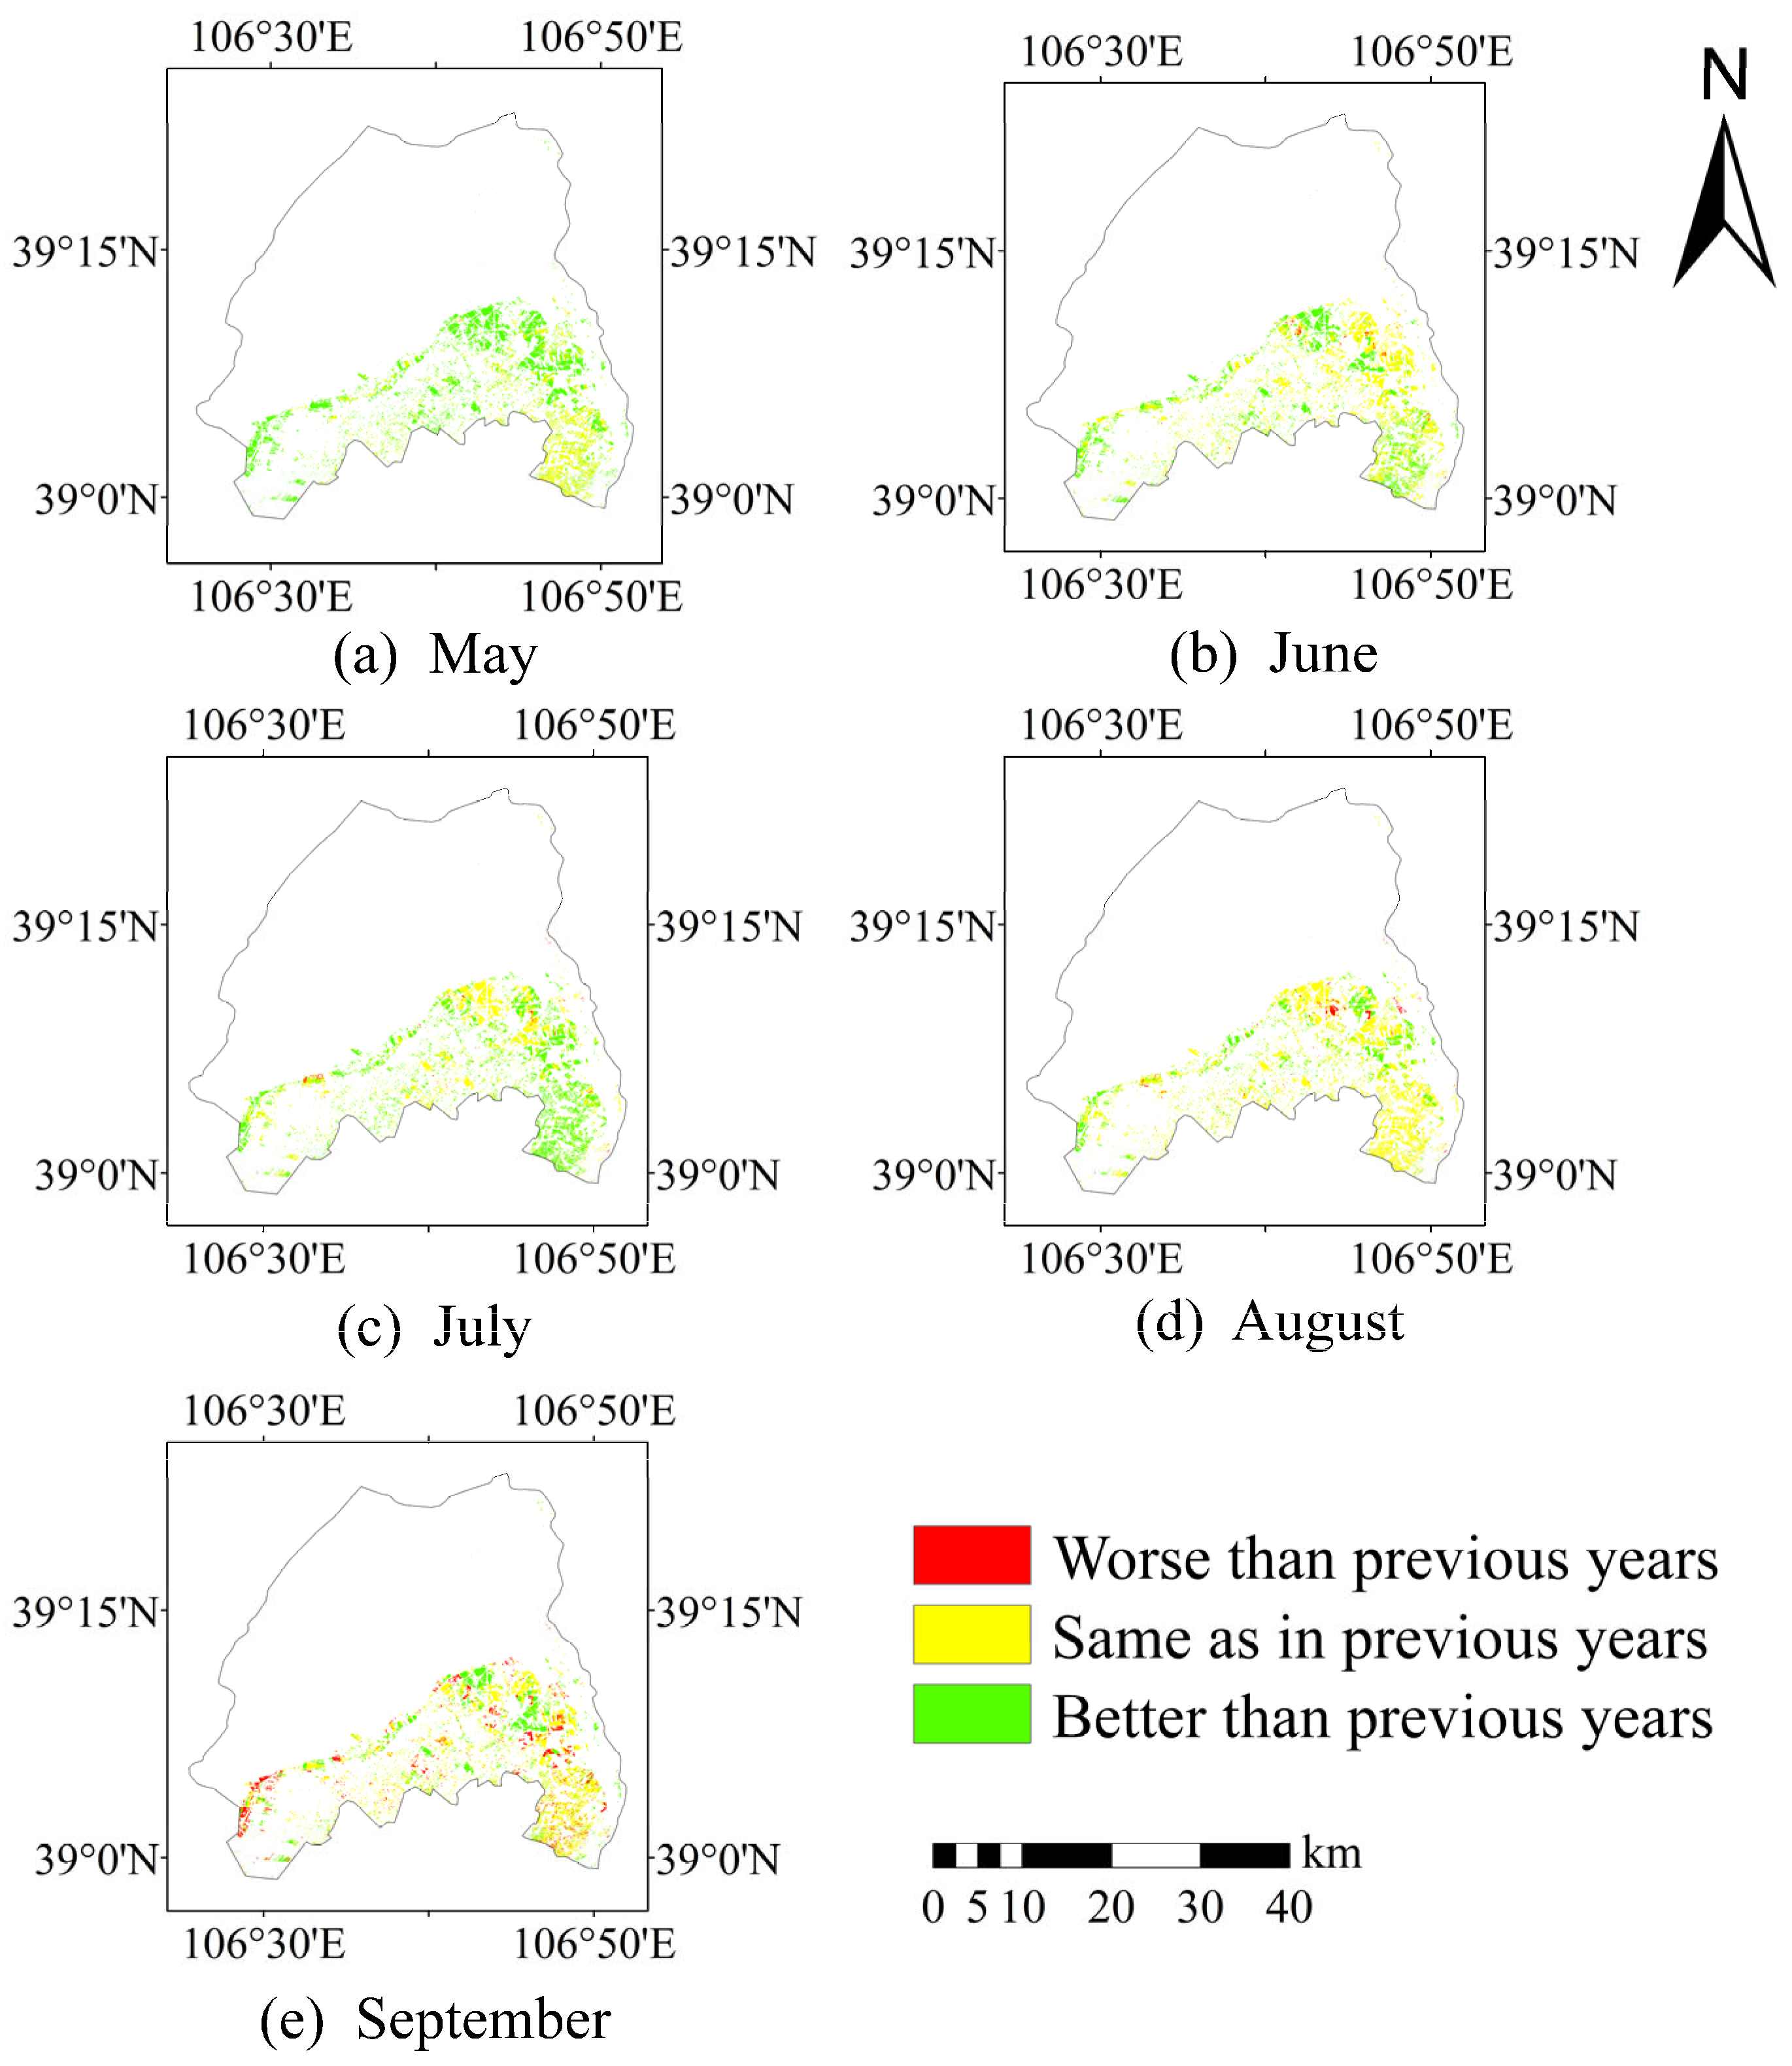
3.3. Growth Test Results

The random forest classification approach was employed to accurately and reliably extract the maize plantation area in Huinong District. To do this, the NDVI difference model was utilized to compare the NDVI values of the year 2021 with those of previous years during the same time (refer to Figure 7). From the beginning of May to the middle of August, the study found that the percentage of NDVI differences above 0 was more statistically significant than the percentage of NDVI differences below 0. This finding suggests that the majority of areas within the maize-growing region exhibited higher NDVI values compared to the same period in previous years, indicating improved maize-growing conditions. Conversely, there was minimal disparity observed between the areas with significant NDVI increments above 0 and those with NDVI increments below 0 from mid-August to the end of September. To better track the growth of maize during this time period, the NDVI difference model was used to divide the growth patterns into three groups: worse than previous years, about the same as previous years, and better than previous years. The area allocation for each type of maize cultivation in 2021 was determined based on predetermined values and compared to prior years (Figure 8). The geographical range of each winter wheat variety’s growth throughout the same time frame as prior years is delineated and visualized in Figure 9. The findings indicate that the growth of maize during the months of May and July showed improvement compared to the corresponding time in the preceding years. However, from July to September, there was a progressive decline in growth in more favorable regions, while poorer regions had an increase. Nevertheless, the overall growth in the better areas remained higher than that in the poorer areas.
Some academics have researched the data to indicate that climatic change strongly influences maize development, and the temperature factor (maximum temperature, minimum temperature, and average temperature) significantly influences maize growth, followed by the light component (sunshine hours). Therefore, in this paper, the daily value dataset (V3.0) of China’s surface climate data (https://data.cma.cn/date, accessed on 22 November 2023) released by the National Meteorological Science Data Sharing Platform, the temperature and sunshine hours meteorological data of one national meteorological station (Huinong) in Shizuishan City from 2017 to 2020 were selected to be statistically collected (Figure 10), and then, according to the statistical data, the growth trend of maize in Huinong District was selected to make an analysis. The comparison reveals that from early May to late July 2021, the temperature was higher than in the same period of the previous year, which was conducive to the growth of maize. However, the average sunshine hours in June 2021 were fewer than in the same period of the previous year, so the growth of maize in June 2021 slowed down, and the growth was the same as the previous year. After the beginning of August, the temperature and sunshine hours in 2021 were lower than in the same period in previous years. Hence, the proportion of places with bad growth gradually grew, the same growth as in previous years dropped, and the proportion of areas with superior growth stayed unchanged. Although maize growth is affected by climate change, global maize growth in 2021 is still better than in prior years.

4. Discussion

This study aimed to obtain a substantial quantity of remote sensing image data from the GEE cloud platform. Specifically, Sentinel-2 image data with a spatial resolution of 10 m were utilized to acquire the image dataset of Sentinel-2 in Huinong District, spanning the years 2017 to 2021. The selection of this dataset took into account the operational cost associated with monitoring large-scale maize areas and the accuracy of information extraction. To extract information from the dataset, support vector machines and random forest methods were employed. The labeled images were constructed using the results that exhibited better levels of accuracy. After conducting a comparison, it was observed that the random forest algorithm exhibited a 2.3% increase in overall accuracy when compared to the support vector machine algorithm. This increase signifies a higher percentage of correctly classified image elements. In addition, the Producer Accuracy went up by 43.3%, which means that there is a much higher chance of obtaining consistent classification results for certain spots on the classification map. Furthermore, the User Accuracy showed a significant improvement of 47.5%, indicating a large rise in the chance of correctly matching the type of a random sample with the actual surface conditions. Additionally, the Kappa coefficient showed a positive increase of 0.232, showing that the random forest classification method is very good at correctly identifying maize. This method exhibits high classification accuracy and effectively fulfills the requirements of precision agriculture through remote sensing monitoring [50,51]. The researchers opted for the random forest classification technique to delineate the maize cultivation region inside Huinong District throughout the period spanning from 2017 to 2021. It was found that the extracted maize planting area in this study has fewer mixed-up parts, better average accuracy when tested using the confusion matrix computation, and a fairly small overall difference error when compared to the statistical data. While this study demonstrates an overall improvement in the extraction impact, it is important to note that there remains a large mistake in accurately extracting mountains and highways. The subsequent research direction entails employing the uncrewed aerial vehicle (UAV) platform to integrate high spatial resolution images with high temporal resolution images for the purpose of fusion. Additionally, it involves optimizing the original spectral features and utilizing deep learning methods to extract the maize planting area within a larger region.
The present work employed a random forest approach to accurately identify maize crops in the Huinong District using synthetic photos from the Sentinel-2 satellite. In order to monitor maize development in the research area, a mask was created for the extracted region. This mask was then utilized to combine the masked area with MODIS image data. The NDVI difference model was employed for this purpose. The conducted experiments demonstrate that the methodology employed in this investigation has the capability to yield precise data regarding the spatial arrangement of winter wheat cultivation as well as the frequent monitoring of its growth patterns. Further enhancements are required in the methodology employed for tracking the growth of maize in this study. The Normalized Difference Vegetation Index (NDVI) from the Moderate Resolution Imaging Spectroradiometer (MODIS) synthetic picture dataset was used in this study. The time resolution was ten days. The primary objective was to conduct a comparative analysis between the current year’s NDVI values and those of both the subsequent year and preceding years. The occurrence of errors in the NDVI scenario was sporadic in certain regions. After that, the next step was to plot the NDVI time series curves so that monitoring would be more accurate. At the moment, leaf area index, leaf chlorophyll content, and biomass are some of the indicators that are used with remote sensing technology to track the growth of crops. The main reason why maize NDVI was used in this study was to track the growth of maize on a regional level. Additionally, it is anticipated that future studies will integrate several indicators of maize growth to comprehensively monitor its development, thereby enhancing our comprehension of maize growth dynamics. At the same time, a small-scale experimental area can be set up for future research to improve the reliability of remote sensing technology for tracking crop growth. It is possible to check how well remote sensing technology works for monitoring crop growth by comparing the values that were measured of crop growth in the test area with the data from the remote sensing system.
The Google Earth Engine (GEE) platform demonstrates a high efficiency in handling substantial volumes of remote sensing data. By leveraging the GEE cloud infrastructure, we successfully extracted maize cultivation patterns from the Huinong District, spanning the years 2017 to 2020. This enabled us to promptly generate accurate maps depicting the spatial distribution of maize planting areas. However, there are some limitations in terms of computational capacity when using complementary resources on the Google Earth Engine (GEE) platform. In instances where the study area is extensive, the computation process may encounter occasional errors such as “computation timeout,” “computation exceeds the limit,” or browser crashes. However, it is anticipated that these issues will be progressively resolved through subsequent enhancements. Through further enhancements, there will be a progressive improvement. This study utilized a large dataset obtained from the GEE cloud platform to monitor the growth of maize. The practicality of this approach in terms of its application value was examined. This study can be used as a starting point for future work that aims to create a business-oriented operational system for the remote sensing of agricultural data. This system will be built upon the GEE cloud platform, with the aim of enhancing the effectiveness of monitoring and analytic processes.

5. Conclusions

The GEE platform was utilized in this study to build features using Sentinel-2 image data, compare the classification accuracy of random forests and support vector machines, and extract the area of maize planted in Huinong District from 2017 to 2021 using the subsequent forest classification method: The Huinong District’s planted area for maize was then covered in masks for 2021. The NDVI difference of the covered area was then calculated using the MODIS image, high-frequency growth monitoring of the crop, and monitoring and analysis of the crop’s growth in Huinong District in conjunction with meteorological factors. From these analyses, the following conclusions were drawn:
(1) Using GEE and having access to Sentinel-2 and MODIS image data ensures that there are reliable data and computing resources for finding maize fields and keeping an eye on how they grow quickly. This study employed support vector machine and random forest classification methods for the purpose of classifying and extracting maize planting areas. The findings indicated that support vector machine, when computed using the confusion matrix, exhibited an average overall accuracy of 96.6%. Additionally, the average Kappa coefficient was 0.734, the average User Accuracy was 50.2%, and the average Producer Accuracy was 55.9%. The random forest algorithm yielded an average overall accuracy of 98.9%, as determined by the confusion matrix. Additionally, the average Kappa coefficient was found to be 0.966. The average user accuracy and average producer accuracy were observed to be 97.7% and 99.2%, respectively. This suggests that the random forest classification algorithm is good at identifying maize, which makes it a useful tool for distinguishing grown maize and performing statistical analyses in the research area. In general, the year 2020 exhibited the highest level of accuracy in maize identification. The random forest and support vector machine classification algorithms demonstrated high Kappa coefficients. Also, the overall accuracy was higher than 90%, which shows that the identification results and the validation sample plots were very similar.
(2) This study combined the advantages of using two remote sensing datasets, Sentinel-2 and MODIS, to effectively track the growth patterns of maize in Huinong District during the year 2021. This ensured a high level of temporal resolution. The growth of maize in Huinong District in 2021 exhibited comparable or improved performance during the seedling stage, nodulation stage, and early stage of staminate pulling and spitting in comparison to previous years. However, as a result of the weather and other factors, its growth rate gradually slowed down in August. The proportion of regions experiencing diminished growth compared to prior years showed a progressive increase; nonetheless, the overall growth of maize in Huinong District in 2021 surpassed that of previous years.

Supplementary Materials

The following supporting information can be downloaded at: https://www.mdpi.com/article/10.3390/su152316343/s1.

Author Contributions

Conceptualization, W.L. (Wenjie Luan) and X.S.; Data curation, W.L. (Wenjie Luan) and Y.F.; Formal analysis, Q.L.; Funding acquisition, X.S. and W.L. (Wangcheng Li); Investigation, W.L. (Wenjie Luan), Y.F., Q.L. and T.W.; Methodology, Y.F.; Project administration, X.S. and W.L. (Wangcheng Li); Resources, X.S. and W.L. (Wangcheng Li); Software, Y.F.; Supervision, X.S. and W.L. (Wangcheng Li); Validation, W.L. (Wenjie Luan), T.W. and D.M.; Writing—original draft, W.L. (Wenjie Luan); Writing—review and editing, X.S. and W.L. (Wangcheng Li). All authors have read and agreed to the published version of the manuscript.

Funding

This research was funded by the National Natural Science Foundation of China (52169010), the National Natural Science Foundation of China (51869023), and National Key Research and Development Program of China (2021YFD1900600).

Institutional Review Board Statement

Not applicable.

Informed Consent Statement

Not applicable.

Data Availability Statement

The data presented in this study are available on request from the corresponding author.

Acknowledgments

We thank the journal’s editors and reviewers for their valuable suggestions to improve the paper.

Conflicts of Interest

The authors declare no conflict of interest.

References

  1. Fritz, S.; See, L.; McCallum, I.; You, L.; Bun, A.; Moltchanova, E.; Duerauer, M.; Albrecht, F.; Schill, C.; Perger, C.; et al. Mapping Global Cropland and Field Size. Glob. Change Biol. 2015, 21, 1980–1992. [Google Scholar] [CrossRef] [PubMed]
  2. Fuchs, R.; Herold, M.; Verburg, P.H.; Clevers, J.G.P.W.; Eberle, J. Gross Changes in Reconstructions of Historic Land Cover/Use for Europe between 1900 and 2010. Glob. Change Biol. 2015, 21, 299–313. [Google Scholar] [CrossRef] [PubMed]
  3. Zhang, T.; Lei, Q.; Liang, X.; Lindsey, S.; Luo, J.; Pei, W.; Du, X.; Wu, S.; An, M.; Qiu, W.; et al. Optimization of the N Footprint Model and Analysis of Nitrogen Pollution in Irrigation Areas: A Case Study of Ningxia Hui Autonomous Region, China. J. Environ. Manag. 2023, 340, 118002. [Google Scholar] [CrossRef] [PubMed]
  4. Zhang, J.; Feng, L.; Yao, F. Improved Maize Cultivated Area Estimation over a Large Scale Combining MODIS–EVI Time Series Data and Crop Phenological Information. ISPRS J. Photogramm. Remote Sens. 2014, 94, 102–113. [Google Scholar] [CrossRef]
  5. Tang, K.; Zhu, W.; Zhan, P.; Ding, S. An Identification Method for Spring Maize in Northeast China Based on Spectral and Phenological Features. Remote Sens. 2018, 10, 193. [Google Scholar] [CrossRef]
  6. Atzberger, C. Advances in Remote Sensing of Agriculture: Context Description, Existing Operational Monitoring Systems and Major Information Needs. Remote Sens. 2013, 5, 949–981. [Google Scholar] [CrossRef]
  7. Su, W.; Jiang, F.; Zhu, D.; Zhan, J.; Ma, H.; Zhang, X. Extraction of Maize Planting Area Based on Decision Tree and Mixed-Pixel Unmixing Methods. Trans. Chin. Soc. Agric. Mach. 2015, 46, 289–295. [Google Scholar]
  8. Friedl, M.A.; Brodley, C.E. Decision Tree Classification of Land Cover from Remotely Sensed Data. Remote Sens. Environ. 1997, 61, 399–409. [Google Scholar] [CrossRef]
  9. Luo, C.; Qi, B.; Liu, H.; Guo, D.; Lu, L.; Fu, Q.; Shao, Y. Using Time Series Sentinel-1 Images for Object-Oriented Crop Classification in Google Earth Engine. Remote Sens. 2021, 13, 561. [Google Scholar] [CrossRef]
  10. Virnodkar, S.; Pachghare, V.K.; Patil, V.C.; Jha, S.K. Performance Evaluation of RF and SVM for Sugarcane Classification Using Sentinel-2 NDVI Time-Series. In Proceedings of the Progress in Advanced Computing and Intelligent Engineering; Panigrahi, C.R., Pati, B., Mohapatra, P., Buyya, R., Li, K.-C., Eds.; Springer: Singapore, 2021; pp. 163–174. [Google Scholar]
  11. Kwak, G.-H.; Park, N.-W. Impact of Texture Information on Crop Classification with Machine Learning and UAV Images. Appl. Sci. 2019, 9, 643. [Google Scholar] [CrossRef]
  12. Böhler, J.E.; Schaepman, M.E.; Kneubühler, M. Crop Classification in a Heterogeneous Arable Landscape Using Uncalibrated UAV Data. Remote Sens. 2018, 10, 1282. [Google Scholar] [CrossRef]
  13. Lee, D.-H.; Kim, H.-J.; Park, J.-H. UAV, a Farm Map, and Machine Learning Technology Convergence Classification Method of a Corn Cultivation Area. Agronomy 2021, 11, 1554. [Google Scholar] [CrossRef]
  14. Ponganan, N.; Horanont, T.; Artlert, K.; Nuallaong, P. Land Cover Classification Using Google Earth Engine’s Object-Oriented and Machine Learning Classifier. In Proceedings of the 2021 2nd International Conference on Big Data Analytics and Practices (IBDAP), Bangkok, Thailand, 26–27 August 2021; pp. 33–37. [Google Scholar]
  15. Pott, L.P.; Amado, T.J.C.; Schwalbert, R.A.; Corassa, G.M.; Ciampitti, I.A. Satellite-Based Data Fusion Crop Type Classification and Mapping in Rio Grande Do Sul, Brazil. ISPRS J. Photogramm. Remote Sens. 2021, 176, 196–210. [Google Scholar] [CrossRef]
  16. Palchowdhuri, Y.; Valcarce-Diñeiro, R.; King, P.; Sanabria-Soto, M. Classification of Multi-Temporal Spectral Indices for Crop Type Mapping: A Case Study in Coalville, UK. J. Agric. Sci. 2018, 156, 24–36. [Google Scholar] [CrossRef]
  17. Gorelick, N.; Hancher, M.; Dixon, M.; Ilyushchenko, S.; Thau, D.; Moore, R. Google Earth Engine: Planetary-Scale Geospatial Analysis for Everyone. Remote Sens. Environ. 2017, 202, 18–27. [Google Scholar] [CrossRef]
  18. Dong, J.; Xiao, X.; Menarguez, M.A.; Zhang, G.; Qin, Y.; Thau, D.; Biradar, C.; Moore, B. Mapping Paddy Rice Planting Area in Northeastern Asia with Landsat 8 Images, Phenology-Based Algorithm and Google Earth Engine. Remote Sens. Environ. 2016, 185, 142–154. [Google Scholar] [CrossRef]
  19. Luo, C.; Liu, H.; Fu, Q.; Guan, H.; Ye, Q.; Zhang, X.; Kong, F. Mapping the Fallowed Area of Paddy Fields on Sanjiang Plain of Northeast China to Assist Water Security Assessments. J. Integr. Agric. 2020, 19, 1885–1896. [Google Scholar] [CrossRef]
  20. Wang, J.; Tian, H.; Wu, M.; Wang, L.; Wang, Z. Rapid Mapping of Winter Wheat in Henan Province. J. Geo-Inf. Sci. 2017, 19, 846–853. [Google Scholar]
  21. Malenovský, Z.; Rott, H.; Cihlar, J.; Schaepman, M.E.; García-Santos, G.; Fernandes, R.; Berger, M. Sentinels for Science: Potential of Sentinel-1, -2, and -3 Missions for Scientific Observations of Ocean, Cryosphere, and Land. Remote Sens. Environ. 2012, 120, 91–101. [Google Scholar] [CrossRef]
  22. Pierdicca, R.; Malinverni, E.S.; Piccinini, F.; Paolanti, M.; Felicetti, A.; Zingaretti, P. Deep convolutional neural network for automatic detection of damaged photovoltaic cells. Int. Arch. Photogramm. Remote Sens. Spat. Inf. Sci. 2018, XLII–2, 893–900. [Google Scholar] [CrossRef]
  23. Boateng, E.Y.; Otoo, J.; Abaye, D.A. Basic Tenets of Classification Algorithms K-Nearest-Neighbor, Support Vector Machine, Random Forest and Neural Network: A Review. J. Data Anal. Inf. Process. 2020, 8, 341–357. [Google Scholar] [CrossRef]
  24. Boser, B.E.; Guyon, I.M.; Vapnik, V.N. A Training Algorithm for Optimal Margin Classifiers. In Proceedings of the fifth Annual Workshop on Computational Learning Theory, Pittsburgh, PA, USA, 27–29 July 1992; Association for Computing Machinery: New York, NY, USA, 1992; pp. 144–152. [Google Scholar]
  25. Coimbra, R.; Rodriguez-Galiano, V.; Olóriz, F.; Chica-Olmo, M. Regression Trees for Modeling Geochemical Data—An Application to Late Jurassic Carbonates (Ammonitico Rosso). Comput. Geosci. 2014, 73, 198–207. [Google Scholar] [CrossRef]
  26. Rodriguez-Galiano, V.F.; Ghimire, B.; Rogan, J.; Chica-Olmo, M.; Rigol-Sanchez, J.P. An Assessment of the Effectiveness of a Random Forest Classifier for Land-Cover Classification. ISPRS J. Photogramm. Remote Sens. 2012, 67, 93–104. [Google Scholar] [CrossRef]
  27. Breiman, L. Bagging Predictors. Mach Learn 1996, 24, 123–140. [Google Scholar] [CrossRef]
  28. Vincenzi, S.; Zucchetta, M.; Franzoi, P.; Pellizzato, M.; Pranovi, F.; De Leo, G.A.; Torricelli, P. Application of a Random Forest Algorithm to Predict Spatial Distribution of the Potential Yield of Ruditapes Philippinarum in the Venice Lagoon, Italy. Ecol. Model. 2011, 222, 1471–1478. [Google Scholar] [CrossRef]
  29. Crist, E.P.; WA, M. A Temporal-Spectral Analysis Technique for Vegetation Applications of Landsat. Int. Symp. Remote Sens. Environ. 1980, 2, 1031–1040. [Google Scholar]
  30. Schneider, S.R.; McGinnis, D.F.; Gatlin, J.A. Use of NOAA/AVHRR Visible and near-Infrared Data for Land Remote Sensing; US Department of Commerce, National Oceanic and Atmospheric Administration: Washington, DC, USA, 1981; Volume 84. [Google Scholar]
  31. Tappan, G.G.; Moore, D.G.; Knausenberger, W.I. Monitoring Grasshopper and Locust Habitats in Sahelian Africa Using GIS and Remote Sensing Technology†. Int. J. Geogr. Inf. Syst. 1991, 5, 123–135. [Google Scholar] [CrossRef]
  32. Dalezios, N.R.; Domenikiotis, C.; Loukas, A.; Tzortzios, S.T.; Kalaitzidis, C. Cotton Yield Estimation Based on NOAA/AVHRR Produced NDVI. Phys. Chem. Earth Part B: Hydrol. Ocean. Atmos. 2001, 26, 247–251. [Google Scholar] [CrossRef]
  33. Hill, M.J.; Donald, G.E. Estimating Spatio-Temporal Patterns of Agricultural Productivity in Fragmented Landscapes Using AVHRR NDVI Time Series. Remote Sens. Environ. 2003, 84, 367–384. [Google Scholar] [CrossRef]
  34. Sakamoto, T.; Gitelson, A.A.; Arkebauer, T.J. MODIS-Based Corn Grain Yield Estimation Model Incorporating Crop Phenology Information. Remote Sens. Environ. 2013, 131, 215–231. [Google Scholar] [CrossRef]
  35. Wang, H.; Zhang, Z.; Kang, X.; Lin, J.; Yin, C.; Ma, L.; Huang, C. Cotton Planting Area Extraction and Yield Prediction Based on Sentinel-2A. Trans. Chin. Soc. Agric. Eng. 2022, 38, 205–214. [Google Scholar]
  36. Chai, N.; Zhou, W.; Wan, B. Research on Performance Evaluation and Obstacle Diagnosis for Urban Water Ecological Civilization Construction Based on GFAHP-Cloud-FSE Model: The Case of Shizuishan, China. Stoch Env. Res Risk Assess 2022, 36, 3439–3465. [Google Scholar] [CrossRef]
  37. Drusch, M.; Bello, U.D.; Carlier, S.; Colin, O.; Fernandez, V.; Gascon, F.; Hoersch, B.; Isola, C.; Laberinti, P.; Martimort, P.; et al. Sentinel-2: ESA’s Optical High-Resolution Mission for GMES Operational Services. Remote Sens. Environ. 2012, 120, 25–36. [Google Scholar] [CrossRef]
  38. Yang, Y.; Zhang, Y.; Yang, Y.; Ma, C. Qualitative Analysis of Molten Steel Based on Support Vector Machine by LIBS. Laser Optoelectron. Prog. 2015, 52, 215–220. [Google Scholar]
  39. Mao, Z.; Chen, Q. Recognition and Tracking of AGV Multi-Branch Path Based on PCA-LDA and SVM. Laser Optoelectron. Prog. 2018, 55, 148–155. [Google Scholar]
  40. Francisco, J.; Marcos, O.; Carlos, M.; Christian, A.; Doris, S.; Pablo, E. On-Line Estimation of the Aerobic Phase Length for Partial Nitrification Processes in SBR Based on Features Extraction and SVM Classification. Chem. Eng. J. 2018, 331, 114–123. [Google Scholar]
  41. Zhang, S.; Xie, F.; Wei, D. Multi-Temporal Remote Sensing Lmages Based on Support Vector Machines for Winter Wheat Planting Area Extraction. Territ. Nat. Resour. Study 2018, 2, 76–77. [Google Scholar] [CrossRef]
  42. Geng, R.; Fu, B.; Cai, J.; Chen, X.; Lan, F.; Yu, H.; Li, Q. Object-Based Karst Wetland Vegetation Classification Method UsingUnmanned Aerial Vehicle Images and Random Forest Algorithm. J. Geo-Inf. Sci. 2019, 21, 1295–1306. [Google Scholar]
  43. Zheng, L.; Xu, J.; Wang, X. Application of Random Forests Algorithm in Researches on Wetlands. Wetl. Sci. 2019, 17, 16–24. [Google Scholar] [CrossRef]
  44. Belgiu, M.; Drăguţ, L. Random Forest in Remote Sensing: A Review of Applications and Future Directions. ISPRS J. Photogramm. Remote Sens. 2016, 114, 24–31. [Google Scholar] [CrossRef]
  45. Sun, Y.; Liu, P.; Zhang, Y.; Song, C.; Zhang, D.; Ma, X. Research on Extraction of Winter Wheat Planting Area in Weifang City Based on Sentinel-2A Remote Sensing Image. J. Chin. Agric. Mech. 2022, 43, 98–105. [Google Scholar] [CrossRef]
  46. Ahmad, M.W.; Mourshed, M.; Rezgui, Y. Trees vs Neurons: Comparison between Random Forest and ANN for High-Resolution Prediction of Building Energy Consumption. Energy Build. 2017, 147, 77–89. [Google Scholar] [CrossRef]
  47. Charlotte, P.; Silvia, V.; Jordi, I.; Nicolas, C.; Gérard, D. Assessing the Robustness of Random Forests to Map Land Cover with High Resolution Satellite Image Time Series over Large Areas. Remote Sens. Environ. 2016, 187, 156–168. [Google Scholar]
  48. Hao, P.; Zhan, Y.; Wang, L.; Niu, Z.; Muhammad, S. Feature Selection of Time Series MODIS Data for Early Crop Classification Using Random Forest: A Case Study in Kansas, USA. Remote Sens. 2015, 7, 5347–5369. [Google Scholar] [CrossRef]
  49. Hossain, E.; Hossain, M.F.; Rahaman, M.A. A Color and Texture Based Approach for the Detection and Classification of Plant Leaf Disease Using KNN Classifier. In Proceedings of the 2019 International Conference on Electrical, Computer and Communication Engineering (ECCE), Cox’s Bazar, Bangladesh, 7–9 February 2019; IEEE: Piscataway, NJ, USA, 2019; pp. 1–6. [Google Scholar]
  50. Ok, A.O.; Akar, O.; Gungor, O. Evaluation of Random Forest Method for Agricultural Crop Classification. Eur. J. Remote Sens. 2012, 45, 421–432. [Google Scholar] [CrossRef]
  51. Saini, R.; Ghosh, S.K. Crop classification on single date sentinel-2 imagery using random forest and suppor vector Machine. Int. Arch. Photogramm. Remote Sens. Spat. Inf. Sci. 2018, XLII–5, 683–688. [Google Scholar] [CrossRef]
Figure 1. Overview map of the study area.
Sustainability 15 16343 g001
Figure 2. General road map for this study.
Sustainability 15 16343 g002
Figure 3. Random forest algorithm flow.
Sustainability 15 16343 g003
Figure 4. Evaluation of overall classification accuracy.
Sustainability 15 16343 g004
Figure 5. Kappa coefficient evaluation.
Sustainability 15 16343 g005
Figure 6. Distribution of maize sown area in Huinong District, 2017–2021. (ae) shows the distribution of maize sown area in Huinong District for each year from 2017 to 2021, with the green part of the graph representing maize-growing areas and the white part representing non-maize-growing areas.
Sustainability 15 16343 g006
Figure 7. NDVI changes in maize-growing areas in 2021 compared to previous years.
Sustainability 15 16343 g007
Figure 8. Maize growth in the study area in May–September 2021 compared to previous years.
Sustainability 15 16343 g008
Figure 9. Distribution of maize growth in May–September 2021 in the study area compared to previous years. (ae) shows the distribution of maize growth in May–September 2021 in Huinong District compared to previous years. The red color indicates areas with poorer growth than in previous years, the yellow color indicates the same growth as in previous years, and the green color represents areas with better growth than in previous years.
Sustainability 15 16343 g009
Figure 10. Average temperature and average sunshine for May–September: (a) describes the average temperature for the months of May–September, 2017–2021; (b) describes the average number of hours of sunshine for the months of May–September, 2017–2020.
Sustainability 15 16343 g010
Table 1. Spectral bands for the Sentinel-2 sensors.
Sentinel-2 BandsSentinel-2ASentinel-2BSpatial Resolution(m)
Central Wavelength
(nm)
Band Width
(nm)
Central Wavelength
(nm)
Band Width
(nm)
Band 1-Coastal
aerosol
442.721442.22160
Band 2-Blue492.466492.16610
Band 3-Green559.8365593610
Band 4-Red664.531664.93110
Band 5-Vegetation red edge704.115703.81620
Band 6-Vegetation red edge740.515739.11520
Band 7-Vegetation red edge782.820779.72020
Band 8-NIR832.8106832.910610
Band 8A-Narrow NIR864.7218642220
Band 9-Water Vapor945.120943.22160
Band 10-SWIR–Cirrus1373.5311376.93060
Band 11-SWIR 1613.7911610.49420
Band 12-SWIR 2202.41752185.718520
Table 2. Maize weathering period table.
DateMaize Fertility Cycle
Early May to mid-JuneSeedling stage
Mid-June to mid-JulyEarly nodulation stage
Mid-July to mid-AugustStalking and silking stage
Mid-August to late-August Silking–irrigation stage
Late August to late SeptemberMature stage
Table 3. Training samples.
Sample Point TypeTraining SampleDescription
Urban AreaSustainability 15 16343 i001
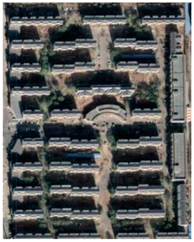
The built-up area of the study area consists mainly of town buildings.
WaterSustainability 15 16343 i002
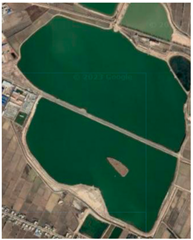
The water bodies in the study area consist mainly of lakes and rivers (Yellow River) with cyan and dark blue texture and yellow color in the Yellow River.
Bare GroundSustainability 15 16343 i003
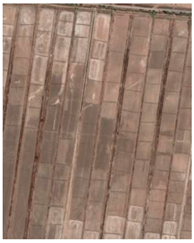
There are no buildings above the bare ground in the study area and the surface is not covered with vegetation, which is highly reflective and homogeneous in texture.
RoadSustainability 15 16343 i004
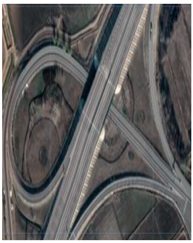
Roads in the study area include citywide arterial and highway roads, residential roads, excluding all types of plaza and car park sites and internal roads in neighborhoods. The primary textural feature is represented by elongated patches of mixed white and green.
Maize Growing AreaSustainability 15 16343 i005
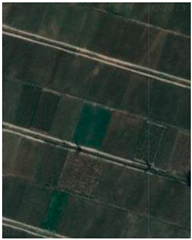
The maize growing areas in the study area have a structural character bounded by ridges, most of which are regular-rectangular in shape and dark green or black in texture color.
Form of a MountainSustainability 15 16343 i006
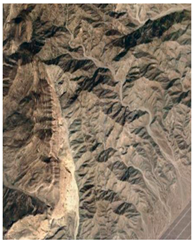
The mountains in the study area are long, narrow, north–south extending mountains with rugged terrain and vegetation with sunny and shady slopes and east–west slopes.
Table 4. Comparison of remotely sensed extracted sown area and statistical sown area of corn in Huinong District.
YearExtraction Area
(hm2)
Statistical Area (hm2)Absolute Error (hm2)Relative Error (%)
201784528426260.3
2018868989893003.3
2019920993311221.3
2020980195734842.4
202111,57411,2533212.9
Disclaimer/Publisher’s Note: The statements, opinions and data contained in all publications are solely those of the individual author(s) and contributor(s) and not of MDPI and/or the editor(s). MDPI and/or the editor(s) disclaim responsibility for any injury to people or property resulting from any ideas, methods, instructions or products referred to in the content.

