Article

Effects of Particle Size and Grading on the Breakage of Railway Ballast: Laboratory Testing and Numerical Modeling

1
Computing Center for Geotechnical Engineering (COMEGE), Zhejiang University, Hangzhou 310058, China
2
China Railway 11th Bureau Group Co., Ltd., Wuchang District, Wuhan 430072, China
3
School of Civil Engineering, Wuhan University, Wuhan 430072, China
*
Author to whom correspondence should be addressed.
Sustainability 2023, 15(23), 16363; https://doi.org/10.3390/su152316363
Submission received: 3 October 2023 / Revised: 31 October 2023 / Accepted: 6 November 2023 / Published: 28 November 2023

Abstract

:
Ballast is coarse aggregate with particle size normally ranging from 10 mm to 65 mm. Upon repeated train loading, ballast deteriorates in the form of either continuous abrasion of sharp corners or size degradation, which have been reported as the fundamental cause for the instability of railway tracks. In this study, the splitting behavior of ballast grain with varying particle sizes under diametrical compression was examined to investigate the size effect and the Weibull characteristics of ballast tensile strength; a Weibull modulus of 2.35 was measured for the tested granite ballast. A series of large-scale monotonic triaxial tests on ballast aggregates having various size gradings was performed to study the effect of particle gradation on the mechanical behavior of ballast. The results show that compared to mono-sized uniformly distributed aggregates, non-uniformly distributed aggregates generally have greater shear strength, larger peak friction angle, 50% strength modulus, and greater volumetric dilation. The ballast aggregate conforming to the recommended PSD as per current standards exhibited the most superior mechanical performance, possessing the greatest shear strength, peak friction angle, and 50% strength modulus. Micromechanical analysis showed that aggregates with larger d50 values have higher coordination numbers, inter-particle contact forces, and higher anisotropy level of contact normals, thus causing a greater possibility of particle breakage during shearing.

1. Introduction

Ballast is composed of coarse gravel grains typically ranging from 10 mm to 65 mm in size. It plays a pivotal role in railway tracks, serving several key functions, including providing a stable load-bearing platform for superstructures, transmitting high imposed stresses from the sleepers to the subgrade layer at a reduced and acceptable level, and ensuring adequate permeability for drainage. However, when subjected to repeated loading from passing trains, ballast inevitably undergoes breakage (degradation) during its service life. The breakdown of ballast grains significantly impacts the performance and longevity of railway tracks [1,2]. With the substantial increase in train speeds and freight capacity in recent times, ballast degradation has emerged as a critical issue in railway tracks. It poses substantial threats to operational safety and results in significant annual maintenance costs. Therefore, it is imperative to gain a comprehensive understanding of ballast breakage behavior to enhance safety, reliability, and sustainability in rail transportation.
As per the required energy, the degradation of ballast grains can be categorized into two primary patterns: bulk splitting and corner abrasion [3], with the latter accounting for a significant proportion. However, under high loading frequencies and elevated stress levels, ballast grains are more susceptible to body fractures, potentially splitting in half or even shattering into several smaller pieces [4]. Extensive studies have previously explored the impact of particle size on the breakage of individual ballast grains [5,6,7,8]. One dominant factor influencing grain splitting under load is the crushing strength of individual particles [9]. For a crushable grain subjected to diametrical compression, its tensile strength characteristics can be adequately described by the Weibull distribution [10], with tensile strength exponentially proportional to particle size (d) and a Weibull modulus (m). Building upon pioneering work by McDowell and Bolton [10], Lim et al. [6] measured the tensile strengths of six types of ballast with varying size fractions and explored the influence of particle mineral composition and internal flaws on ballast Weibull statistics. A similar research study on the tensile strength of railway ballast was also carried out by Al-Saoudi and Hassan [11], which yielded varying values of the Weibull modulus. Additionally, Koohmishi [12] investigated the tensile failure of both dry and saturated ballast particles under point load testing. The results concluded that water saturation significantly reduces the tensile strength of ballast and has a profound effect on its breakage pattern. Furthermore, Koohmishi and Palassi [13] explored the impact of particle shape on the strength of ballast particles and found that the shape of ballast particles had only a minor effect on their strength.
Beyond particle size, the size gradation of the ballast assembly also exerts a profound effect on its degradation. Sun et al. [14] conducted a series of monotonic and cyclic triaxial tests on ballast aggregates with varying coefficients of uniformity (Cu) and particle sizes (dmax). Their research revealed that that coarser gradations displayed relatively higher strength, resilience, and reduced permanent deformation, while overall aggregate size was positively correlated with ballast degradation. Similarly, Rosa et al. [3] conducted a related study and observed a decreasing trend in ballast breakage with increasing Cu. Indraratna et al. [15] evaluated breakage indexes of four ballast aggregates with diverse size gradations and concluded that uniformly distributed aggregates were more susceptible to breakage than gap-graded ones, with moderately graded specimens exhibiting the least particle breakage. Nålsund [16] also investigated the impact of particle gradings on the degradation of crushed-rock ballast and found that coarse aggregates experienced 31% more breakage than fine graded aggregates. Abadi et al. [17] examined the dynamic performance of different types of tracks assembled by ballast with varying gradings, and found that more widely graded ballast exhibited improved behavior in terms of smaller permanent settlements, higher stiffnesses, less movement of ballast grains, and reduced ballast grain breakage.
While significant progress has been made in the field, most of the previously mentioned studies were conducted through laboratory experiments, limiting the exploration of particle size and grading effects at the macro scale. The Discrete Element Method (DEM), initially proposed by Cundall and Strack [18], presents a powerful tool for numerically simulating granular materials. Numerous studies have employed DEM to investigate the mechanical behavior of railway ballast [19,20,21,22,23], yielding promising results. However, in the traditional DEM context, particulate grains are assumed to be completely rigid elements, and their breakage is not considered during modeling. For example, Tutumluer et al. [24] evaluated the void space and load carrying performances of various ballast aggregates complying with different AREMA gradations. Their study showed that more uniformly gradated aggregate assemblies generally produced greater accumulative permanent deformations and had larger air voids for drainage, while these uniform particles could raise the dilation potential of the assembly. However, their study primarily focused on the macro-mechanical response of ballast with different gradings. The fundamental mechanism underlying the grading effects on the mechanical behavior of ballast aggregates remains unclear.
Considering the current state of existing research, this study investigated the degradation and shear behavior of ballast with varying sizes and gradings through laboratory tests and numerical DEM modelling. The tensile strengths of ballast having varying size fractions were examined through the single ballast crushing test, whereby the particle size effect of ballast on its tensile strength was explored. A series of triaxial shearing tests under monotonic loading conditions was performed on ballast aggregates having different particle size distributions (PSDs), enabling investigation of the influence of particle gradings on the mechanical performance of ballast. Additionally, the micro-mechanical characteristics of ballast aggregates during shearing were examined to uncover the underlying mechanisms contributing to ballast degradation.

2. Materials and Methods

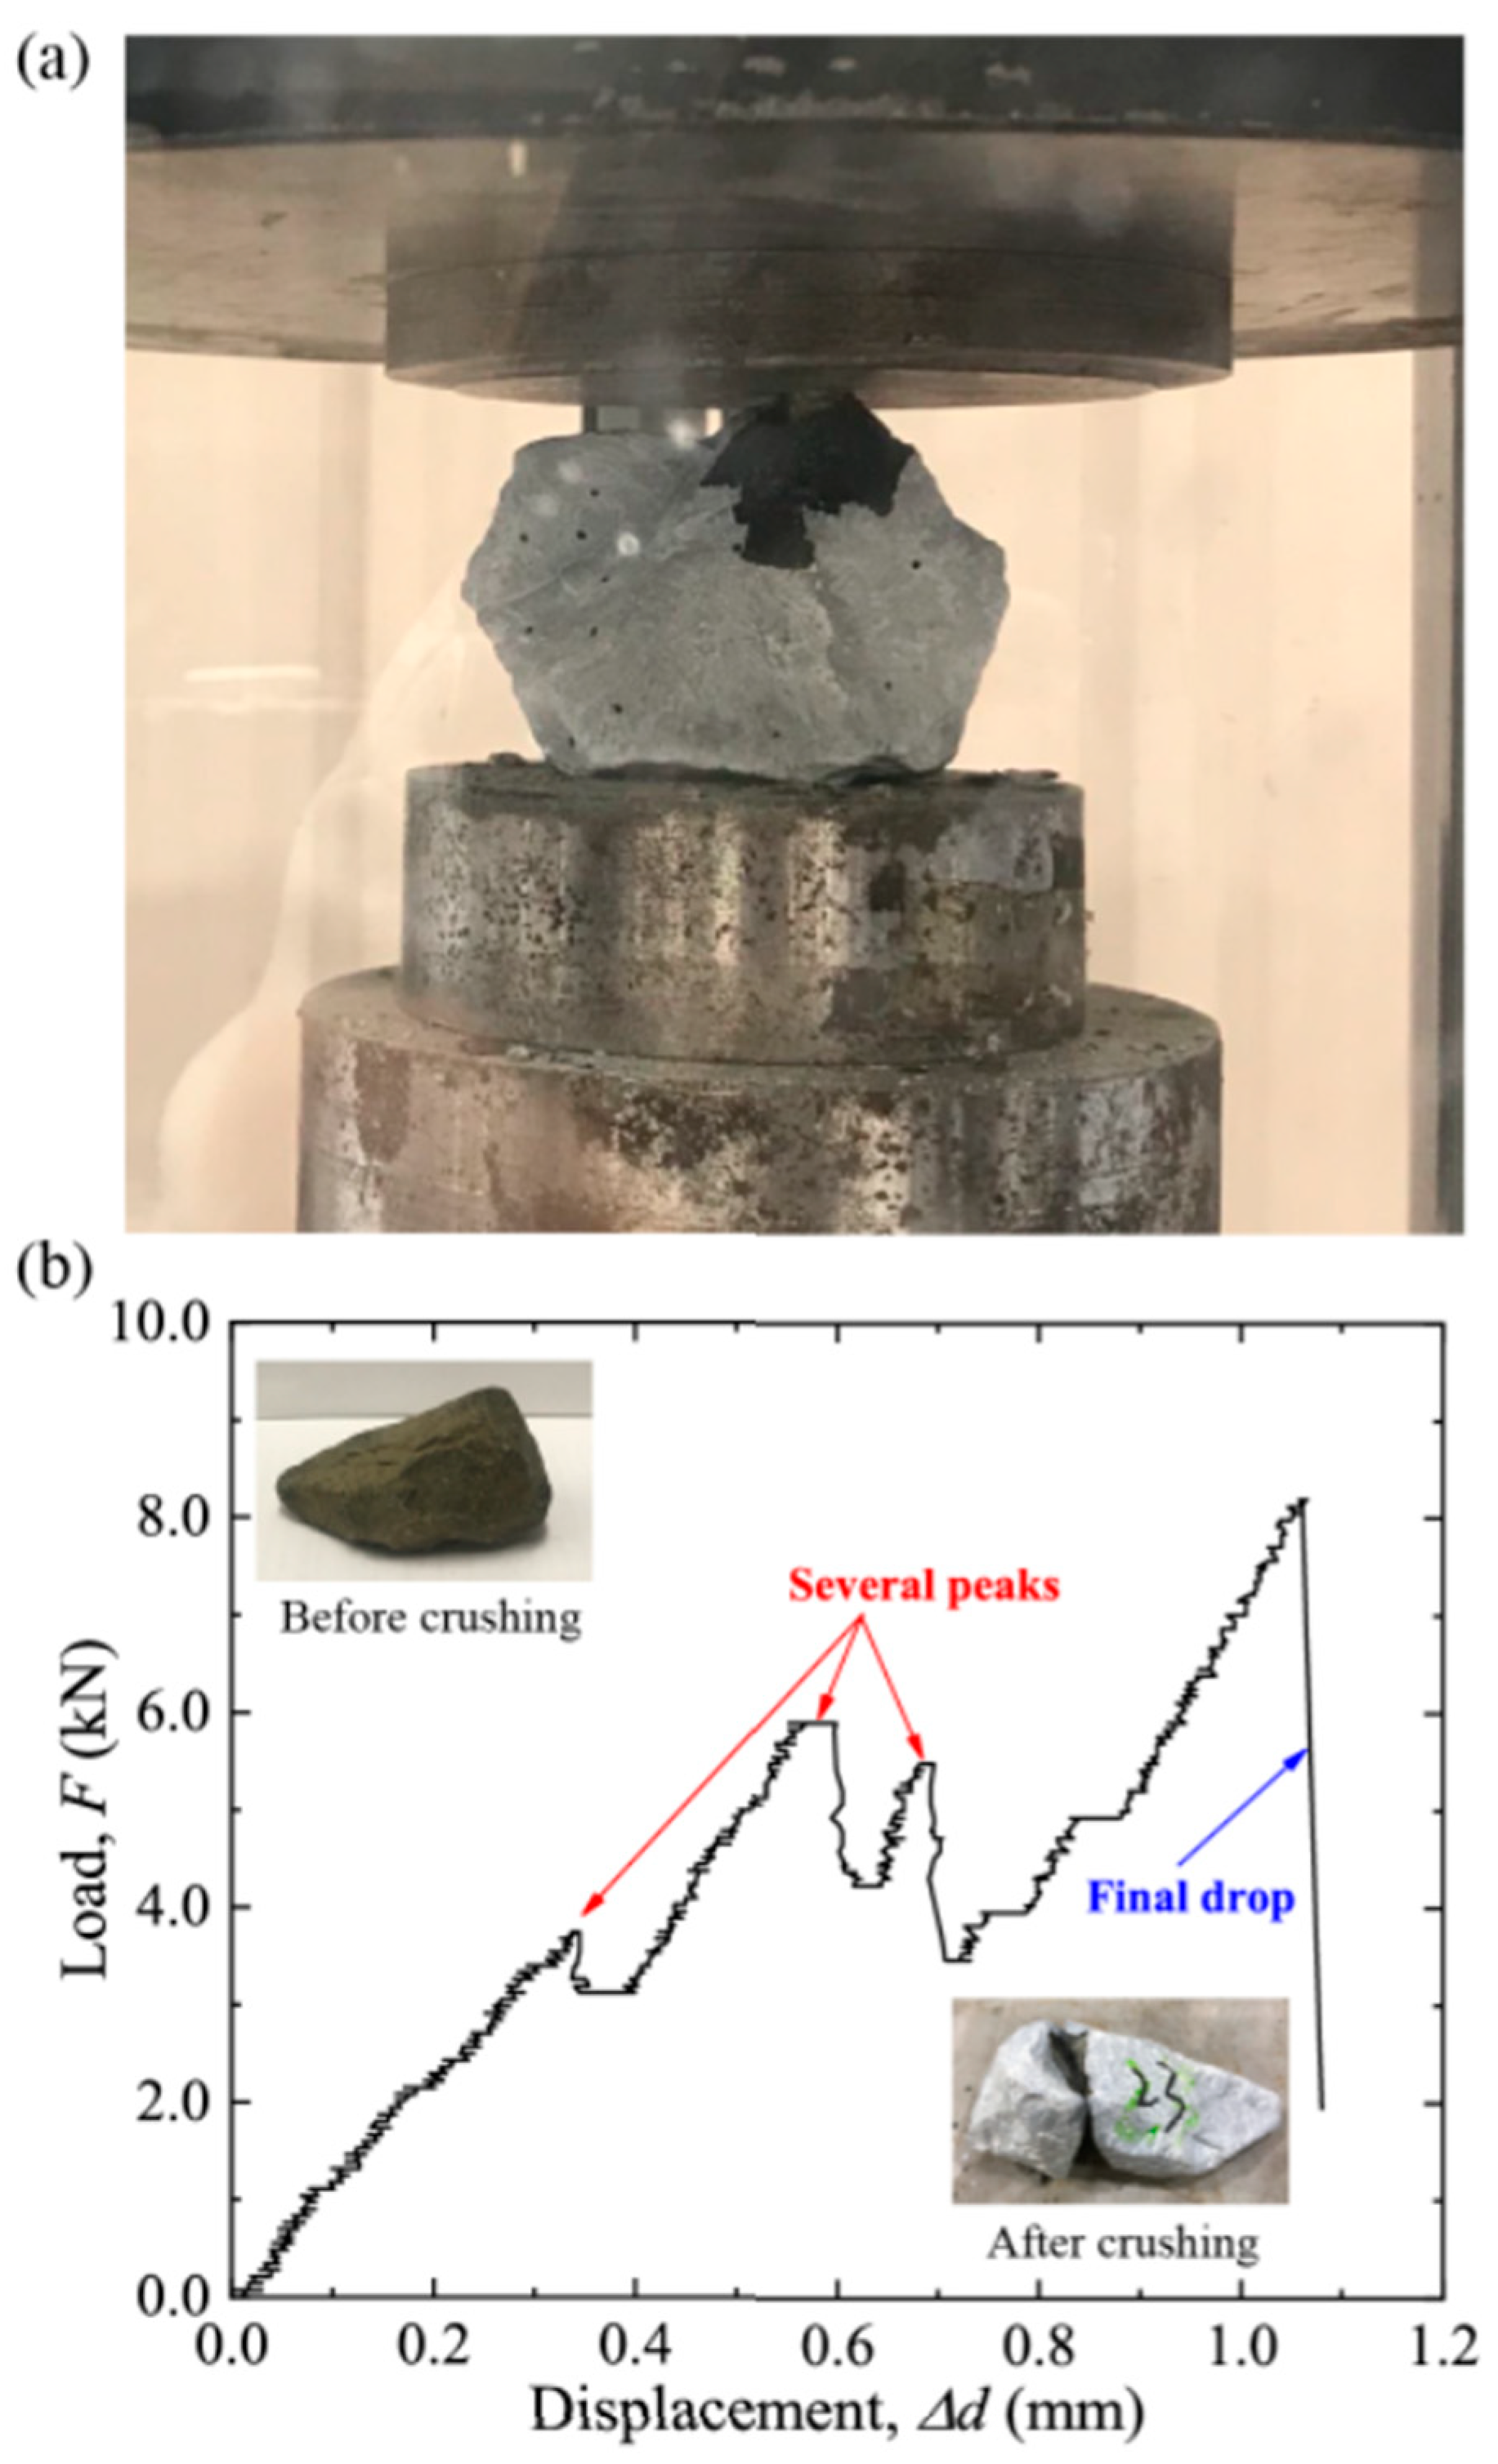
2.1. Single Ballast Crushing Test

In this study, a series of single particle crushing tests was conducted to assess the tensile strength of railway ballast under diametric compression. Ballast, sourced from latite basalt, was categorized into four size fractions according to the Chinese Standard of Railway Ballast (TB/T 2140-2008) [25]: 37.5–53 mm, 26–37.5 mm, 19–26 mm, and 12–19 mm. Each size fraction comprised 30 ballast particles of various shapes. Based on prior research [10], it was established that 30 tests are adequate to provide a 95% confidence level for estimating particle tensile strength.
When selecting suitable ballast grains for testing, an initial assessment was performed by placing them naturally on a flat plate. Those unable to maintain self-stability were excluded, as they were likely to shift during loading. The chosen ballast grains were then carefully positioned between two steel plates to ensure a minimized and centralized contact area with the top platen facilitating diametrical compression loading, as shown in Figure 1a. The crushing tests were conducted using a Matest compression testing machine, capable of applying a maximum load of 3000 kN. The distance ( d 0 ) between the two loading platens was measured as the initial height of the ballast before testing. Subsequently, the ballast grain was compressed gradually at a constant rate of 1 mm/min, following the recommendation of Lim et al. [6]. Throughout the compression, the displacement of the top platen and the corresponding force were automatically recorded by transducers connected to it. The entire loading process ceased when the contact force dropped by more than 85% or when noticeable bulk fractures occurred in the grain.
Figure 1b shows a representative loading curve for a ballast particle from the 26–37.5 mm size fraction. Notably, two distinct types of force peaks were observed during the loading process. The initial appearance of the first few peaks was attributed to surface fracture, as highlighted in studies by Nakata et al. [26] and McDowell and Amon [27]. These angular corners in contact with the platens experienced initial abrasion, resulting in a transient force drop during loading. As compaction continued, cracks progressively formed vertically until the ballast ultimately fractured into two or more fragments. This fracture event led to a significant reduction in loading force and marked the conclusion of the tests.
When undergoing compression between two flat platens, the characteristic tensile strength of a particle ( σ f ), can be determined using Equation (1):
σ f = F d f 2
where F represents the loading force at which the particle undergoes bulk fracture, and df is the distance between the two platens at the moment of failure. As demonstrated in prior research by Lim et al. [6], the tensile strength of railway ballast within a specific size fraction follows a Weibull distribution. For a ballast grain subjected to diametrical loading, the survival probability of the particle is described by Equation (2):
P s = e x p [ σ f σ 0 m ]
where m is the Weibull modulus, and σ 0 is the stress level at which the particle has a survival probability of 37%. The calculation of survival probability employs the mean rank position, as given by Equation (3):
P s = 1 i N + 1
where i is the rank position of a ballast grain when the induced peak stresses are sorted in ascending order, N is the total number of ballast grains in the specified size range. Rearranging Equation (2) yields Equation (4), facilitating the determination of the Weibull modulus m and the 37%-tensile strength σ 0 by plotting l n ( l n ( 1 P s ) ) against l n σ f :
ln ln 1 P s = m ln σ f m ln σ 0

2.2. Monotonic Shearing Test

To investigate the impact of particle size grading on the mechanical behavior of ballast, a series of triaxial tests involving monotonic shearing was conducted on ballast aggregates with varying particle size distributions (PSDs) using discrete element modelling (DEM). The numerical simulations were performed in a commercial DEM software, Particle Flow Code 3D (PFC3D, version 6.0), which was developed by the Itasca Group. In PFC3D, particle grains are typically represented as either simple spheres or as clumps with irregular shapes. As extensively documented in previous studies [23,28], the irregular shape of ballast grains has a significant impact on their mechanical behavior. Therefore, for DEM modelling in this context, the clump approach was adopted to generate representations of ballast particles. The morphology of the ballast grains utilized in the single particle crushing tests was obtained using the X-ray scanning apparatus BRUKER SKYSCAN 1275. Subsequently, an image-based method, as proposed by Liu et al. [23], was employed to generate irregularly shaped DEM clump particles that closely resembled the actual ballast grains.
Figure 2 shows five representative ballast clumps along with their corresponding broken fragments in the DEM simulations. Each clump consisted of approximately 27 to 47 sub-pebbles, providing an adequate representation of the irregular shapes observed in real ballast grains. The Wadell’s sphericity S w [29], a shape factor that characterizes how closely a particle resembles a perfect sphere, ranged from 0.61 (indicating less sphericity) to 0.94 (indicating highly sphericity) for the examined ballast grains.
A linear contact model was employed in the current DEM analysis. The relevant microscopic parameters, as listed in Table 1, were inherited from previous studies by the authors [30,31] and are detailed in Table 1. In this study, a total of six different PSDs (Figure 3) were considered, with three of them being non-uniformly distributed (referred to as Grading A, B, and C), and the remaining three were uniformly distributed with mono-sizes (referred to as Grading D, E, and F). Notably, the PSD of Grading A was in compliance with the Chinese Standard of Railway Ballast (TB/T 2140-2008). Grading B had a parallel PSD to Grading A but with a larger maximum particle size of 32.5 mm. In contrast, Grading C exhibited a wider PSD range, with particle sizes ranging from 2 to 65 mm. The three uniform-distributed gradings (Grading D, E, and F) had particle sizes identical to the d 50 values of Grading A, B, and C, respectively.
The specimens prepared for triaxial shearing had dimensions of 300 mm in diameter and 600 mm in height, as shown in Figure 3. The aggregates were prepared by scaling and replicating irregularly-shaped ballast clumps within the chamber to achieve the desired PSD. Despite the differences in PSDs, all tested specimens were initially controlled to have the same porosity level ( n 0 = 0.43 ) during preparation. This porosity value is close to the ballast aggregates in the track field [32]. Subsequently, the specimens were isotropically consolidated under three different consolidation pressures: 10 kPa, 30 kPa, and 60 kPa. In reality, the stress level applied onto ballast aggregates varies, depending on various factors such as the depth of ballast, the wheel loads of passing trains, whether a confining wall is constructed, etc. By referring to those used in the laboratory experiments on ballast [33], the three consolidation pressures used in the present study represented a low to medium level of stress encountered in the ballasted tracks. After consolidation, the specimens were subjected to shearing by moving the two horizontal platens at a constant rate of 1 mm/s until the shear strain ε 1 reached 15%. Throughout the shearing process, the cylindrical walls were servo-controlled to maintain a constant confining pressure. The shear stresses were determined by measuring and recording the contact forces acting on the platens. A total of 18 samples were prepared for monotonic shearing. The test program is summarized in Table 2.

3. Results and Discussions

3.1. The Effect of Particle Size

The relationships between l n ( l n ( 1 P s ) ) and l n σ f for the four size fractions are displayed in Figure 4. The σ 0 and the Weibull modulus m, represented as the slope of the fitted line for each size fraction are also provided in Figure 4. It is evident that the tensile strengths of ballast grains from the four different size fractions generally adhere to the Weibull distribution. Larger ballast grains exhibited lower tensile strength, likely attributable to the presence of greater internal flaws. This observation is consistent with prior research on the strength of railway ballast [6,11].
By assessing the strengths of various sands and rock materials in tension failure, Lee [34] established that σ f was a function of grain size d as described in Equation (5). The values of b varied depending on the grain materials, with reported values of −0.357, −0.343, and −0.420 for the tested Leighton Buzzard sand, oolitic limestone, and carboniferous limestone, respectively. Utilizing Weibull statistics, McDowell and Amon [27] demonstrated that σ 0 of soil grains was approximately equal to σ f and was proportional to d 3 / m . Building upon this work, Lim et al. [6] found that values of 2 / m were more suitable for railway ballast compared to 3 / m , likely due to the surface fracture characteristics observed in railway ballast. Al-Saoudi and Hassan [11] obtained values of b ranging between 1.5 / m and 2 / m for two types of railway ballast. The relationship between σ 0 and the average particle size at failure for each size fraction in our current study is shown in Figure 5 and it can be described by Equation (6). The value of b was determined to be −0.47, which approximated to the value of 1.1 / m with m equal to 2.35 for the tested latite basalt.
σ f d b
σ 0 = 84.59 d f 0.47

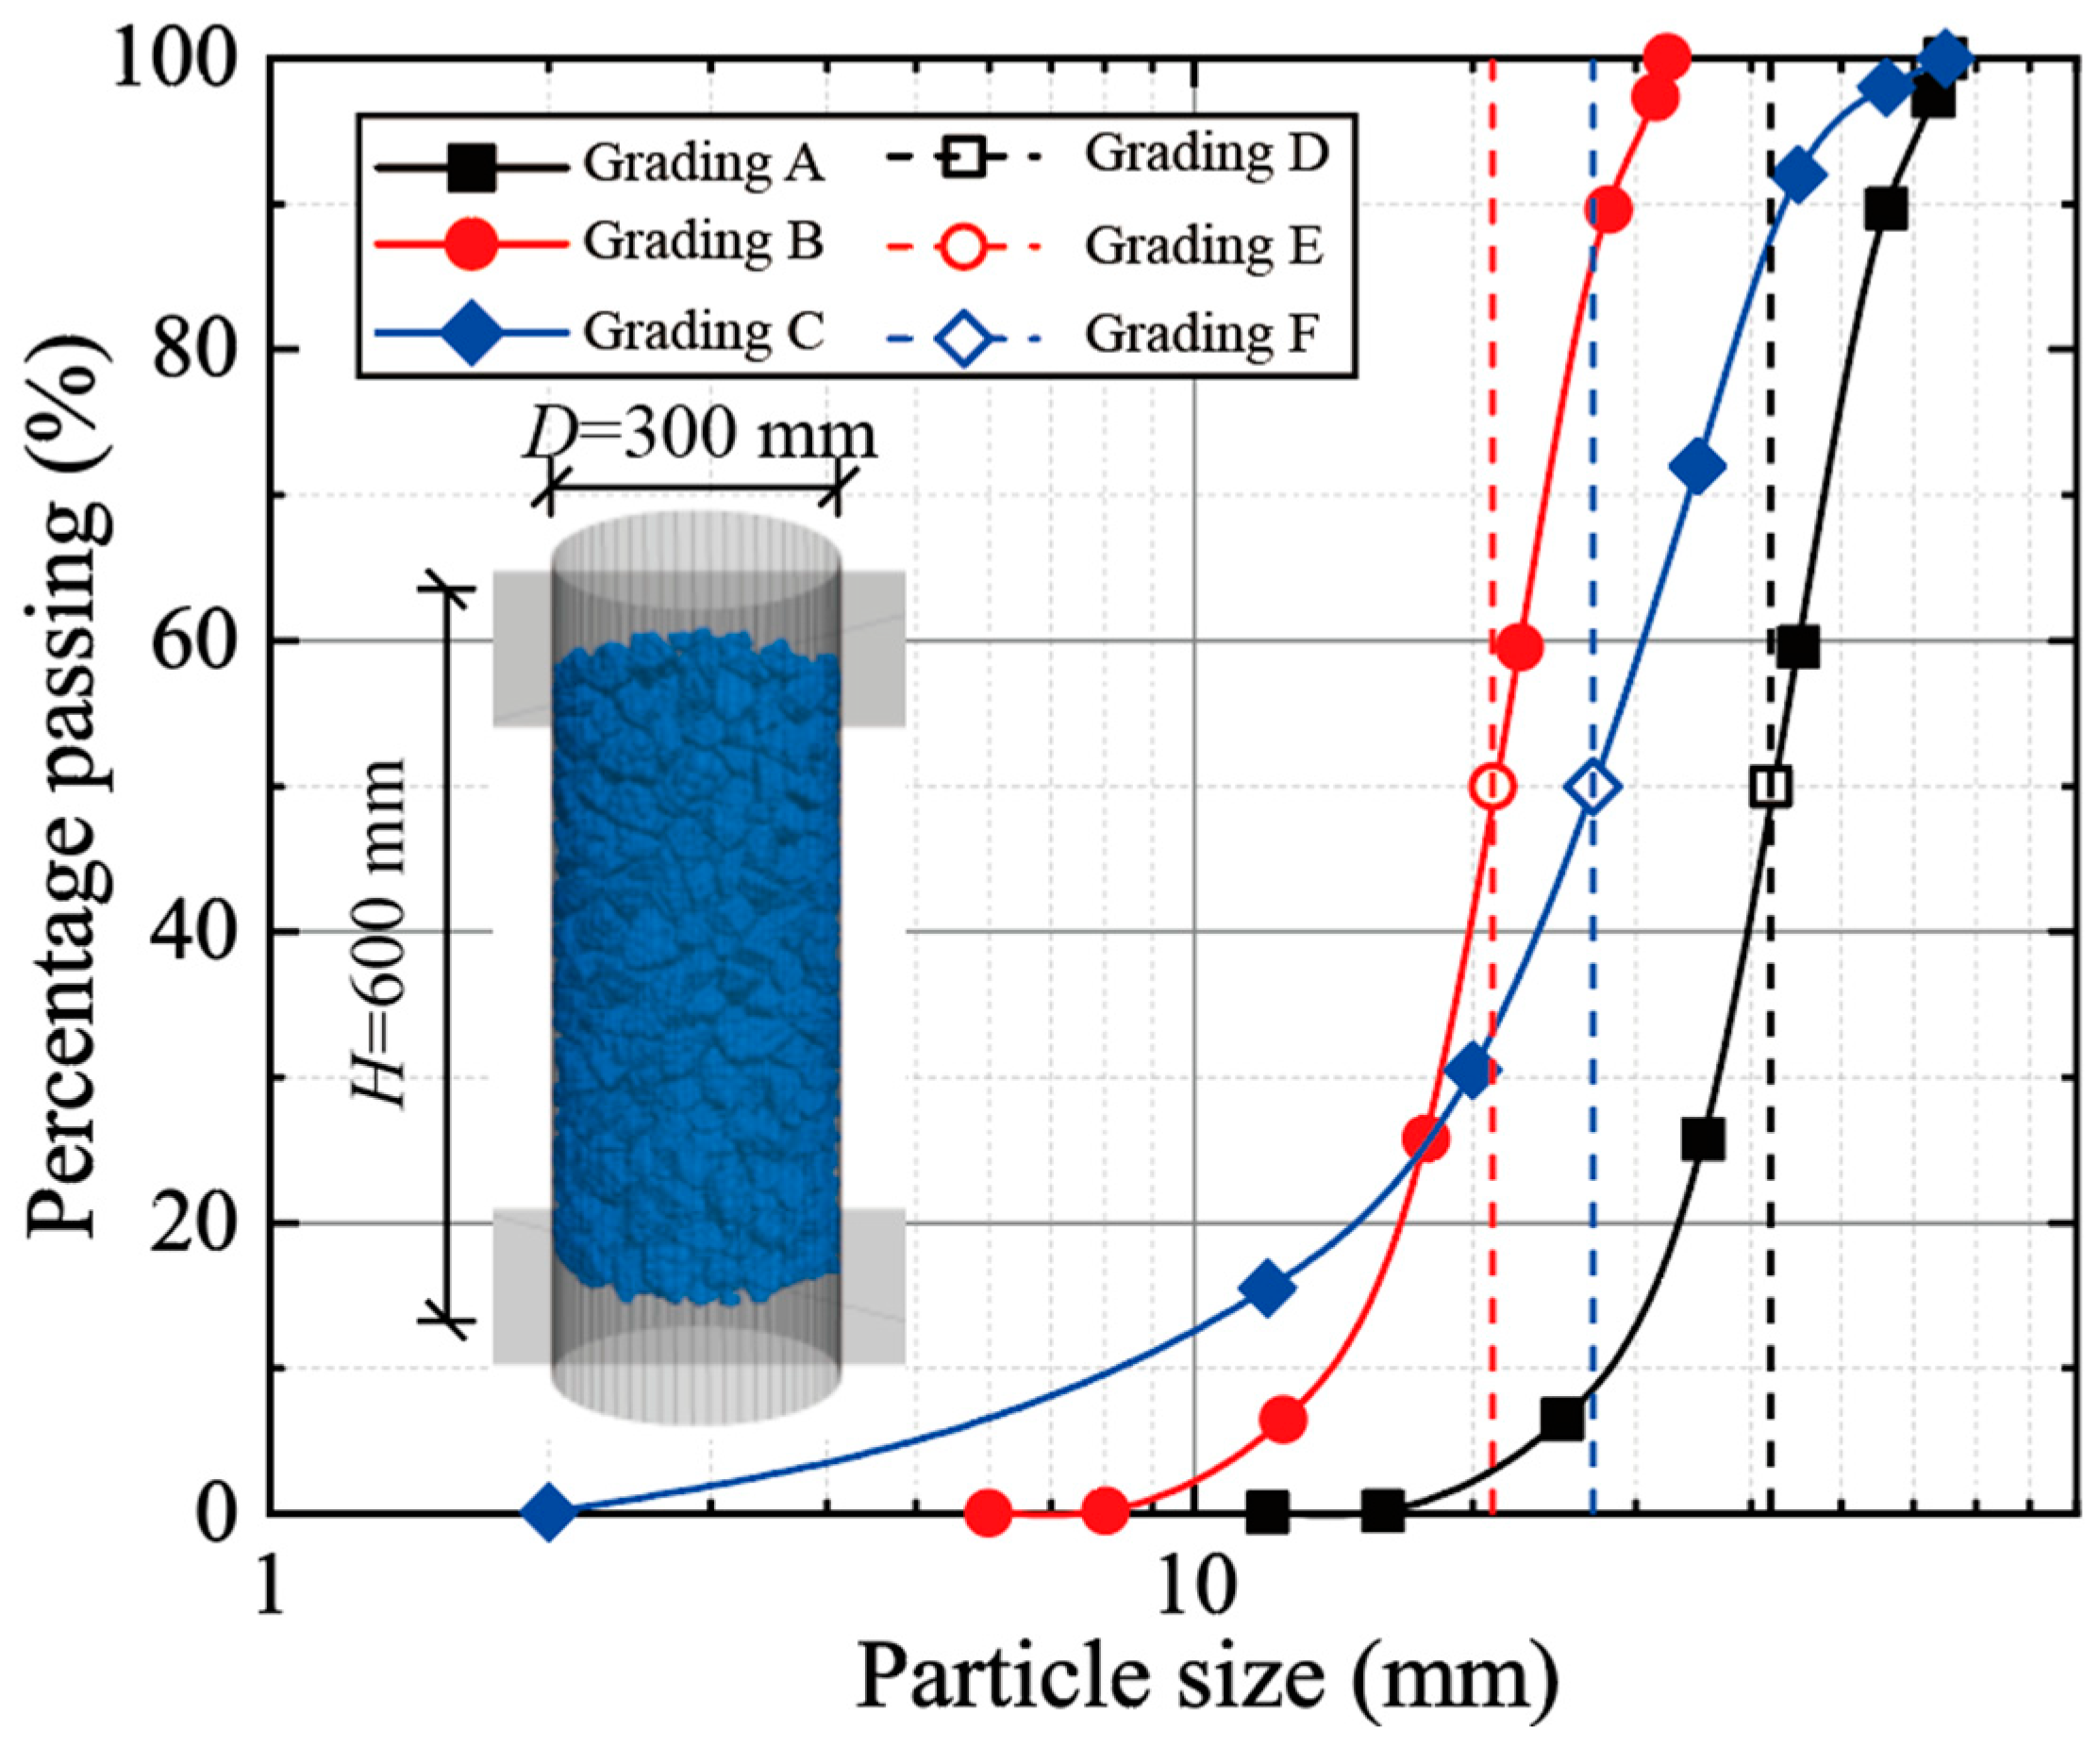
3.2. The Effect of Particle Grading

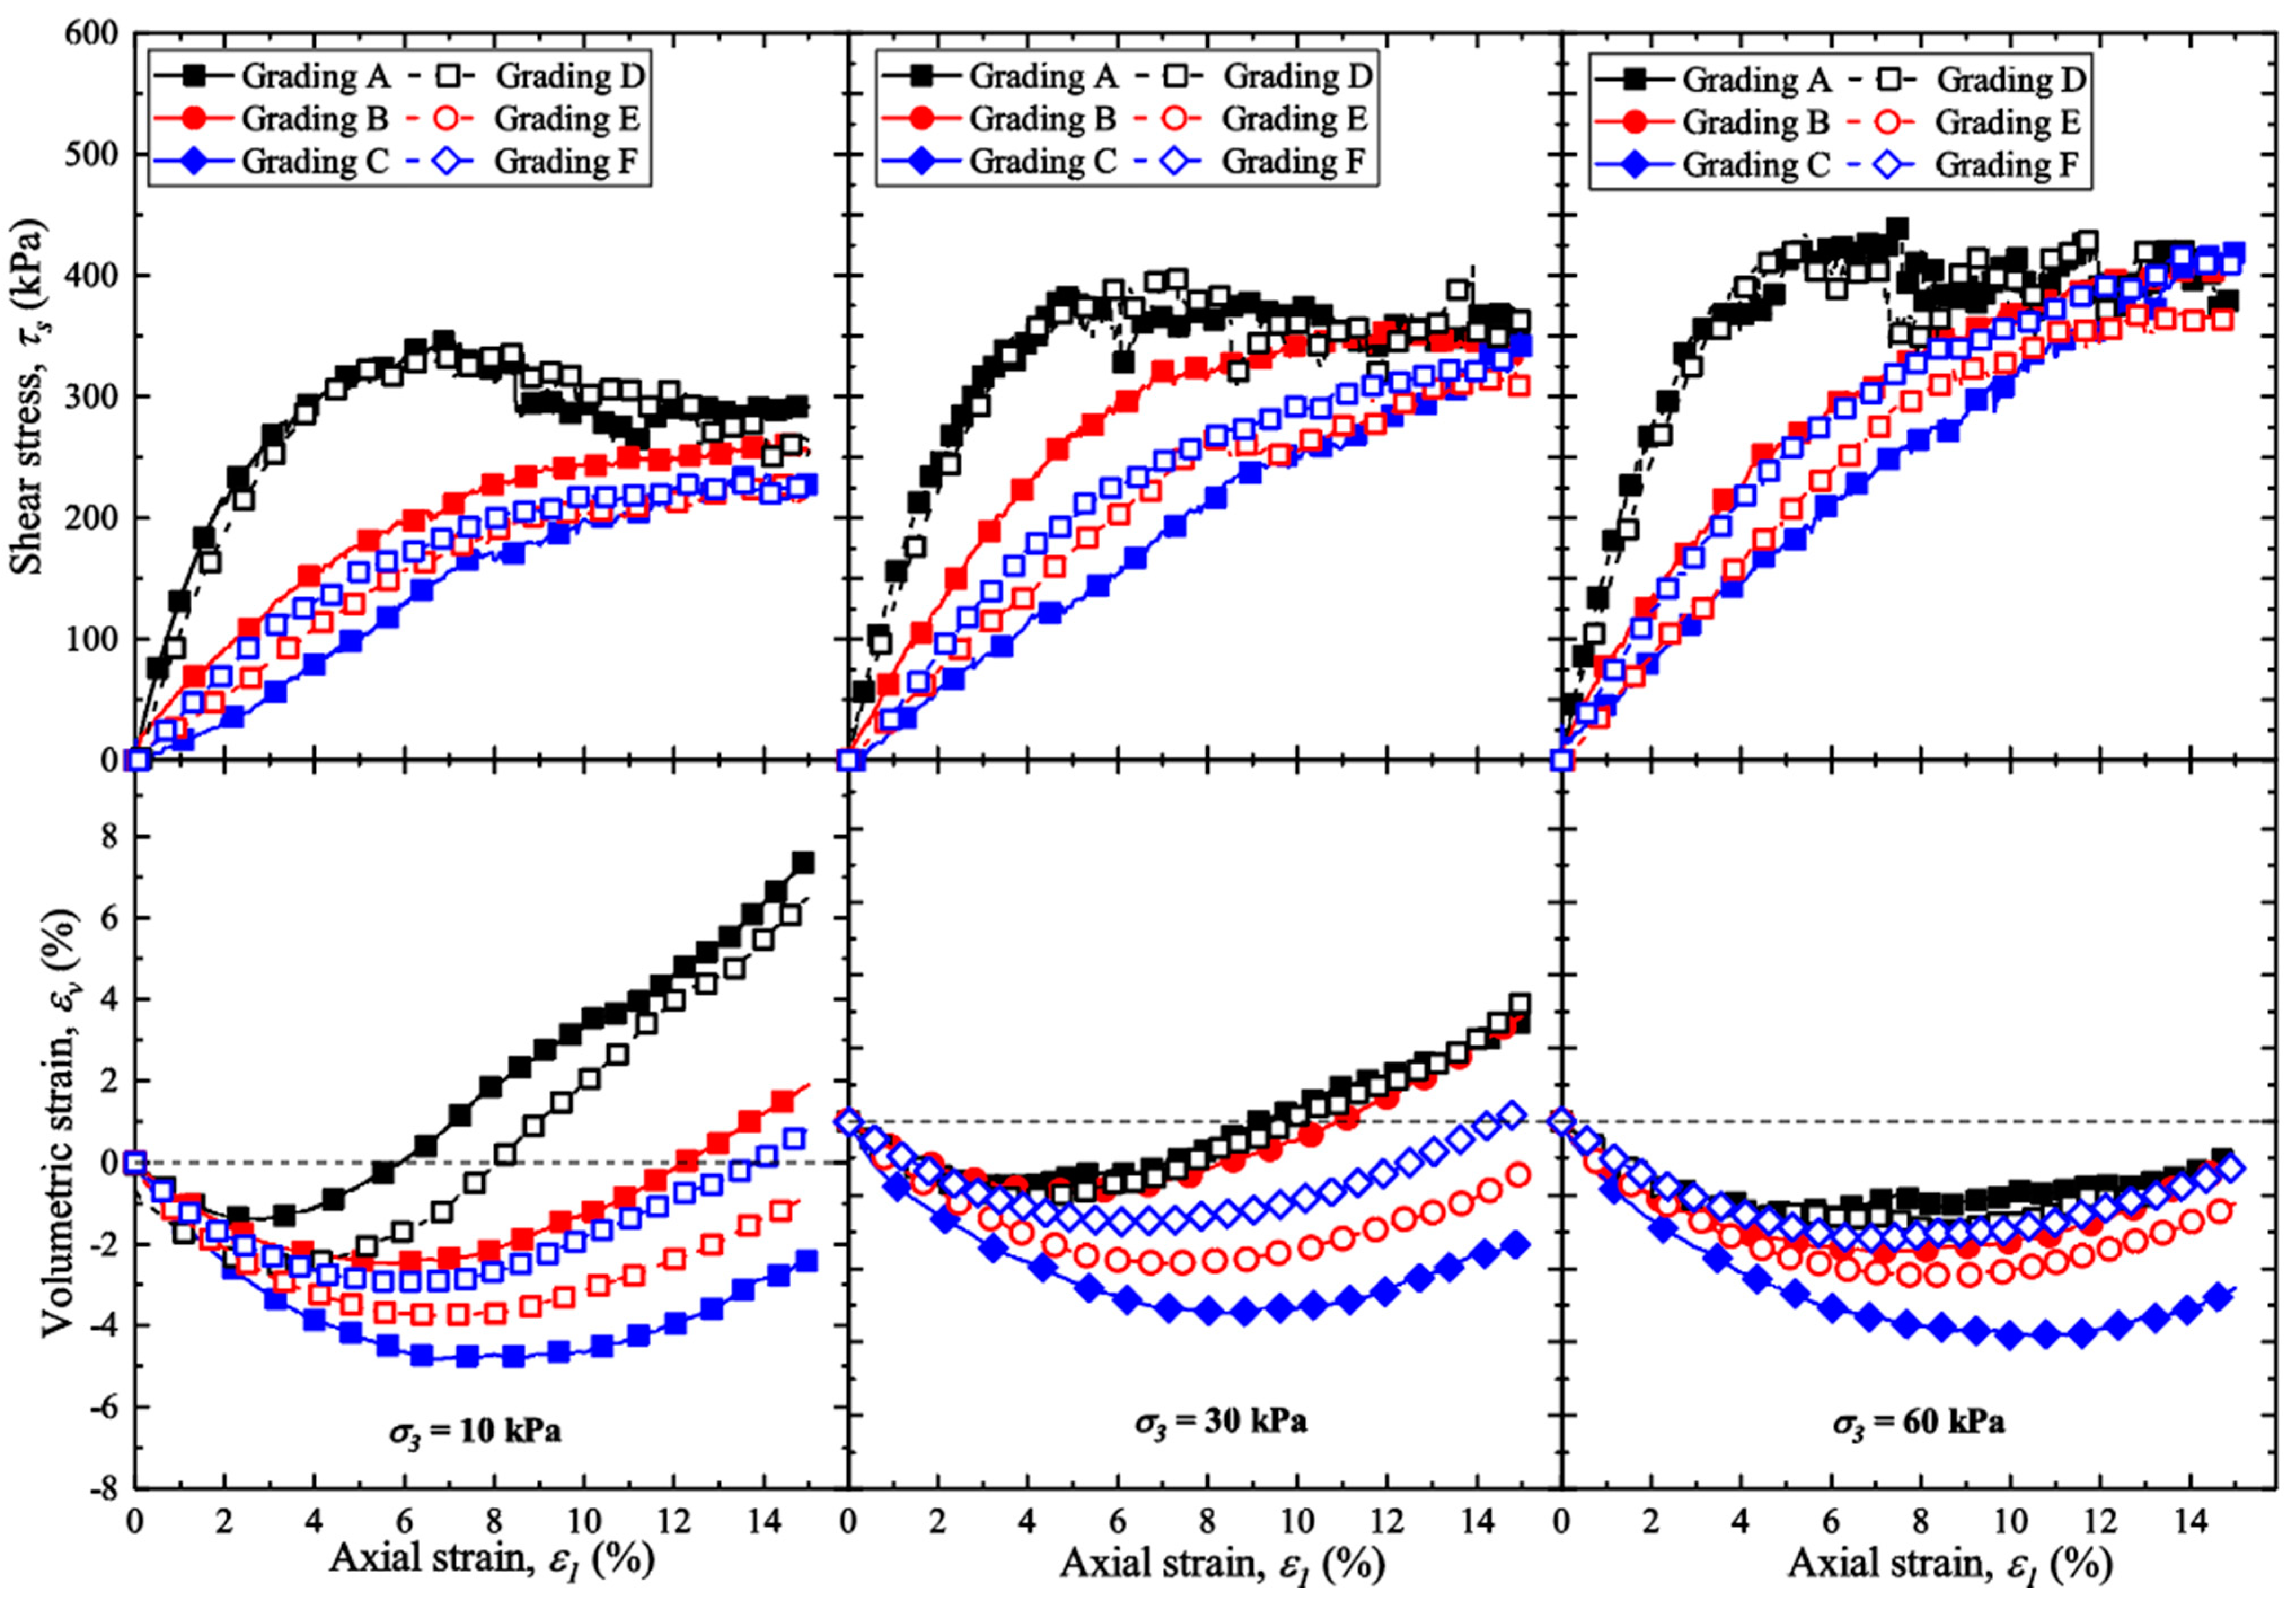
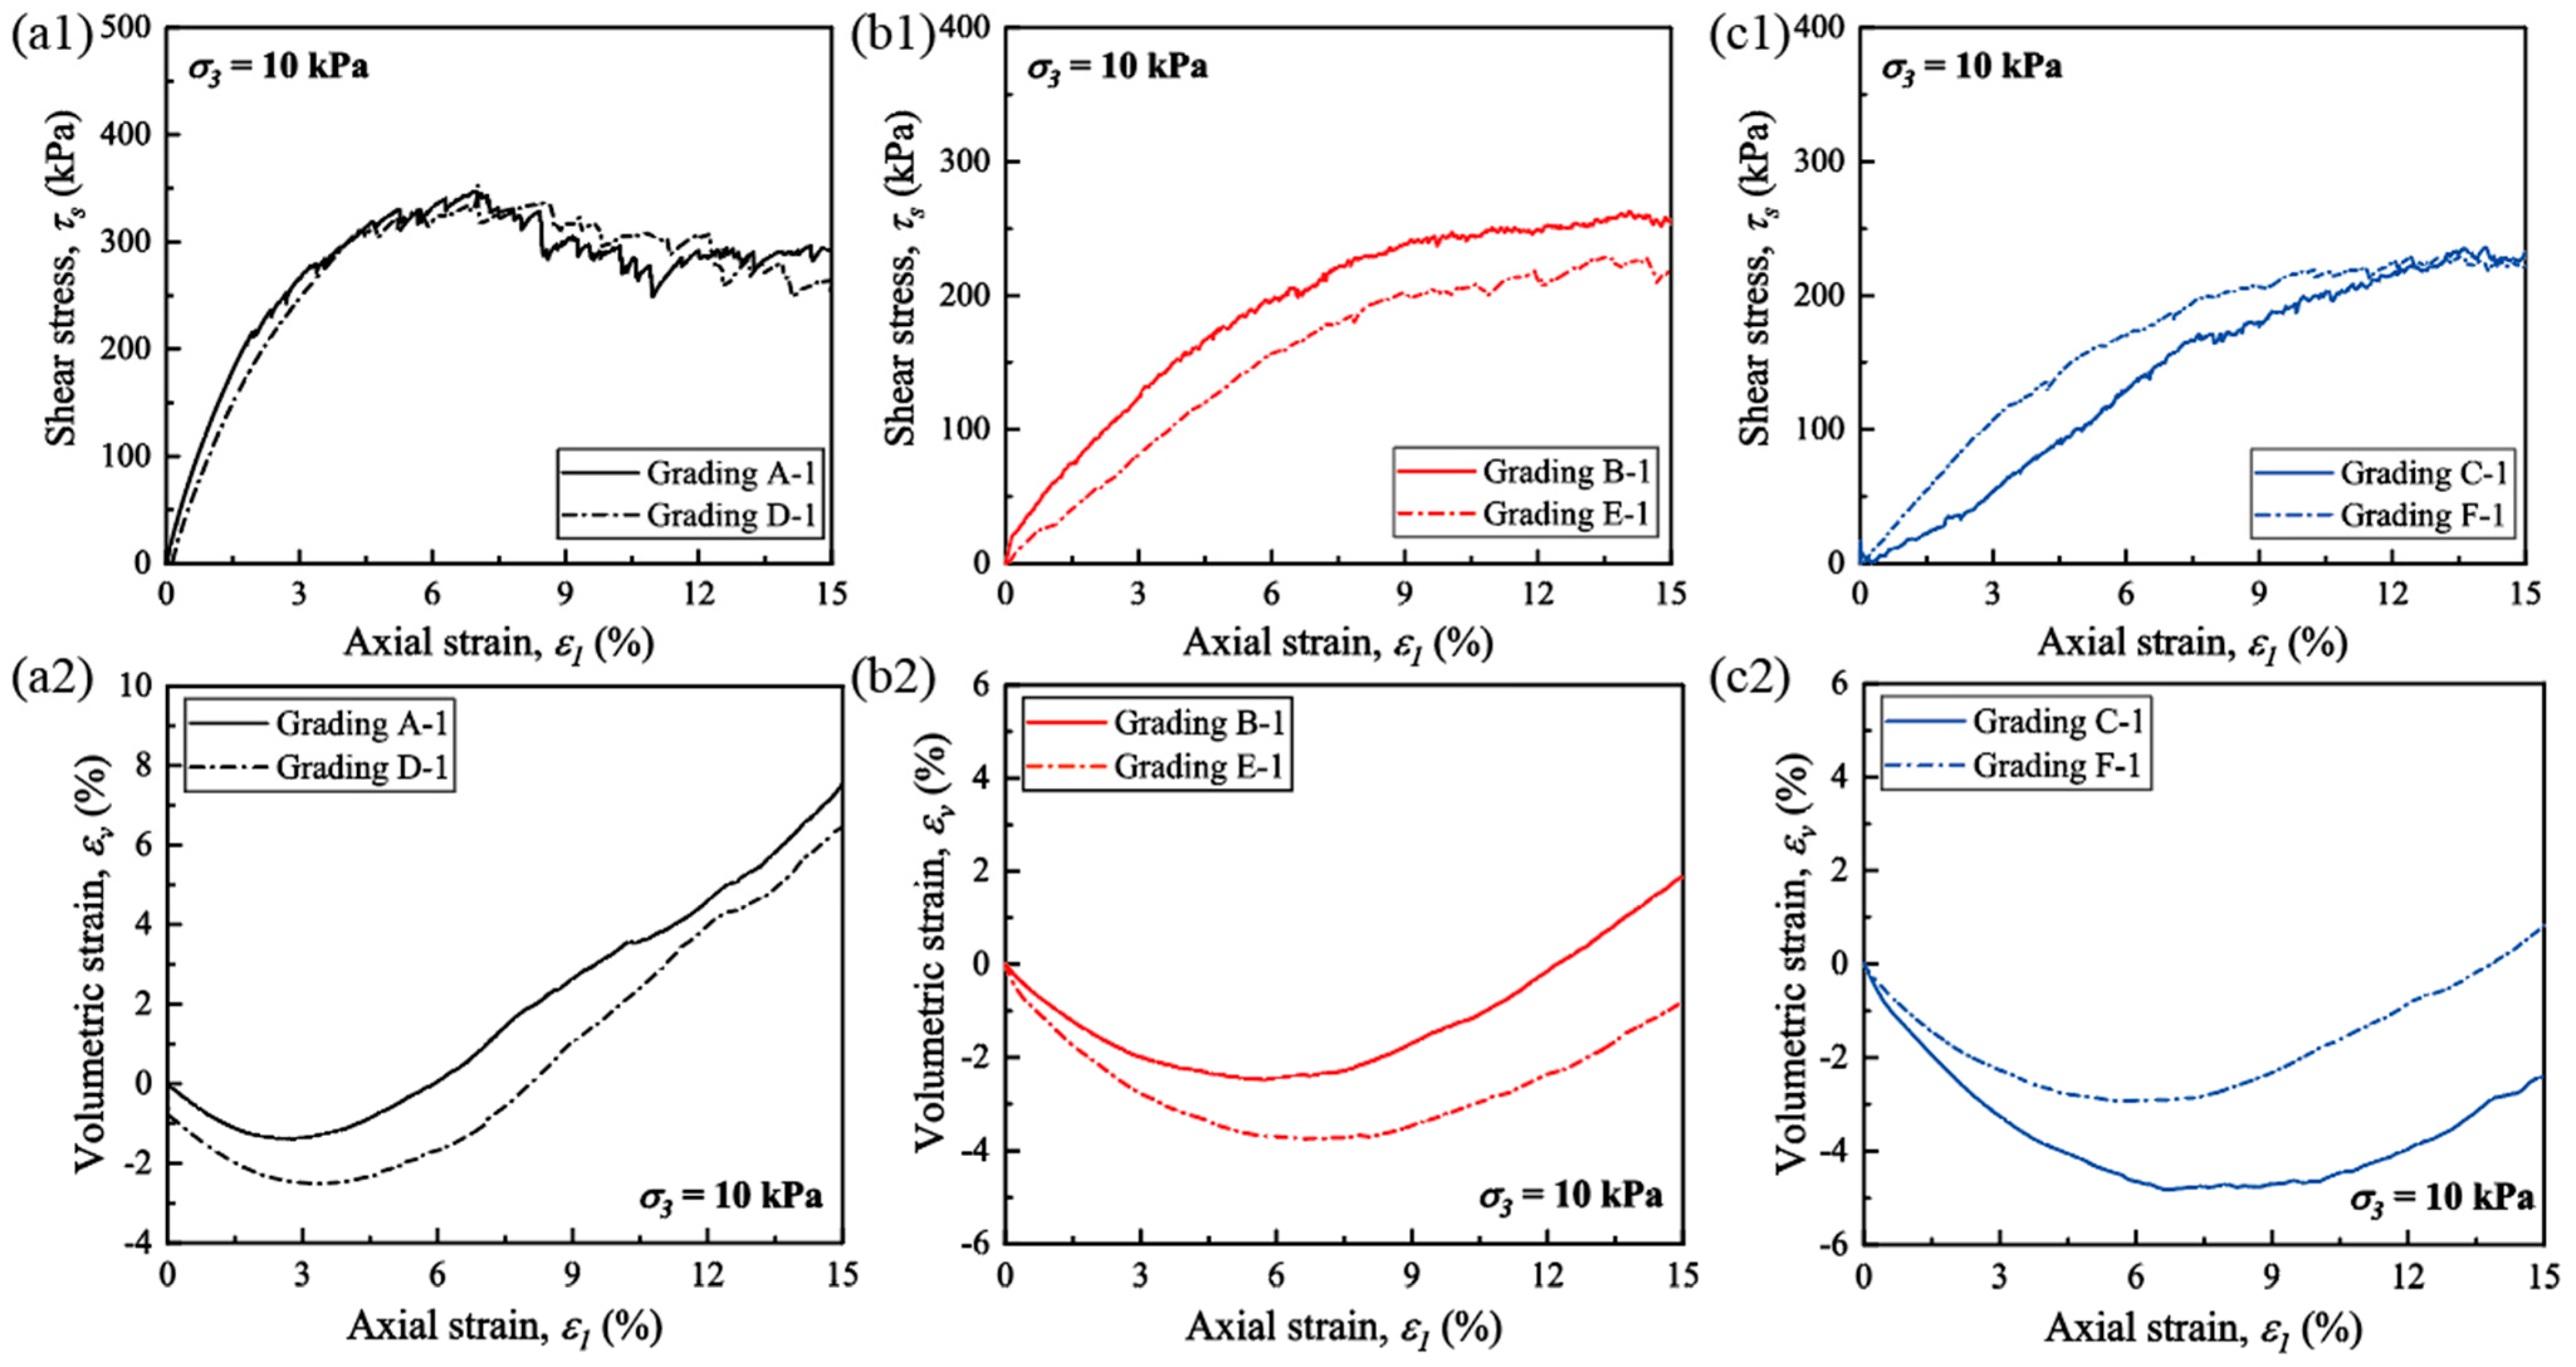
3.2.1. Shear Stress and Volumetric Deformation

Figure 6 shows the shear response of ballast aggregates with various PSDs under different confining pressures. As expected, the shear stress ( τ s ) of all the examined aggregates increased while the volumetric strain ( ε v ) decreased with the increase of σ 3 . It can be observed that the shear stress ( τ s ) for Grading A and its d50-equivalent Grading D first peaked at an axial strain ( ε 1 ) of approximately 6% and then decreased to its residual strength as shearing progressed. In contrast, there was no clear strain-softening observed in the remaining aggregates within the specified axial strain range. The volumes of the aggregates underwent initial contraction followed by continuous dilation until the end of shearing. These observations are consistent with existing studies on ballast [35,36,37].
Figure 7 shows the shear response of three non-uniformly distributed and three uniformly distributed aggregates under a confining pressure of σ 3 = 10   k P a . It is worth noting that for the three aggregates with non-uniformly distributed gradings (Grading A, B, and C), Grading A, which is currently utilized in the prevailing standards, exhibited a notably higher peak shear stress at around 350 kPa compared to that of around 250 kPa and 220 kPa observed in its counterpart, Grading B and Grading C, respectively, which had broader particle size distribution ranges. This difference in behavior can be attributed to the presence of a larger number of small particles in Grading B and Grading C, which acted as lubricants, facilitating the sliding of larger particles. As a result, this lubricating effect of small particles on shear strength and aggregate volume dilation was corroborated in prior research [22,38]. As for the three uniformly-distributed aggregates (Grading D, E, and F), it is evident that aggregates with larger particle sizes obtained greater shear stress and volumetric dilation. This is probably because larger particles could form a stronger skeleton to withstand external shearing, thereby exhibiting greater shear resistance. Additionally, in aggregates comprised of larger particles, those particles need to produce greater relative displacement (both translational and rotational) when subjected to shearing, leading to a larger volume dilation.
To further investigate the influence of particle distribution uniformity on the shear response of ballast aggregates, the evolution of shear stress and volumetric strain for non-uniformly distributed aggregates and their d50-equivalent uniformly distributed counterparts was depicted as in Figure 8. In general, non-uniformly distributed aggregates exhibited greater shear strength and volumetric dilation compared to their d50-equivalent uniformly distributed counterparts, with the exception of Grading C and Grading F. In the case of Grading C, where there was an increasing presence of small fines within the aggregates, the movement of larger particles became facilitated as they were lubricated by these smaller particles filling the voids within the ballast skeleton. Consequently, this led to a lower shear resistance and greater volume contraction during shearing for this particular aggregate.

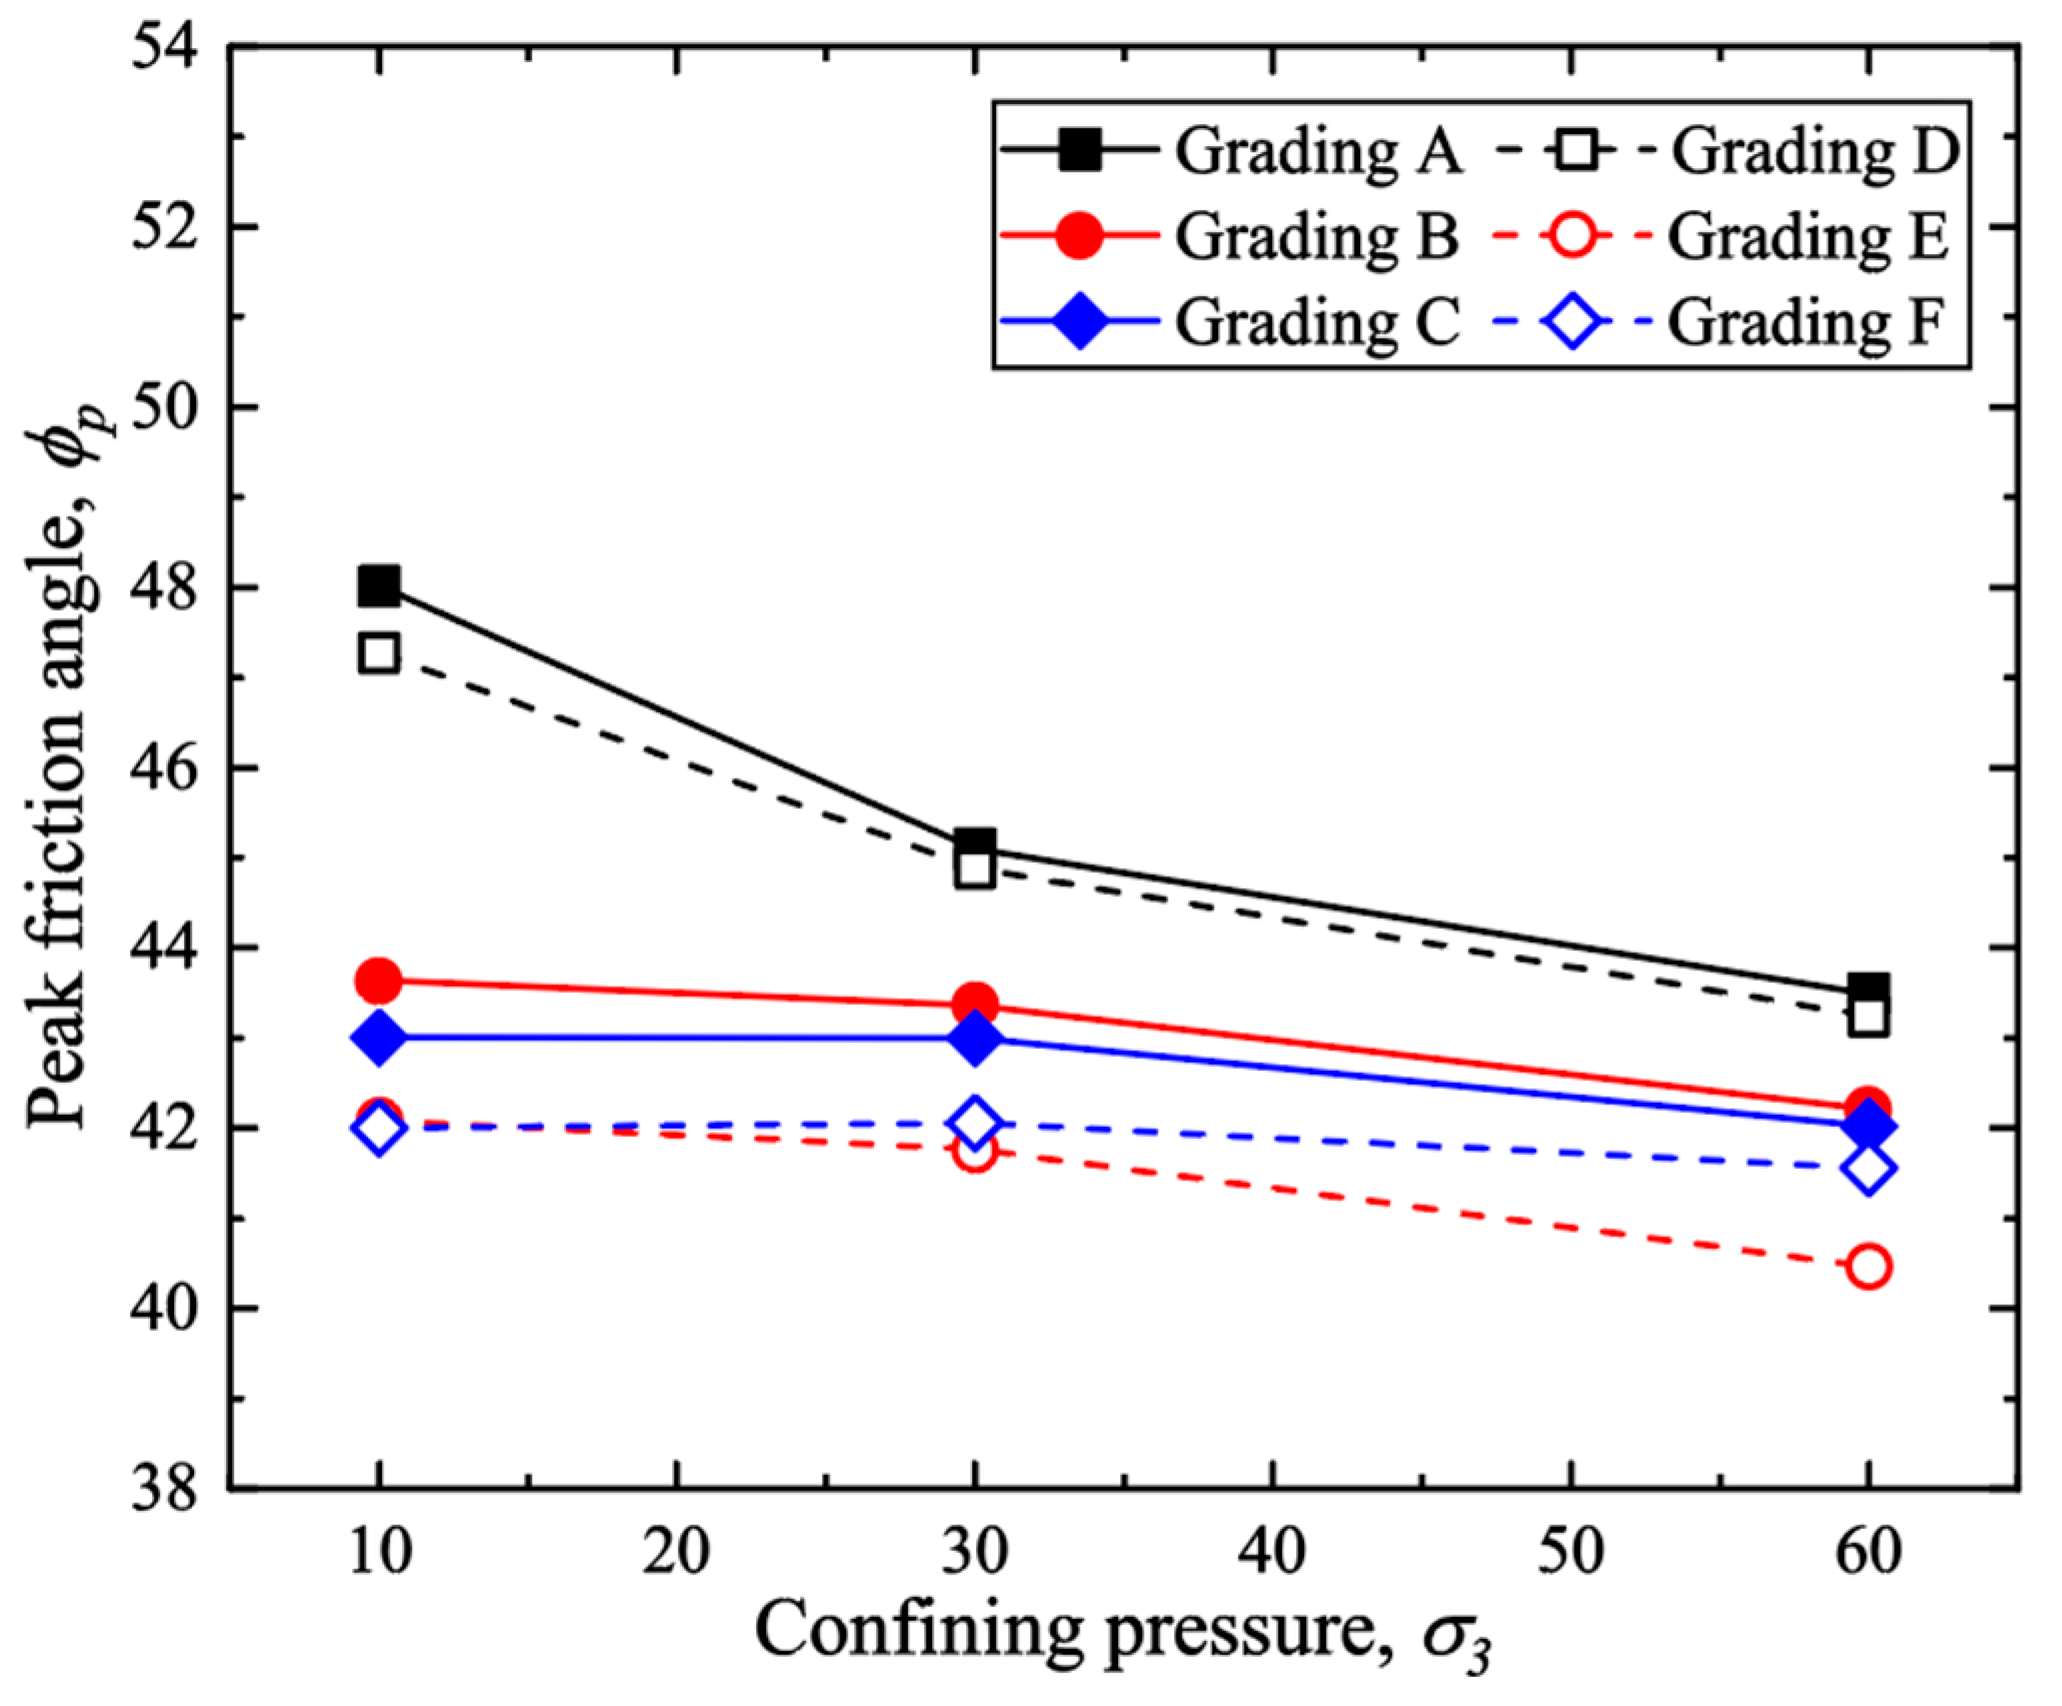
3.2.2. Peak Friction Angle

Figure 9 shows the peak friction angle ( ϕ p ) of aggregates with different gradings under varying confining pressures. Among all the examined aggregates, the Grading A type aggregate exhibited the greatest value of ϕ p at around 48° among all the examined aggregates. The ϕ p of Grading D type aggregate was smaller than that of Grading A, which had an equivalent d50 to that of Grading D. In addition, it was seen that the ϕ p of non-uniformly distributed aggregates were relatively greater than that of their mono-sized d50 -equivalent uniformly distributed aggregates. Despite having a wider PSD, the ϕ p of Grading C type aggregate was lower with a value of around 43°, compared to that of 43.7° for Grading B type one. For the three mono-sized aggregates (Grading D, E, and F), it was seen that the ϕ p of the aggregate decreased with particle size.

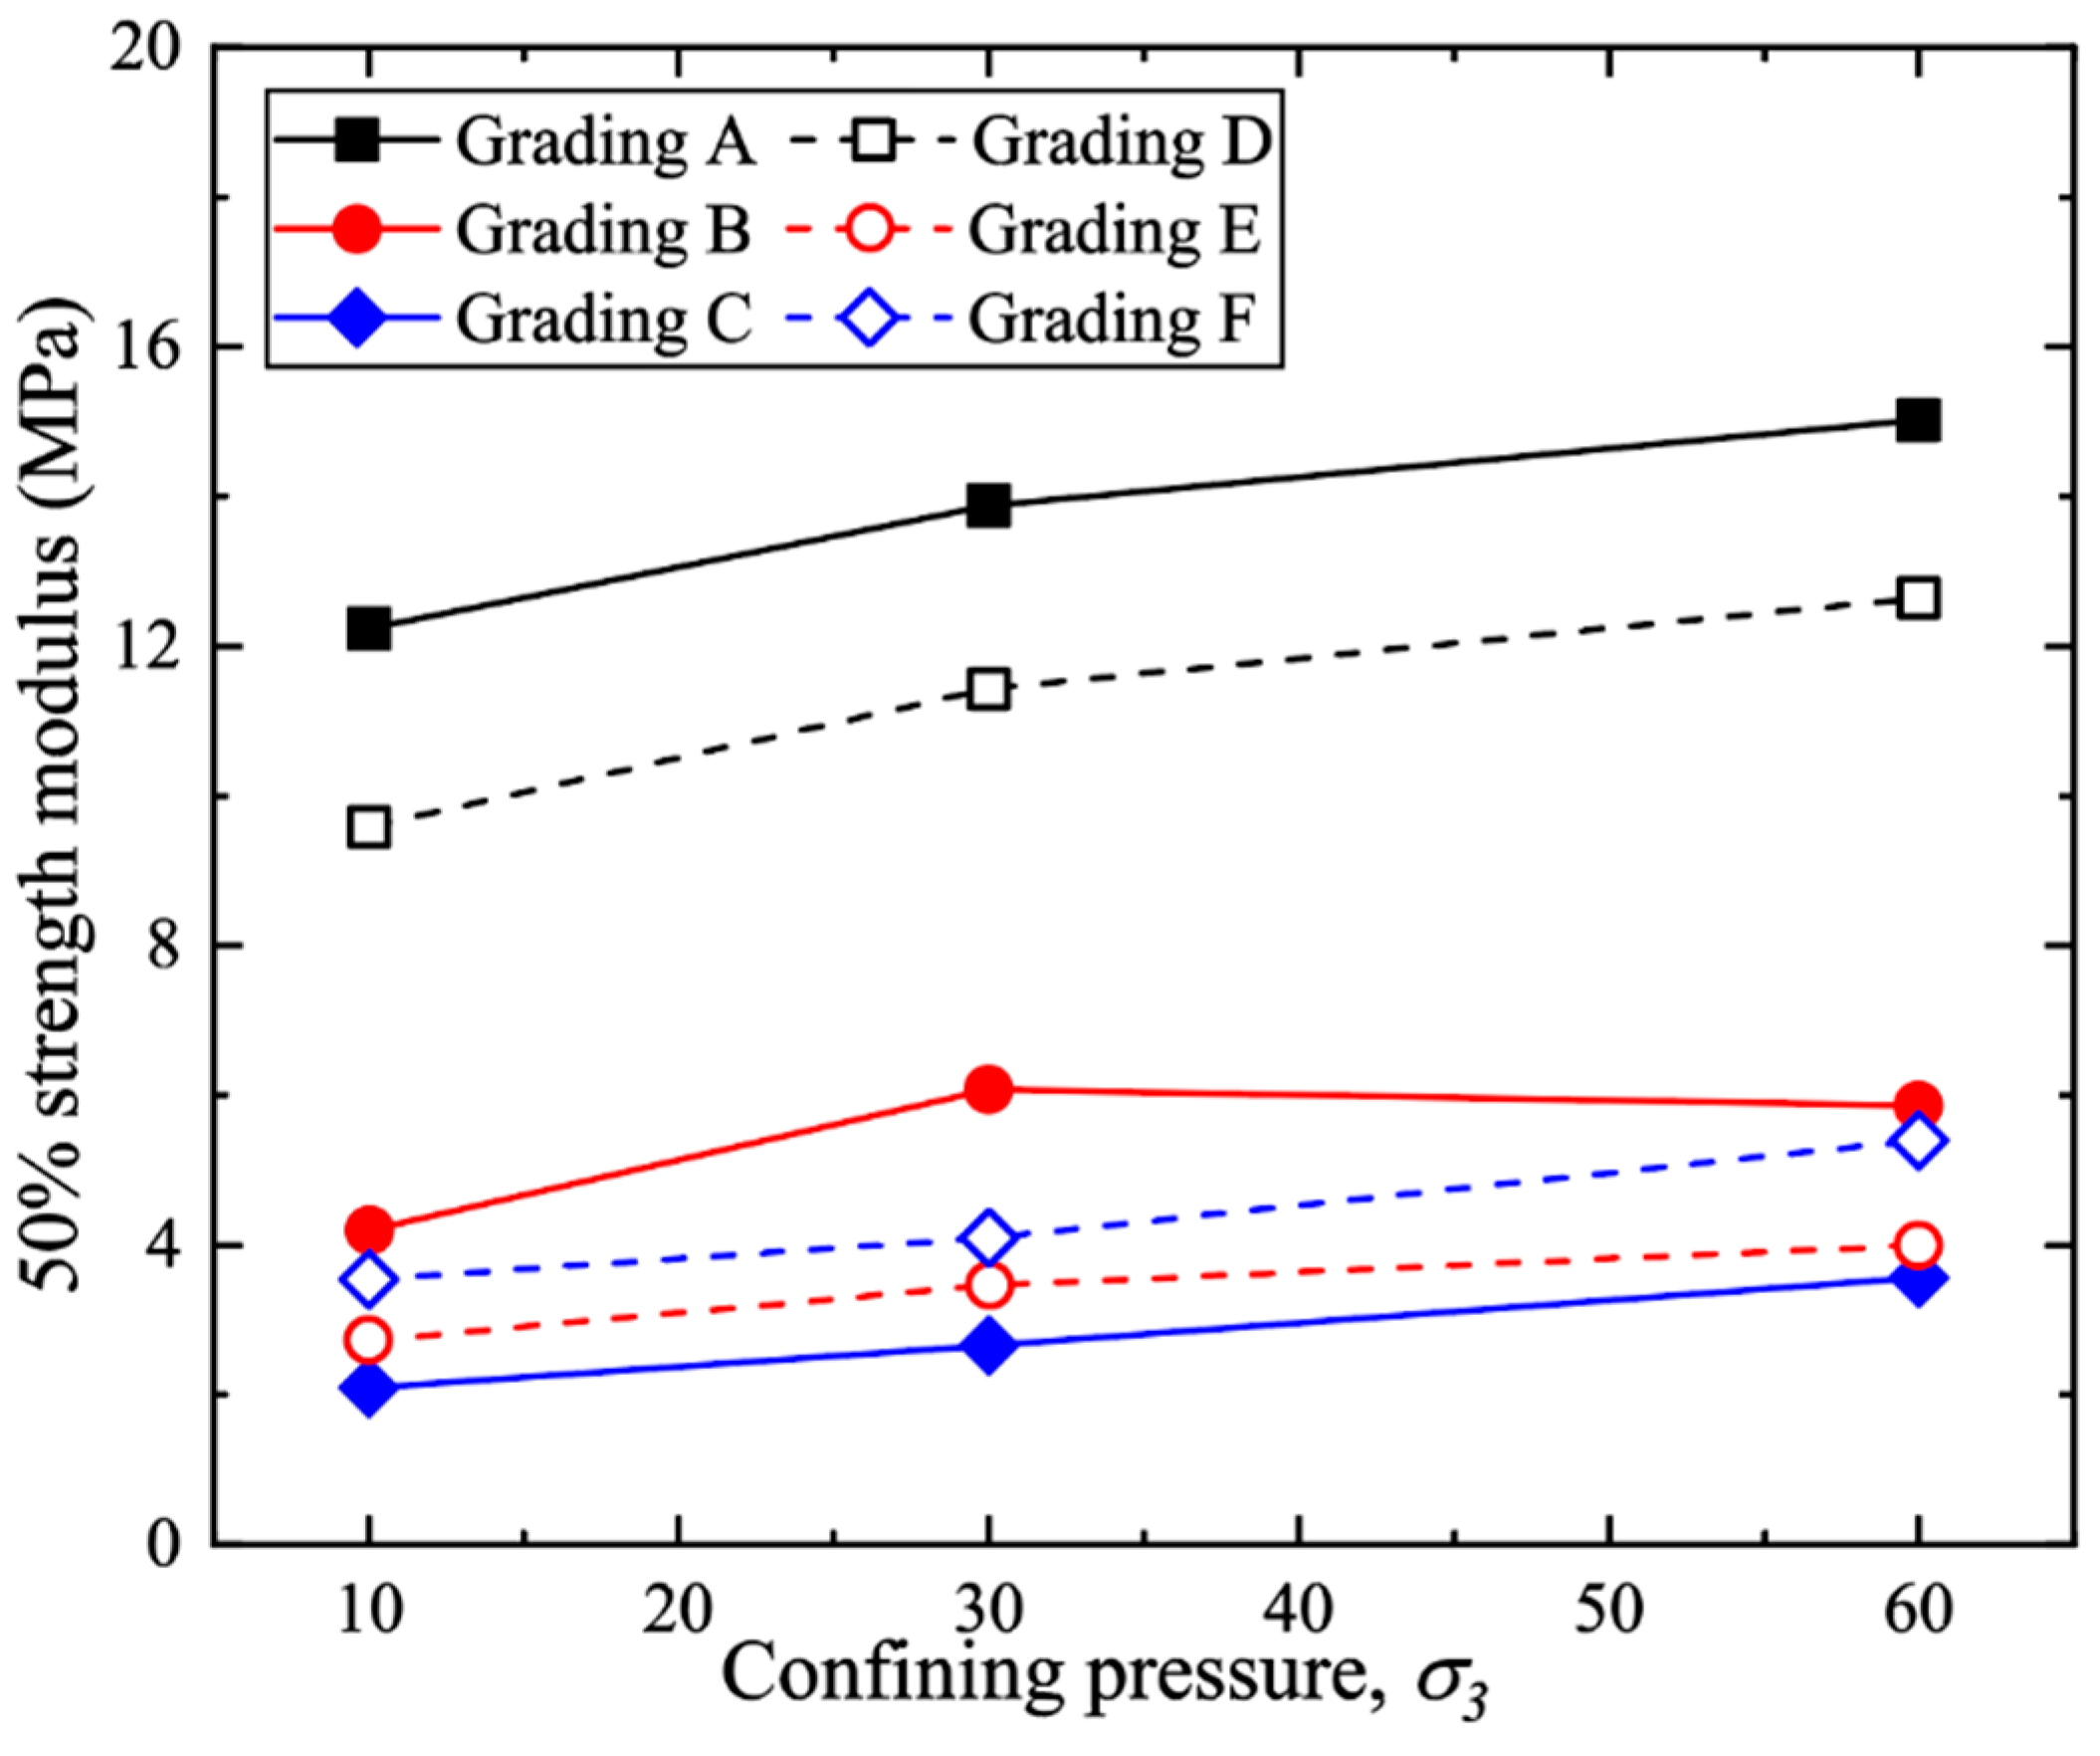
3.2.3. Shear Modulus

Figure 10 shows the 50% strength modulus of aggregates with different gradings under varying confining pressures. In this context, the 50% strength modulus represents the slope of the line drawn from the origin to the point on the stress–strain curve where 50% of the ultimate strength is reached [39]. As the confining pressure ( σ 3 ) increased, the 50% strength modulus exhibited a slight, expected increase across all aggregates. For example, the Grading A type aggregate exhibited a 50% strength modulus of 12 MPa at σ 3 = 10 kPa, while this value increased to around 15 MPa when the confining pressure was raised to 60 kPa. This can be attributed to enhanced particle interlocking and reduced volume dilation as the confining pressure rises. Interestingly, the 50% strength modulus of the non-uniformly distributed aggregates generally exceeded that of their d50-equivalent aggregates, with the exception of Grading C, which possessed the lowest 50% strength modulus of around 3 MPa among all the examined specimens. Overall, it can be concluded that ballast aggregates conforming to the recommended PSD, i.e., Grading A as per current standards, exhibited superior mechanical performance compared to the other gradings.

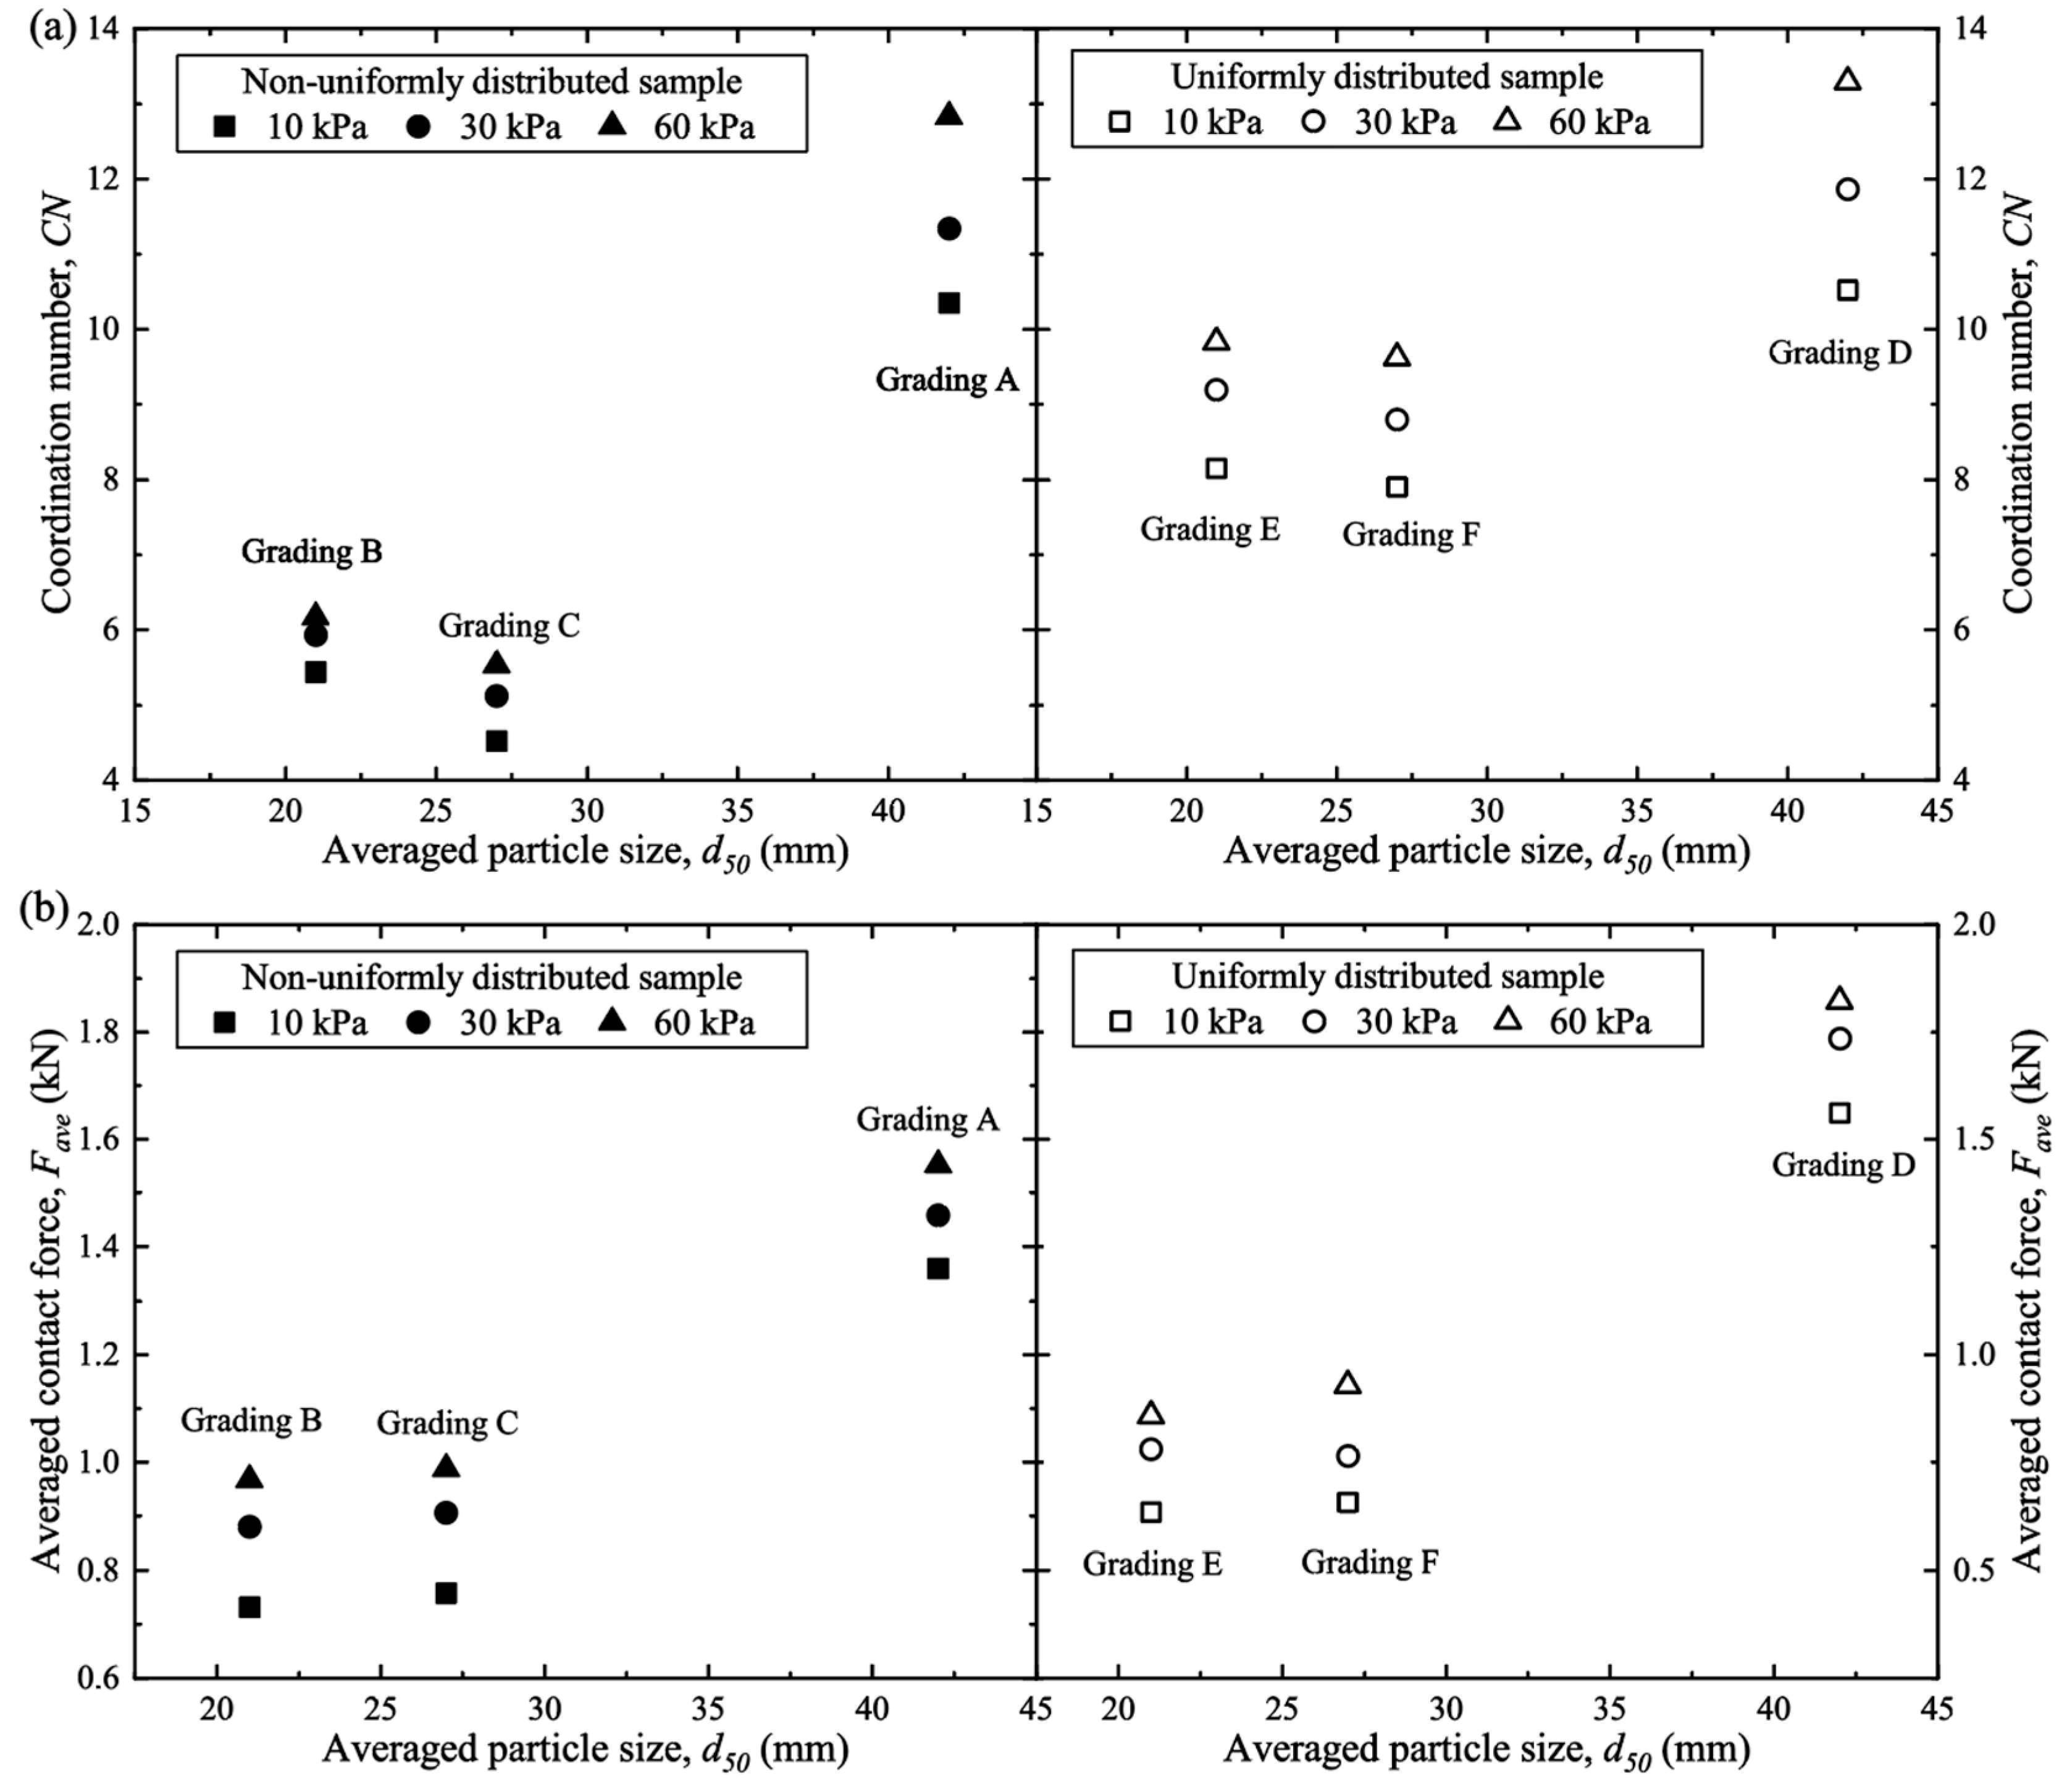
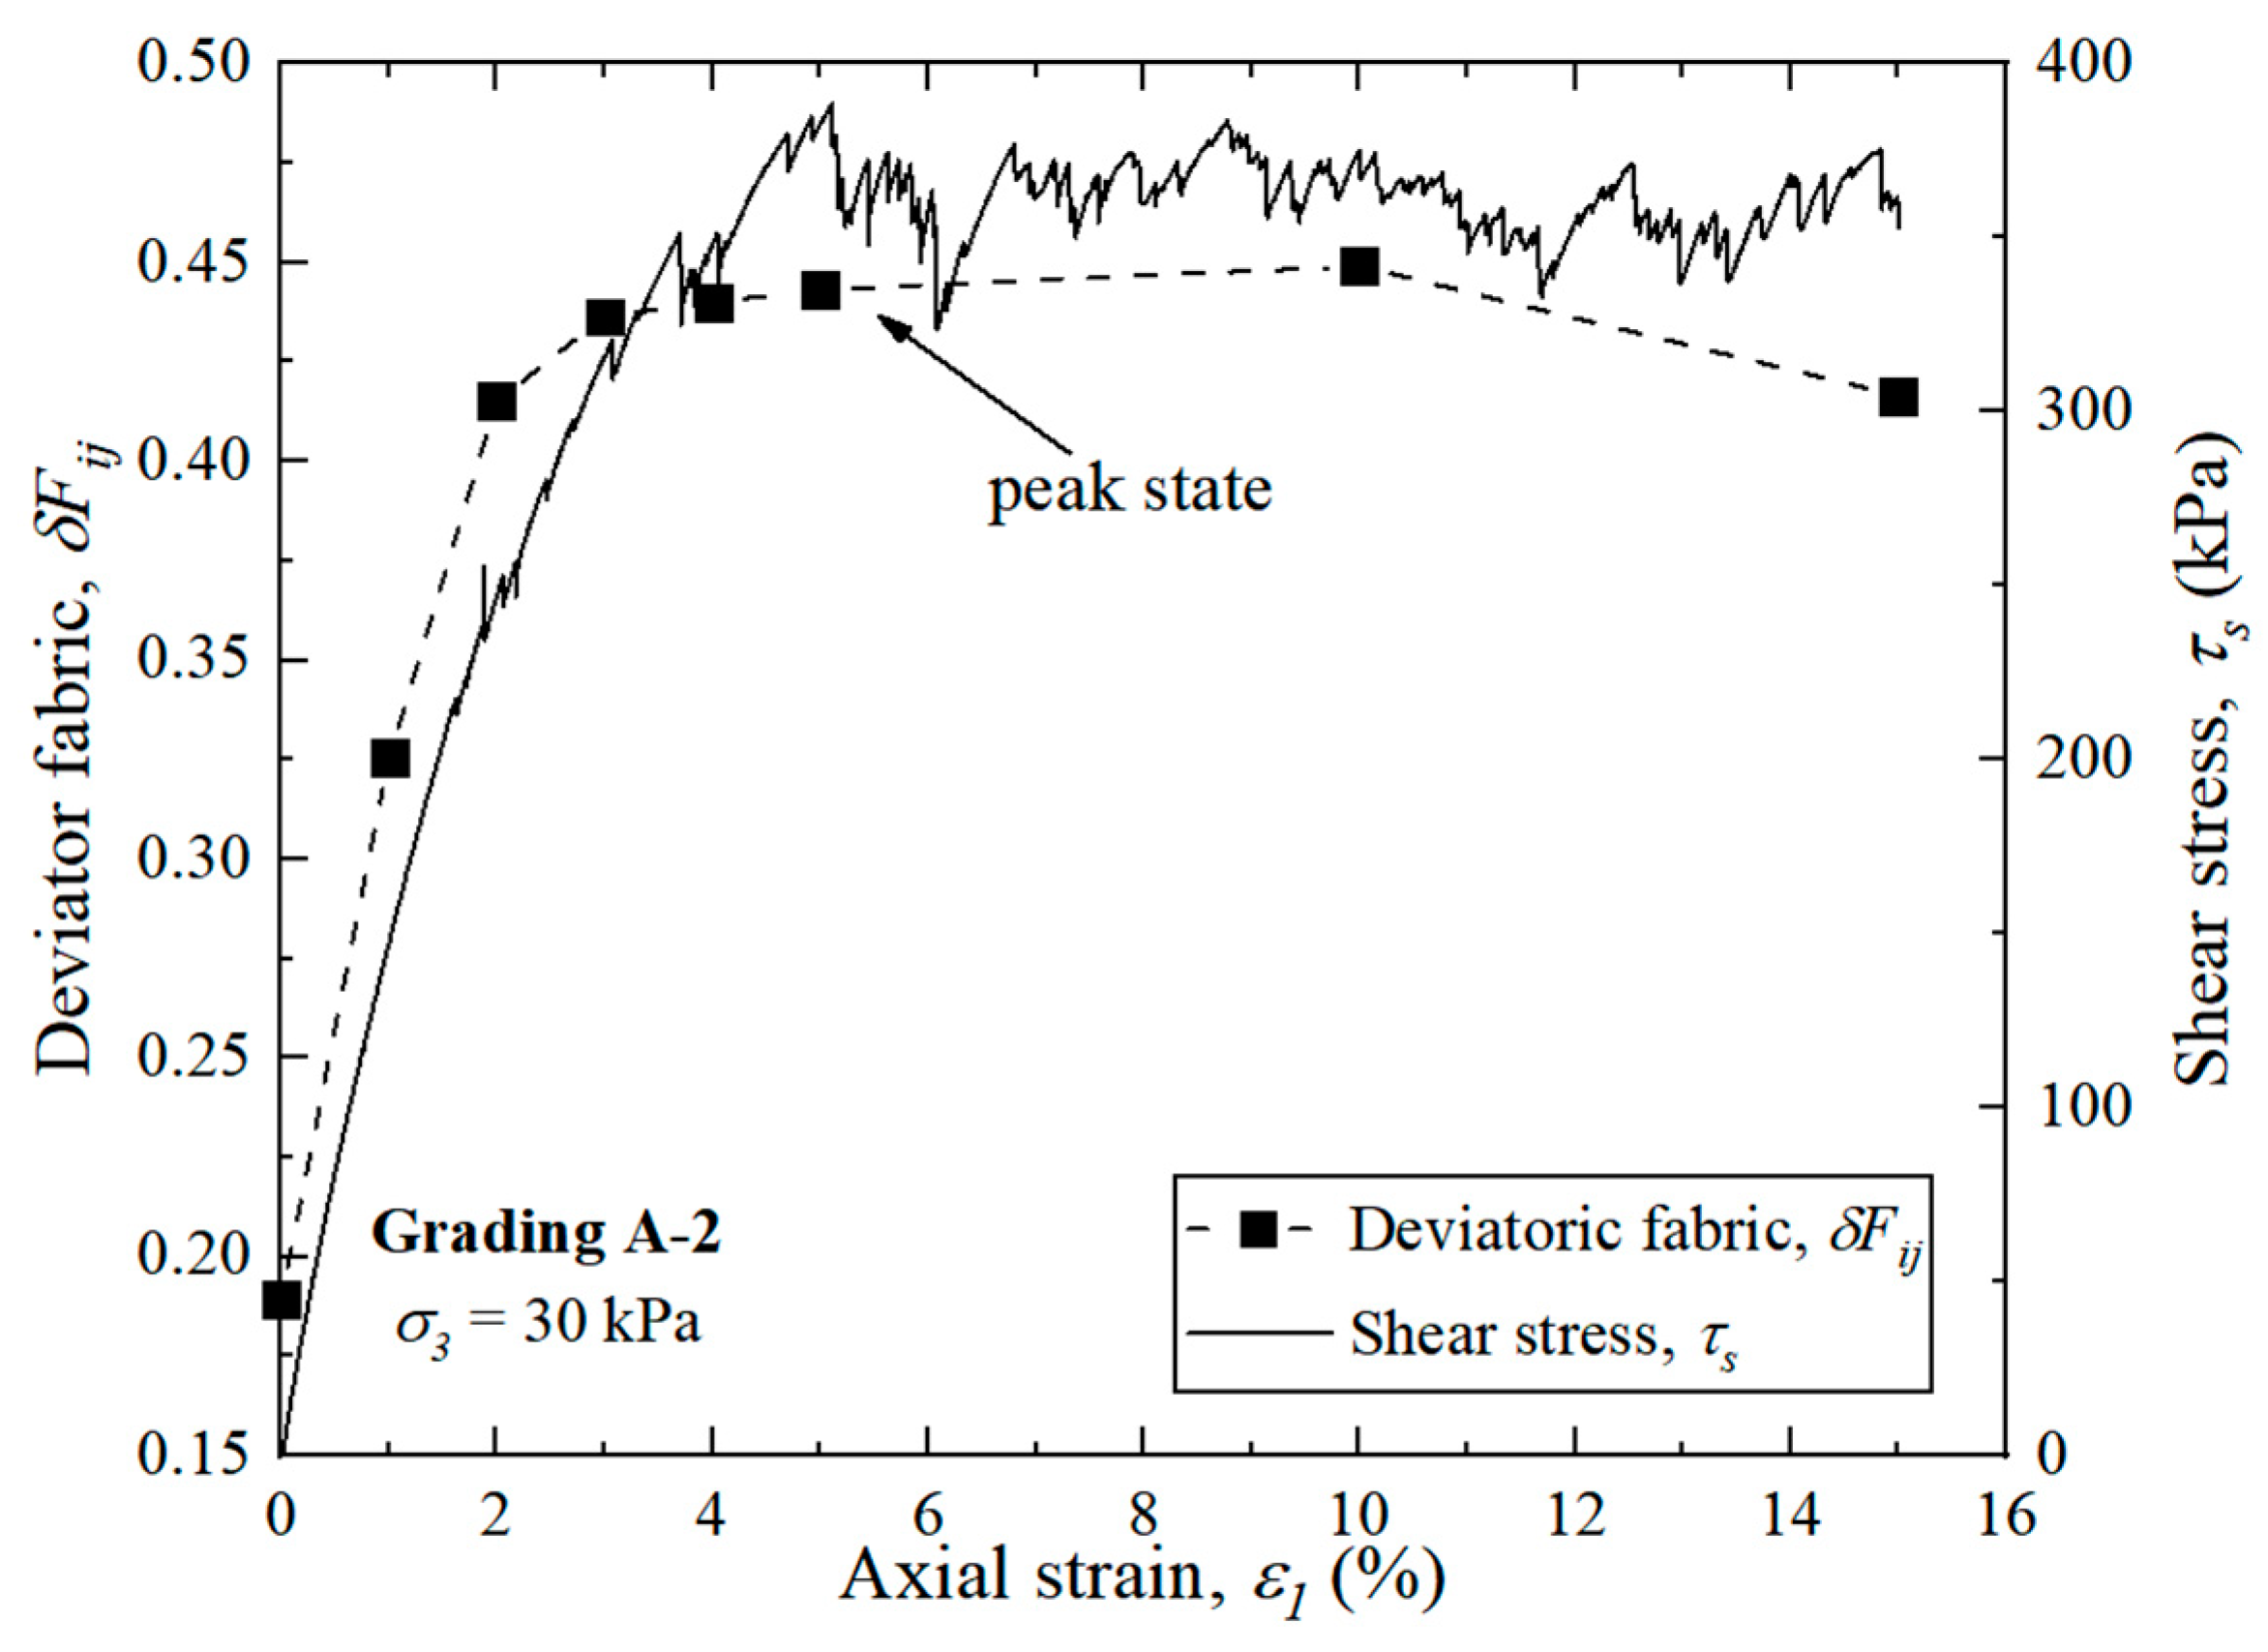
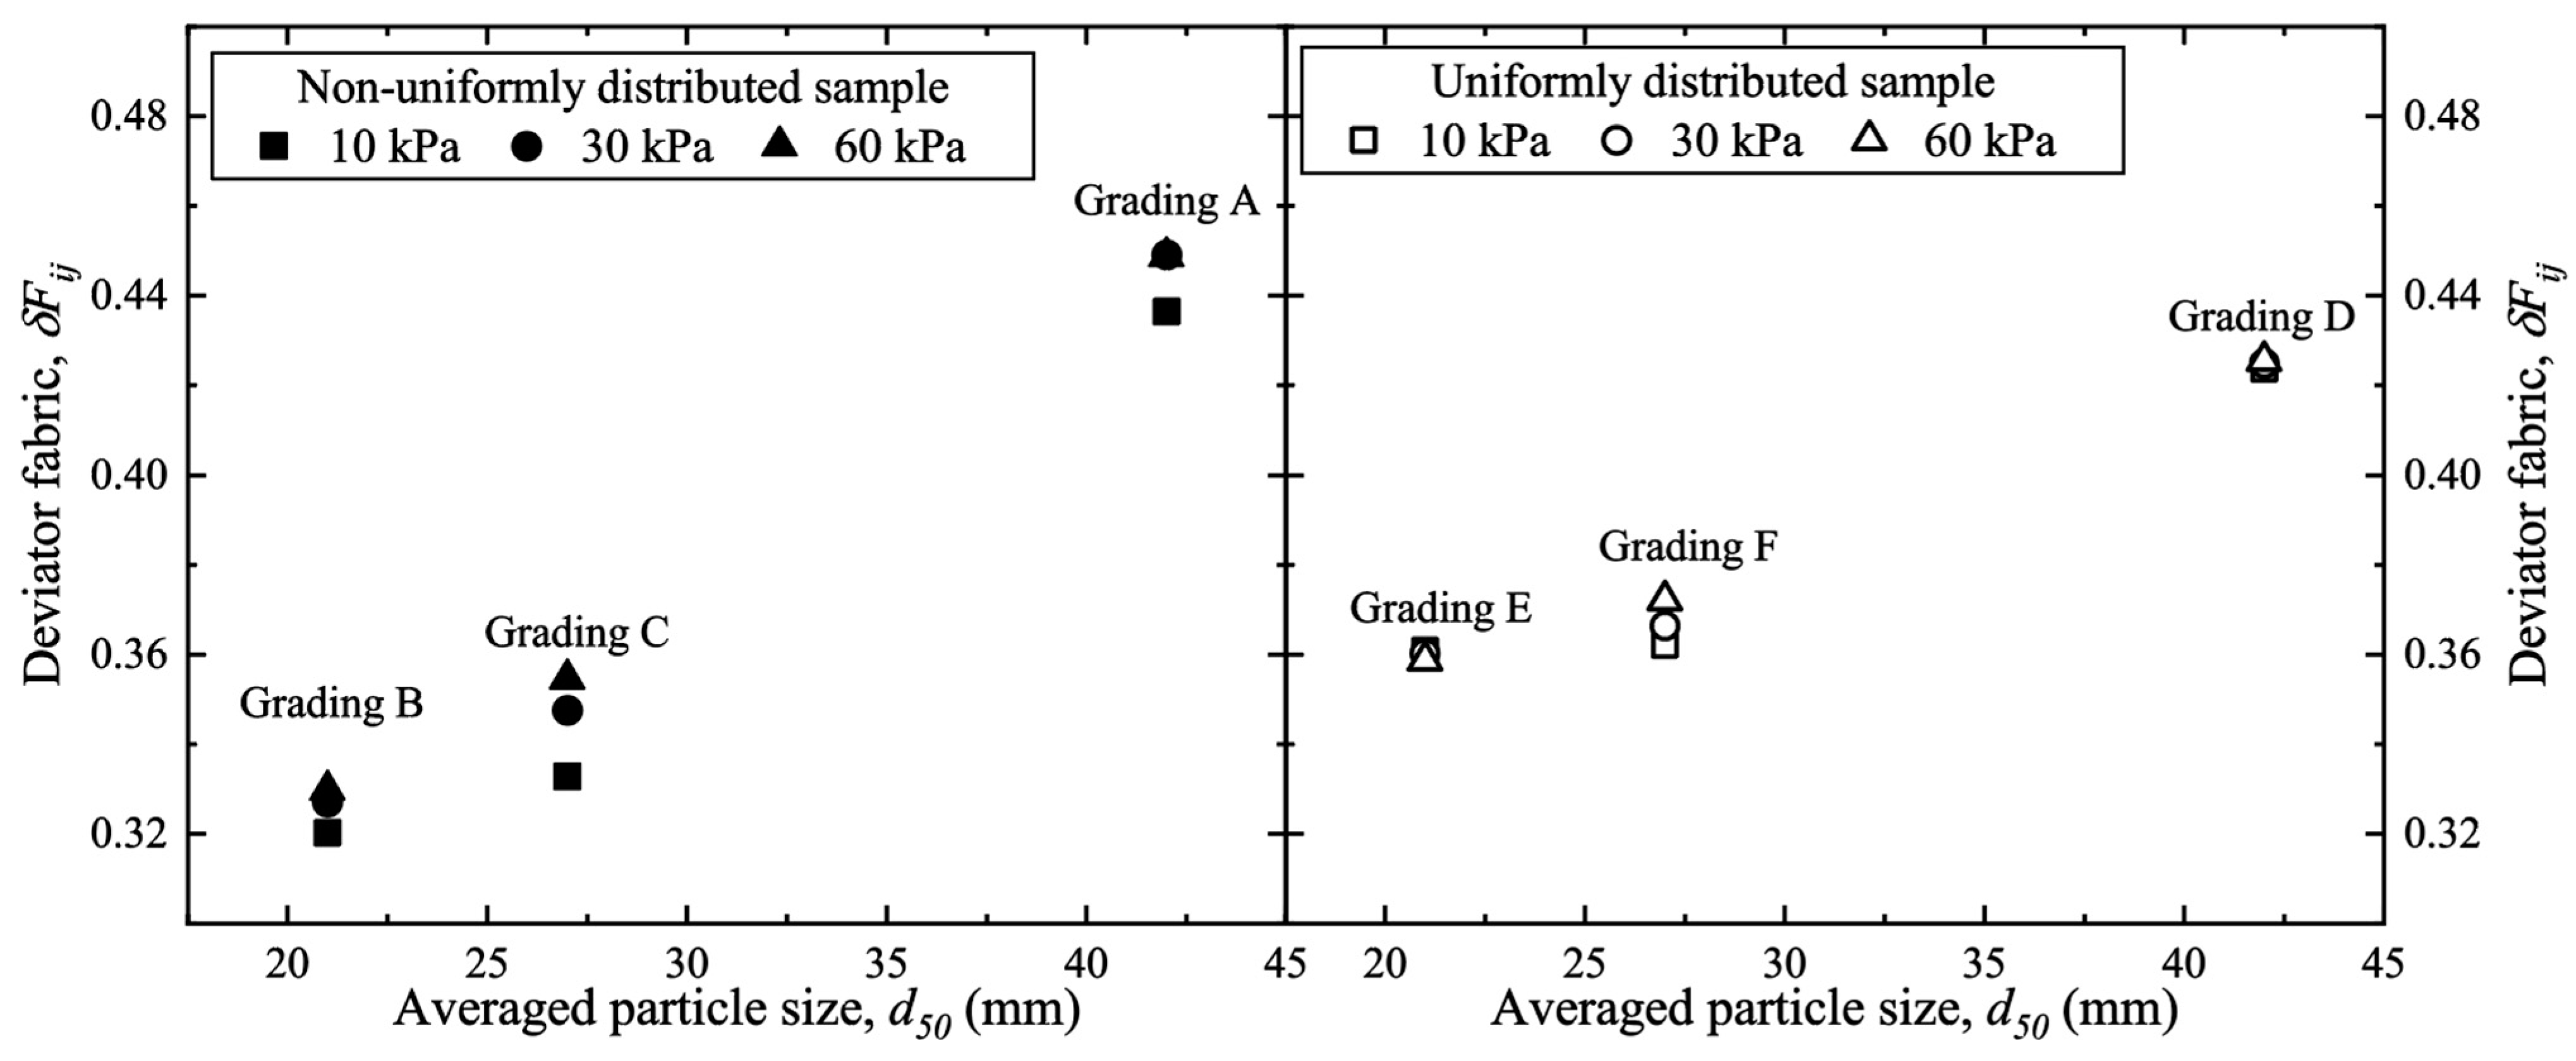
3.2.4. Microscopic Characteristics

The coordination number (CN) quantifies the number of contacts per particle and is a measure of packing density at the scale of particles. It has been proved that CN is closely associated with the development of mechanical characteristics of granular assemblies [10,21,40,41]. The CN can be calculated as given by Equation (7):
C N = 2 N t c N p
where N t c and N p are the total number of contacts and the number of particles in the aggregate, respectively. Figure 11 shows the evolution of CN for aggregate (Grading A-2) having a grading of A under a confining pressure of σ 3 = 30   k P a . At the beginning of shearing, the CN of the aggregate increased to its peak with a value of 11.4 at ε 1 of around 2%, due to the enhanced inter-particle contacts; then it gradually decreased and reached an ultimate value of around 8.75 until the end of shearing. It should be noted that the emergence of the CN peak came earlier than the peak of shear strength, which was at ε 1 of around 6%. Different from the evolution trend of CN, the averaged contact forces between ballast particles (Fave) for Grading A-2 gradually increased and became stable with a nearly constant value of around 1.5 kN after reaching the strength peak, as shown in Figure 11.
Figure 12 shows the values of CN and Fave for aggregates with varying gradings under different confining pressures. In general, aggregates with larger d50 values exhibited higher CN values, with the exception of Grading C, which displayed the lowest CN of around 4.2 to 5.0 among all the aggregates. Moreover, the CN values for the three uniformly distributed aggregates were notably higher compared to their d50-equivalent non-uniformly distributed counterparts. For instance, the CN of Grading E type aggregate ranged from 8.0 to 10.0 under the given confining pressures in this study; however, this value decreased to around 5.2 to 6.3 for its d50-equivalent non-uniformly distributed aggregate (i.e., Grading B type). For non-uniformly distributed aggregates (Grading A, B, and C), the void spaces between the larger particles were occupied by small-sized particles often referred to as ‘rattlers’ or ‘floaters,’ which had either minimal or no contact with other particles. Consequently, the contribution of these ‘rattlers’ or ‘floaters’ to the total contact number ( N t c ) was limited, which in turn led to a reduction in the CN of these aggregates. This phenomenon was particularly pronounced for Grading C, which contained a significant proportion of small fines. The differences in average contact force between non-uniformly distributed and their d50-equivalent uniformly distributed aggregates were not substantial. Notably, as the d50 of the aggregate increased, the Fave also increased. For instance, the Fave of Grading A type aggregate was around 1.35 kN to 1.58 kN, while this value decreased to 0.72 kN to 0.95 kN in Grading B type aggregate. This observation can be attributed to the greater number of particle contacts and inter-particle contact forces in aggregates with larger Fave values.
To quantify the anisotropy of contact normal distribution, the fabric tensor defined by Satake [42], was the most commonly used for granular assemblies in 3D spatial space, as given by Equation (8):
Φ i j = 1 N c k = 1 N c n i k n j k
where n is the unit vector of contact normal; N c   is the number of target contacts in the system. The deviator fabric for contact normals, δ F i j , could be easily obtained by the largest and the smallest eigenvalues ( Φ 1 and Φ 3 ) of the tensor Φ i j , as given by Equation (9):
δ F i j = Φ 1 Φ 3
Figure 13 shows the evolution of δ F i j for an aggregate (Grading A-2) characterized by Grading A under a confining pressure of σ 3 = 30   k P a . The τ s ε 1 curve of the aggregate is also included in Figure 13 for comparison. It was observed that the deviator fabric δ F i j and the shear stress τ s exhibited consistent development trends. They both increased significantly at the onset of shearing and then remained nearly constant after reaching their peak values at ε 1 of approximately 6%.
Figure 14 shows the δ F i j for aggregates with varying gradings under different confining pressures. The δ F i j increased with the increase in d50 for both non-uniformly distributed and uniformly distributed aggregates. In Grading B type aggregate, the δ F i j was around 0.33, while it increased to 0.44 in Grading A type aggregate. Similarly, the δ F i j increased from 0.36 for Grading E type aggregate to 0.43 for Grading D type aggregate. This increase in δ F i j indicated a higher degree of contact normal concentration in a particular orientation, which in turn raised the probability of particle breakage along that specific direction. Although Grading E and F exhibited higher δ F i j values compared to their d50-equivalent non-uniformly distributed aggregates, the concentration may not have played a pivotal role in influencing particle breakage in these two aggregates. The particle breakage is the result of various factors, including the quantity of contacts and inter-particle contact forces.

4. Limitations

The work presented in this study provided a comprehensive investigation on how particle size and size grading affect the degradation and shear behavior of ballast aggregates, albeit several limitations as described below.
  • The tensile strength of ballast governs its breakage mainly in the form of bulk splitting, while ballast particles in the track fields could also incur corner abrasion and surface attrition. These two breakage patterns should be considered in future studies to understand thoroughly the degradation behavior of ballast over its service course.
  • The ballast clumps used in the current DEM simulations were rigid and could not break. More accurate ballast model needs to be developed to fully represent the mechanical response of the aggregates.
  • In light of the ongoing climate change, it is advisable for future research to explore the impact of moisture content on the mechanical behavior of ballast aggregates with varying size gradings, aiming to enhance the sustainability of track systems. Furthermore, the long-term deterioration of ballast in track beds is a critical issue, posing a significant threat to passenger comfort and travel safety. Therefore, it becomes essential to thoroughly incorporate the breakage mechanism into the investigation of how particle size gradings affect ballast performance.

5. Conclusions

This paper investigated the effect of particle size and grading on the mechanical response and degradation behavior of railway ballast with a combination of laboratory tests and numerical DEM modeling. Single particle crushing tests were conducted on ballast grains of different sizes to examine their tensile strengths and Weibull characteristics. Monotonic triaxial shearing tests were then performed on ballast aggregates with varying gradings to investigate comprehensively the influence of particle grading on shear behavior and micromechanical characteristics of ballast aggregates. The key findings of this study can be summarized as follows.
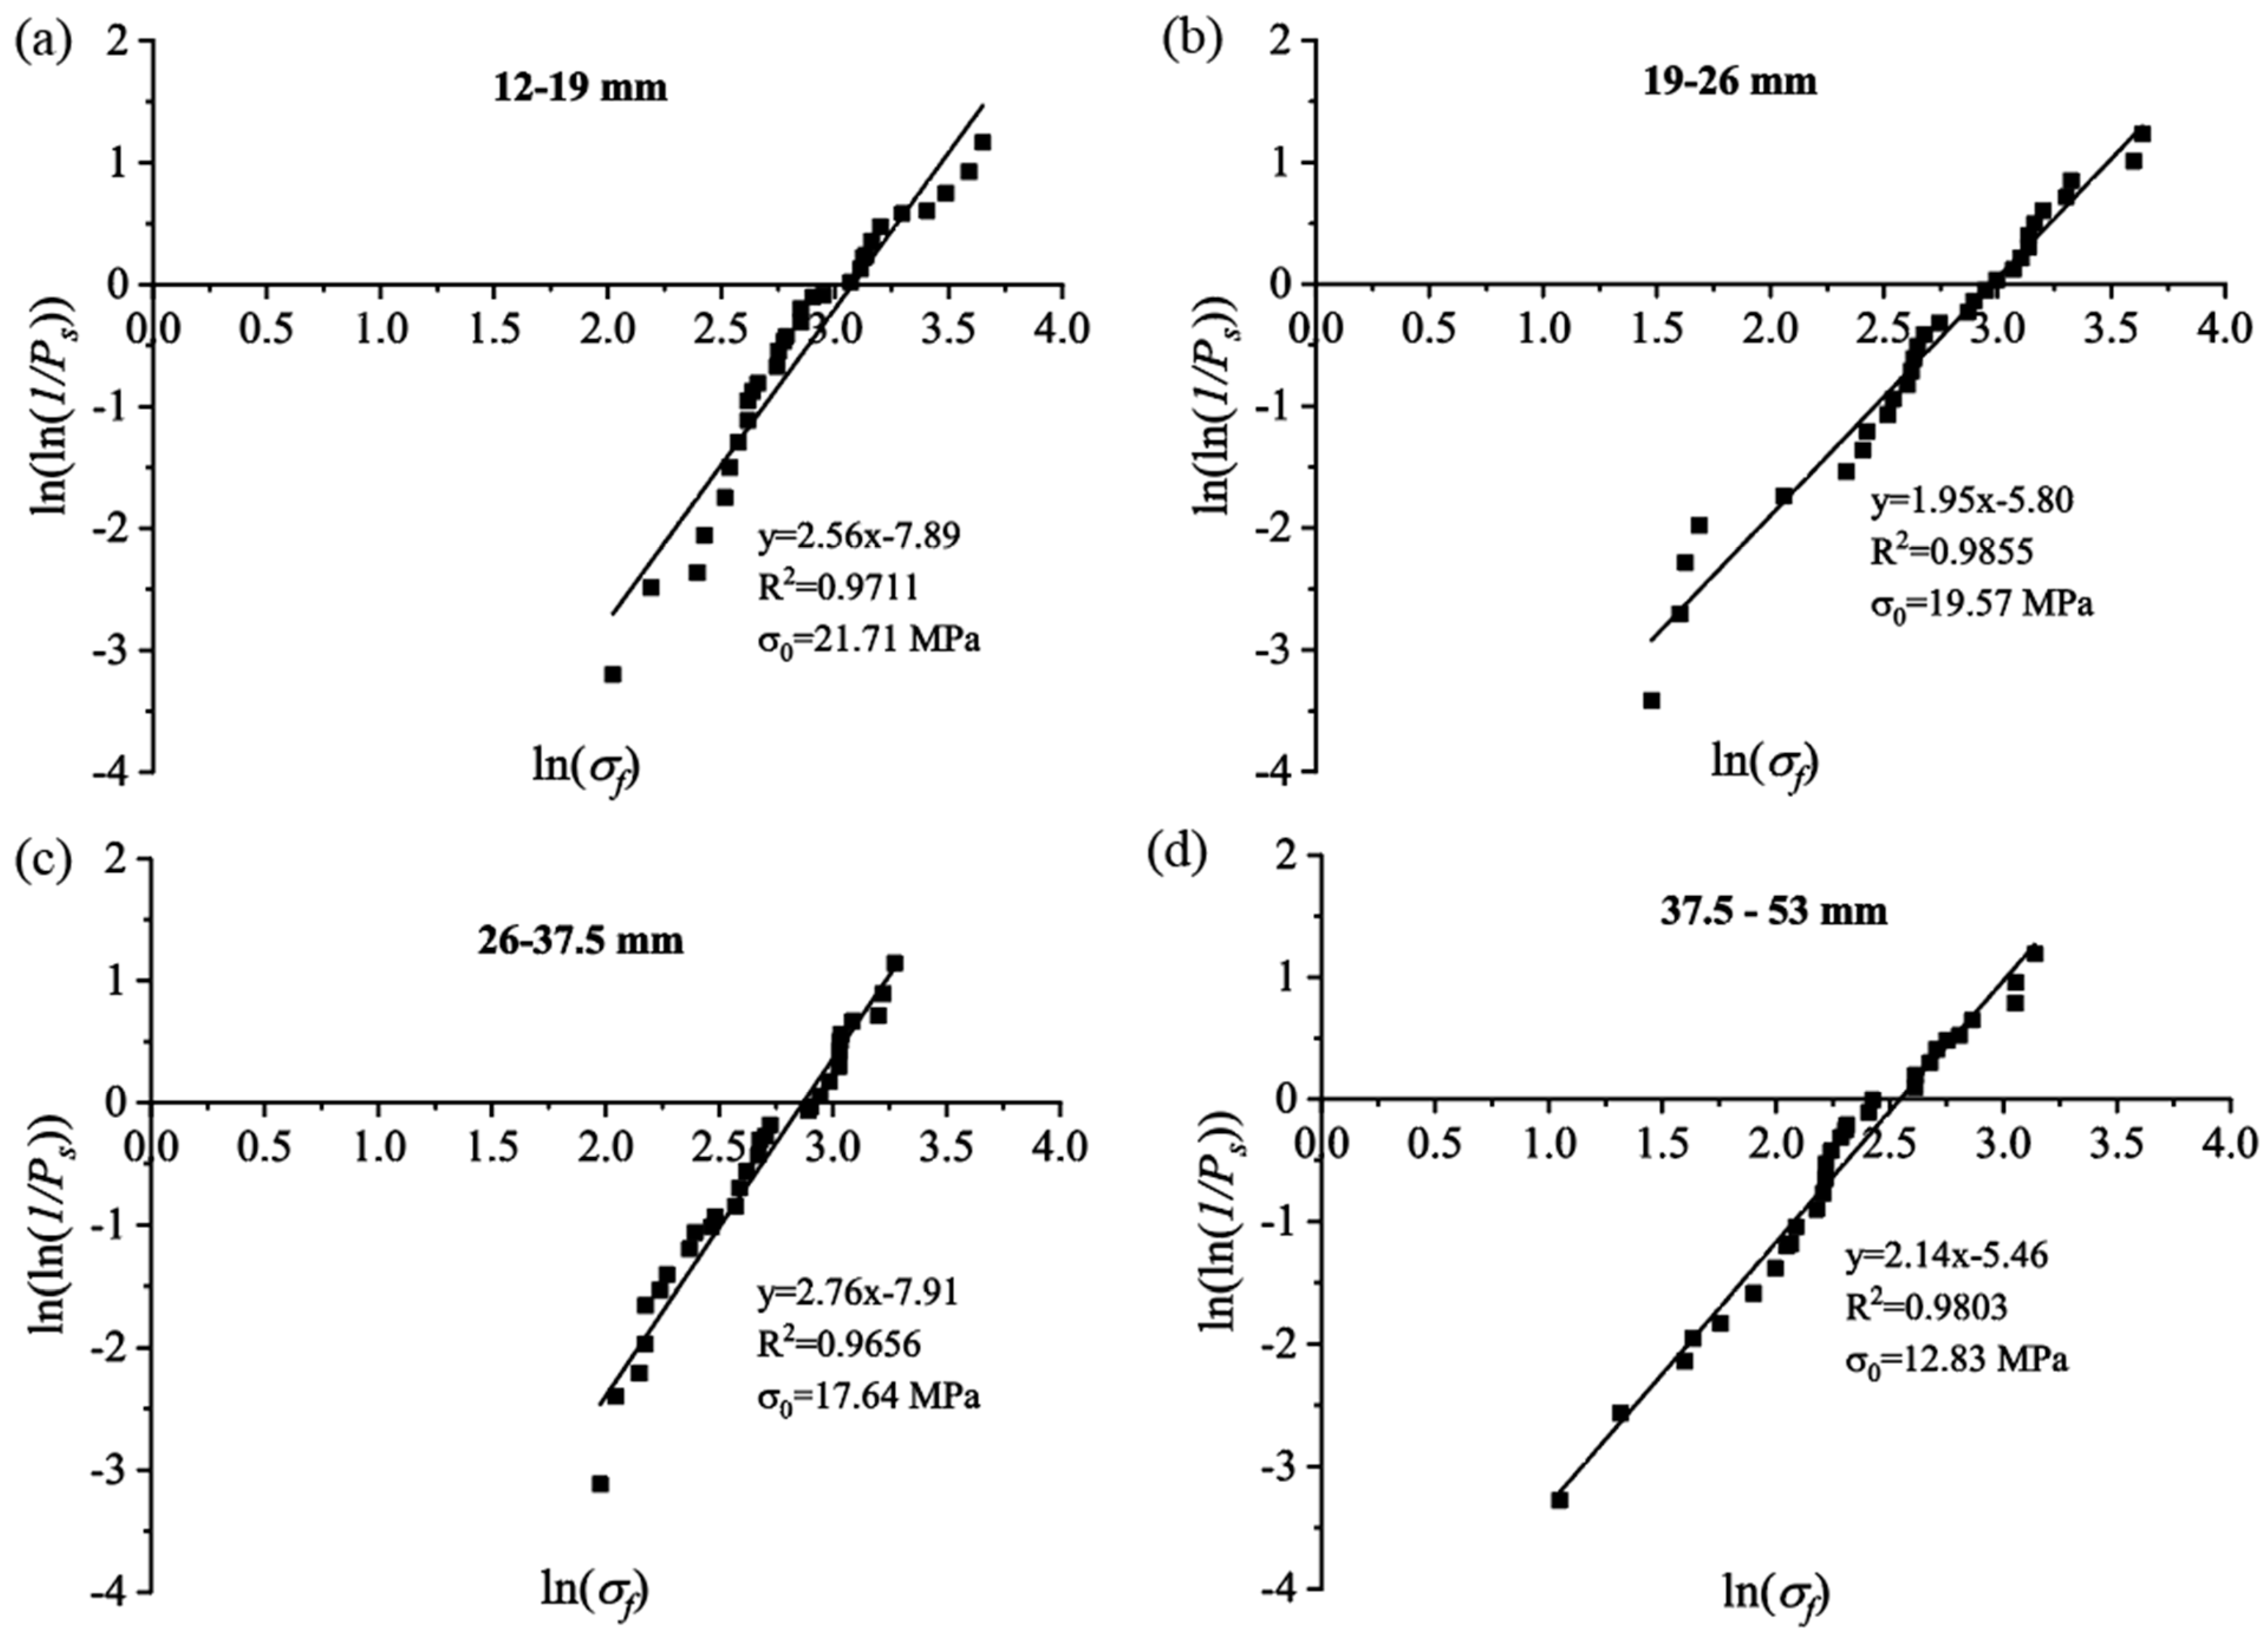
  • When subjected to diametrical compression, the tensile strength of the tested latite basalt ballast complied with Weibull distribution. The 37% tensile strength (σ0) of the ballast was a function of particle size at failure df, and the variation in σ0 could be described by the Weibull modulus m of 2.35.
  • The grading of particles has a significant impact on the shear response of ballast aggregates. Compared to the mono-sized aggregates, their d50-equivalent non-uniformly distributed aggregates exhibited higher shear stress, greater peak friction angle, and 50%-shear modulus, with larger volumetric dilation owing to a better particle packing. These findings suggest that particle size uniformity is an important factor in selecting ideal ballast materials in the construction of ballasted tracks.
  • Among all the examined specimens, ballast aggregate conforming to the recommended PSD as per current standards exhibited the most superior mechanical performance. Despite having a wider PSD, the small-sized particles clogged the voids of the aggregate skeleton acting as a lubricant and thus facilitating the movement of larger particles during shearing. Large-sized particles form the aggregate skeleton, and the voids in-between are filled by small-sized particles, which act as lubricant facilitating the movement of larger particles during shearing. Consequently, the shear stress and volumetric dilation were mitigated for aggregates containing a significant proportion of small fines, despite having a wider PSD.
  • The anisotropy of contact normals within ballast aggregates increased as shearing progressed. Aggregates with larger d50 generally exhibited a greater coordination number with higher anisotropy of contact normals, which raised the probability of particle breakage within the aggregate during shearing. In contrast, compared to the mono-sized aggregates, their d50-equivalent non-uniformly distributed aggregates had lower coordination numbers due to the excessive presence of rattling or floating fines in the aggregates.

Author Contributions

Methodology, J.C., Y.L. and R.G.; Validation, J.C.; Formal analysis, J.C.; Resources, Q.H.; Data curation, J.C., Y.L. and Q.H.; Writing—original draft, J.C.; Supervision, R.G.; Funding acquisition, J.C. and R.G. All authors have read and agreed to the published version of the manuscript.

Funding

This work was financially supported by Chinese Scholarship Council (No. 201906270149), National Natural Science Foundation of China (NSFC) (Grant No. 51878521, 51178358), China Postdoctoral Science Foundation (Grant No. 2023M733118), and the support of the ARC Industrial Transformation Training Centre, ITTC-Rail at the University of Wollongong. The support is gratefully acknowledged.

Institutional Review Board Statement

Not applicable.

Informed Consent Statement

Not applicable.

Data Availability Statement

The data used to support the findings of this study are available from the corresponding author upon request.

Conflicts of Interest

Author Yangzepeng Liu was employed by the company China Railway 11th Bureau Group Co., Ltd. The remaining authors declare that the research was conducted in the absence of any commercial or financial relationships that could be construed as a potential conflict of interest.

References

  1. Selig, E.T.; Waters, J.M. Track Geotechnology and Substructure Management; Thomas Telford: London, UK, 1994; ISBN 978-0-7277-2013-9. [Google Scholar]
  2. Indraratna, B.; Salim, W.; Rujikiatkamjorn, C. Advanced Rail Geotechnology—Ballasted Track; CRC Press, Taylor & Francis Group: London, UK, 2011; ISBN 978-0-415-66957-3. [Google Scholar]
  3. Fardin Rosa, A.; Sacramento Aragão, F.T.; Motta, L.M.G. da Effects of Particle Size Distribution and Lithology on the Resistance to Breakage of Ballast Materials. Constr. Build. Mater. 2021, 267, 121015. [Google Scholar] [CrossRef]
  4. Sun, Q.D.; Indraratna, B.; Nimbalkar, S. Effect of Cyclic Loading Frequency on the Permanent Deformation and Degradation of Railway Ballast. Géotechnique 2014, 64, 746–751. [Google Scholar] [CrossRef]
  5. Xiao, Y.; Meng, M.; Daouadji, A.; Chen, Q.; Wu, Z.; Jiang, X. Effects of Particle Size on Crushing and Deformation Behaviors of Rockfill Materials. Geosci. Front. 2018, 11, 375–388. [Google Scholar] [CrossRef]
  6. Lim, W.L.; McDowell, G.R.; Collop, A.C. The Application of Weibull Statistics to the Strength of Railway Ballast. GM 2004, 6, 229–237. [Google Scholar] [CrossRef]
  7. Qian, Y.; Boler, H.; Moaveni, M.; Tutumluer, E.; Hashash, Y.M.A.; Ghaboussi, J. Degradation-Related Changes in Ballast Gradation and Aggregate Particle Morphology. J. Geotech. Geoenviron. Eng. 2017, 143, 04017032. [Google Scholar] [CrossRef]
  8. Bian, X.; Shi, K.; Li, W.; Luo, X.; Tutumluer, E.; Chen, Y. Quantification of Railway Ballast Degradation by Abrasion Testing and Computer-Aided Morphology Analysis. J. Mater. Civ. Eng. 2021, 33, 04020411. [Google Scholar] [CrossRef]
  9. Jaeger, J.C. Failure of Rocks under Tensile Conditions. Int. J. Rock Mech. Min. Sci. Geomech. Abstr. 1967, 4, 219–227. [Google Scholar] [CrossRef]
  10. McDowell, G.R.; Bolton, M.D. On the Micromechanics of Crushable Aggregates. Géotechnique 1998, 48, 667–679. [Google Scholar] [CrossRef]
  11. Al-Saoudi, N.K.S.; Hassan, K.H. Evaluation of Indirect Tensile Strength of Track Ballast Using Weibull Statistics. Geotech. Geol. Eng. 2012, 30, 1097–1102. [Google Scholar] [CrossRef]
  12. Koohmishi, M. Evaluation of the Effect of Water Saturation on the Strength of Individual Railway Ballast Aggregate. Transp. Geotechn. 2019, 18, 163–172. [Google Scholar] [CrossRef]
  13. Koohmishi, M.; Palassi, M. Evaluation of the Strength of Railway Ballast Using Point Load Test for Various Size Fractions and Particle Shapes. Rock Mech. Rock Eng. 2016, 49, 2655–2664. [Google Scholar] [CrossRef]
  14. Sun, Y.; Chen, C.; Nimbalkar, S. Identification of Ballast Grading for Rail Track. J. Rock Mech. Geotech. Eng. 2017, 9, 945–954. [Google Scholar] [CrossRef]
  15. Indraratna, B.; Khabbaz, M.H.; Salim, W.; Lackenby, J.; Christie, D. Ballast Characteristics and the Effect of Geosynthetics on Rril Track Deformation; Faculty of Engineering—Papers (Archive); Quest Publications: Bombay, India, 2004; pp. 3–12. [Google Scholar]
  16. Nålsund, R. Effect of Grading on Degradation of Crushed-Rock Railway Ballast and on Permanent Axial Deformation. Transp. Res. Rec. 2010, 2154, 149–155. [Google Scholar] [CrossRef]
  17. Abadi, T.; Pen, L.L.; Zervos, A.; Powrie, W. Improving the Performance of Railway Tracks through Ballast Interventions. Proc. Inst. Mech. Eng. Part F J. Rail Rapid Transit 2018, 232, 337–355. [Google Scholar] [CrossRef]
  18. Cundall, P.A.; Strack, O.D.L. Discrete Numerical Model for Granular Assemblies. Int. J. Rock Mech. Min. Sci. Geomech. Abstr. 1979, 29, 47–65. [Google Scholar] [CrossRef]
  19. Huang, H.; Tutumluer, E. Discrete Element Modeling for Fouled Railroad Ballast. Constr. Build. Mater. 2011, 25, 3306–3312. [Google Scholar] [CrossRef]
  20. Feng, B.; Park, E.H.; Huang, H.; Li, W.; Tutumluer, E.; Hashash, Y.M.A.; Bian, X. Discrete Element Modeling of Full-Scale Ballasted Track Dynamic Responses from an Innovative High-Speed Rail Testing Facility. Transp. Res. Rec. 2019, 2673, 036119811984647. [Google Scholar] [CrossRef]
  21. Gong, G.; Thornton, C.; Chan, A.H.C. DEM Simulations of Undrained Triaxial Behavior of Granular Material. J. Eng. Mech. 2012, 138, 560–566. [Google Scholar] [CrossRef]
  22. Ngo, N.T.; Indraratna, B.; Rujikiatkamjorn, C. Micromechanics-Based Investigation of Fouled Ballast Using Large-Scale Triaxial Tests and Discrete Element Modeling. J. Geotech. Geoenviron. Eng. 2017, 143, 04016089. [Google Scholar] [CrossRef]
  23. Liu, Y.; Gao, R.; Chen, J. Exploring the Influence of Sphericity on the Mechanical Behaviors of Ballast Particles Subjected to Direct Shear. Granul. Matter 2019, 21, 94. [Google Scholar] [CrossRef]
  24. Tutumluer, E.; Huang, H.; Hashash, Y.M.A.; Ghaboussi, J. AREMA Gradations Affecting Ballast Performance Using Discrete Element Modeling (DEM) Approach; American Railway Engineering Association: Chicago, IL, USA, 2009. [Google Scholar]
  25. TB/T 2140-2008; The Chinese Standard of Railway Ballast. Ministry of Railways of the PRC: Beijing, China, 2008.
  26. Nakata, Y.; Kato, Y.; Hyodo, M.; Hyde, A.F.L.; Murata, H. One-Dimensional Compression Behaviour of Uniformly Graded Sand Related to Single Particle Crushing Strength. Soils Found. 2001, 41, 39–51. [Google Scholar] [CrossRef] [PubMed]
  27. McDowell, G.R.; Amon, A. The Application of Weibull Statistics to the Fracture of Soil Particles. Soils Found. 2000, 40, 133–141. [Google Scholar] [CrossRef] [PubMed]
  28. Ferellec, J.F.; McDowell, G.R. A Method to Model Realistic Particle Shape and Inertia in DEM. Granul. Matter 2010, 12, 459–467. [Google Scholar] [CrossRef]
  29. Wadell, H. Volume, Shape, and Roundness of Quartz Particles. J. Geol. 1935, 43, 250–280. [Google Scholar] [CrossRef]
  30. Chen, J.; Indraratna, B.; Vinod, J.S.; Ngo, N.T.; Gao, R.; Liu, Y. Stress-Dilatancy Behaviour of Fouled Ballast: Experiments and DEM Modelling. Granul. Matter 2021, 23, 90. [Google Scholar] [CrossRef]
  31. Chen, J.; Vinod, J.S.; Indraratna, B.; Ngo, T.; Liu, Y. DEM Study on the Dynamic Responses of a Ballasted Track under Moving Loading. Comput. Geotech. 2023, 153, 105105. [Google Scholar] [CrossRef]
  32. Indraratna, B.; Lackenby, J.; Christie, D. Effect of Confining Pressure on the Degradation of Ballast under Cyclic Loading. Geotechnique 2005, 55, 325–328. [Google Scholar] [CrossRef]
  33. Indraratna, B.; Tennakoon, N.C.; Nimbalkar, S.S.; Rujikiatkamjorn, C. Behaviour of Clay-Fouled Ballast under Drained Triaxial Testing. Géotechnique 2013, 63, 410–419. [Google Scholar] [CrossRef]
  34. Lee, D.-M. Angles of Friction of Granular Fills. Ph.D. Dissertation, University of Cambridge, Cambridge, UK, 1992. [Google Scholar]
  35. Indraratna, B.; Ionescu, D.; Christie, H.D. Shear Behavior of Railway Ballast Based on Large-Scale Triaxial Tests. J. Geotech. Geoenviron. Eng. 1998, 124, 439–449. [Google Scholar] [CrossRef]
  36. Qian, Y.; Mishra, D.; Tutumluer, E.; Kazmee, H.A. Characterization of Geogrid Reinforced Ballast Behavior at Different Levels of Degradation through Triaxial Shear Strength Test and Discrete Element Modeling. Geotext. Geomembr. 2015, 43, 393–402. [Google Scholar] [CrossRef]
  37. Bian, X.; Jiang, J.; Jin, W.; Sun, D.; Li, W.; Li, X. Cyclic and Postcyclic Triaxial Testing of Ballast and Subballast. J. Mater. Civ. Eng. 2016, 28, 04016032. [Google Scholar] [CrossRef]
  38. Chen, J.; Gao, R.; Liu, Y.; Shi, Z.; Zhang, R. Numerical Exploration of the Behavior of Coal-Fouled Ballast Subjected to Direct Shear Test. Constr. Build. Mater. 2021, 273, 121927. [Google Scholar] [CrossRef]
  39. Rohrman, A.K.; Ho, C.L. Effects of Fouling Containing Plastic Fines on Abraded Ballast Strength and Deformation Properties. Transp. Geotech. 2019, 21, 100278. [Google Scholar] [CrossRef]
  40. Ouadfel, H.; Rothenburg, L. An Algorithm for Detecting Inter-Ellipsoid Contacts. Comput. Geotech. 1999, 24, 245–263. [Google Scholar] [CrossRef]
  41. Thornton, C. Numerical Simulations of Deviatoric Shear Deformation of Granular Media. Géotechnique 2000, 50, 43–53. [Google Scholar] [CrossRef]
  42. Satake, M. Fundamental Quantities in the Graph Approach to Granular Materials. Stud. Appl. Mech. 1983, 7, 9–19. [Google Scholar] [CrossRef]
Figure 1. Single ballast crushing tests: (a) laboratory testing; and (b) a typical load–displacement curve.
Sustainability 15 16363 g001
Figure 2. Representative ballast clumps used in DEM modelling.
Sustainability 15 16363 g002
Figure 3. Size gradings of ballast aggregates in DEM simulations.
Sustainability 15 16363 g003
Figure 4. Weibull survival plots for size fractions of (a) 12–19 mm; (b) 19–26 mm; (c) 26–37.5 mm; (d) 37.5–53 mm.
Sustainability 15 16363 g004
Figure 5. The 37%-tensile strength of ballast against averaged particle size at failure.
Sustainability 15 16363 g005
Figure 6. Shear response of ballast aggregates under different confining pressures.
Sustainability 15 16363 g006
Figure 7. Response of shear stress and volumetric strain of (a1,a2) non-uniformly distributed aggregates, and (b1,b2) uniformly distributed aggregates under σ 3 = 10   k P a .
Sustainability 15 16363 g007
Figure 8. Response of shear stress and volumetric strain of aggregates with (a1,a2) Grading A, D; (b1,b2) Grading B, E; and (c1,c2) Grading C, F under σ 3 = 10   k P a .
Sustainability 15 16363 g008
Figure 9. Peak friction angle of ballast aggregates with varying gradings under different confining pressures.
Sustainability 15 16363 g009
Figure 10. The 50% strength modulus of ballast aggregates with varying gradings under different confining pressures.
Sustainability 15 16363 g010
Figure 11. The evolutions of coordination number and averaged inter-particle contact force within Grading A-2.
Sustainability 15 16363 g011
Figure 12. Micromechanical characteristics of aggregates with varying gradings under different confining pressures: (a) coordination number CN; (b) averaged inter-particle contact force Fave.
Sustainability 15 16363 g012
Figure 13. Evolution of δ F i j for an aggregate (Grading A-2) characterized by Grading A under a confining pressure of σ 3 = 30   k P a .
Sustainability 15 16363 g013
Figure 14. The δ F i j of aggregates with varying gradings under different confining pressures.
Sustainability 15 16363 g014
Table 1. Micromechanical parameters in DEM model.
ParametersValues
Particle density (kg/m3)2500
Normal contact stiffness between particle and wall, knw2.0 × 107
Shear contact stiffness between particle and wall, ksw2.0 × 107
Normal contact stiffness between particles, knp5.0 × 107
Shear contact stiffness between particles, ksw5.0 × 107
Coefficient of friction between particle and wall, μ w 0.1
Coefficient of friction between particles, μ p 0.5
Damping ratio0.7
Table 2. Test program of monotonic shearing.
IDGrading TypeSample IDConfining Pressure σ3
1Grading A
(12 mm~65 mm)
Grading A-110 kPa
2Grading A-230 kPa
3Grading A-360 kPa
4Grading B
(6 mm~32.5 mm)
Grading B-110 kPa
5Grading B-230 kPa
6Grading B-360 kPa
7Grading C
(2 mm~65 mm)
Grading C-110 kPa
8Grading C-230 kPa
9Grading C-360 kPa
10Grading D
(42 mm)
Grading D-110 kPa
11Grading D-230 kPa
12Grading D-360 kPa
13Grading E
(21 mm)
Grading E-110 kPa
14Grading E-230 kPa
15Grading E-360 kPa
16Grading F
(27 mm)
Grading F-110 kPa
17Grading F-230 kPa
18Grading F-360 kPa
Disclaimer/Publisher’s Note: The statements, opinions and data contained in all publications are solely those of the individual author(s) and contributor(s) and not of MDPI and/or the editor(s). MDPI and/or the editor(s) disclaim responsibility for any injury to people or property resulting from any ideas, methods, instructions or products referred to in the content.

