Abstract
The coupling coordination relationship between regional highway transportation and new urbanization is an increasingly important issue in the field of regional sustainable development. This paper aims to establish an index system and develop an integrated method to measure the coupling coordination between regional highway transportation and new urbanization. The evaluation index system comprised two hierarchies, six aspects and 19 indexes, which were weighted by the entropy weight method (EWM). Furthermore, a coupling degree model (CDM) and a coupling coordination degree model (CCDM) were established based on the statistical data from 2011 to 2017 in Heilongjiang Province, China. The ArcGIS spatial analysis method was utilized to analyze the spatial–temporal coupling evolution characteristics of the two subsystems. The findings revealed that the development level of the two subsystems showed an upward tendency. The coupling degree between the two subsystems was leaping from antagonistic stage to breaking-in period. The coupling coordination degree between the two subsystems was the transition stage from imbalance to coordination. Specifically, the spatial differentiation characteristics of the coupling coordination development between the two subsystems were prominent in Heilongjiang Province, China. The results showed that the approach combining CCDM with ArcGIS spatial analysis can be applied as an effective method to explore the spatial–temporal evolution of coupling coordination development.
1. Introduction
Regional highway transportation and new urbanization are the important parts of regional coordination development, which is an increasingly important issue in the field of regional sustainable development. It is critical that the coordinated development of regional highway transportation and new urbanization promotes regional economic development and society. Due to its convenience, accessibility and flexibility, highway transportation occupies an important position in the comprehensive transportation system. Regional highway transportation is essential for socioeconomic development. New urbanization is the new engine for China’s economic growth [1]. Regional highway transportation and new urbanization mutually promote and restrict each other. Regional highway transportation plays a vital role in new urbanization development, and new urbanization creates opportunities for regional highway transportation development [2]. The total highway mileage and urban population have more than tripled from 1978 to 2022, with the total highway mileage growing from 890 thousand kilometers to 5.35 million kilometers, and the urbanization rate has increased from 17.9% to 65.2%. In March 2014, the National New Urbanization Plan (2014–2020) (NNUP) was issued by the Central Committee of the Communist Party of China and the State Council. The literature has clearly pointed out that transportation is significant for promoting new urbanization development, and transportation plays a significant role in supporting and leading urbanization patterns. There are dynamic evolution and spatial characteristics of coupling coordination development between regional highway transportation and new urbanization [3]. Therefore, it is essential to explore the coupling coordination relationship between regional highway transportation and new urbanization in order to adapt to the demand for sustainable regional socioeconomic development. It is important to formulate the plan for regional highway transportation development and realize the coordinated development of regional highway transportation and new urbanization.
This paper aims at analyzing the spatial–temporal characteristics of the coordinated development between regional highway transportation and new urbanization in Heilongjiang Province, China using the coupling degree model (CDM) and the coupling coordination degree model (CCDM). Firstly, a two-coupling analysis indicator system is developed, which includes the regional highway transportation and the new urbanization subsystems, to quantitatively measure the level of regional highway transportation and new urbanization development. Secondly, the CDM and the CCDM are utilized to quantify the coupling relationship between two subsystems in Heilongjiang Province, China. Finally, the ArcGIS spatial analysis method is used to analyze the spatial–temporal coupling evolution characteristics of the two subsystems from a spatial–temporal evolution perspective.
The rest of this paper is organized as follows. Section 2 analyzes the existing research on the interaction between regional highway transportation and new urbanization. Section 3 describes the materials used in this paper and the methodology, including the selection and the weights of indicators under the subsystems and the implementation of CDM and CDDM. Section 4 presents the results and discussions of the coupling coordination based on the models proposed in Section 3. The main conclusions of this paper are summarized in Section 5.
2. Literature Review
The interaction between regional highway transportation and new urbanization has been investigated extensively by scholars. Most of the existing studies on the relationship between regional highway transportation and new urbanization generally point out that there is a significant positive correlation between the two subsystems. Related studies mainly focus on the following aspects: the effects of regional highway transportation on new urbanization, the effects of new urbanization on regional highway transportation, the interaction between regional highway transportation and new urbanization, the coordinated development between transportation and new urbanization, and the coupling coordination relationship and spatial–temporal evolution characteristics between transportation and new urbanization. In the first aspect, Kotavaara et al. [4] found that the level of urbanization has been continuously improved with the improvement of railway infrastructure in Finland by analyzing the data on railway infrastructure and the urban population from 1880 to 1970. Fan [5] found that transportation played a leading role in new urbanization by analyzing the requirements of new urbanization development on transportation. In the second aspect, Li et al. [6] put forward the countermeasures according to the trends and characteristics of transportation development in the process of new urbanization. Wanke et al. [7] explored the impact of the urbanization level on transportation efficiency, and the research showed that the efficiency of big cities is higher and that of medium-sized cities is lower. Shan [8] empirically analyzed the development ideas, framework and main tasks of comprehensive transportation against the background of new urbanization, taking the Chengdu–Chongqing urban agglomeration as an example. In the third aspect, some studies explored the interaction between transportation and new urbanization development from a qualitative perspective [9,10,11,12,13]. For example, Poumanyvong [9] investigated qualitatively the interactive relationship between transportation and new urbanization development. In recent years, most of the studies have adopted quantitative methods to explore the synergistic relationship between two subsystems. For example, Song et al. [14] and Li [15] used the time-series data analysis methods to explore the correlation between highway transportation and new urbanization. Chen et al. [16], Mo et al. [17], Tang et al. [18], Guo [19] and Wu et al. [20] utilized the econometric methods to analyze empirically the interaction between transportation and new urbanization. Liu et al. [21], Yang et al. [22], Deng [23], Zhou et al. [24] used the spatial econometrics methods to analyze empirically the contribution of transportation infrastructure to new urbanization, and the research results showed that the transportation infrastructure has a significant positive effect on new urbanization. In the fourth aspect, Tang et al. [25,26] constructed the fitness model of integrated transportation service and new urbanization based on the entropy weight method and used the methods of factor analysis and K-Means clustering to explore the collaborative partition between the two subsystems. Current studies have discussed the coupling coordination relationship between transportation and new urbanization and analyzed the coupling characteristics between the two subsystems. In the fifth aspect, Wu et al. [27] used the CCDM to calculate the coupling degree and coupling coordination degree among new urbanization, transportation network and service industry agglomeration. Chen et al. [28] and You et al. [29] used the CCDM to quantitatively analyze the coordination development of transportation system and new urbanization. Ji et al. [30] used the traffic dominance model, CCDM and ArcGIS spatial analysis method to analyze the coupling characteristics between urbanization and traffic superiority in Yunnan Province, China. Wang et al. [31] utilized the CCDM and visualization tools to analyze the coupling coordination spatial pattern of land traffic accessibility and urbanization in the Yangtze River Economic Belt.
In summary, many scholars have carried out relevant studies on the coupling coordination between highway transportation and new urbanization. However, there are still the following shortcomings in the research. First, the current studies mainly focused on East China, the Yangtze River Economic Belt and other important regions from the perspective of provincial scope or municipal scale. The empirical research is insufficient in Heilongjiang Province, China. Secondly, the existing empirical research mostly evaluates and measures the coordinated development level of new urbanization and highway transportation, and the research on the action mechanism and influencing factors of the coordinated development of the two subsystems is relatively lacking. Thirdly, most studies used time-series data analysis methods to explore the relationship between the two subsystems, without the description and comparative analysis of the coordinated spatial pattern and evolution characteristics of new urbanization and highway transportation in different regions.
Therefore, this paper chooses 12 prefecture-level cities in Heilongjiang Province, China as the research areas, constructs an evaluation index system of coupling coordination development between regional highway transportation and new urbanization, measures the coupling coordination degree of the two subsystems, and then analyzes the spatial–temporal evolution characteristics from 2011 to 2017. The object of this paper is to provide a theoretical basis for promoting the coordinated development between the two subsystems as well as to realize regional sustainable development.
3. Materials and Methods
3.1. Study Area
This paper analyzed the coupling coordination degree and spatial–temporal dynamic evolution characteristics between regional highway transportation and new urbanization from 2011 to 2017 in Heilongjiang Province, China (Figure 1).
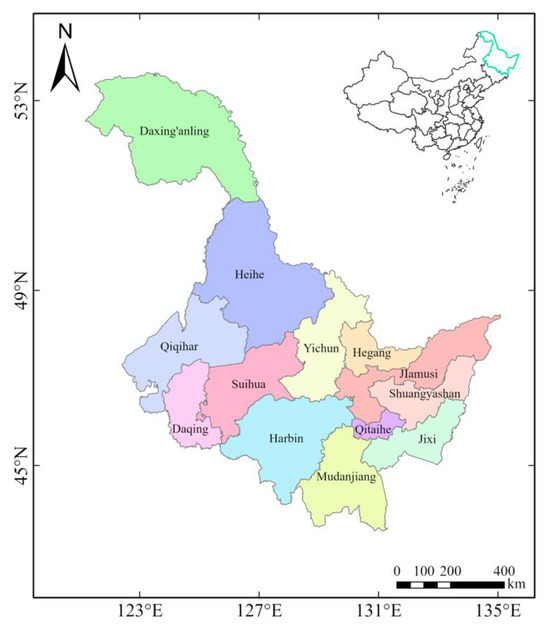
Figure 1.
Location of Heilongjiang Province in China.
Heilongjiang Province is located in Northeast China. It covers the 12 prefecture-level cities of Harbin, Qiqihar, Mudanjiang, Jiamusi, Daqing, Jixi, Shuangyashan, Yichun, Qitaihe, Hegang, Heihe, Suihua and the Greater Hingan Mountains, with a total area of 473,000 km2 (including Jiagedaqi and Songling District). In 2018, the urbanization rates of permanent residents and registered population were 60.1% and 50.05% in Heilongjiang Province, at 0.52 and 6.68 percentage points higher than the national average level, respectively. The above two indicators had been close to the goal proposed in the New-type Urbanization Plan of Heilongjiang Province (2014–2020). The total built highway was 167,115.7 km, of which the expressway was 4511.8 km, the first-class highway was 2729.2 km and the secondary highway was 11,930.9 km, with 11.5% of secondary and above highways in Heilongjiang province. The highway freight volume was 429.43 million tons, accounting for 68.9% of the total freight volume, and the highway freight turnover was 81.07 billion tons per km, accounting for 42.2% of the total freight turnover. The highway passenger volume was 207.39 million, accounting for 61.0% of the total social passenger turnover, and the highway passenger turnover was 15.41 billion kilometers, accounting for 17.8% of the total social passenger turnover. It can be seen that highway transportation has become the leading mode of transportation in Heilongjiang Province. With promoting the all-round revitalization of Heilongjiang, coordinated development between regional highway transportation and new urbanization plays an important role in realizing the high-quality development of the regional economy.
3.2. Data Acquisition and Preprocessing
To quantify the interrelationship between regional highway transportation and new urbanization in Heilongjiang Province, China, the original data needed for the two subsystems were collected from the China City Statistical Yearbooks from 2011 to 2017, the Statistical Bulletin on National Economic and Social Development of the 12 prefecture-level cities, including Harbin, Qiqihar, Mudanjiang, Jiamusi, Daqing, Jixi, Shuangyashan, Yichun, Qitaihe, Hegang, Heihe and Suihua (except for the Greater Hingan Mountains), and the official website of the Heilongjiang Provincial Bureau of Statistics (http://www.hlj.stats.gov.cn, accessed on 21 June 2019). The spatial vector data of the prefecture-level city administrative boundary in the graph data originated from the national 1:4 million basic geographic information systems. The latitude and longitude coordinates of each city point were collected by Baidu coordinate pickup, and were then imported into the ArcGIS 10.2 software ArcMap module to determine the location of each city. The value of the comprehensive evaluation, coupling degree and coupling coordination degree of regional highway transportation and new urbanization were calculated, respectively, using the developed methods in this study. The above data are manually imported into the ArcGIS software operation platform to obtain the spatial–temporal distribution bottom map of coupling coordination development between regional highway transportation and new urbanization.
In order to eliminate the effects of dimension, magnitude, and positive and negative orientation, Formulas (1) and (2) were used to standardize the raw data [32,33].
Positive indicator:
Negative indicator:
where represents the value of indicator j in year i, and and indicate the maximum and minimum value of the indicator j, respectively.
3.3. Index System
Following the principles of scientificity, systematicness, index measurement and data availability, and referring to the relevant research results [27,28,29,30,31], the evaluation index system of coupling coordination development between regional highway transportation and new urbanization was constructed according to the data characteristics, as shown in Table 1.

Table 1.
Evaluation index system of coupling coordination development between regional highway transportation and new urbanization.
As shown in Table 1, seven indicators were selected representing the development level of regional highway transportation from the two dimensions of development level and scale. From the four perspectives of population urbanization, economic urbanization, ecological urbanization and social urbanization, 12 indicators were selected representing the development level of new urbanization.
3.4. Methods
3.4.1. Entropy Weight Method
Since the entropy weight method (EWM) calculates the indicator weight and avoids subjectivity according to the information provided by the raw data, the EWM has been applied in many research fields [34,35]. In this study, the indicator weights of regional highway transportation and new urbanization subsystems were calculated by the EWM. The steps are as follows [36]:
Firstly, calculate the proportion of the indicator j in year i:
In the formula above, m is the total number of samples.
Secondly, calculate the entropy value of j indicator:
Thirdly, calculate the utility value of each indicator:
Fourthly, calculate the indicator weight of .
Finally, calculate the comprehensive level in year i :
where n is the number of indicators; is the regional highway transportation indicator; and is the new urbanization indicator.
The raw data (2011–2017) describing the 19 indicators representing the level of regional highway transportation and new urbanization development in Heilongjiang Province, China were processed using these steps on a time scale (Table 1). The relevant values were subsequently calculated.
3.4.2. Coupling Degree Model
The concept of coupling originates from the physical sciences and has been widely used in various fields [37,38,39] to describe the intensity of interactions between two or multiple systems [40]. The CDM was utilized to analyze the interaction between regional highway transportation and new urbanization, as shown in the Formula (8).
where denotes the coupling degree, .
The classification of the coupling degree between regional highway transportation and new urbanization was determined [41], as given in Table 2.
Table 2.
Classification of coupling degree of two subsystems.
3.4.3. Coupling Coordination Degree Model
The CCDM was established to analyze the coupling coordination relationship between regional highway transportation and new urbanization development. The formulas were given as follows [42].
where represents the coupling coordination degree, ; represents the integrated development index of two subsystems of regional highway transportation and new urbanization, and denote the regional highway transportation and new urbanization index, respectively, and and represent their contribution. In this study, it is assumed that and considering that regional highway transportation can promote the development of new urbanization to some degree, but new urbanization development depends on the influence of other factors and is not limited to regional highway transportation [27,28,29,30,31,43].
Referring to the research results [44,45], the criteria for classifying the coupling coordination levels of regional highway transportation and new urbanization were determined as given in Table 3.
Table 3.
Classification of coupling coordination levels.
As shown in Table 3, the coupling coordination level of regional highway transportation and new urbanization was divided into 10 classes according to the value of the degree of coupling coordination. When the value of the coupling coordination degree is below 0.5, it belongs to the class of imbalanced development; otherwise, it belongs to the class of coordinated development.
3.5. Research Framework
In this study, a systematic framework is developed to analyze the coordination relationship between regional highway transportation and new urbanization in Heilongjiang Province, as shown in Figure 2. The main steps are:
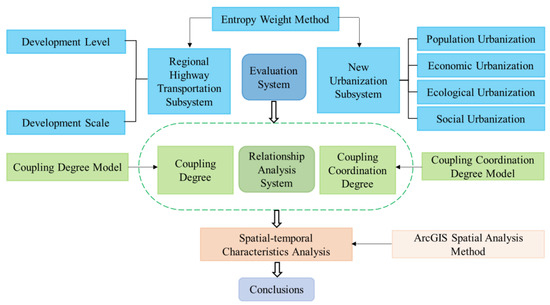
Figure 2.
Overview of research framework.
- (1)
- Construction of the index system. A regional highway transportation index subsystem from two aspects (development level and development scale) and a new urbanization subsystem from four aspects (population urbanization, economic urbanization, ecological urbanization, and social urbanization) were constructed.
- (2)
- Establishment of the analysis model. The EWM was used to evaluate the development level of regional highway transportation and new urbanization of the 12 prefecture-level cities in Heilongjiang Province, the CDM was used to measure the coupling degree between the two subsystems, and the CCDM was used to measure the coupling coordination degree between the two subsystems.
- (3)
- Analysis of the spatial–temporal characteristics. The ArcGIS spatial analysis method was used to analyze the spatial–temporal coupling evolution characteristic of the two subsystems.
- (4)
- Analysis of conclusions and suggestions. We drew the conclusions of the full text and tried to offer scientific suggestions for achieving the coordinated development between the two subsystems.
4. Results and Discussion
4.1. Weight of Each Index of Regional Highway Transportation and New Urbanization Subsystem
The weight of each index was calculated using Formulas (1)–(6), and the specific results are shown in Table 4 and Table 5.
Table 4.
Weight of index of regional highway transportation subsystem.
Table 5.
Weight of index of new urbanization subsystem.
As shown in Table 4, the three indices that have the greatest effect were car ownership per 100 households, operating vehicle ownership, and freight volume. Taken together, these indictors account for 55.3% of the total impact. As a whole, the development level is the most important factor influencing the comprehensive level of regional highway transportation at the subsystem level.
As shown in Table 5, the ecological urbanization has the maximum weight, and is the most important factor influencing the comprehensive level of new urbanization subsystem. It is followed by population urbanization, economic urbanization and social urbanization. The per capita park green space area, gas penetration rate and the proportion of the urban population employed in the secondary and tertiary industries have the greatest effect on new urbanization, accounting for 45.3% of the total impact.
4.2. Development Level of Regional Highway Transportation and New Urbanization in Each City
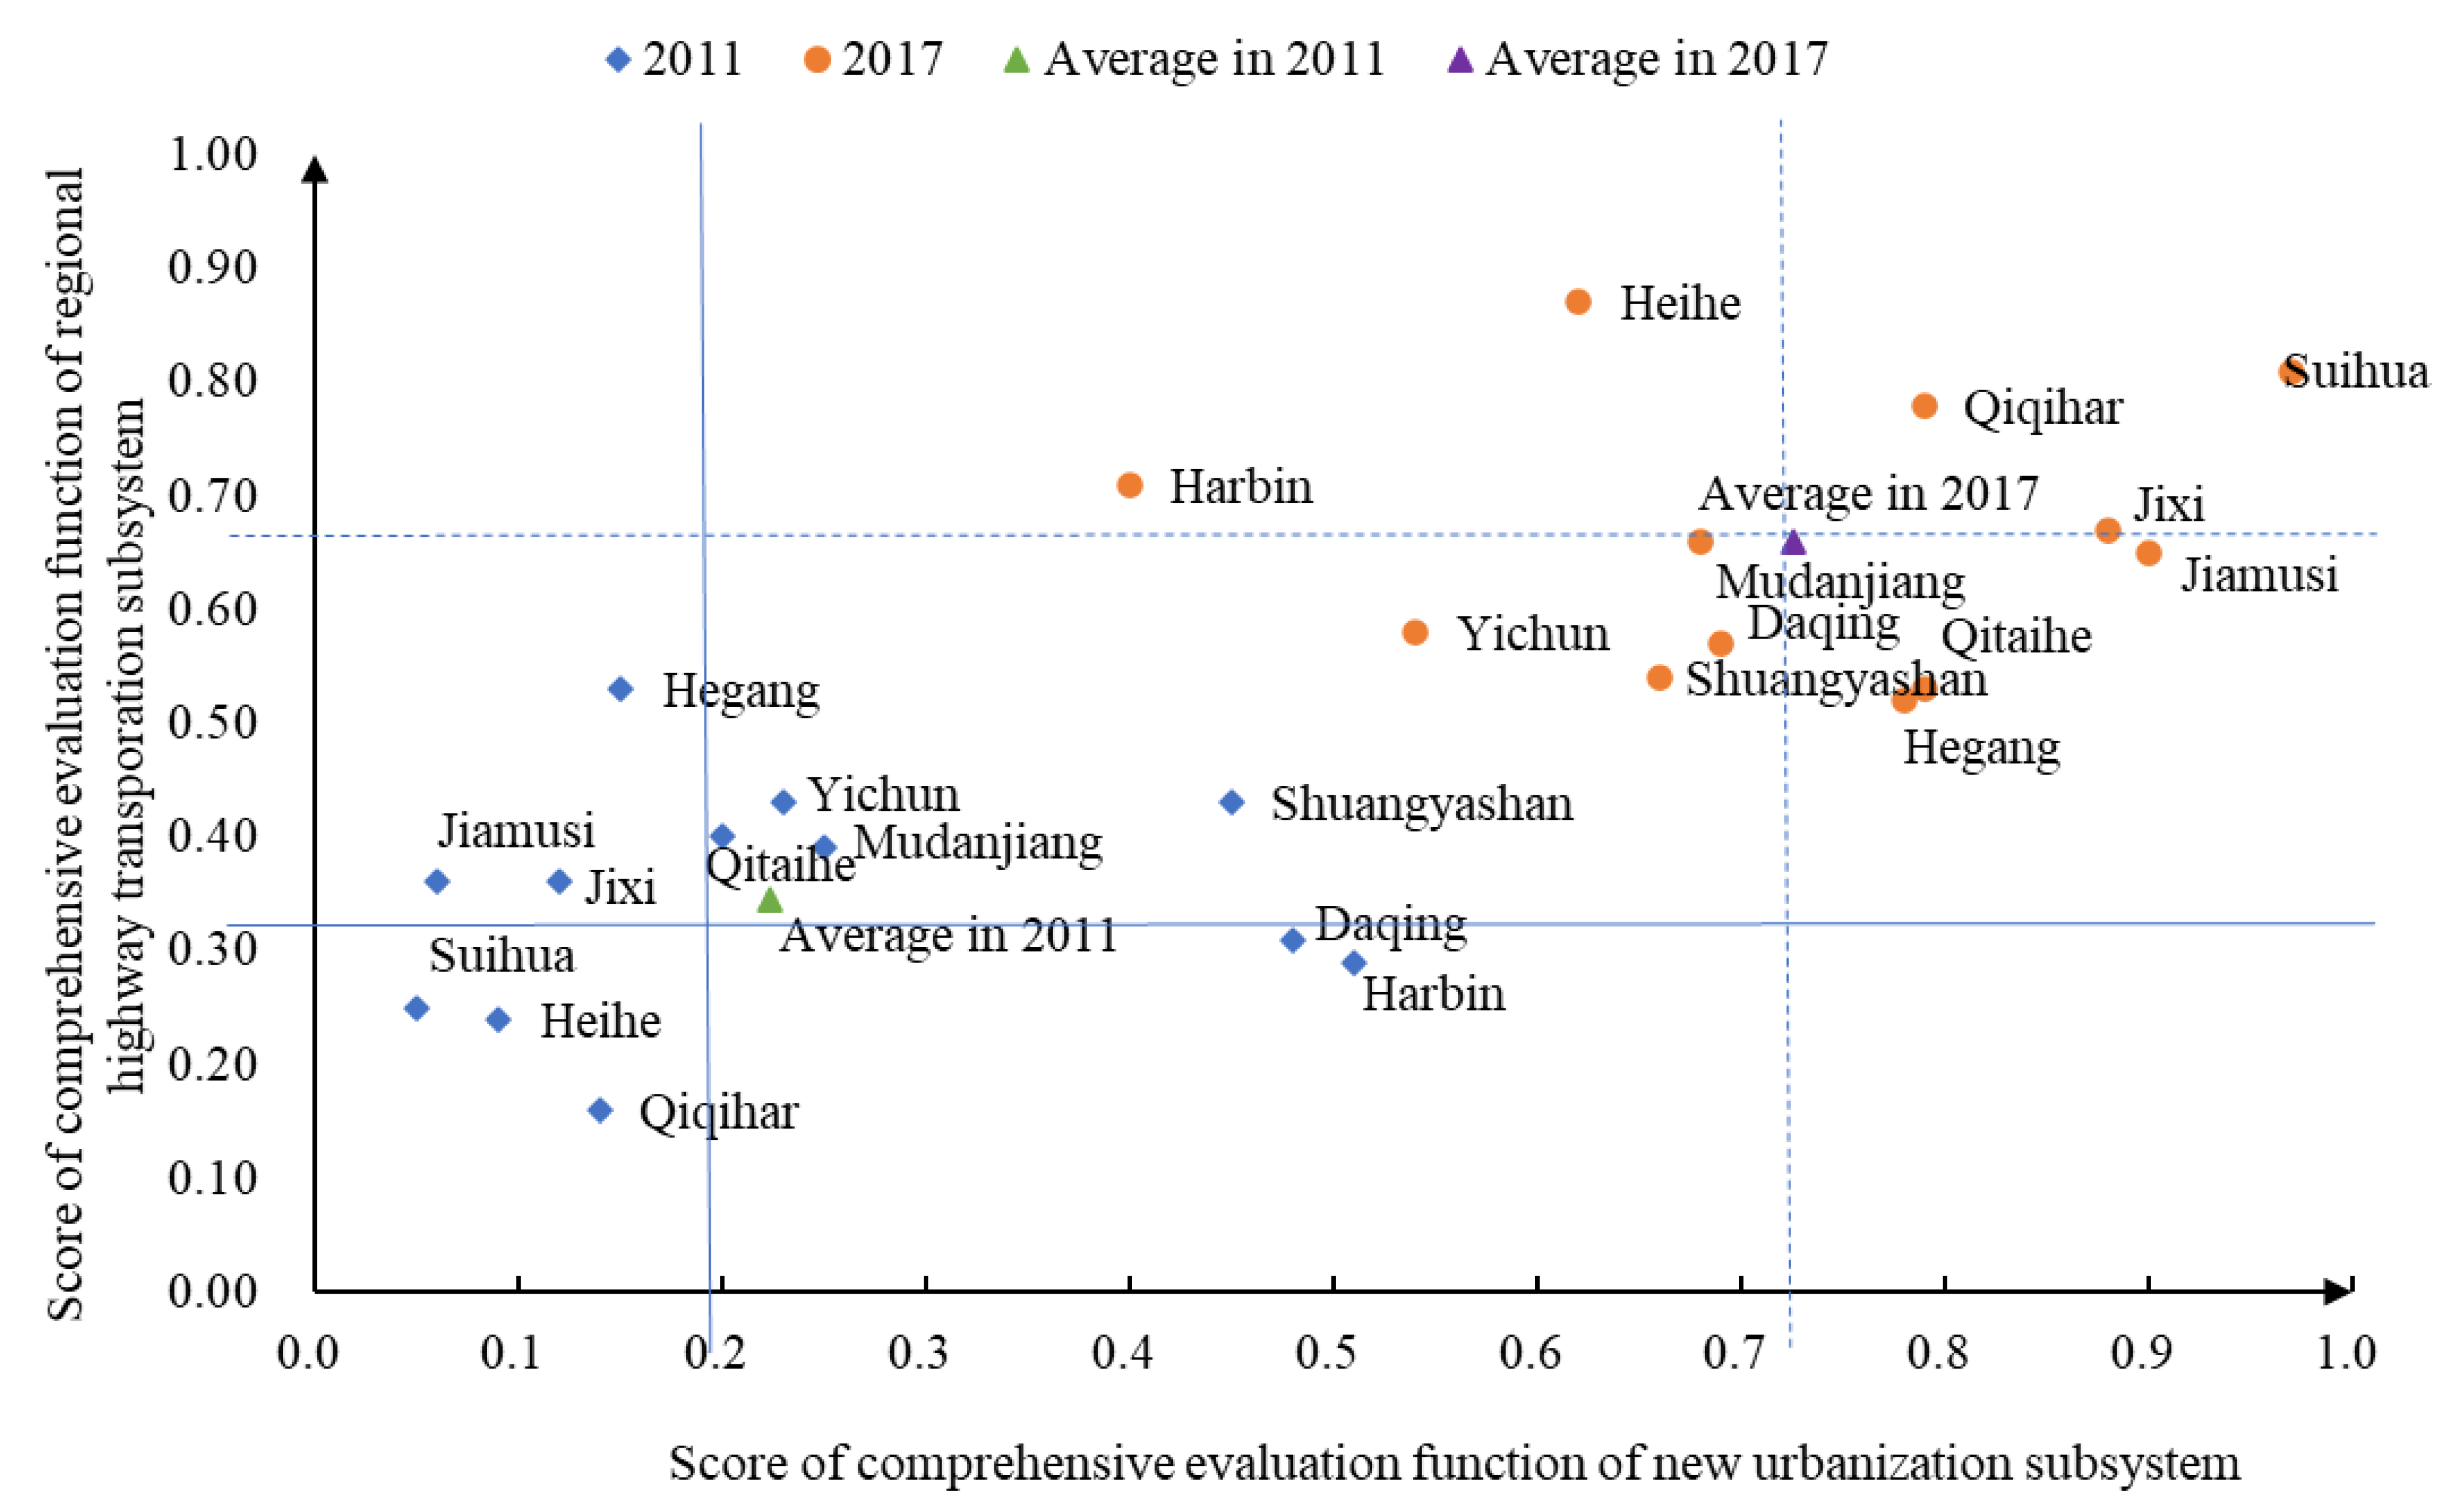
Formula (7) is utilized to evaluate the development level of regional highway transportation and new urbanization from 2011 to 2017 in Heilongjiang Province, respectively, as shown in Figure 3.

Figure 3.
The evaluation result of comprehensive evaluation function score of regional highway transportation and new urbanization of the 12 prefecture-level cities in Heilongjiang Province.
As shown in Figure 3, Suihua, Jiamusi, and Jixi are the top three cities and Harbin, Yichun, and Heihe are at the bottom in the rank of the level of new urbanization development. The average level is 0.725, a relatively high level, which means that the cities of Suihua, Jiamusi, Jixi, Qiqihar, Hegang, and Qitaihe are at a higher level, while the cities of Harbin, Yichun, Heihe, Shuangyashan, Mudanjiang and Daqing are at a lower level. The difference of regional highway transportation level is significant in 12 prefecture-level cities. The levels of regional highway transportation development vary significantly across cities. Heihe ranks the first, Suihua, Qiqihar and Harbin follow, and Qitaihe, Hegang, and Shuangyashan rank the last in the level of new urbanization development. The average level of regional highway transportation development is 0.6575, which is relatively high. The difference of regional highway transportation level is significant in 12 prefecture-level cities.
4.3. Coupling Degree between Regional Highway Transportation and New Urbanization in Each City
Figure 4 shows that the coupling degree in the CDM is more objective to reflect the interaction degree of the two subsystems in different cities.
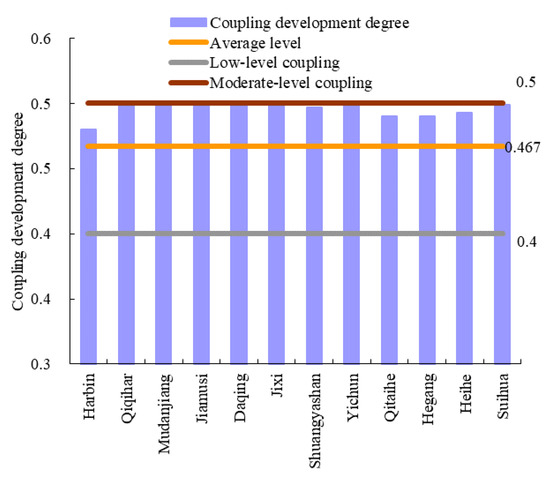
Figure 4.
Level of coupling development of two subsystems in different cities.
As shown in Figure 4, the average level of coupling development is 0.467. The prefecture-level cities with low-level coupling account for 83%, and the prefecture-level cities with moderate-level coupling account for 17%. This proves that the regional highway transportation subsystem and the new urbanization subsystem continue to develop, sometimes causing conflicts. From the development process, the coupling degree between regional highway transportation and new urbanization can be attributed to the fluctuating stage from low-level coupling to moderate-level coupling. The levels of regional highway transportation development lagged behind new urbanization.
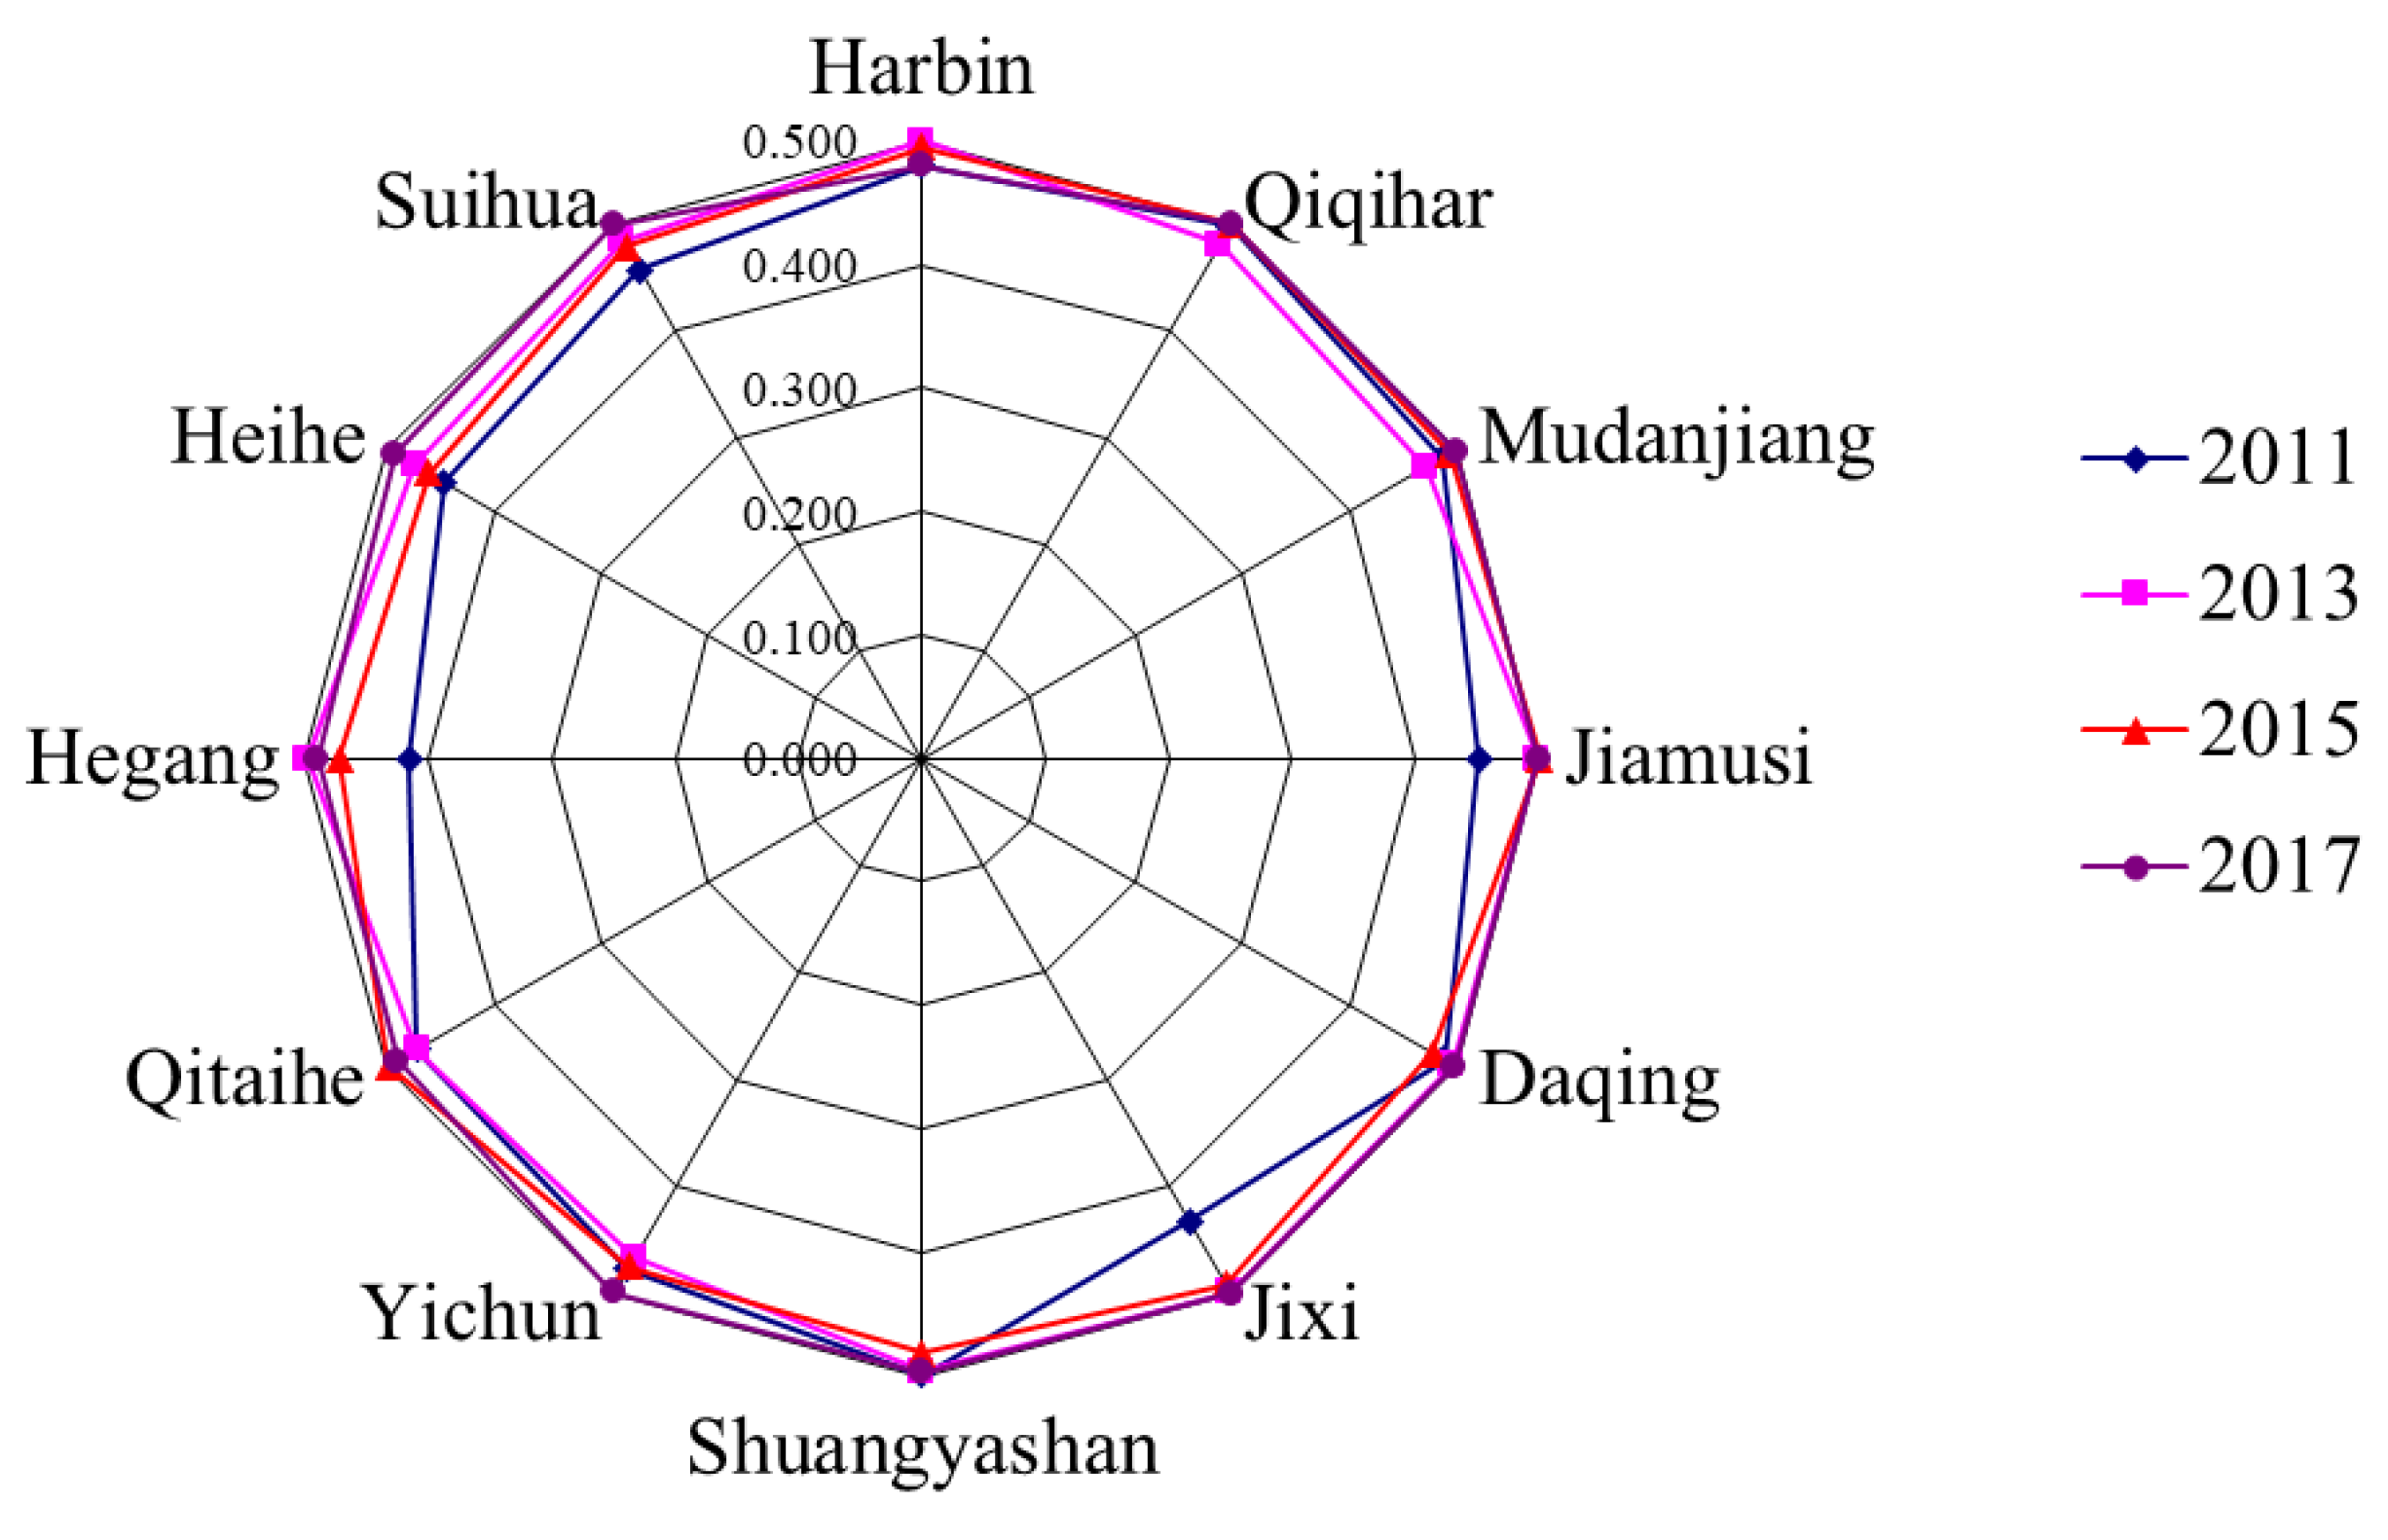
Taking 12 prefecture-level cities in Heilongjiang Province, China as research samples, the coupling degree of the two subsystems in 2011, 2013, 2015 and 2017 is calculated, and the radar map of spatial differences of coupling degree is drawn according to the classification standard of coupling degree, as shown in Figure 5.
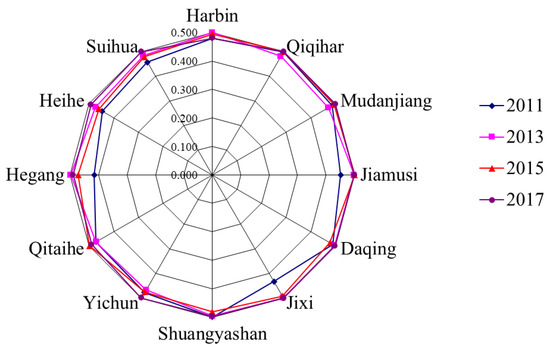
Figure 5.
Coupling degree between the two subsystems in different cities.
From the perspective of the overall development trend, the coupling values of regional highway transportation and new urbanization in Heilongjiang Province from 2011 to 2017 are distributed between 0.4 and 0.49999, and, overall, are in the antagonistic stage. In 2017, the coupling degree of most regional highway transportation and new urbanization was between 0.49 and 0.50, in the leap from the antagonism to the run-in stage. With the further development of the provincial highway network and new urbanization planning in Heilongjiang Province, the coupling degree of regional highway transportation and new urbanization will enter the run-in stage. From the perspective of the coupling degree, the average level of coupling degree was 0.467, 0.486, 0.486, and 0.495, respectively, in 2011, 2013, 2015 and 2017, and the average level of the coupling degree increased from 0.467 in 2011 to 0.495 in 2017.
4.4. Coupling Coordination Degree between Regional Highway Transportation and New Urbanization in Each City
The coupling coordination degree can better reflect the comprehensive development of both subsystems. Based on the level of regional highway transportation and new urbanization development, this study uses one kind of situation to discuss the coupling coordination development between regional highway transportation and new urbanization subsystems: and . According to the classification table of coupling coordination degree (Table 2), the majority of the prefecture-level cities have achieved coordinated development. Suihua, Qiqihar, Jixi and Jiamusi have a relatively high degree of coordination development. The results show that the coupling coordination degree between two subsystems is lower than 0.6 in the eight prefecture-level cities of Heihe, Mudanjiang, Hegang, Daqing, Qitaihe, Shuangyashan, Jixi, Yichun and Harbin. The results also show that its regional highway transportation and new urbanization development level is low, or different. The trends of the coupling coordination level between regional highway transportation and new urbanization in Heilongjiang Province are shown in Figure 6.
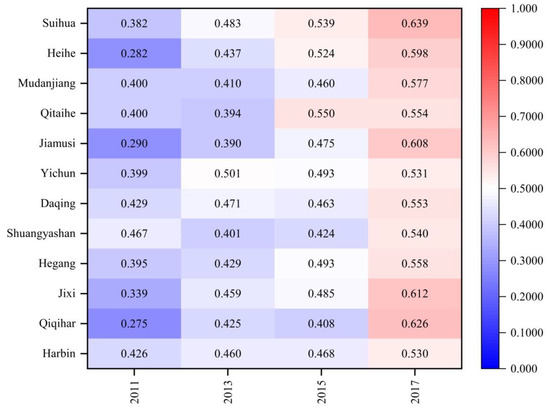
Figure 6.
Level of coupling coordination development of the two subsystems in different cities.
As shown in Figure 6, the coupling coordination level between the two subsystems in 12 prefecture-level cities increased steadily during 2011–2017. Up to 2017, most cities reached the level of being above barely coordinated, and the development trend was positive, indicating that the regional highway transportation and new urbanization development in Heilongjiang Province tended to be increasingly coordinated.
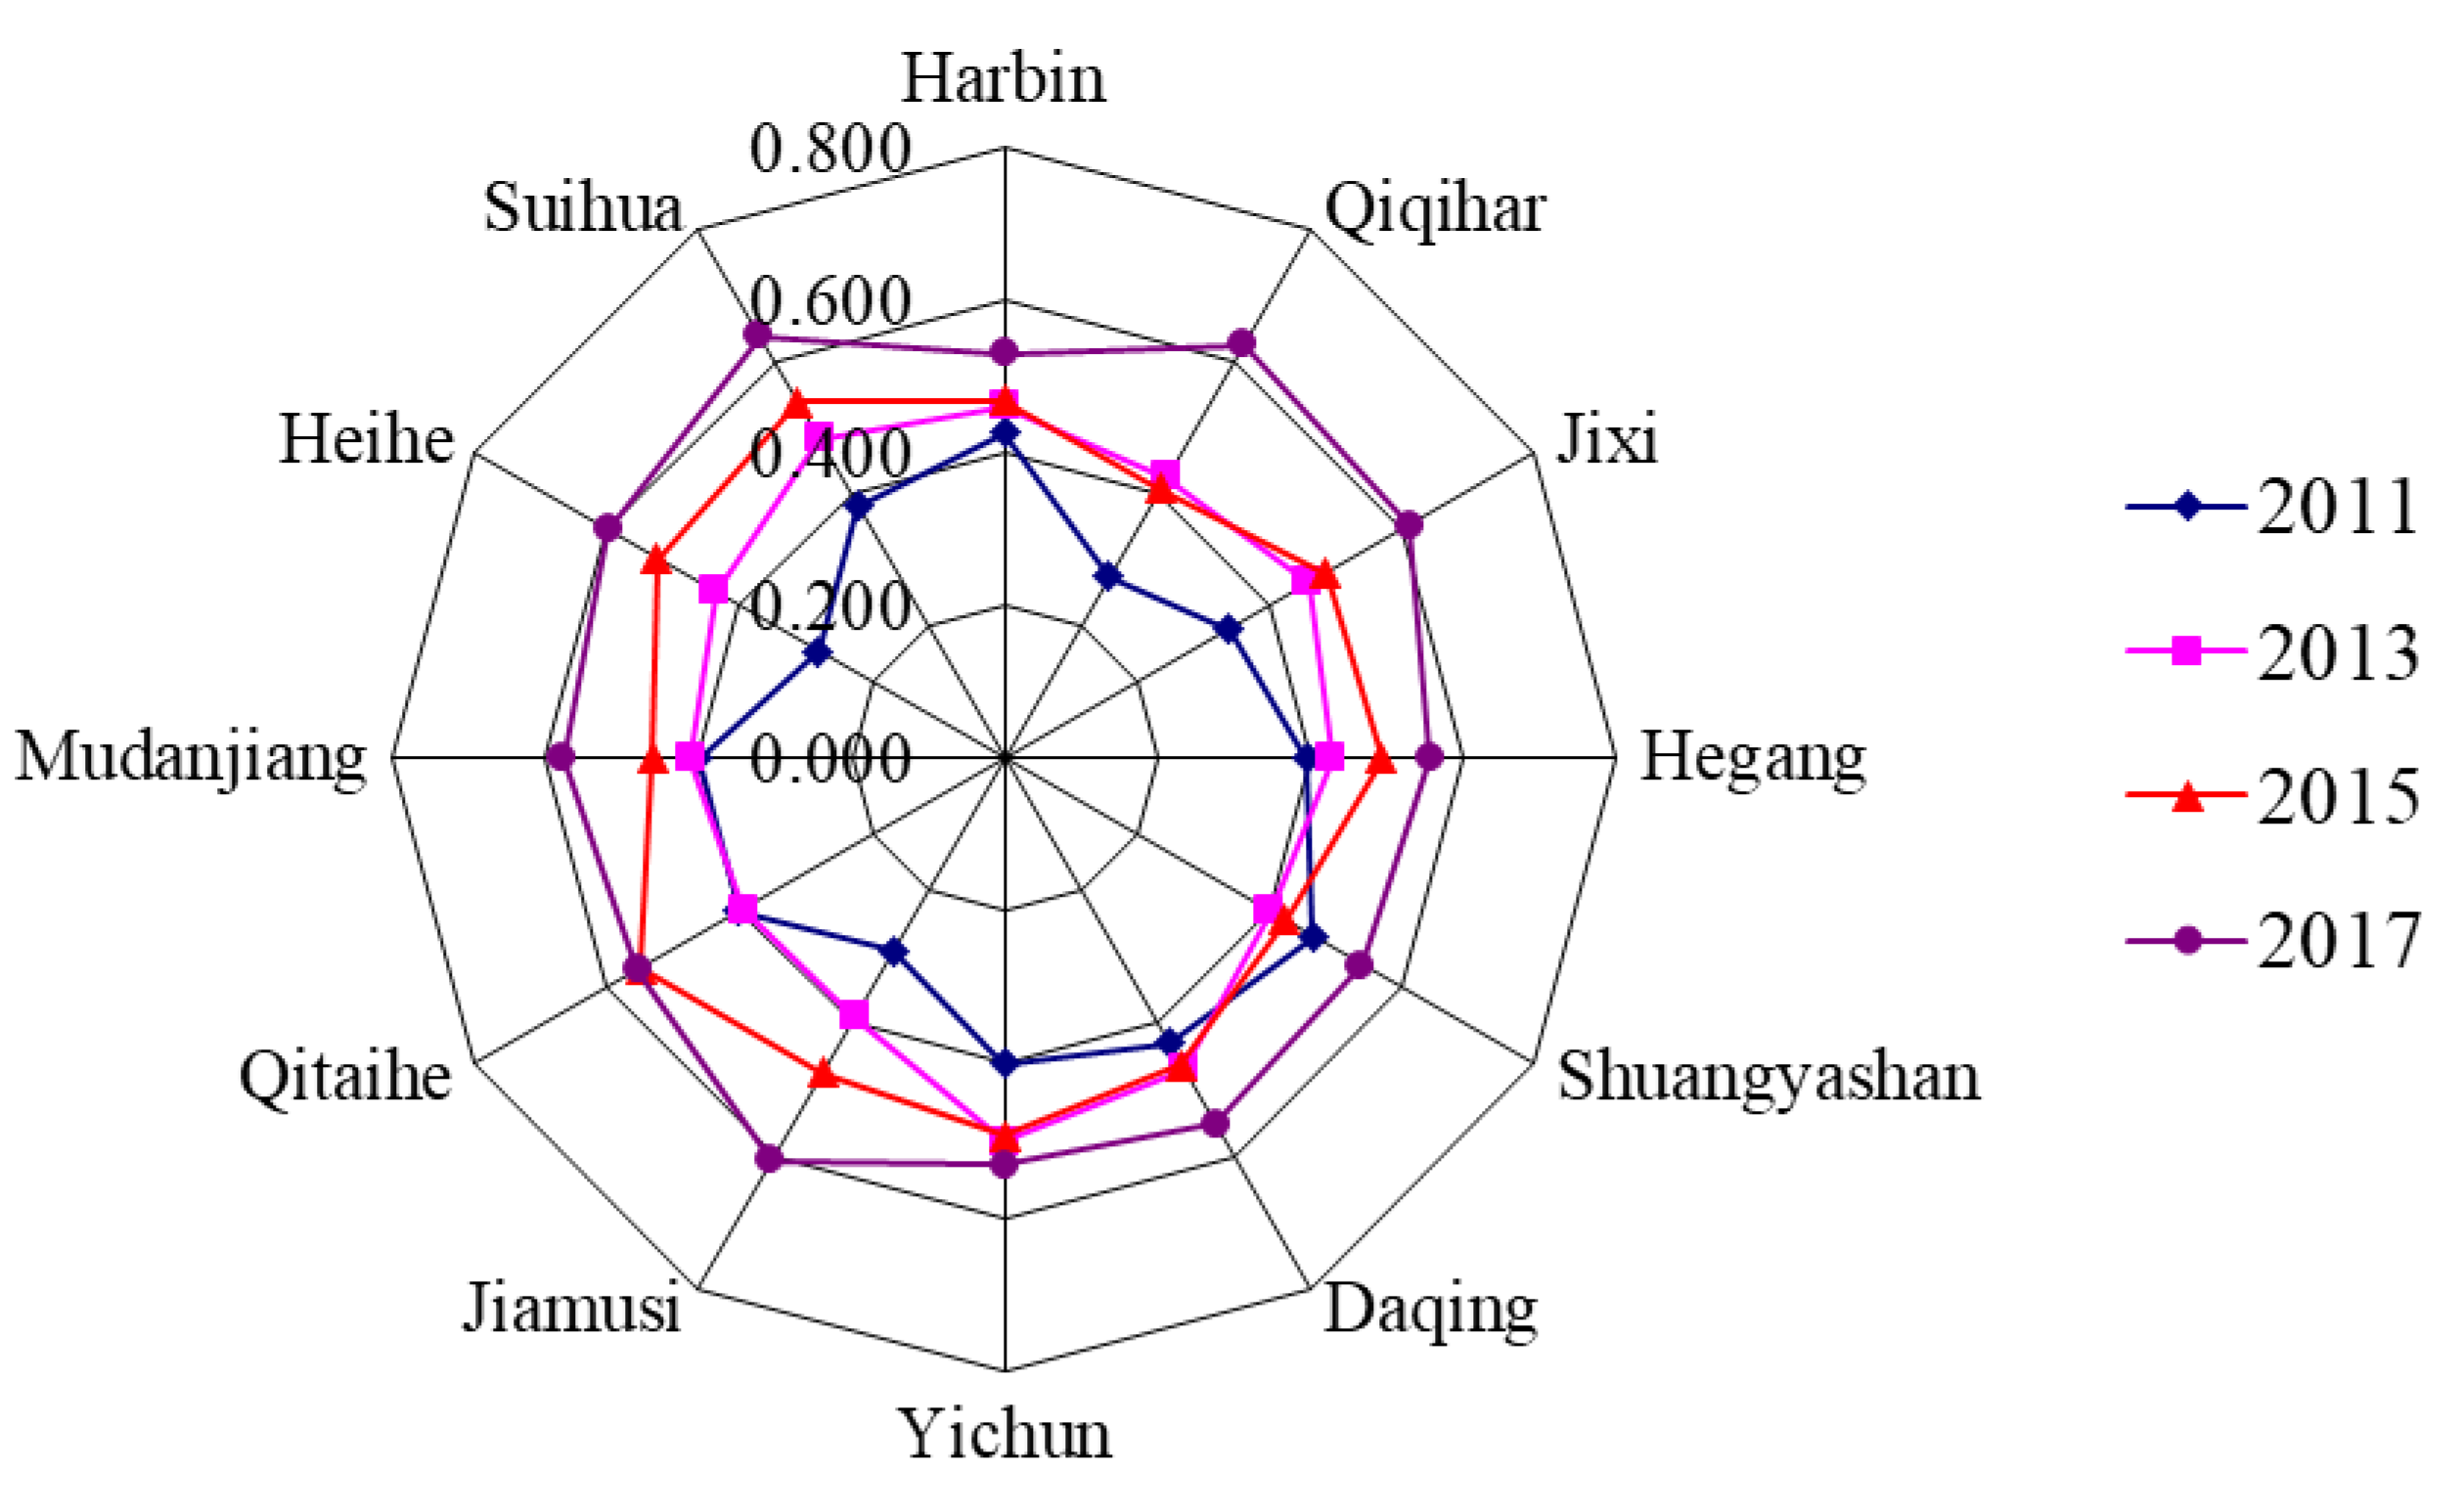
Taking 12 prefecture-level cities in Heilongjiang Province as the research samples, the coupling coordination between regional highway transportation and new urbanization in 2011, 2013, 2015 and 2017 was calculated and the spatial difference of coupling coordination degree was illustrated, as shown in Figure 7.
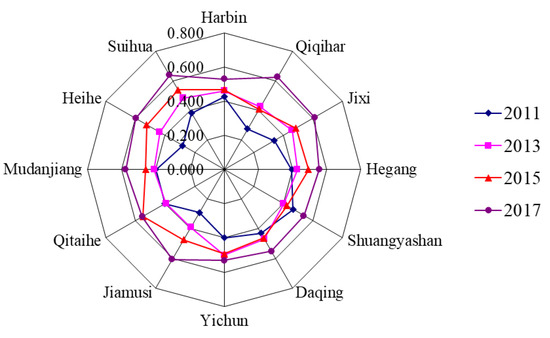
Figure 7.
Coupling coordination degree between the two subsystems in different cities.
From the perspective of overall development trends, the coupling coordination degree between regional highway transportation and new urbanization in Heilongjiang Province showed a good growth trend, and the overall level has been continuously improved. In 2011, the coupling coordination degree was distributed between 0.2000 and 0.4999, which was overall in the disorder stage, including three cities in moderate disorder, and four and five on the verge of disorder. In 2017, the coupling coordination degree was between 0.5000 and 0.6999, and overall was in the coordination stage, including eight cities in the barely coordinated stage and four in the primary coordination stage. From the perspective of the degree of coupling coordination, the 12 prefecture-level cities in 2011, 2013, 2015 and 2017 were 0.374, 0.438, 0.482, and 0.577, respectively, and the average level of coupling coordination rose from 0.374 in 2011 to 0.577 in 2017.
4.5. Spatial Evolution of the Coupling Coordination between Regional Highway Transportation and New Urbanization
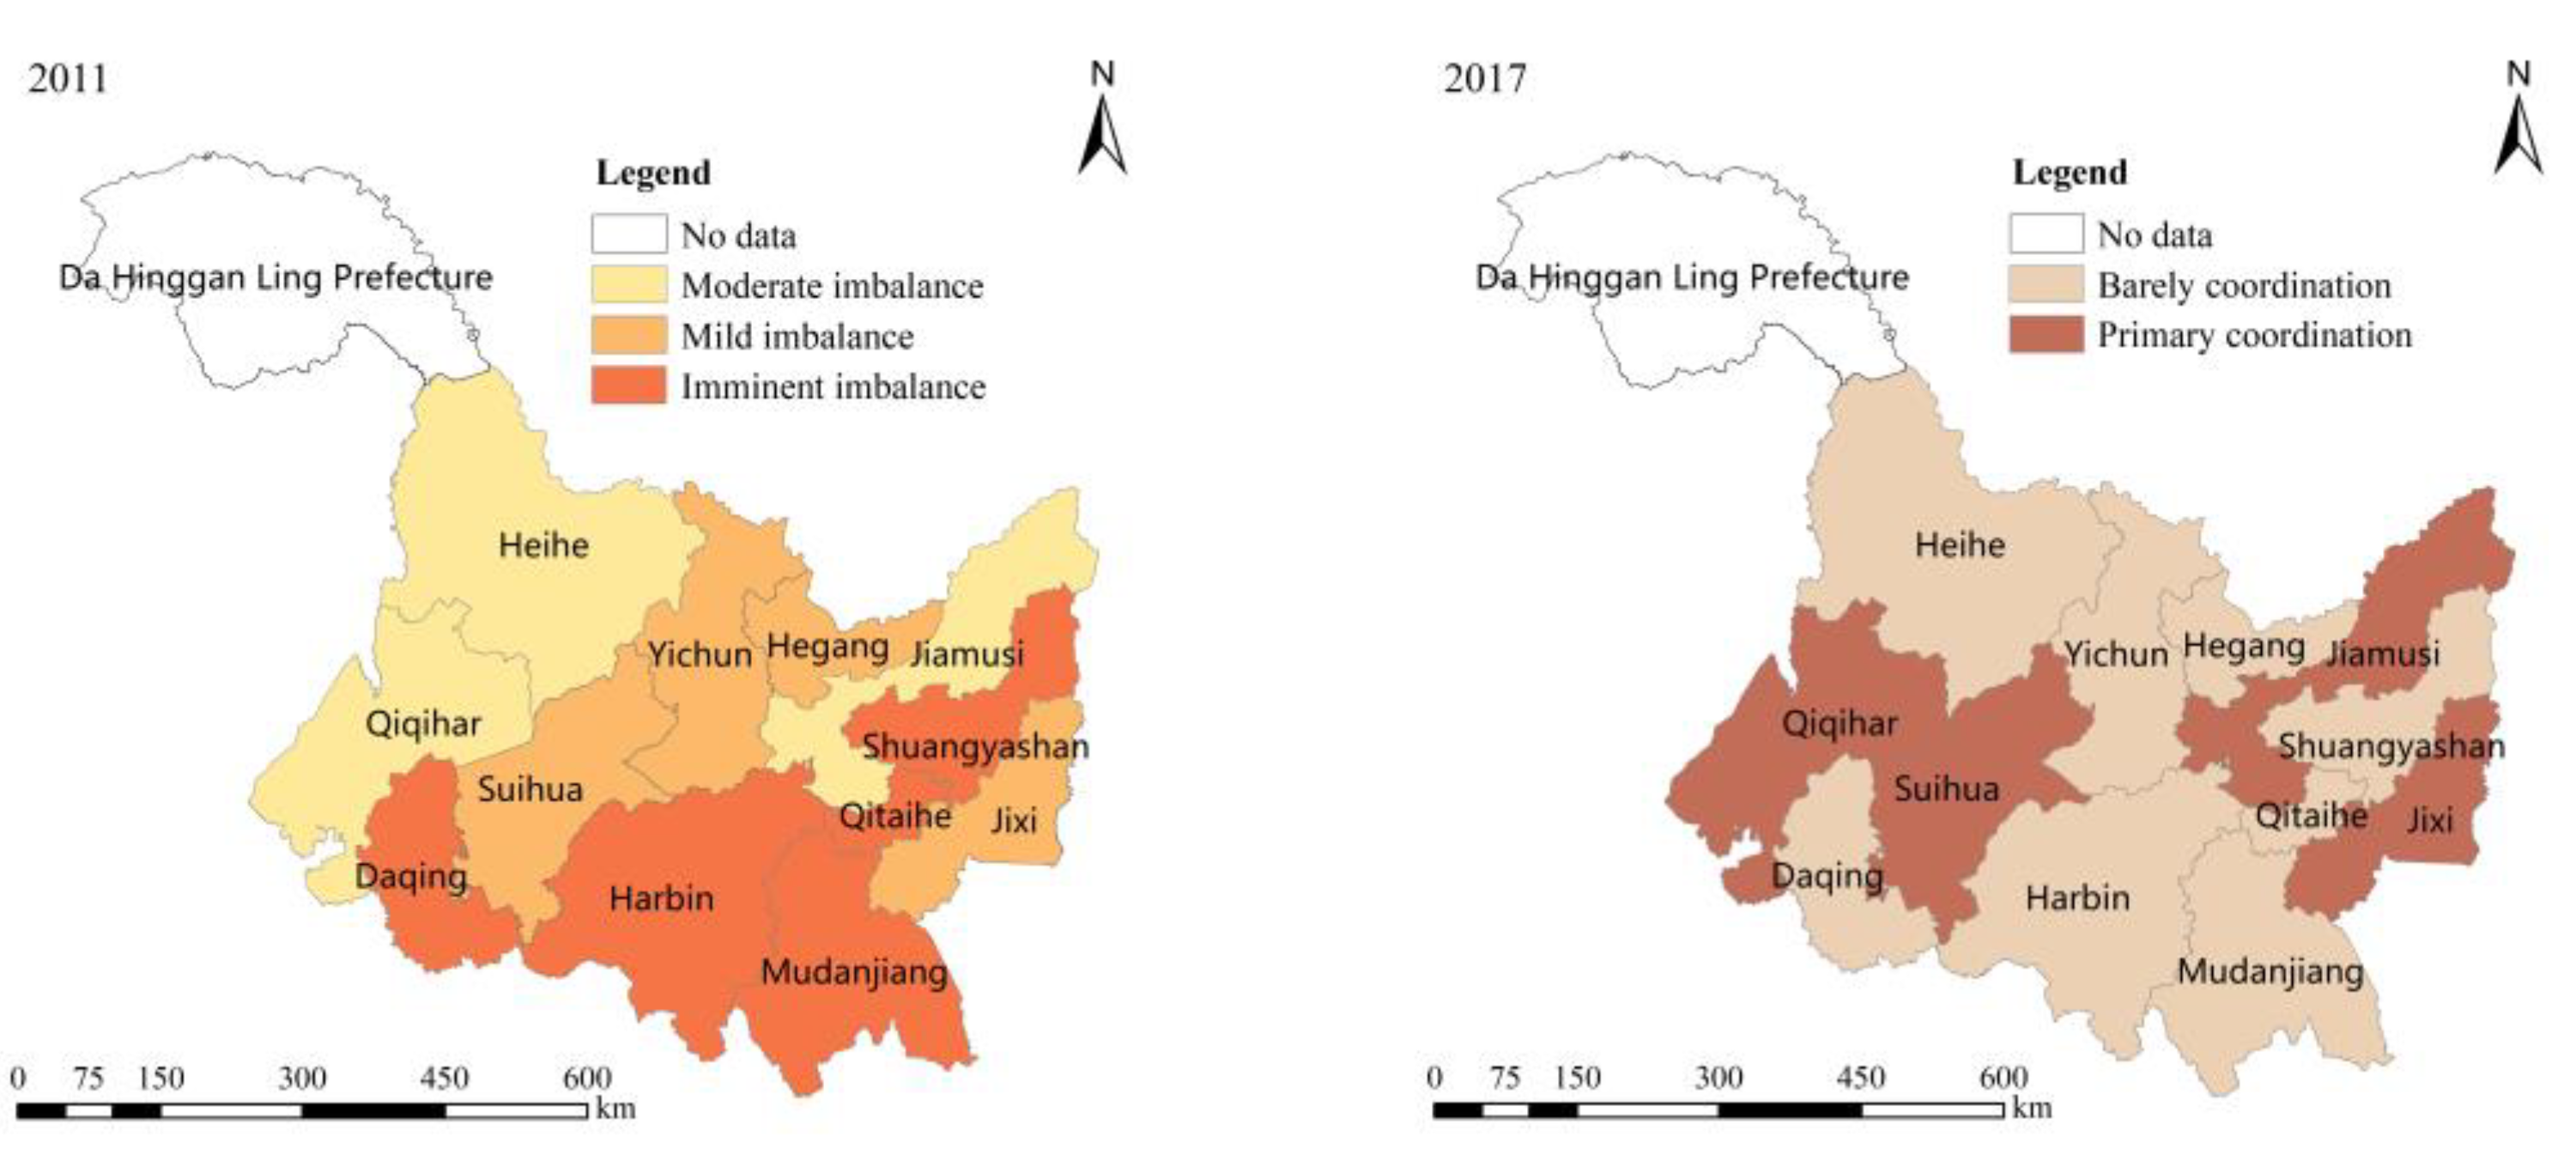
There are spatial–temporal characteristics in the coupling system of regional highway transportation and new urbanization. Therefore, it is important to explore the spatial evolution of the coupling coordination between regional highway transportation and new urbanization in Heilongjiang Province, China. In order to further analyze the spatial evolution of the coupling coordination between regional highway transportation and new urbanization, the data on the degree of coupling coordination between the two subsystems in 12 prefecture-level cities in Heilongjiang province were selected and visualized using the ArcGIS 10.2 software platform, as shown in Figure 8.
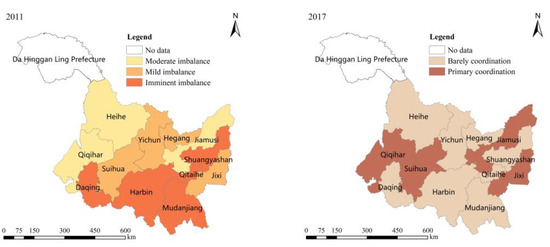
Figure 8.
Spatial–temporal coupling coordination evolution between regional highway transportation and new urbanization in Heilongjiang Province.
From the perspective of spatial differences, there are obvious regional differences in the coupling coordination degree between regional highway transportation and new urbanization. In 2011, the coupling coordination of regional highway transportation and new urbanization in Heilongjiang Province was in the disorder stage, including the five cities of Harbin, Daqing, Mudanjiang, Shuangyashan and Qitaihe that were on the verge of imbalance; the cities of Jixi, Suihua, Hegang and Yichun were in the mild disorder stage, and Qiqihar, Jiamusi and Heihe cities were in the moderate imbalance stage. In 2017, the coupling of regional highway transportation and new urbanization in Heilongjiang Province is in the coordination stage. Harbin, Daqing, Mudanjiang, Shuangyashan, Qitaihe, Hegang, Yichun and Heihe are in the barely coordinated stage, while Qiqihar, Suihua, Jiamusi and Jixi are in the primary coordination stage. On the whole, the coordination level of regional highway transportation and new urbanization in Heilongjiang Province, China has been continuously improving, with significant spatial differentiation characteristics.
5. Conclusions
The former analysis suggests that there is a significant positive correlation between regional highway transportation and new urbanization. In addition, the results of the empirical analysis vary by taking different regions as research areas. The work presented in this paper has explored the coupling coordination relationship between regional highway transportation and new urbanization to provide support for regional sustainable development in Heilongjiang Province, China. Based on the data on regional highway transportation and new urbanization development in Heilongjiang Province, China from 2011 to 2017, using the comprehensive evaluation model, the coupling coordination model and ArcGIS spatial analysis technology, we measured the coordination degree of regional highway transportation and new urbanization in 12 prefecture-level cities in Heilongjiang Province, China, analyzed the spatial–temporal evolution characteristics of coordinated development and revealed the spatial–temporal coupling law of regional highway transportation and new urbanization. The following conclusions were obtained:
- (1)
- The regional highway transportation and new urbanization in Heilongjiang Province, China shows a steady development trend. The comprehensive evaluation value of the regional highway transportation development level increased from 0.243 in 2011 to 0.537 in 2017, and the comprehensive evaluation value of the new urbanization development level increased from 0.189 in 2011 to 0.767 in 2017. Regional highway transportation is not synchronized with the development of new urbanization, and the development of regional highway transportation lags behind the development of new urbanization in Heilongjiang Province, China.
- (2)
- The coupling degree of regional highway transportation and new urbanization is in the antagonistic stage to the run-in stage, the coupling degree is at a low level, the growth range is small, and there are certain regional differences in Heilongjiang Province, China.
- (3)
- The coupling coordination degree of regional highway transportation and new urbanization crossed from the disorder stage in 2011 to the coordination stage in 2017, and the coordination level has been continuously improved in Heilongjiang Province, China. From the overall spatial difference in the degree of coupling coordination, it is determined that the spatial difference characteristics are prominent.
Due to data limitations, the coupling coordination between regional highway transportation and new urbanization is developed from a municipal scale in this paper. In the future, we need to build the multiscale and multimechanism analysis framework of coupling coordination development between the two subsystems. In order to understand the spatial scale effect of coupling coordination development between the two subsystems, we need to explore the coupling evolution characteristics and coordination mechanism between the two subsystems based on multiscale analysis.
Author Contributions
Conceptualization, B.W. (Biao Wu); methodology, B.W. (Biao Wu) and X.J.; software, X.J. and D.L.; validation, B.W. (Biao Wu), X.J. and B.W. (Baojie Wang); formal analysis, X.J.; investigation, B.W. (Biao Wu) and X.J.; resources, B.W. (Biao Wu); data curation, X.J.; writing—original draft preparation, B.W. (Biao Wu) and X.J.; writing—review and editing, B.W. (Biao Wu) and B.W. (Baojie Wang); visualization, X.J. and D.L.; supervision, B.W. (Biao Wu); project administration, B.W. (Biao Wu); funding acquisition, B.W. (Biao Wu) and B.W. (Baojie Wang). All authors have read and agreed to the published version of the manuscript.
Funding
This research was supported by the Humanities and Social Fund of Ministry of Education (No. 21YJA790060), the Key Research and Development Plan-Guidance Project of Heilongjiang Province (No. GZ20210152), the Program for Provincial-Level Leading Talents Team Training of Heilongjiang Institute of Technology (No. 2020LJ04) and the Fundamental Research Funds for the Central Universities, CHD (No. 300102342508).
Institutional Review Board Statement
Not applicable.
Informed Consent Statement
Not applicable.
Data Availability Statement
The data used to support the findings of this study are available from the author.
Conflicts of Interest
The authors declare no conflict of interest.
References
- Henderson, V. The urbanization process and economic growth: The so-what question. J. Econ. Growth 2003, 8, 47–71. [Google Scholar] [CrossRef]
- Xiang, W.; Wang, Y.; Li, N.; Zhu, Q.W. Grey-relation Analysis of Traffic System and Urbanization in Jilin Province of China. Chin. Geogr. Sci. 2007, 17, 216–221. [Google Scholar] [CrossRef]
- Yang, R. Spatial coupling cooperative analysis of road transport superiority and urbanization at county level in China. Prog. Geogr. 2016, 35, 806–815. [Google Scholar]
- Kotavaara, O.; Antikainen, H.; Rusanen, J. Urbanization and Transportation in Finland, 1880–1970. J. Interdiscipl. Hist. 2011, 42, 89–109. [Google Scholar] [CrossRef]
- Fan, Y.J. Study on the leading of transportation to new urbanization in advance. China Transport. Rev. 2012, 48–52. [Google Scholar]
- Li, H.M.; Xi, K.W. Analysis on the development countermeasures of transportation to adapt to the new urbanization strategy. Acad. Forum. 2013, 36, 148–151. [Google Scholar]
- Wanke, P.; Barros, C.P.; Figueiredo, O. Efficiency and productive slacks in urban transportation modes: A two-stage SDEA-Beta Regression approach. Util. Policy 2016, 41, 31–39. [Google Scholar] [CrossRef]
- Shan, L.L. The development framework of integrated transportation for Cheng-Yu urban agglomeration under the background of new urbanization. China Transport. Rev. 2016, 38, 40–43. [Google Scholar]
- Poumanyvong, P.; Kaneko, S.; Dhakal, S. Impacts of urbanization on national transport and road energy use: Evidence from low, middle and high income countries. Energy Policy 2012, 46, 268–277. [Google Scholar] [CrossRef]
- Li, T. New urbanization and transportation development. Urban Traffic 2014, 12, 1–4. [Google Scholar]
- Wang, X.R.; Rong, C.H. Study on the interactive development of urbanization and transportation. Inq. Econ. Issues 2014, 52–57. [Google Scholar] [CrossRef]
- Liu, Y.; Wang, Q.L. Research on highway traffic interaction with urbanization. Ecol. Econ. 2017, 33, 140–145. [Google Scholar]
- Wu, G.X. Study on coordinated development strategy for transportation and new urbanization. Highw. Transp. Inn. Mong. 2018, 44–49. [Google Scholar] [CrossRef]
- Song, J.M.; Li, Z.K.; Zhao, Z. Impact analysis of Henan highway transportation on urbanization development. J. Eng. Manag. 2012, 26, 32–35. [Google Scholar]
- Li, X.Y. Research on the influence of highway traffic on new urbanization in Henan province. J. North China Univ. Water Resour. Electr. Power 2016, 32, 43–47. [Google Scholar]
- Chen, Z.Z.; Ou, G.L. Effect analysis of highway infrastructure on regional urbanization in China-based on regional comparison. Lanzhou Acad. J. 2014, 143–151. [Google Scholar] [CrossRef]
- Mo, Y.H.; Zhang, P.L.; Xie, Y.M. Quantitative study on interaction between urbanization and integrated transportation development. J. Transport. Syst. Eng. Info. Technol. 2019, 19, 95–102. [Google Scholar]
- Tang, L.N.; Li, Y.Y. Empirical test on the promotion of new urbanization by transportation. J. Chang. Univ. 2019, 21, 44–53. [Google Scholar]
- Guo, Y.S. Study on the Relationship between Regional Highway Development and New Urbanization in Shaanxi Province; Chang’an University: Xi’an, China, 2019. [Google Scholar]
- Wu, B.; Guo, Y.J.; Dai, T.Y.; Xu, D.W.; Song, C.J. An empirical study on co-integration relationship between regional highway transport and new pattern urbanization. J. Highw. Transp. Res. Dev. 2020, 37, 145–150. [Google Scholar]
- Liu, S.W.; Xu, Z.Y.; Tang, H.T. A spatial econometric analysis on the contribution of road infrastructure to central regional urbanization. Econ. Geogr. 2011, 31, 237–241+253. [Google Scholar]
- Yang, C.; Han, Q.X.; Xu, Q.Q. Effects of transportation infrastructure and its spatial spillover on urbanization-Analysis based on provincial panel data. Urban. Probl. 2015, 64–70. [Google Scholar] [CrossRef]
- Deng, D.X. Effects of transportation infrastructure on urbanization in China-Spatial measurement analysis based on interprovincial panel data. J. Comml. Econ. 2016, 168–169. [Google Scholar] [CrossRef]
- Zhou, H.; Zeng, B. Has transport infrastructure promoted Central China urbanization development? Based on the spatial econometric evidence of the panel data. East China Econ. Manag. 2016, 30, 75–79. [Google Scholar]
- Tang, R.H.; Liu, W.P. Study on the adaptability of integrated transportation service system under the background of new urbanization. Southeast Acad. Res. 2016, 54–60. [Google Scholar] [CrossRef]
- Tang, R.H.; Liu, W.P. Study on the cooperative subarea of integrated transportation service and new urbanization in Fujian province. Fujian Trib. 2016, 1, 166–171. [Google Scholar]
- Wu, Y.J.; Zhang, M.Q. New-approach urbanization, traffic network and service industry agglomeration—A view based on spatiotemporal coupling. Soft Sci. 2016, 30, 1–5. [Google Scholar]
- Chen, Z.N.; Jiang, J.; Zeng, S.Y. Coordinate development between urbanization and interregional transportation—A case study of prefecture-level cities in Guangdong Province. Areal Res. Dev. 2016, 35, 54–60. [Google Scholar]
- You, X.B.; Yang, Q.S.; Fu, Y.F. Study on the coupling development of regional traffic system and urban system—A case study of Chaozhou city, Guangdong Province. Econ. Geogr. 2017, 37, 96–102. [Google Scholar]
- Ji, X.F.; Jiang, L.; Chen, F. Spatio-temporal cooperative evolution analysis of transportation superiority and county urbanization in Yunnan Province. Sci. Geogr. Sin. 2017, 37, 1875–1884. [Google Scholar]
- Wang, D.G.; Sun, F. Geographic patterns and coupling-coordination between urbanization and land transportation accessibility in the Yangtze River Economic Zone. Sci. Geogr. Sin. 2018, 38, 1089–1097. [Google Scholar]
- He, J.Q.; Wang, S.J.; Liu, Y.Y.; Ma, H.T.; Liu, Q.Q. Examining the relationship between urbanization and the eco-environment using a coupling analysis: Case study of Shanghai, China. Ecol. Indic. 2017, 77, 185–193. [Google Scholar] [CrossRef]
- Yu, Y.; Tong, Y.; Tang, W.W.; Yuan, Y.B.; Chen, Y. Identifying spatiotemporal interactions between urbanization and eco-environment in the urban agglomeration in the middle reaches of the Yangtze River, China. Sustainability 2018, 10, 290. [Google Scholar] [CrossRef]
- Wang, Q.; Yuan, X.; Zhang, J.; Gao, Y.; Hong, J.; Zuo, J.; Liu, W. Assessment of the sustainable development capacity with the entropy weight coefficient method. Sustainability 2015, 7, 13542–13563. [Google Scholar] [CrossRef]
- Zhao, J.; Ji, G.; Tian, Y.; Chen, Y.L.; Wang, Z. Environmental vulnerability assessment for mainland China based on entropy method. Ecol. Indic. 2018, 91, 410–422. [Google Scholar] [CrossRef]
- Yang, L.; Sun, Z. The development of western new-type urbanization level evaluation based on entropy method. Econ. Probl. 2015, 115–119. [Google Scholar] [CrossRef]
- Li, Y.F.; Li, Y.; Zhou, Y.; Shi, Y.L.; Zhu, X.D. Investigation of a coupling model of coordination between urbanization and the environment. J. Environ. Manag. 2012, 98, 127–133. [Google Scholar] [CrossRef] [PubMed]
- Song, W.X.; Bai, C.Q.; Liao, W.Q.; Zhou, R. Coupling coordination between the level of economic development and the quality of residents’ life in the Yangtze River Delta region. Resour. Environ. Yangtze Basin 2013, 22, 1382–1388. [Google Scholar]
- Li, Q.; Wei, Y.; Dong, Y. Coupling analysis of China’s urbanization and carbon emissions: Example from Hubei Province. Nat. Hazards 2016, 81, 1333–1348. [Google Scholar] [CrossRef]
- Cheng, H.; Xu, Q.; Guo, Y.Q. Temporal and spatial evolution of the coupling coordinated between tourism resources development and ecological environment in China. Econ. Geogr. 2019, 39, 233–240. [Google Scholar]
- Wang, Z.F.; Du, Y.Y. A study on the coupling of traffic-tourism industry-ecological environment in the middle of the Yangtze River. Resour. Environ. Yangtze Basin 2020, 29, 1910–1921. [Google Scholar]
- Kong, W.; Ren, L.; Wang, S.J.; Liu, Y.F. Spatial and temporal evolution of the ecological environment and economy coordinated development in Hebei Province, China. Chin. J. Appl. Ecol. 2016, 27, 2941–2949. [Google Scholar]
- Ma, H.; Wu, H.; Lu, B.S.; Cui, Z.H.; Du, Y.S. Analysis on the influence mechanism of transportation network for the economy level of region tourism: A case of Yanbian prefecture. Agric. Sci. J. Yanbian Univ. 2018, 40, 14–23. [Google Scholar]
- Liao, C.B. Quantitative evaluation and classification system of the coordinated development between environment and economy: A case study of the urban agglomeration in the Pearl River Delta. Trop. Geo. 1999, 19, 171–177. [Google Scholar]
- Fei, J.; Lin, Y.; Jiang, Q.; Jiang, K.; Li, P.; Ye, G. Spatiotemporal coupling coordination measurement on islands’ economy-environment-tourism system. Ocean Coast. Manag. 2021, 212, 105793. [Google Scholar] [CrossRef]


Disclaimer/Publisher’s Note: The statements, opinions and data contained in all publications are solely those of the individual author(s) and contributor(s) and not of MDPI and/or the editor(s). MDPI and/or the editor(s) disclaim responsibility for any injury to people or property resulting from any ideas, methods, instructions or products referred to in the content. |
© 2023 by the authors. Licensee MDPI, Basel, Switzerland. This article is an open access article distributed under the terms and conditions of the Creative Commons Attribution (CC BY) license (https://creativecommons.org/licenses/by/4.0/).