
Influence of Climate Warming on the Ground Surface Stability over Permafrost along the Qinghai–Tibet Engineering Corridor

Abstract
:1. Introduction
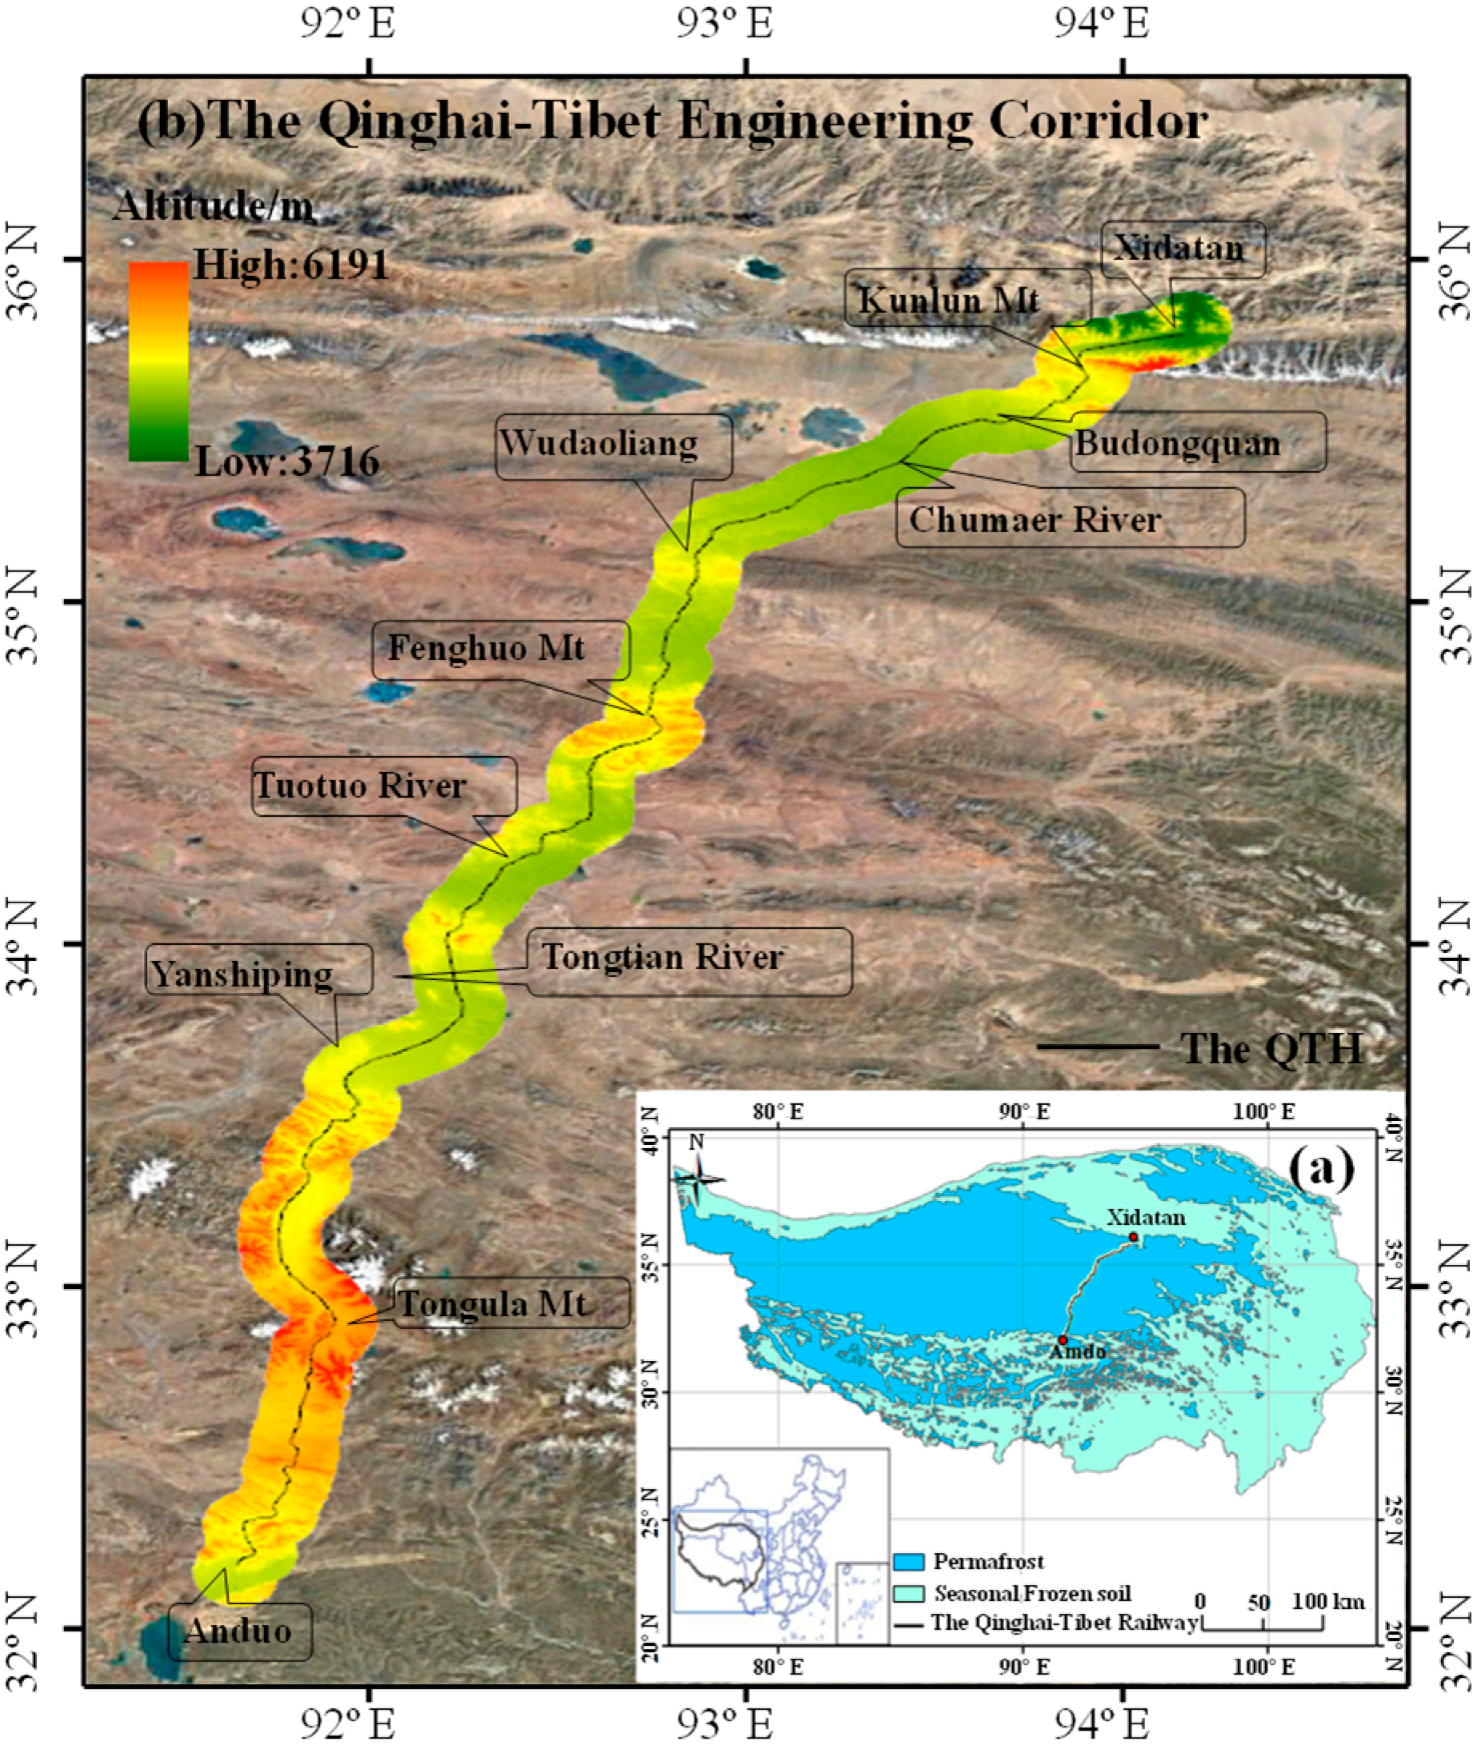
2. Study Area
3. Data Sets and Method
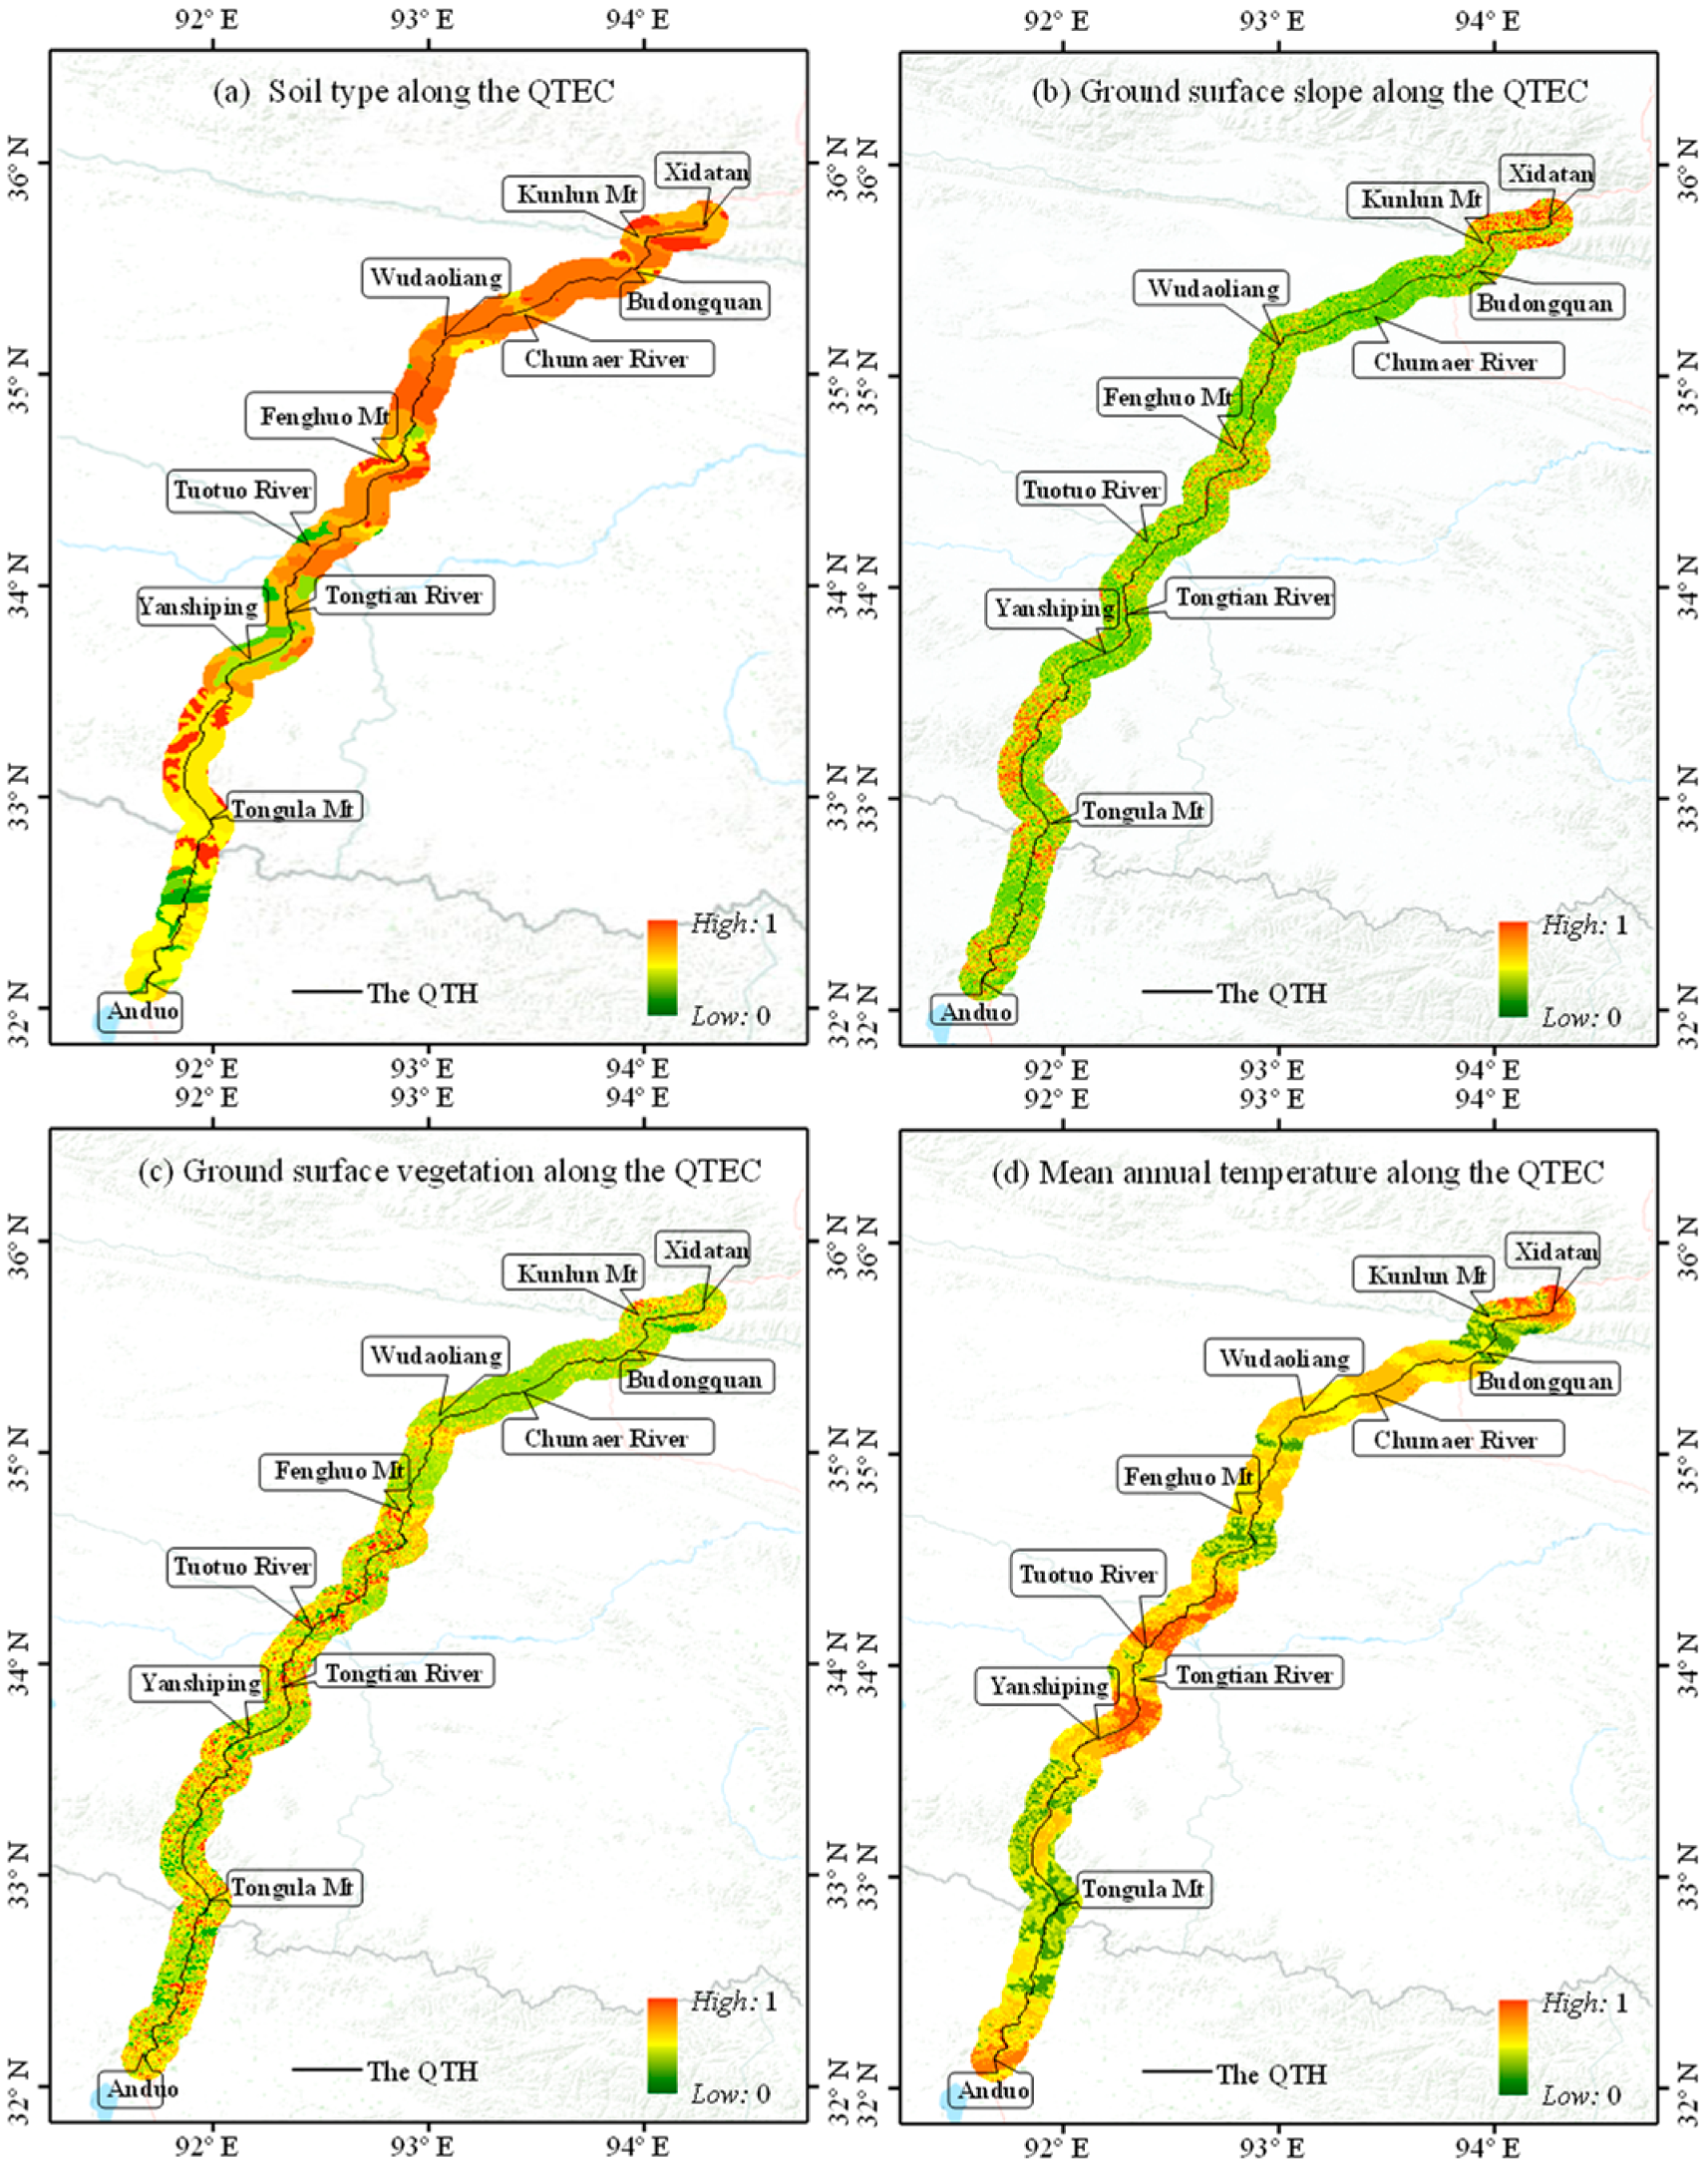
3.1. Data and Processing
3.1.1. Basic Data
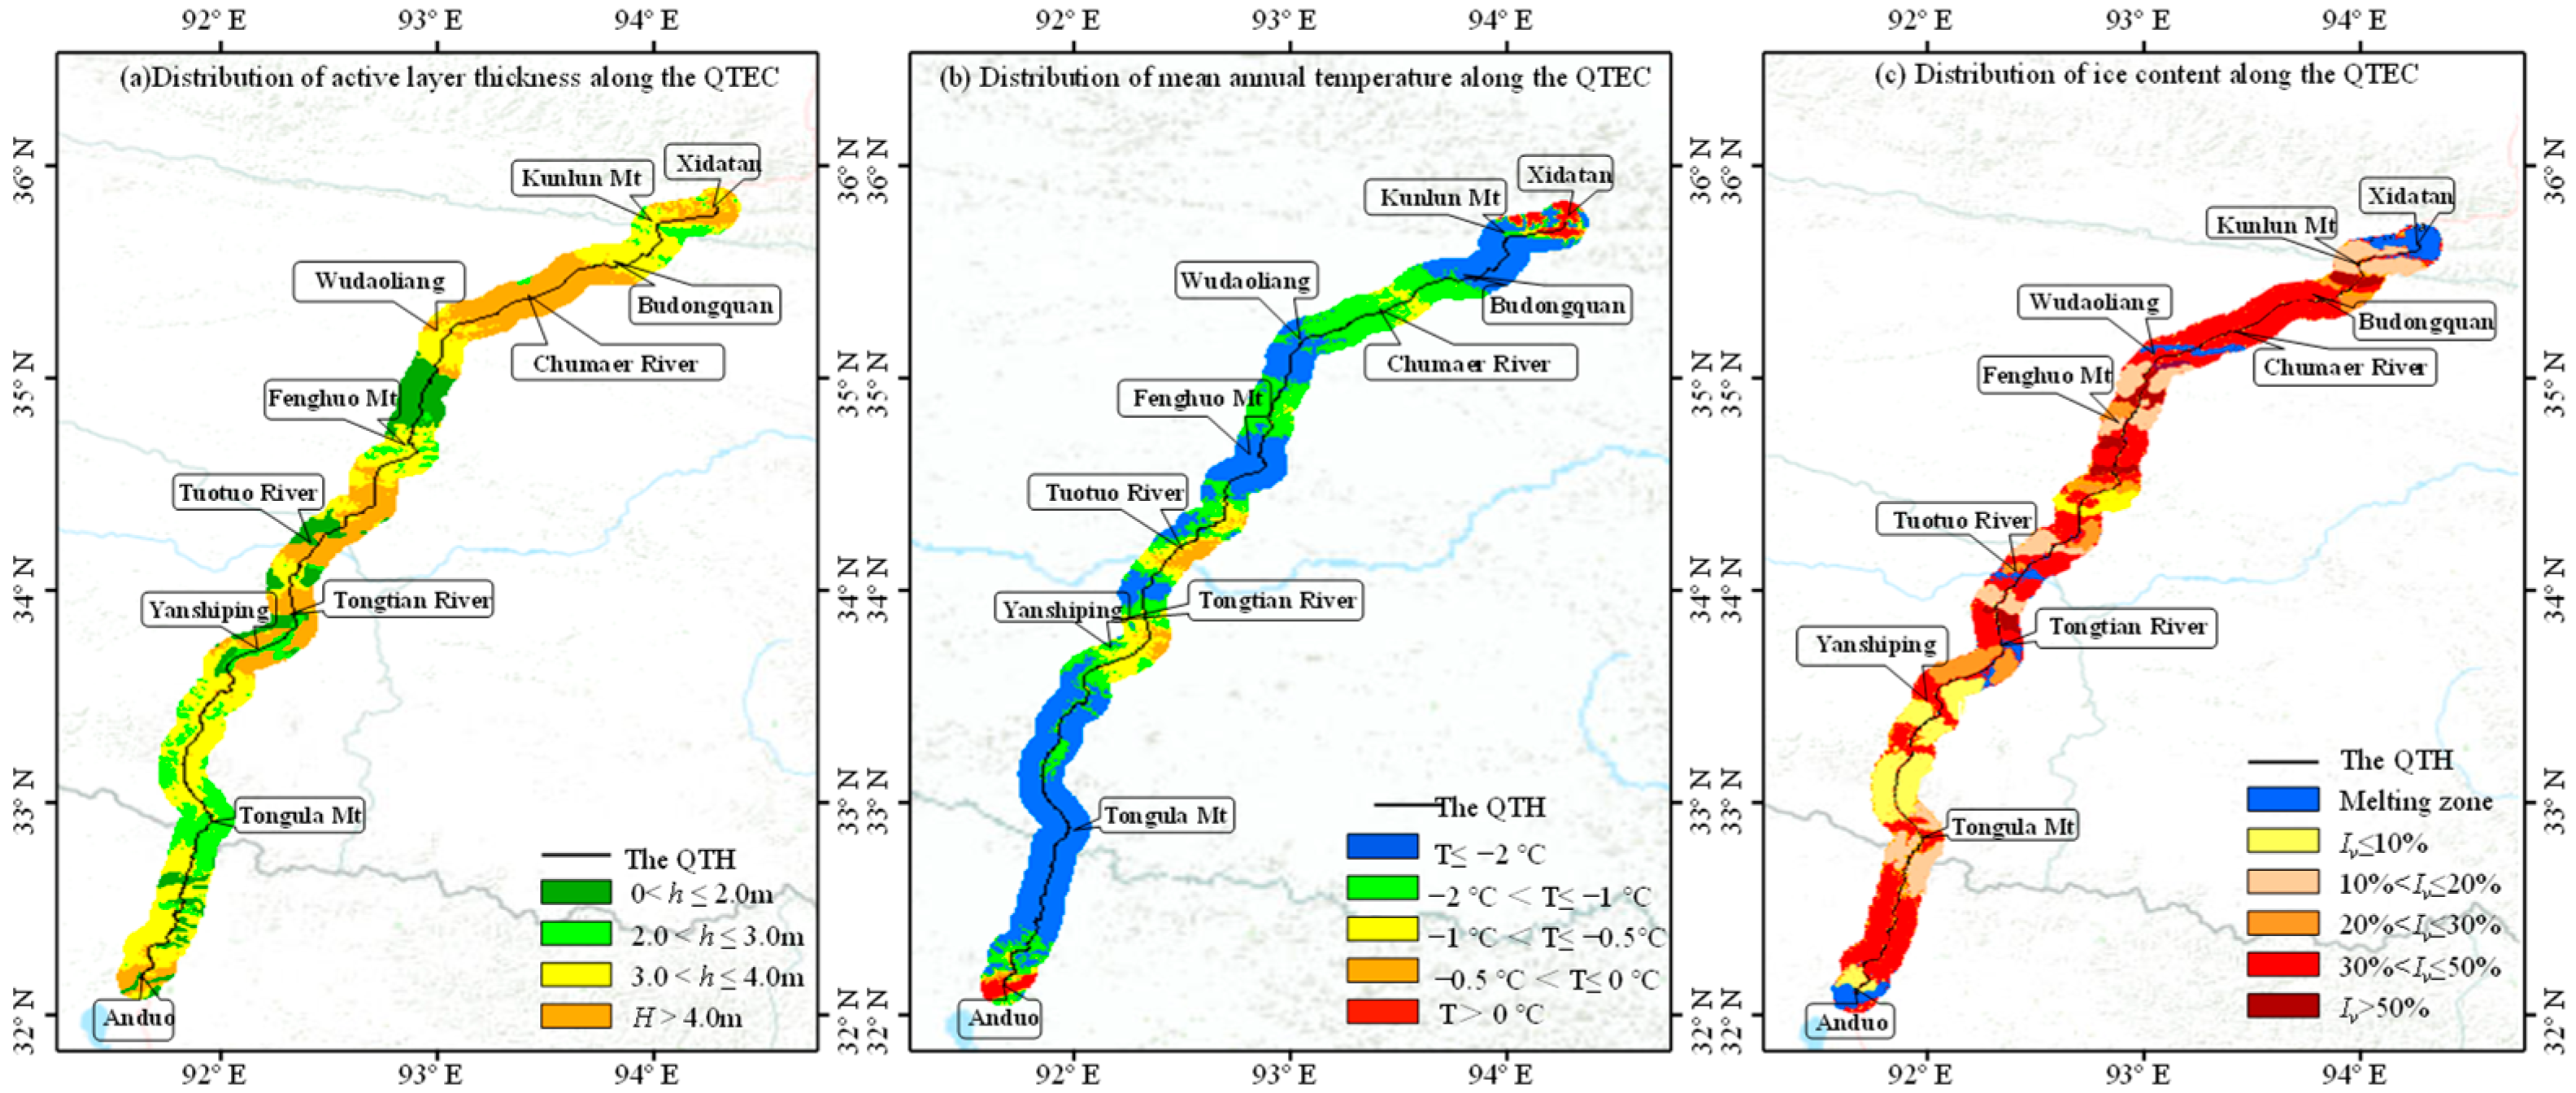
3.1.2. Active Layer Thickness (ALT)
3.1.3. Mean Annual Ground Temperature (MAGT)
3.1.4. Volume Ice Content (VIC)
3.1.5. Climate Warming
3.2. Method
4. Results
4.1. Influential Factors Variation
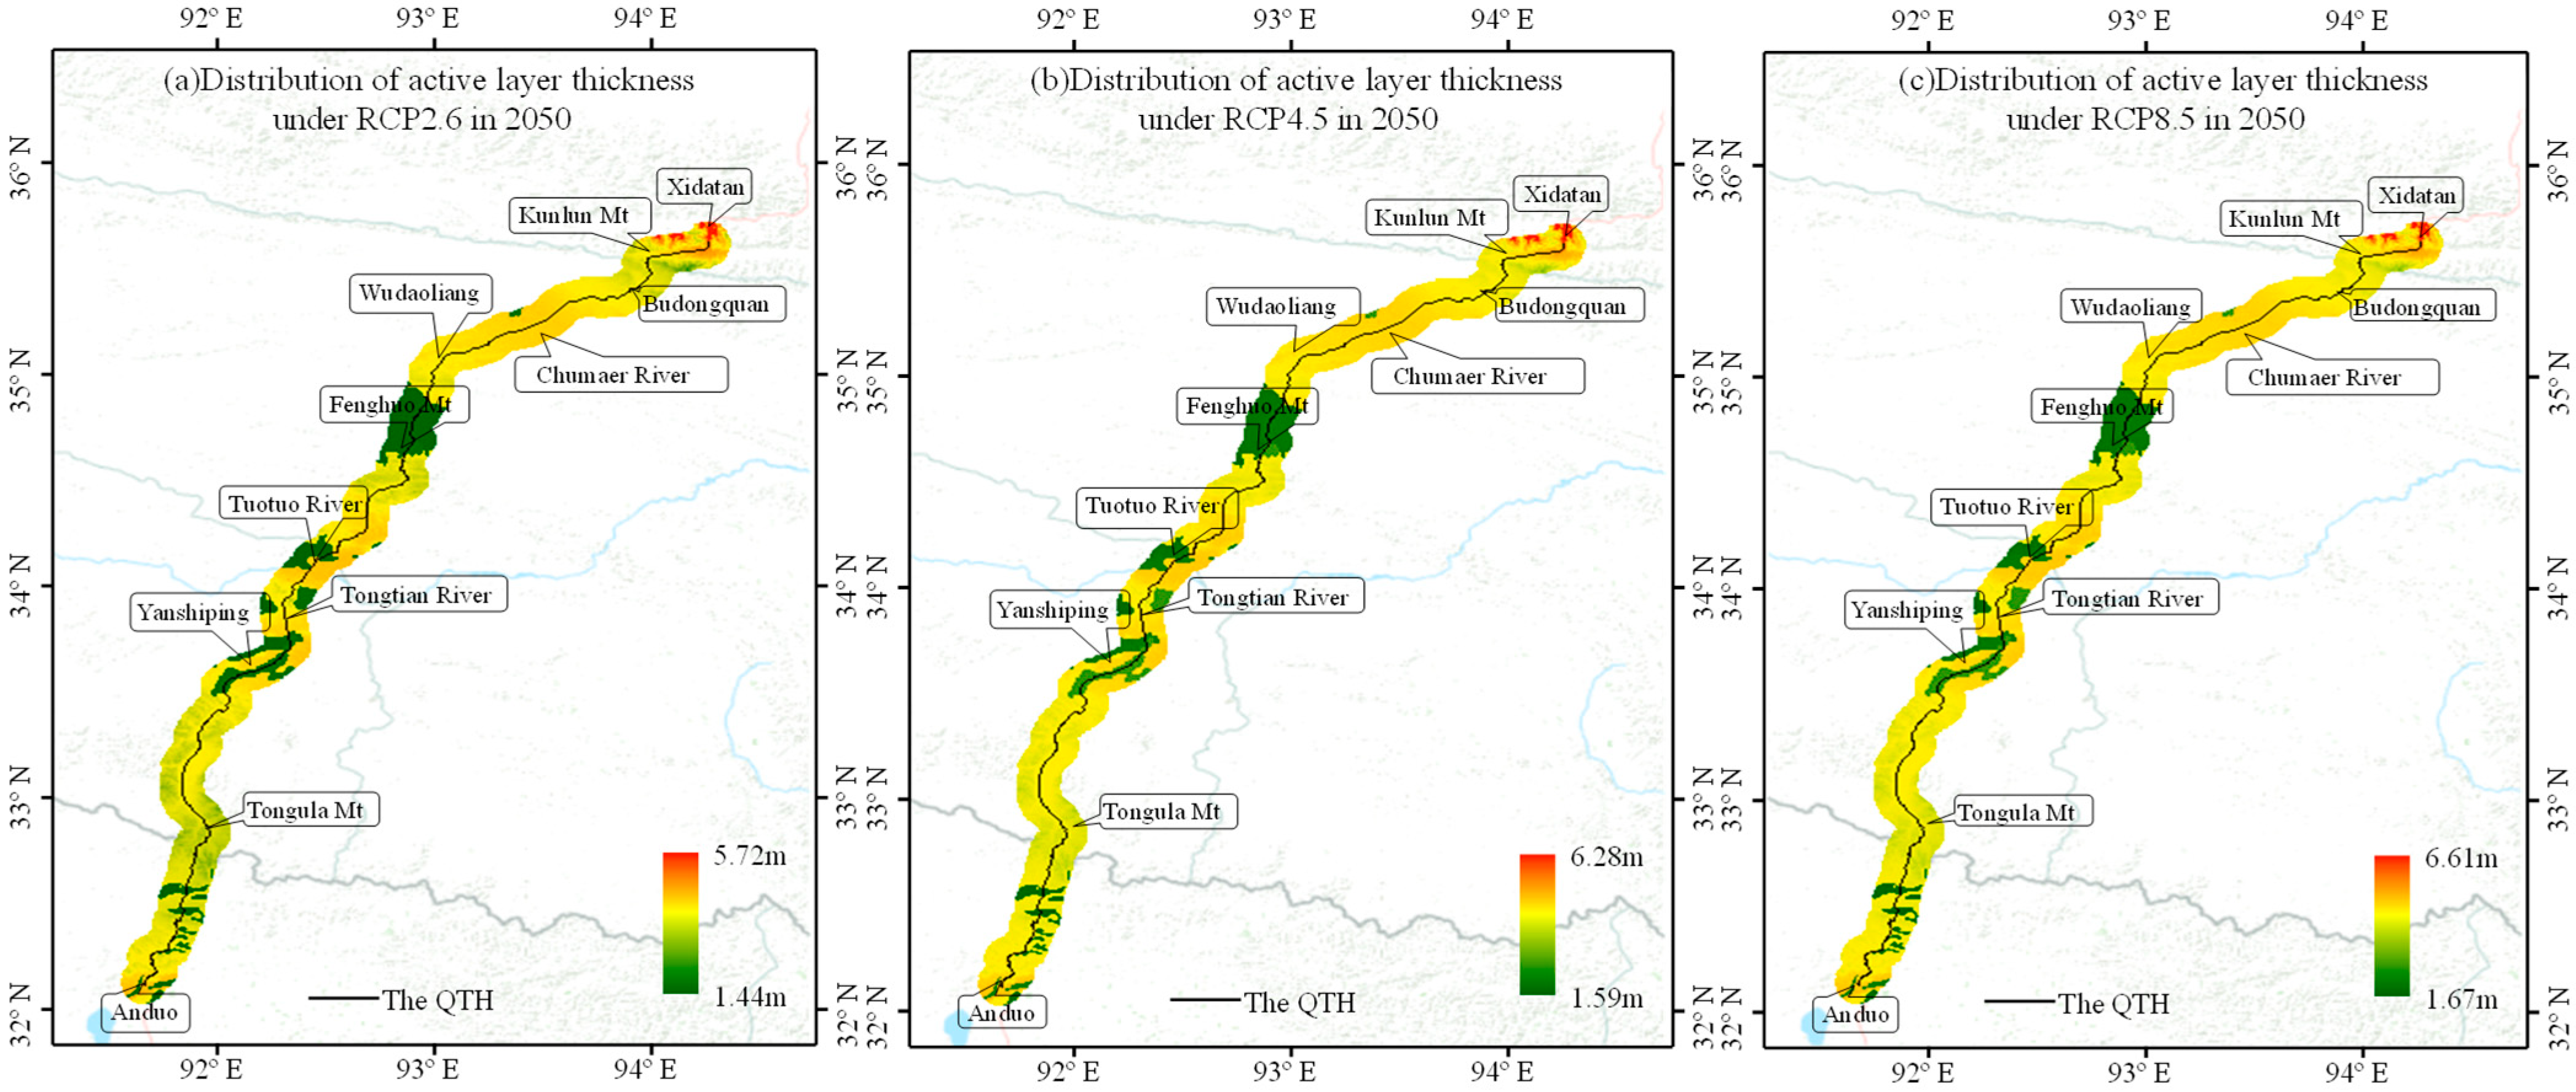
4.1.1. Active Layer Thickness (ALT) Variation
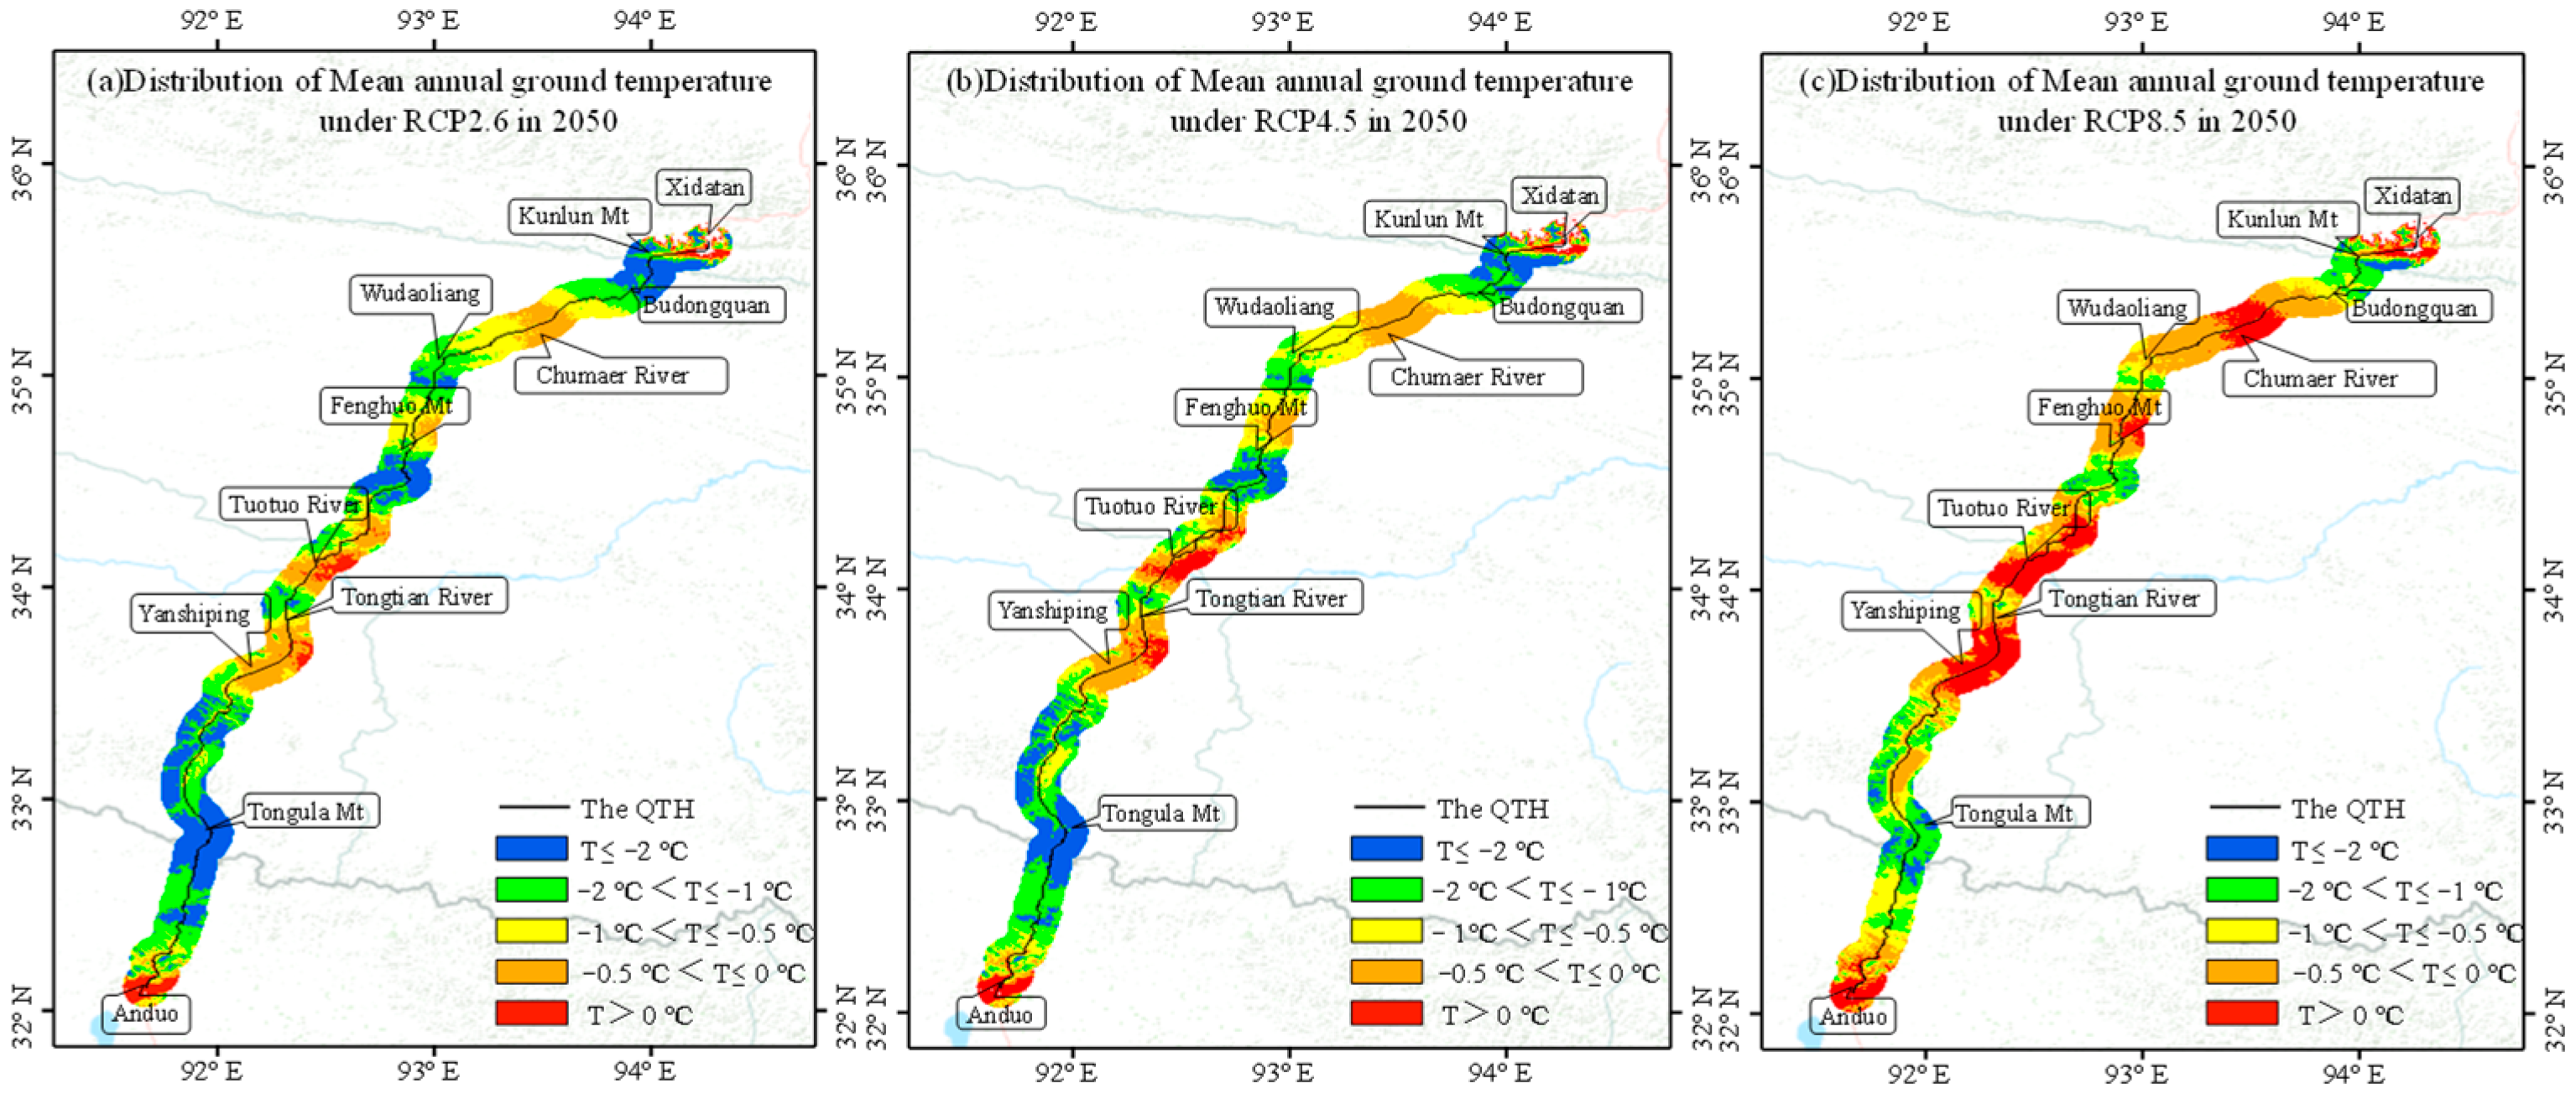
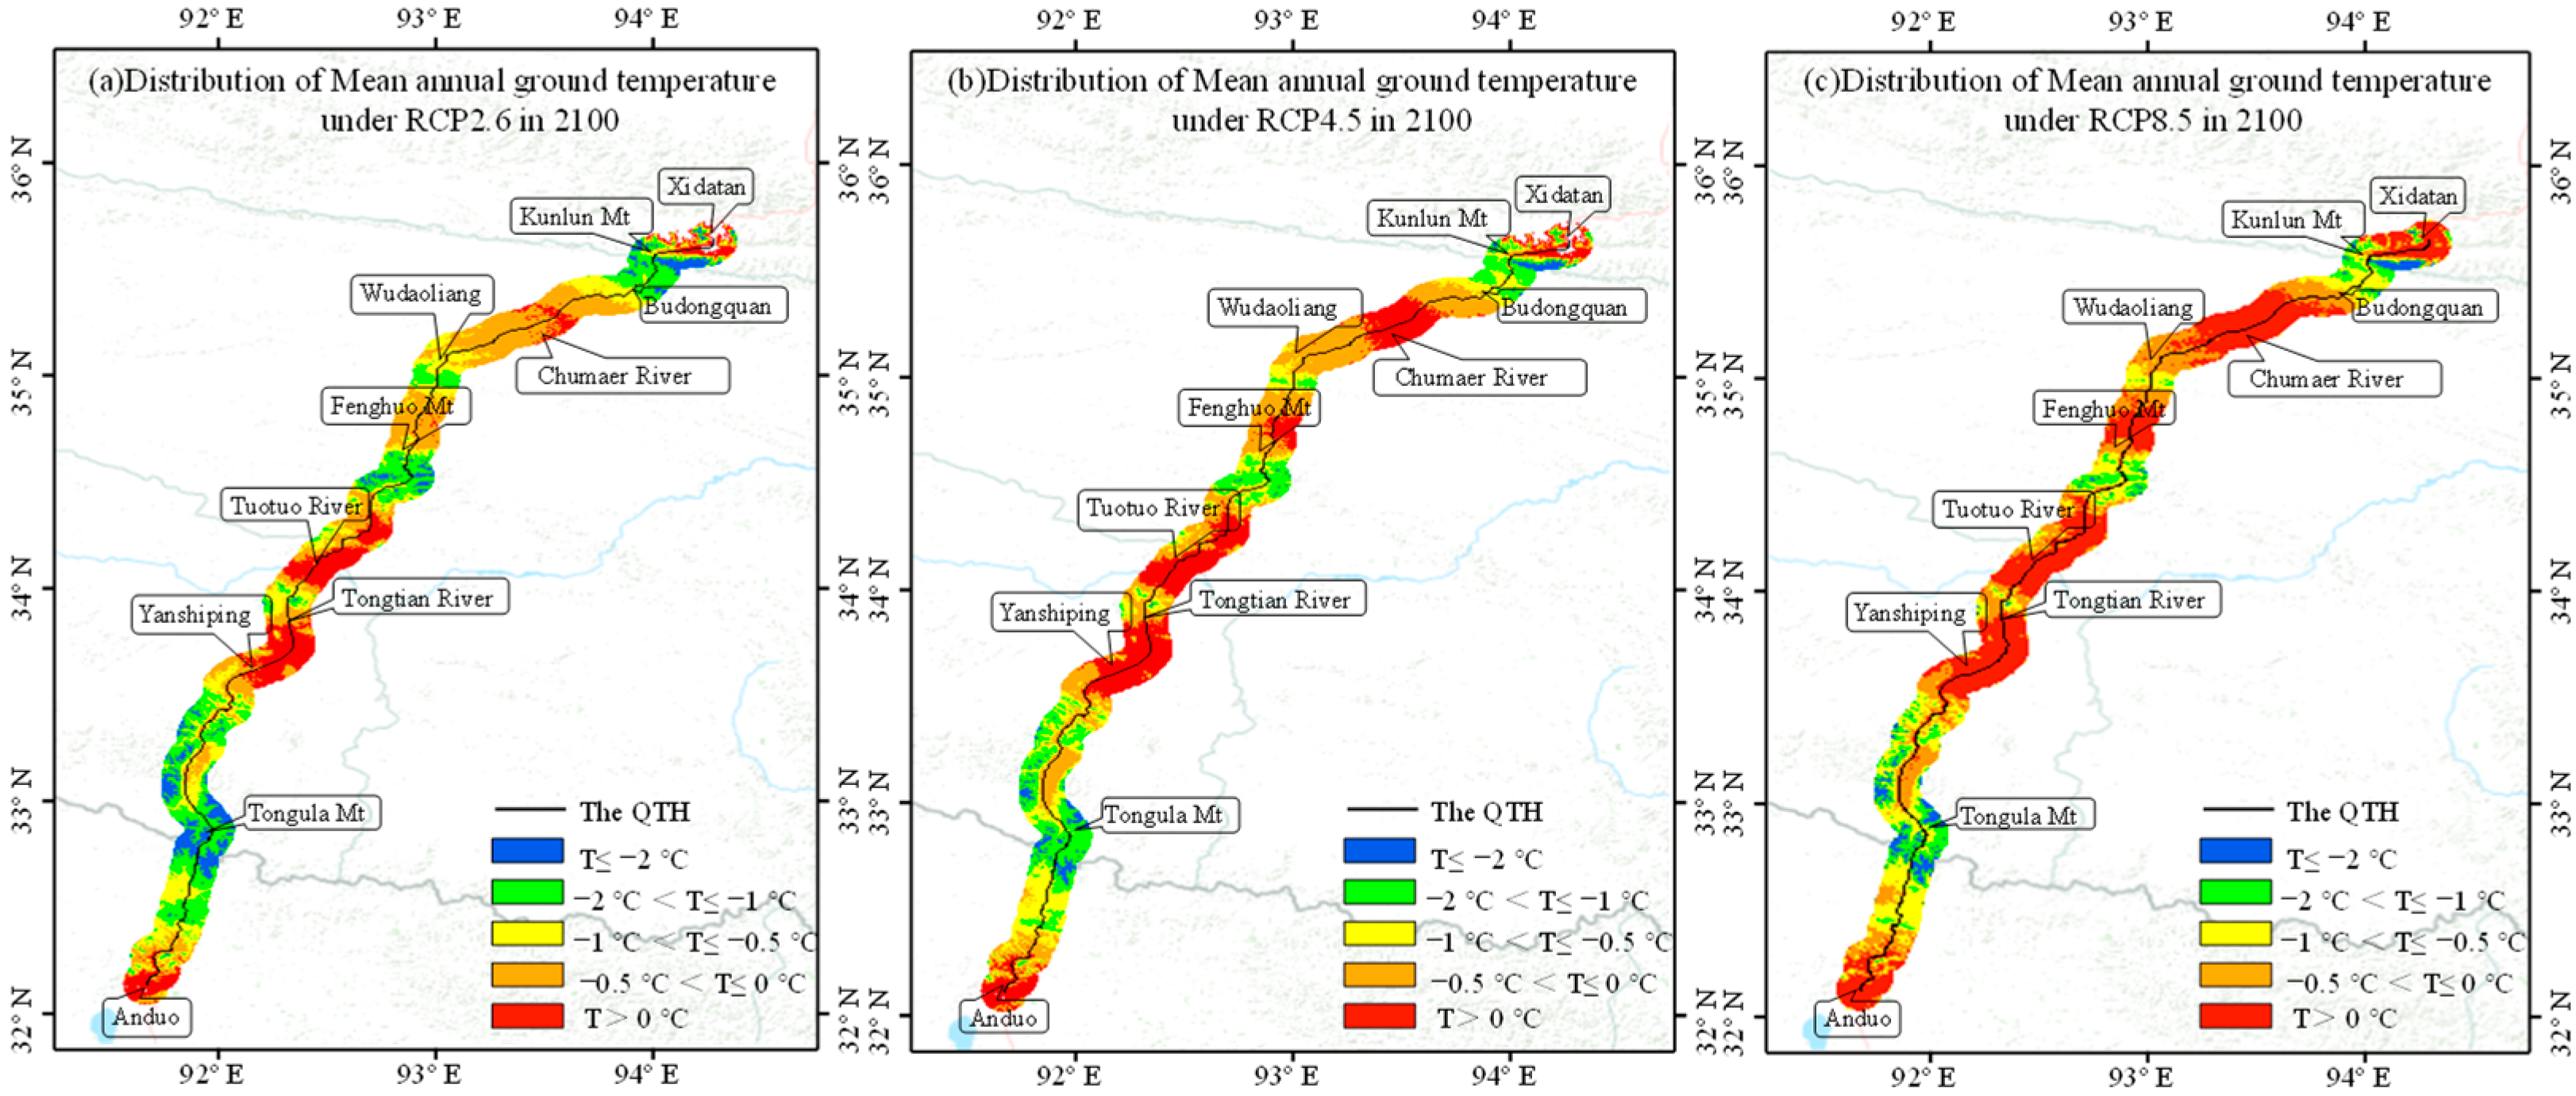
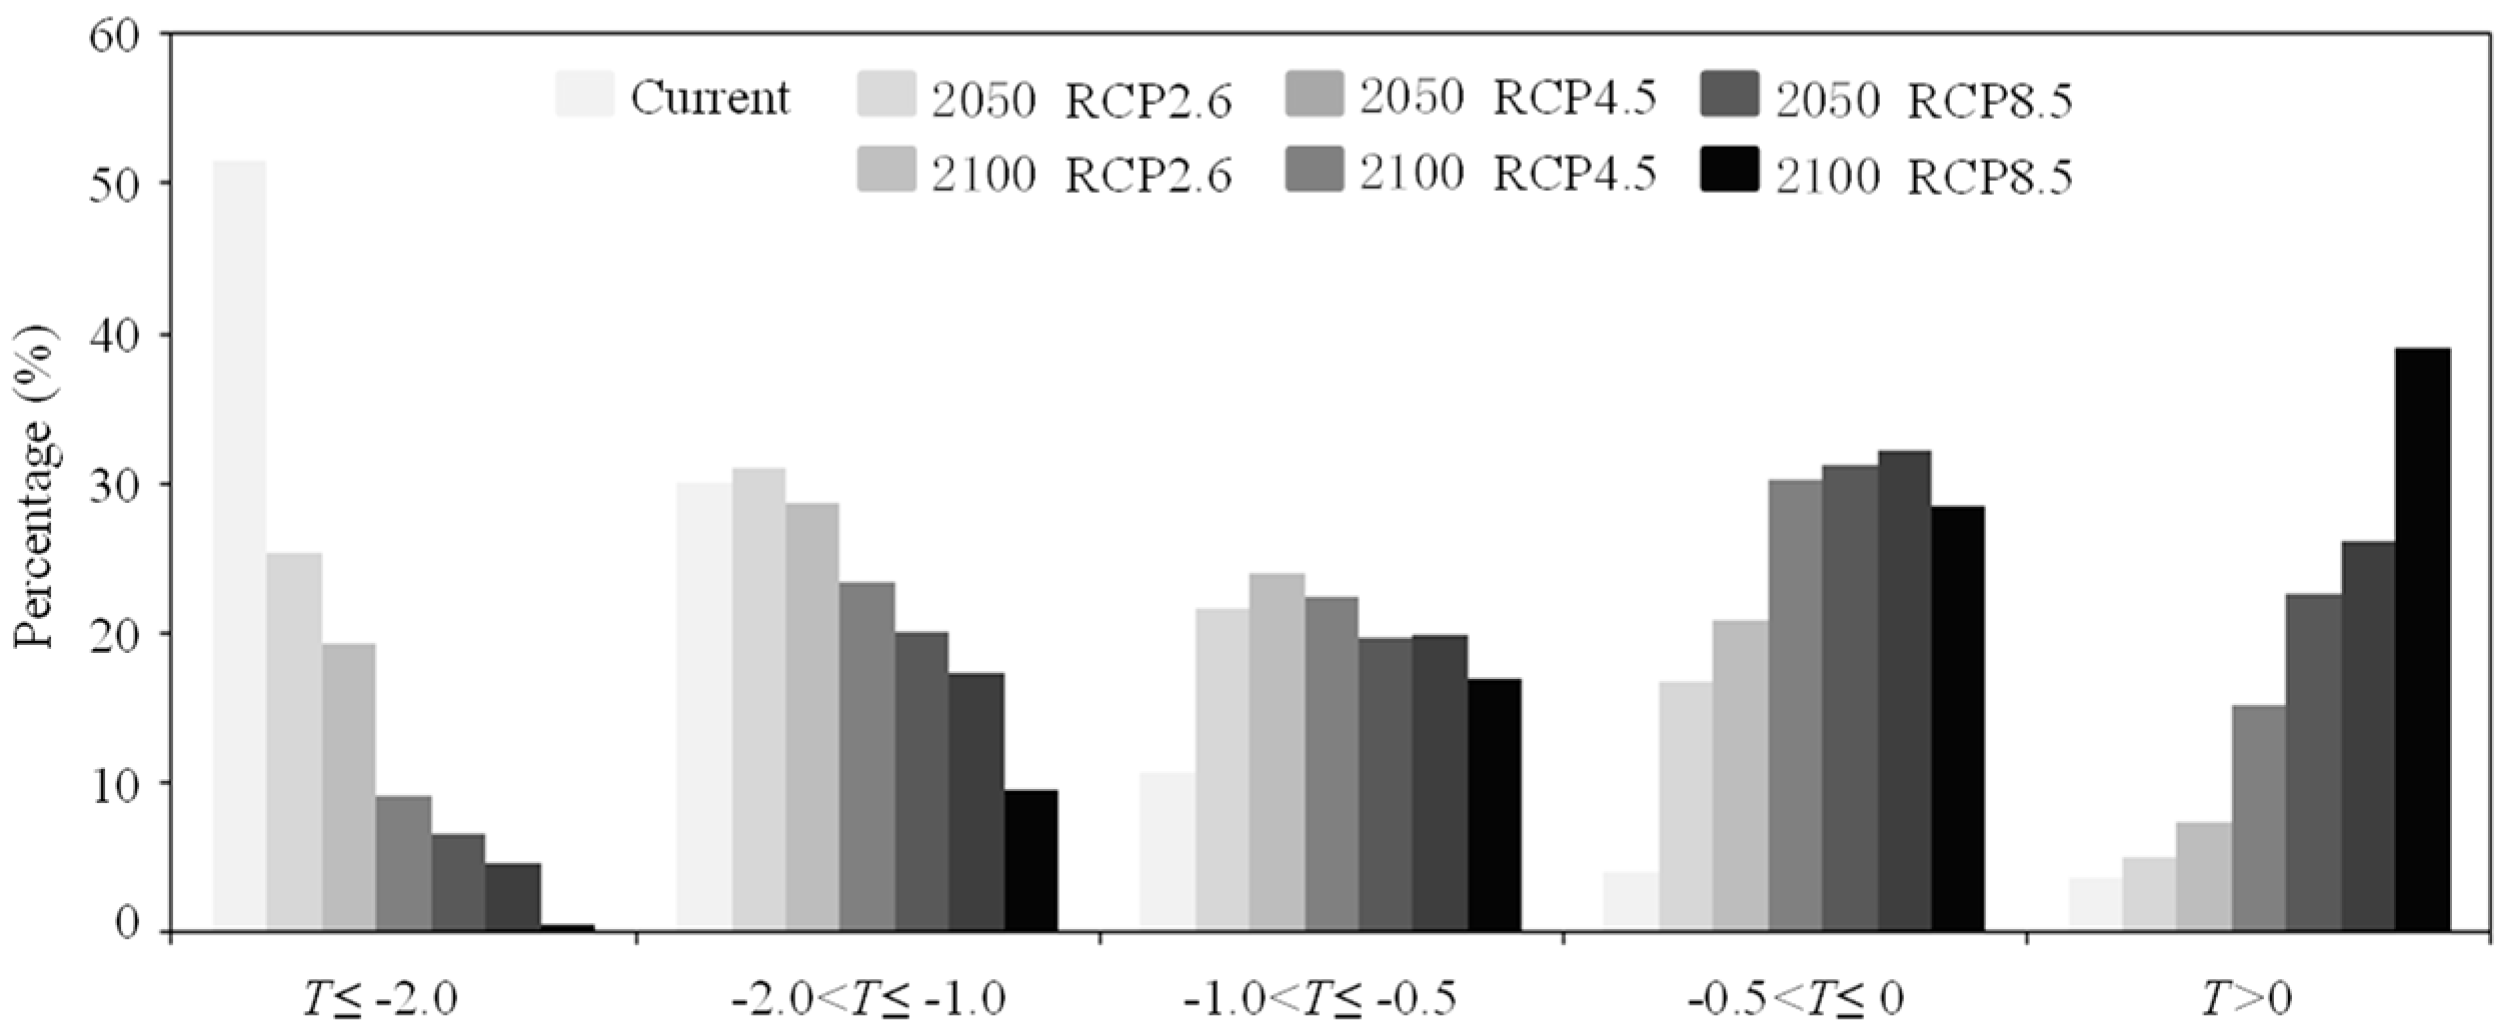
4.1.2. Mean Annual Ground Temperature (MAGT) Variation
4.1.3. Volume Ice Content (VIC) Variation
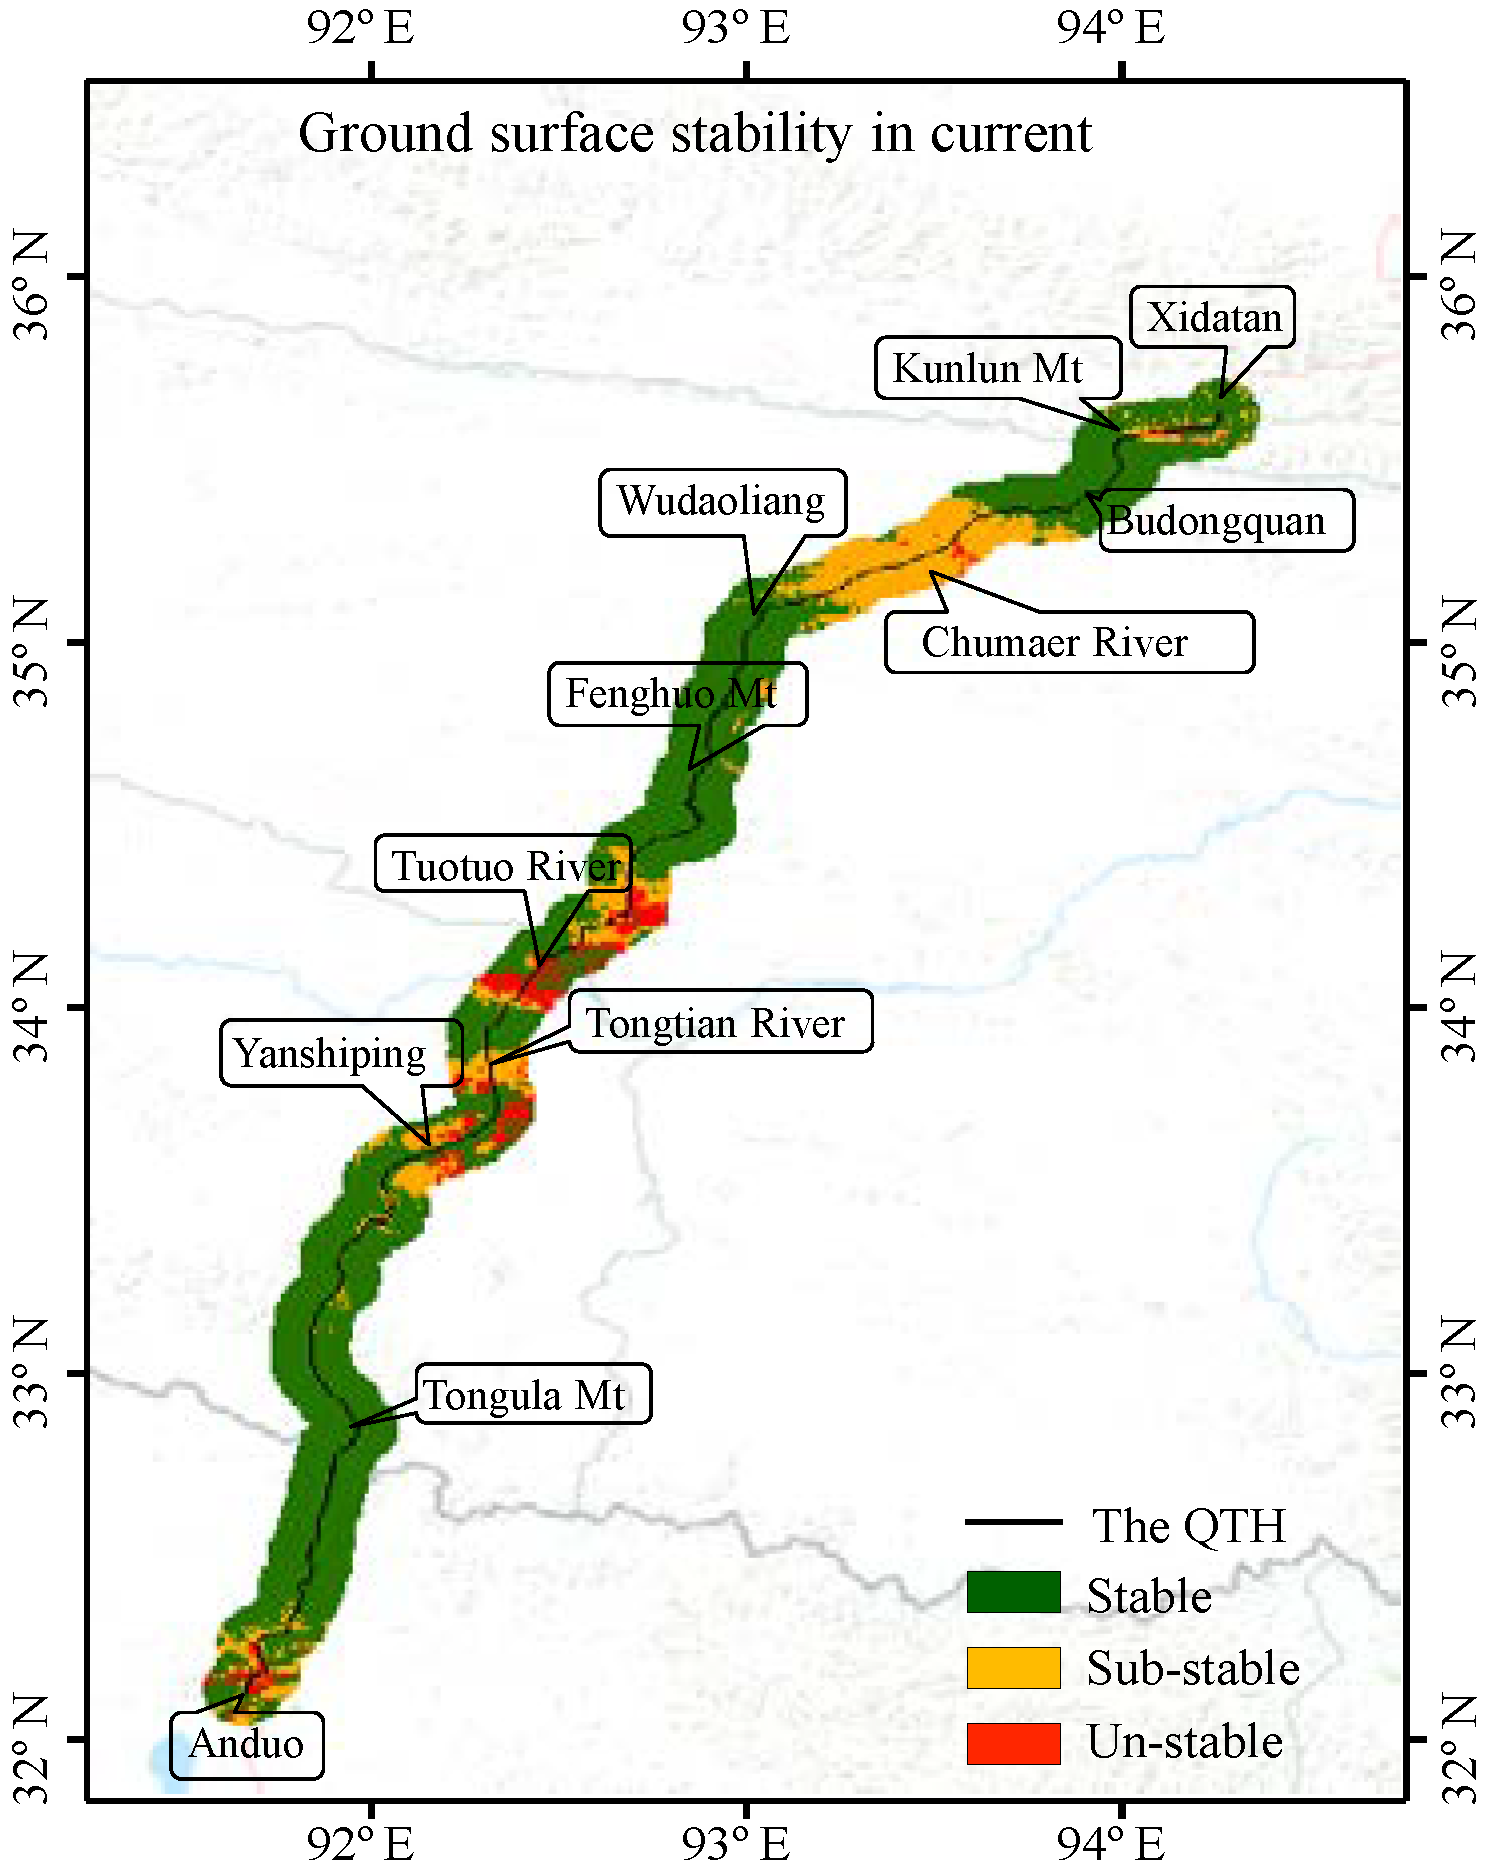
4.2. Ground Surface Stability
5. Discussion
6. Conclusions
- (1)
- The ground surface stability influential factors will be greatly changed with the warming climate in the future. The active layer will have an average thickening rate of about 0.021 m/year under rapid climate warming conditions. It is obviously greater than that under slow climate warming conditions. The proportion of low-temperature permafrost will be greatly decreased. And the high-temperature permafrost will be distinctly increased. Some permafrost, even, will decrease to melting soil. And the high ice content permafrost will decrease with warming climate under rapid climate warming conditions.
- (2)
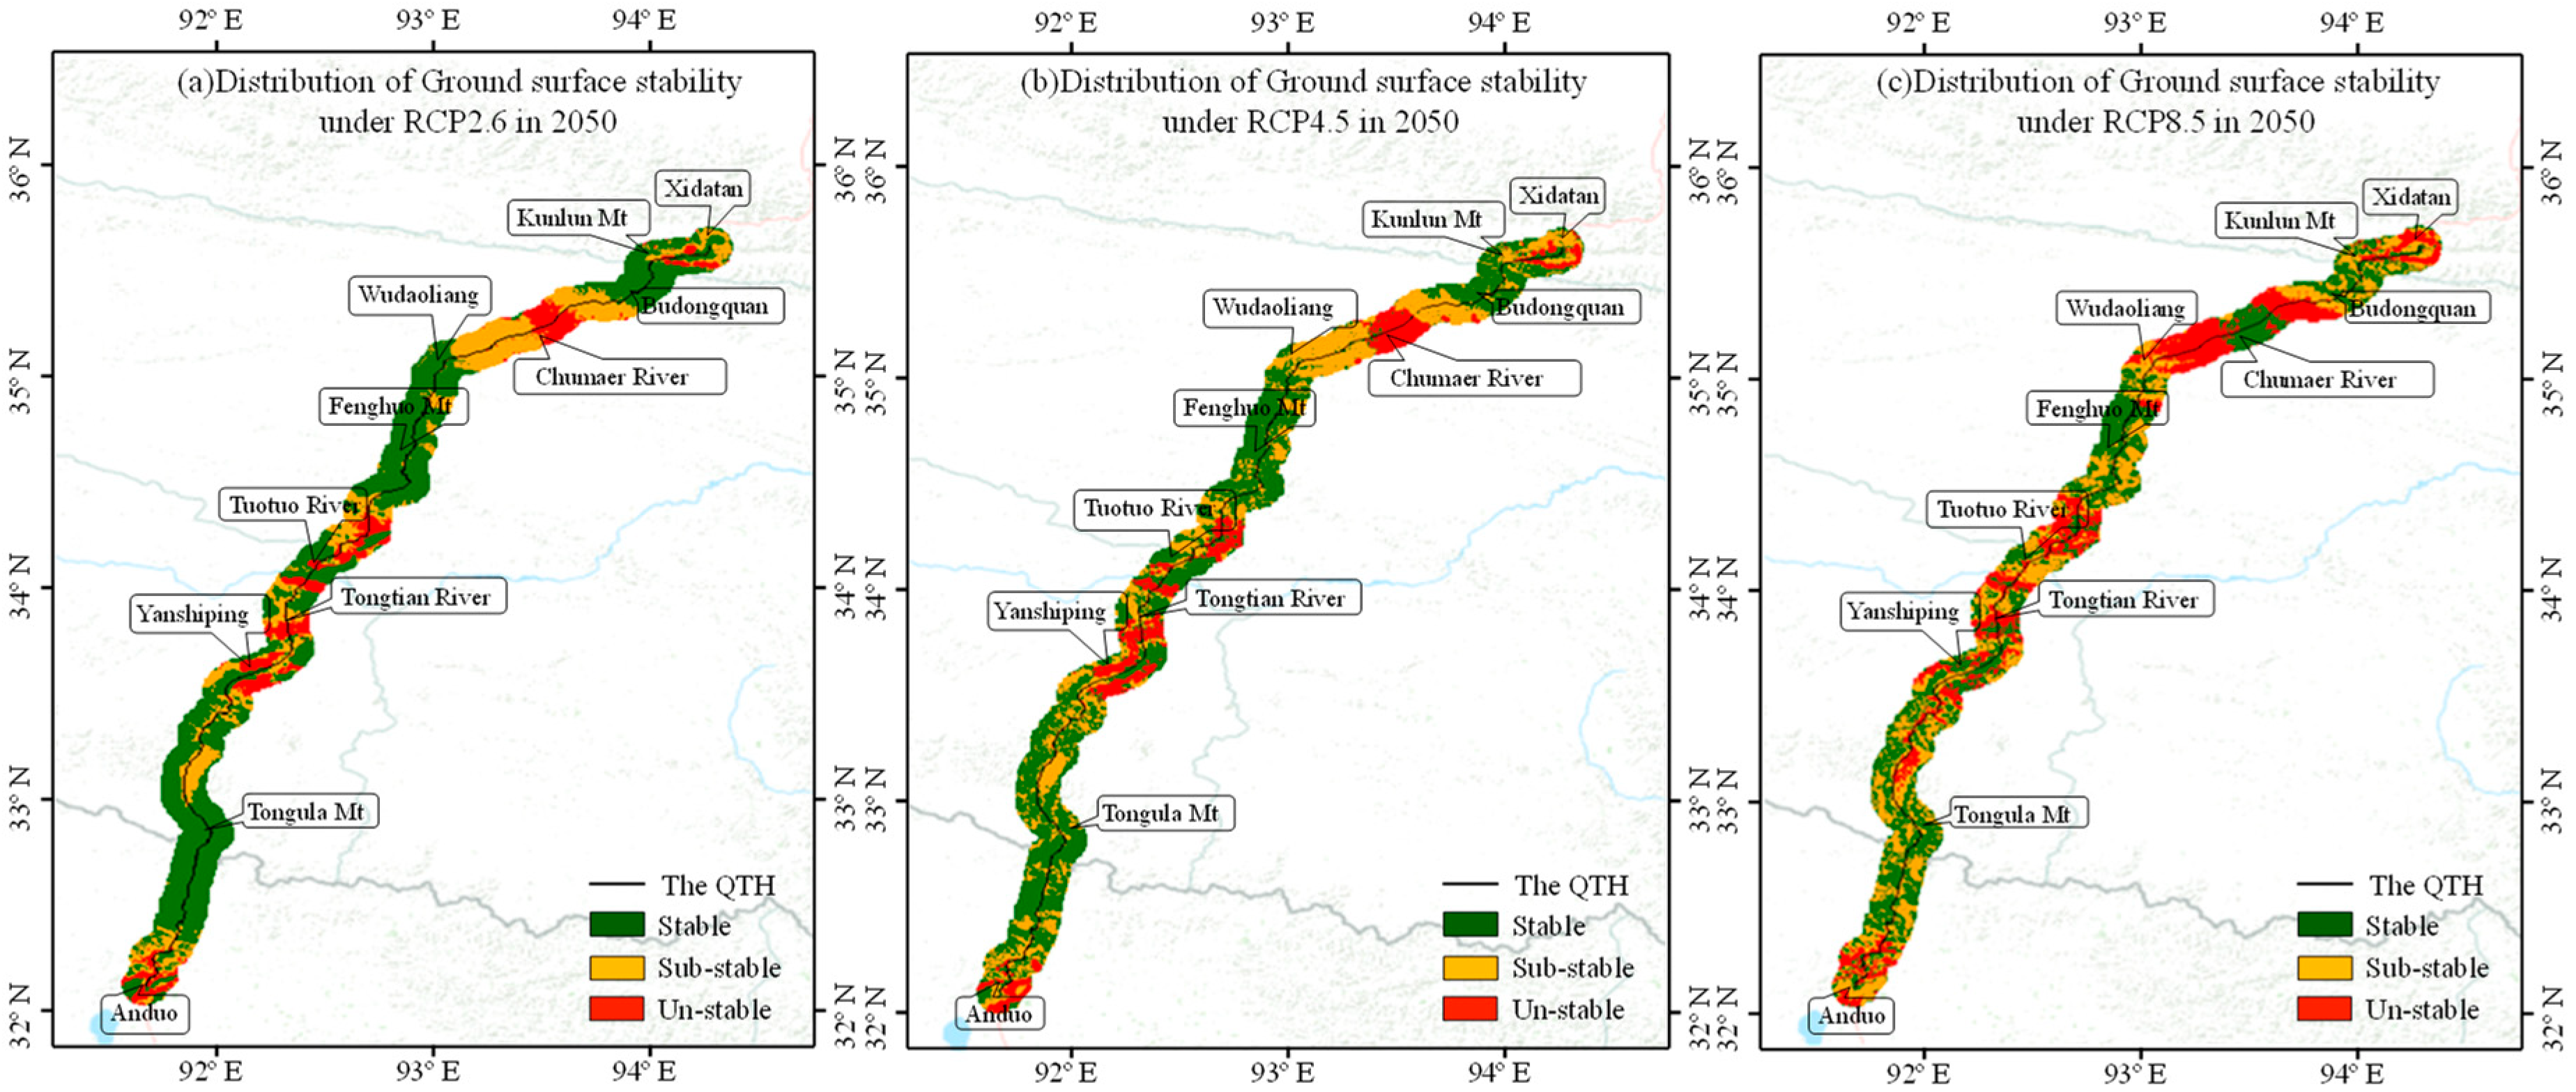
- The study area will mainly be stable under medium climate warming conditions in 2050. The proportion of unstable area is less than 10%. And it is mainly distributed in the high-temperature permafrost areas between the Chumaer River high plain and Tuotuohe–Yanshiping, while most of the study area will be sub-stable and unstable under rapid climate warming conditions. And the distribution of unstable areas will be spread to Wudaoliang and the Tangula Mountains.
- (3)
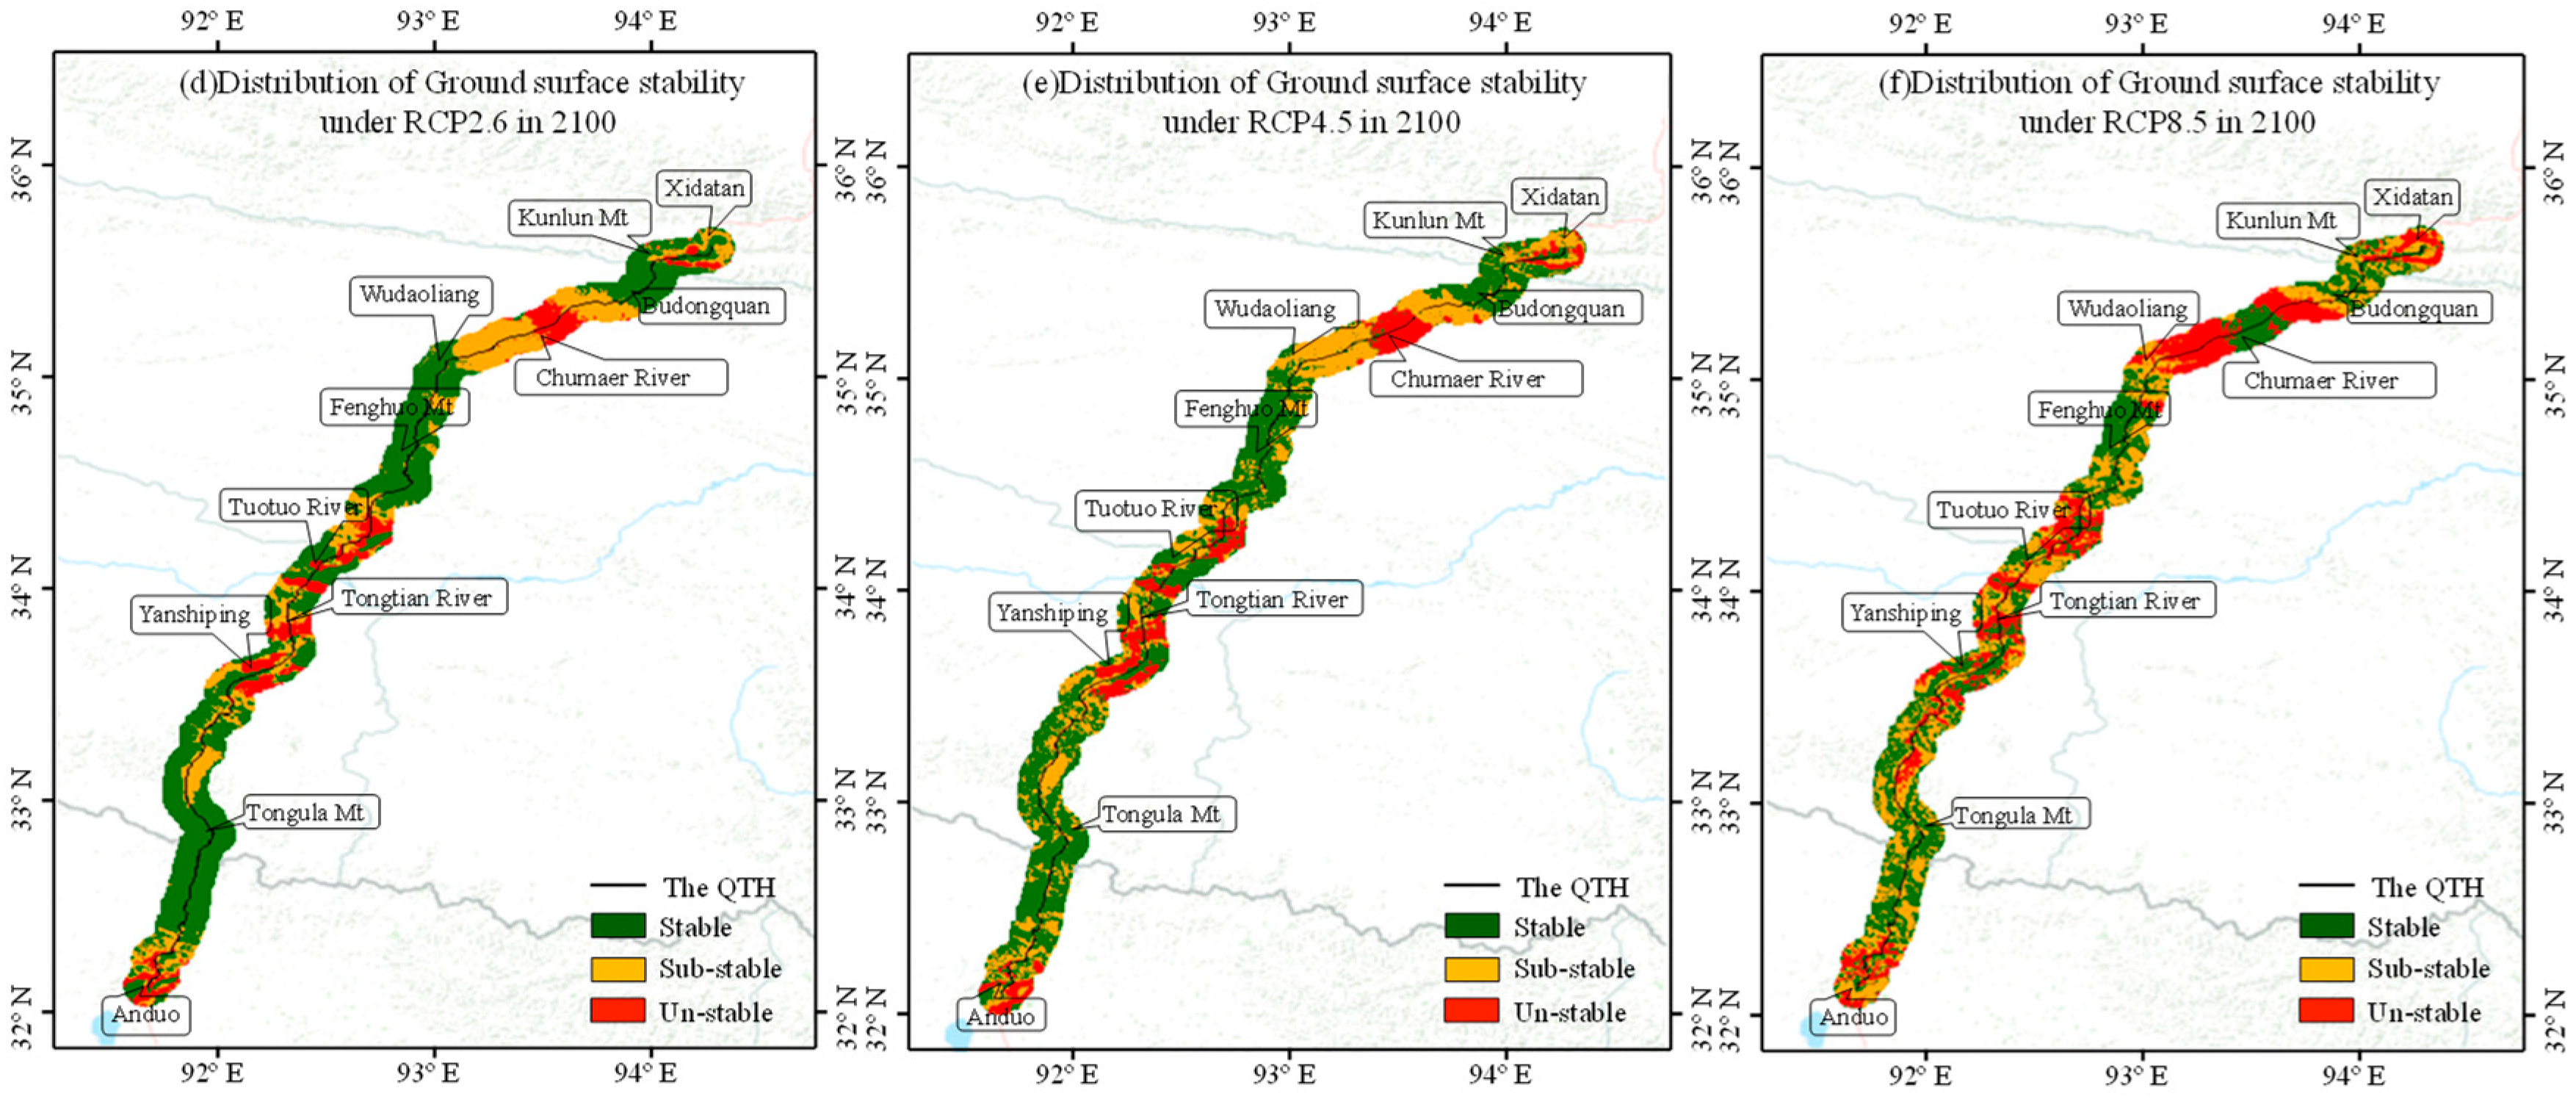
- The ground surface stability will see a great change along the QTEC with the warming climate in 2100. The stable area will be greatly decreased under medium climate warming conditions. Meanwhile, the unstable area will increase. And the amplitude is greater than 10%. There will be an opposite variation trend under rapid climate warming conditions. The stable area will increase. And the unstable area will decrease. This is mainly because some permafrost will be degraded to melting soil.
Author Contributions
Funding
Data Availability Statement
Acknowledgments
Conflicts of Interest
References
- Permafrost Subcommittee. Glossary of Permafrost and Related Ground-Ice Terms; Associate Committee on Geotechnical Research, National Research Council of Canada: Ottawa, ON, Canada, 1988; p. 156. [Google Scholar]
- Jia, Y.; Liu, J.; Guo, L.; Deng, Z.; Li, J.; Zheng, H. Locomotion of Slope Geohazards Responding to Climate Change in the Qinghai-Tibetan Plateau and Its Adjacent Regions. Sustainability 2021, 13, 10488. [Google Scholar] [CrossRef]
- Ma, W.; Qi, J.; Wu, Q. Analysis of the settlement of embankments on the Qinghai-Tibet railway. J. Geotech. Geoenviron. Eng. 2008, 134, 1645–1654. [Google Scholar] [CrossRef]
- Niu, F.; Li, A.; Luo, J.; Lin, Z.; Yin, G.; Liu, M.; Zheng, H.; Liu, H. Soil moisture, ground temperatures, and settlement of a high-speed railway embankment in Northeast China. Cold Reg. Sci. Technol. 2017, 133, 7–14. [Google Scholar] [CrossRef]
- Li, K.; Yin, Z.; Zhang, N.; Liu, Y. A data-driven method to model stress-strain behavior of frozen soil considering uncertainty. Cold Reg. Sci. Technol. 2023, 213, 103906. [Google Scholar] [CrossRef]
- Deng, T.; Zhang, J.W.; Meng, Y.; Volis, S.; Sun, H.; Nie, Z.L. Role of the Qinghai-Tibetan Plateau uplift in the Northern Hemisphere disjunction: Evidence from two herbaceous genera of Rubiaceae. Sci. Rep. 2017, 7, 13411. [Google Scholar] [CrossRef] [PubMed]
- Wang, H.; Su, W. Evaluating and understanding top of the atmosphere cloud radiative effects in Intergovernmental Panel on Climate Change (IPCC) Fifth Assessment Report (AR5) Coupled Model Intercomparison Project Phase (CMIP5) models using satellite observations. J. Geophys. Res. Atmos. 2013, 118, 683–699. [Google Scholar] [CrossRef]
- Niu, F.; Yin, G.; Luo, J.; Lin, Z.; Liu, M. Permafrost distribution along the Qinghai-Tibet Engineering Corridor, China using high-resolution statistical mapping and modeling integrated with remote sensing and GIS. Remote Sens. 2018, 10, 215. [Google Scholar] [CrossRef]
- Wu, X.; Nan, Z.; Zhao, S.; Cheng, G. Spatial modeling of permafrost distribution and properties on the Qinghai-Tibet Plateau. Permafr. Periglac. Process. 2018, 29, 86–99. [Google Scholar] [CrossRef]
- Xue, X.; Guo, J.; Han, B.; Sun, Q.; Liu, L. The effect of climate warming and permafrost thaw on desertification in the Qinghai–Tibetan Plateau. Geomorphology 2009, 108, 182–190. [Google Scholar] [CrossRef]
- Zhang, Z.; Wu, Q. Thermal hazards zonation and permafrost change over the Qinghai-Tibet Plateau. Nat. Hazards 2012, 61, 403–423. [Google Scholar] [CrossRef]
- Zhang, J.; Liu, D.; Qi, J. Estimation on the settlement and deformation of embankment along Qinghai-Tibet Railway in permafrost regions. China Railw. Sci. 2007, 28, 12–17. [Google Scholar]
- Liu, S.; Tao, Y.; Xie, N.; Tao, L.; Hu, M. Advance in grey system theory and applications in science and engineering. Grey Syst. Theory Appl. 2022, 12, 804–823. [Google Scholar] [CrossRef]
- Mao, X.; Zhao, Y.; Wu, Q.; Huang, W.; Han, L. Type Classification and Engineering Stability Evaluation of Permafrost Wetlands on the Qinghai–Tibet Plateau. Front. Earth Sci. 2022, 10, 837062. [Google Scholar] [CrossRef]
- Yao, X.; Qi, J. Artificial neural forecasting method for thaw-settlement coefficient. J. Glaciol. Geocryol. 2011, 33, 891–896. [Google Scholar]
- Mamat, R.C.; Kasa, A.; Razali, S.F.M. The Applications and Future Perspectives of Adaptive Neuro-Fuzzy Inference System in Road Embankment Stability. J. Eng. Sci. Technol. Rev. 2019, 12, 75–90. [Google Scholar]
- Chai, M.; Zhang, J.; Mu, Y.; Liu, G.; Zhou, G. Probability model of subgrade hazards susceptibility of Qinghai-Tibet Highway in permafrost regions. J. Chang. Univ. 2017, 37, 76–83. [Google Scholar]
- Niu, F.; Lin, Z.; Lu, J.; Wang, H. Assessment of terrain susceptibility to thermokarst lake development along the Qinghai-Tibet engineering corridor, China. Environ. Earth Sci. 2015, 73, 5631–5642. [Google Scholar] [CrossRef]
- Zou, Q.; Zhou, J.; Zhou, C.; Song, L.; Guo, J. Comprehensive flood risk assessment based on set pair analysis variable fuzzy sets model and fuzzy AHP. Stoch. Environ. Res. Risk Assess. 2013, 27, 525–546. [Google Scholar] [CrossRef]
- Nelson, A.S. Climate Change and Hazard Zonation in the Circum-Arctic Permafrost Regions. Nat. Hazards 2002, 26, 203–225. [Google Scholar] [CrossRef]
- Jin, H.; Wang, S.; Yu, Q.; Wu, Q.; Wei, Z. Regionalization and assessment of environmental geological conditions of frozen soils along the Qinghai-Tibet Engineering Corridor. Hydrogeol. Eng. Geol. 2006, 33, 66–71. [Google Scholar]
- Luo, L.; Ma, W.; Zhuang, Y.; Zhang, Y.; Yi, S.; Xu, J.; Long, Y.; Ma, D.; Zhang, Z. The impacts of climate change and human activities on alpine vegetation and permafrost in the Qinghai-Tibet Engineering Corridor. Ecol. Indic. 2018, 93, 24–35. [Google Scholar] [CrossRef]
- Wang, W.; Wu, T.; Zhao, L.; Li, R.; Zhu, X.; Wang, W.; Hao, J. Exploring the ground ice recharge near permafrost table on the central Qinghai-Tibet Plateau using chemical and isotopic data. J. Hydrol. 2018, 560, 220–229. [Google Scholar] [CrossRef]
- Wu, Q.; Niu, F. Permafrost changes and engineering stability in Qinghai-Xizang Plateau. Chin. Sci. Bull. 2013, 58, 1079–1094. [Google Scholar] [CrossRef]
- Zhao, T.; Zhang, M.; Lu, J.; Yan, Z. Correlation between ground surface deformation and influential factors in permafrost regions. J. Harbin Inst. Technol. 2021, 53, 145–153. [Google Scholar]
- Kudryavtsev, V.A. Principles of Permafrost Forecasting during Engineering and Geocryological Investigations; Guodong, X., Ed.; Lanzhou University Press: Lanzhou, China, 1992; pp. 67–70. (In Chinese) [Google Scholar]
- Pang, Q.; Cheng, G.; Li, S.; Zhang, W. Active layer thickness calculation over the Qinghai–Tibet Plateau. Cold Reg. Sci. Technol. 2009, 57, 23–28. [Google Scholar] [CrossRef]
- Zhang, M.; Pei, W.; Zhang, X.; Lu, J. Lateral thermal disturbance of embankments in the permafrost regions of the Qinghai-Tibet Engineering Corridor. Nat. Hazards 2015, 78, 2121–2142. [Google Scholar] [CrossRef]
- Wu, Q.; Li, X.; Li, W. Compute simulation and mapping of the regional distribution of permafrost along the Qinghai-Xizang highway. Cold Reg. Sci. Technol. 2000, 22, 323–326. [Google Scholar]
- Nan, Z.; Li, S.; Liu, Y. The mean annual ground temperature distribution on the Tibetan Plateau: Permafrost distribution mapping and further application. J. Glaciol. Geocryol. 2002, 24, 142–148. [Google Scholar]
- Lu, J.; Niu, F.; Lin, Z.; Liu, H.; Luo, J. Permafrost modeling and mapping along the Qinghai-Tibet engineering corridor considering slope-aspect. J. Glaciol. Geocryol. 2012, 28, 63–67. [Google Scholar]
- Wu, Q.; Dong, X.; Liu, Y. Spatial distribution model of high ice content frozen soil along Qinghai-Xizang highway-A GIS aided model. J. Glaciol. Geocryol. 2004, 26, 137–141. [Google Scholar]
- García, A.; Cuesta-Valero, F.J.; Beltrami, H.; Smerdon, J.E. Simulation of air and ground temperatures in PMIP3/CMIP5 last millennium simulations: Implications for climate reconstructions from borehole temperature profiles. Environ. Res. Lett. 2016, 11, 044022. [Google Scholar] [CrossRef]
- Newman, T.P. Tracking the release of IPCC AR5 on Twitter: Users, comments, and sources following the release of the Working Group I Summary for Policymakers. Public Underst. Sci. 2017, 26, 815–825. [Google Scholar] [CrossRef] [PubMed]
- Ruan, G.; Zhang, J.; Chai, M. Risk division of thaw settlement hazard along the Qinghai-Tibet engineering corridor under climate change. J. Glaciol. Geocryol. 2014, 36, 811–817. [Google Scholar]
- Hjort, J.; Karjalainen, O.; Aalto, J.; Westermann, S.; Romanovsky, V.E.; Frederick, E.N.; Bernd, E.; Miska, L. Degrading permafrost puts Arctic infrastructure at risk by mid-century. Nat. Commun. 2018, 9, 5147. [Google Scholar] [CrossRef]
- Saaty, T.L. Decision making with the analytic hierarchy process. Int. J. Serv. Sci. 2008, 1, 83–98. [Google Scholar] [CrossRef]
- Zadeh, L.A. Fuzzy sets as a basis for a theory of possibility. Fuzzy Sets Syst. 1999, 100, 9–34. [Google Scholar] [CrossRef]


| Soil Type | γ/(kg•m −3) | λ/(W•m −1 •°C−1) | W/(%) | Wu/(%) |
|---|---|---|---|---|
| Silty clay | 1500 | 1.57 | 17 | 5 |
| Clay | 900 | 0.53 | 15 | 5 |
| Sand | 1800 | 1.42 | 6 | 5 |
| RCPs | Period | Temperature (°C) | ||||
|---|---|---|---|---|---|---|
| Minimum | Maximum | Mean | Standard Deviation | Covariation | ||
| Current | −21.16 | 24.48 | −1.42 | 4.97 | 24.70 | |
| RCP2.6 | 2050 | −21.22 | 25.67 | −0.18 | 5.08 | 25.81 |
| 2100 | −21.41 | 25.62 | 0.02 | 5.03 | 25.30 | |
| RCP4.5 | 2050 | −20.10 | 26.10 | −0.64 | 5.02 | 25.20 |
| 2100 | −19.90 | 26.40 | 0.25 | 5.08 | 25.81 | |
| RCP8.5 | 2050 | −20.41 | 26.24 | 1.02 | 5.04 | 25.40 |
| 2100 | −17.92 | 28.76 | 2.78 | 4.99 | 24.90 | |
| Influential Factors | ALT | MAGT | VIC |
|---|---|---|---|
| Weight ((i)) | 0.20 | 0.45 | 0.35 |
| Stability Level | Proportion (%) | ||||||
|---|---|---|---|---|---|---|---|
| Current | RCP2.6 | RCP4.5 | RCP8.5 | ||||
| 2050 | 2100 | 2050 | 2100 | 2050 | 2100 | ||
| Stable | 63.35 | 58.07 | 52.13 | 55.44 | 46.05 | 41.57 | 58.24 |
| Sub-stable | 33.58 | 34.02 | 36.11 | 35.42 | 35.09 | 37.81 | 24.87 |
| Un-stable | 3.07 | 7.91 | 11.76 | 9.14 | 18.86 | 20.62 | 15.89 |
Disclaimer/Publisher’s Note: The statements, opinions and data contained in all publications are solely those of the individual author(s) and contributor(s) and not of MDPI and/or the editor(s). MDPI and/or the editor(s) disclaim responsibility for any injury to people or property resulting from any ideas, methods, instructions or products referred to in the content. |
© 2023 by the authors. Licensee MDPI, Basel, Switzerland. This article is an open access article distributed under the terms and conditions of the Creative Commons Attribution (CC BY) license (https://creativecommons.org/licenses/by/4.0/).
Share and Cite
Zhao, T.; Wang, C.; Wang, J. Influence of Climate Warming on the Ground Surface Stability over Permafrost along the Qinghai–Tibet Engineering Corridor. Sustainability 2023, 15, 16412. https://doi.org/10.3390/su152316412
Zhao T, Wang C, Wang J. Influence of Climate Warming on the Ground Surface Stability over Permafrost along the Qinghai–Tibet Engineering Corridor. Sustainability. 2023; 15(23):16412. https://doi.org/10.3390/su152316412
Chicago/Turabian StyleZhao, Tao, Chong Wang, and Jiachen Wang. 2023. "Influence of Climate Warming on the Ground Surface Stability over Permafrost along the Qinghai–Tibet Engineering Corridor" Sustainability 15, no. 23: 16412. https://doi.org/10.3390/su152316412
APA StyleZhao, T., Wang, C., & Wang, J. (2023). Influence of Climate Warming on the Ground Surface Stability over Permafrost along the Qinghai–Tibet Engineering Corridor. Sustainability, 15(23), 16412. https://doi.org/10.3390/su152316412