
Electrification of Motorway Network: A Methodological Approach to Define Location of Charging Infrastructure for EV


Abstract
:1. Introduction
2. Private Transport Sector Electrification Context
3. Methodological Approach
- National new vehicle registration: useful for knowing the national per capita motorization rate;
- Traffic framework in a specific motorway section: necessary to define the flow of users in a specific area;
- EV national market share: useful for characterizing the electricity market trend.
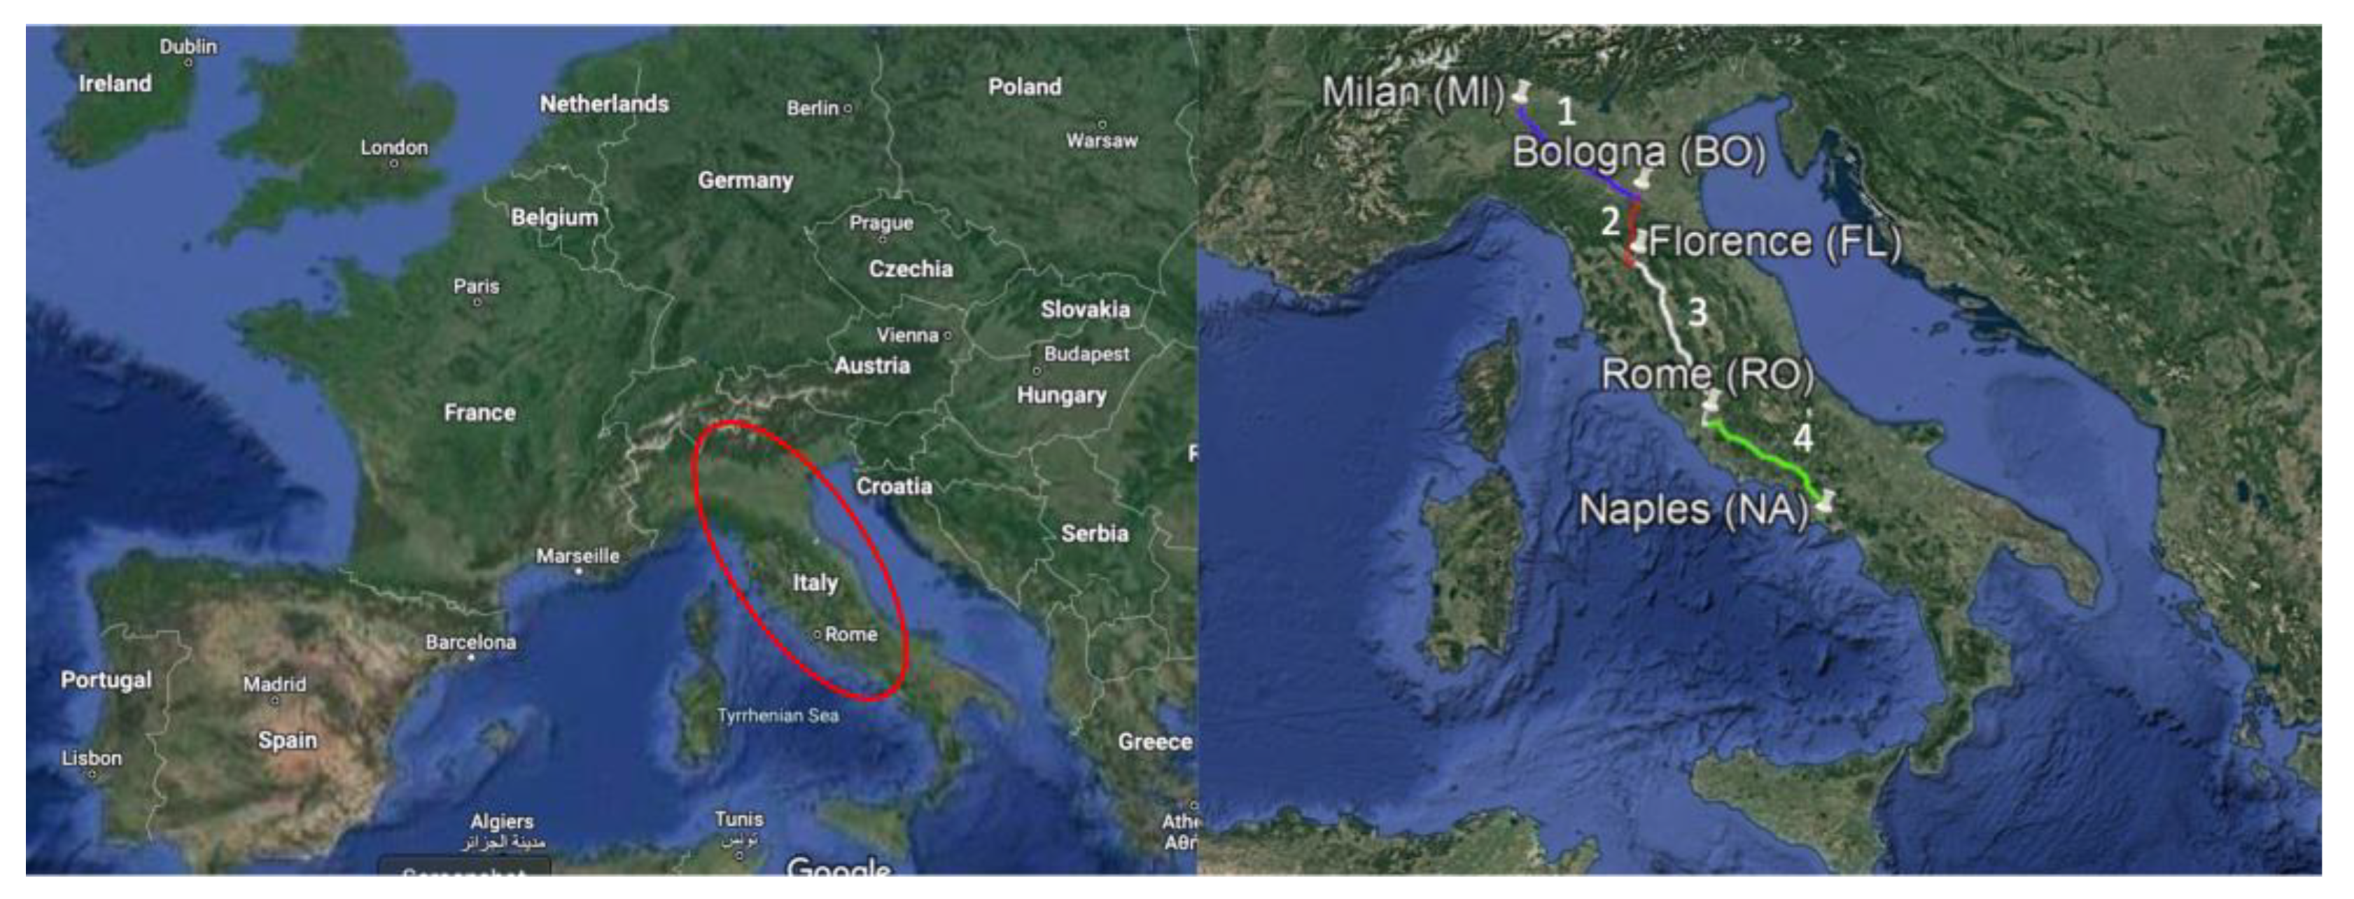
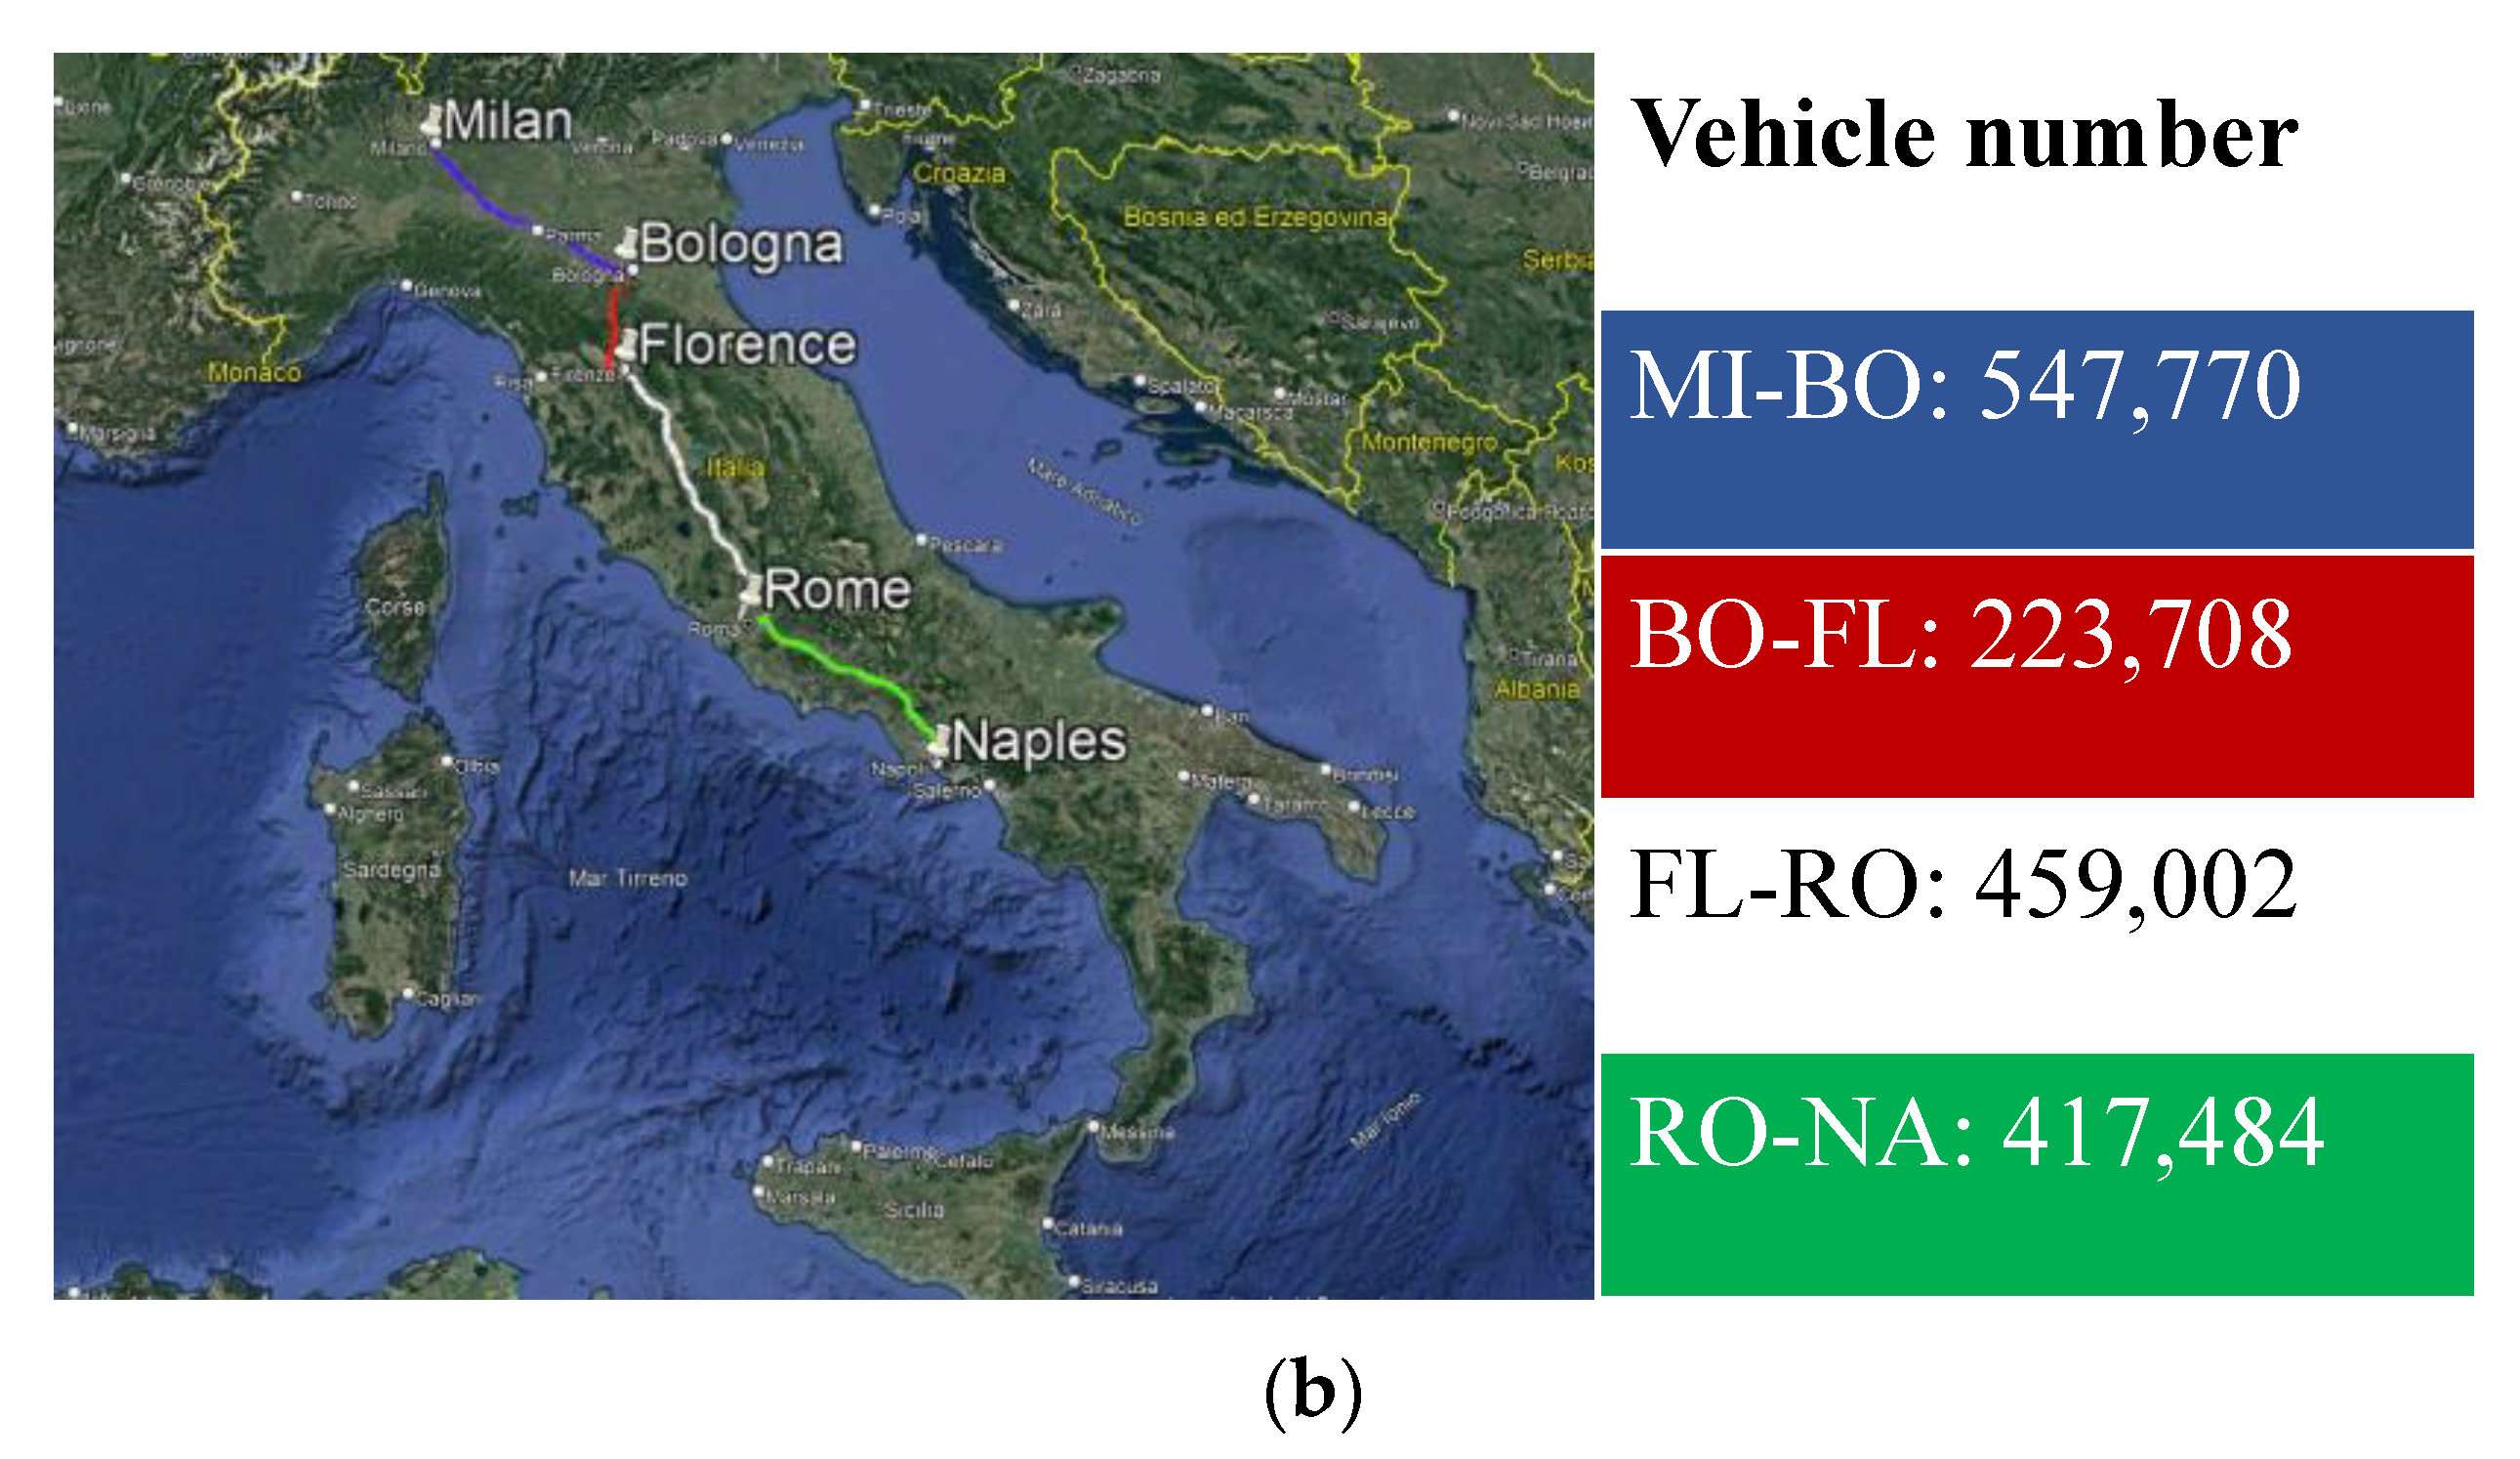
4. Case Study: The Italian Motorways
- Sub-section 1: Milan–Bologna (approximately 215 km);
- Sub-section 2: Bologna–Florence (approximately 119 km);
- Sub-section 3: Florence–Rome (approximately 273 km);
- Sub-section 4: Rome–Naples (approximately 225 km).
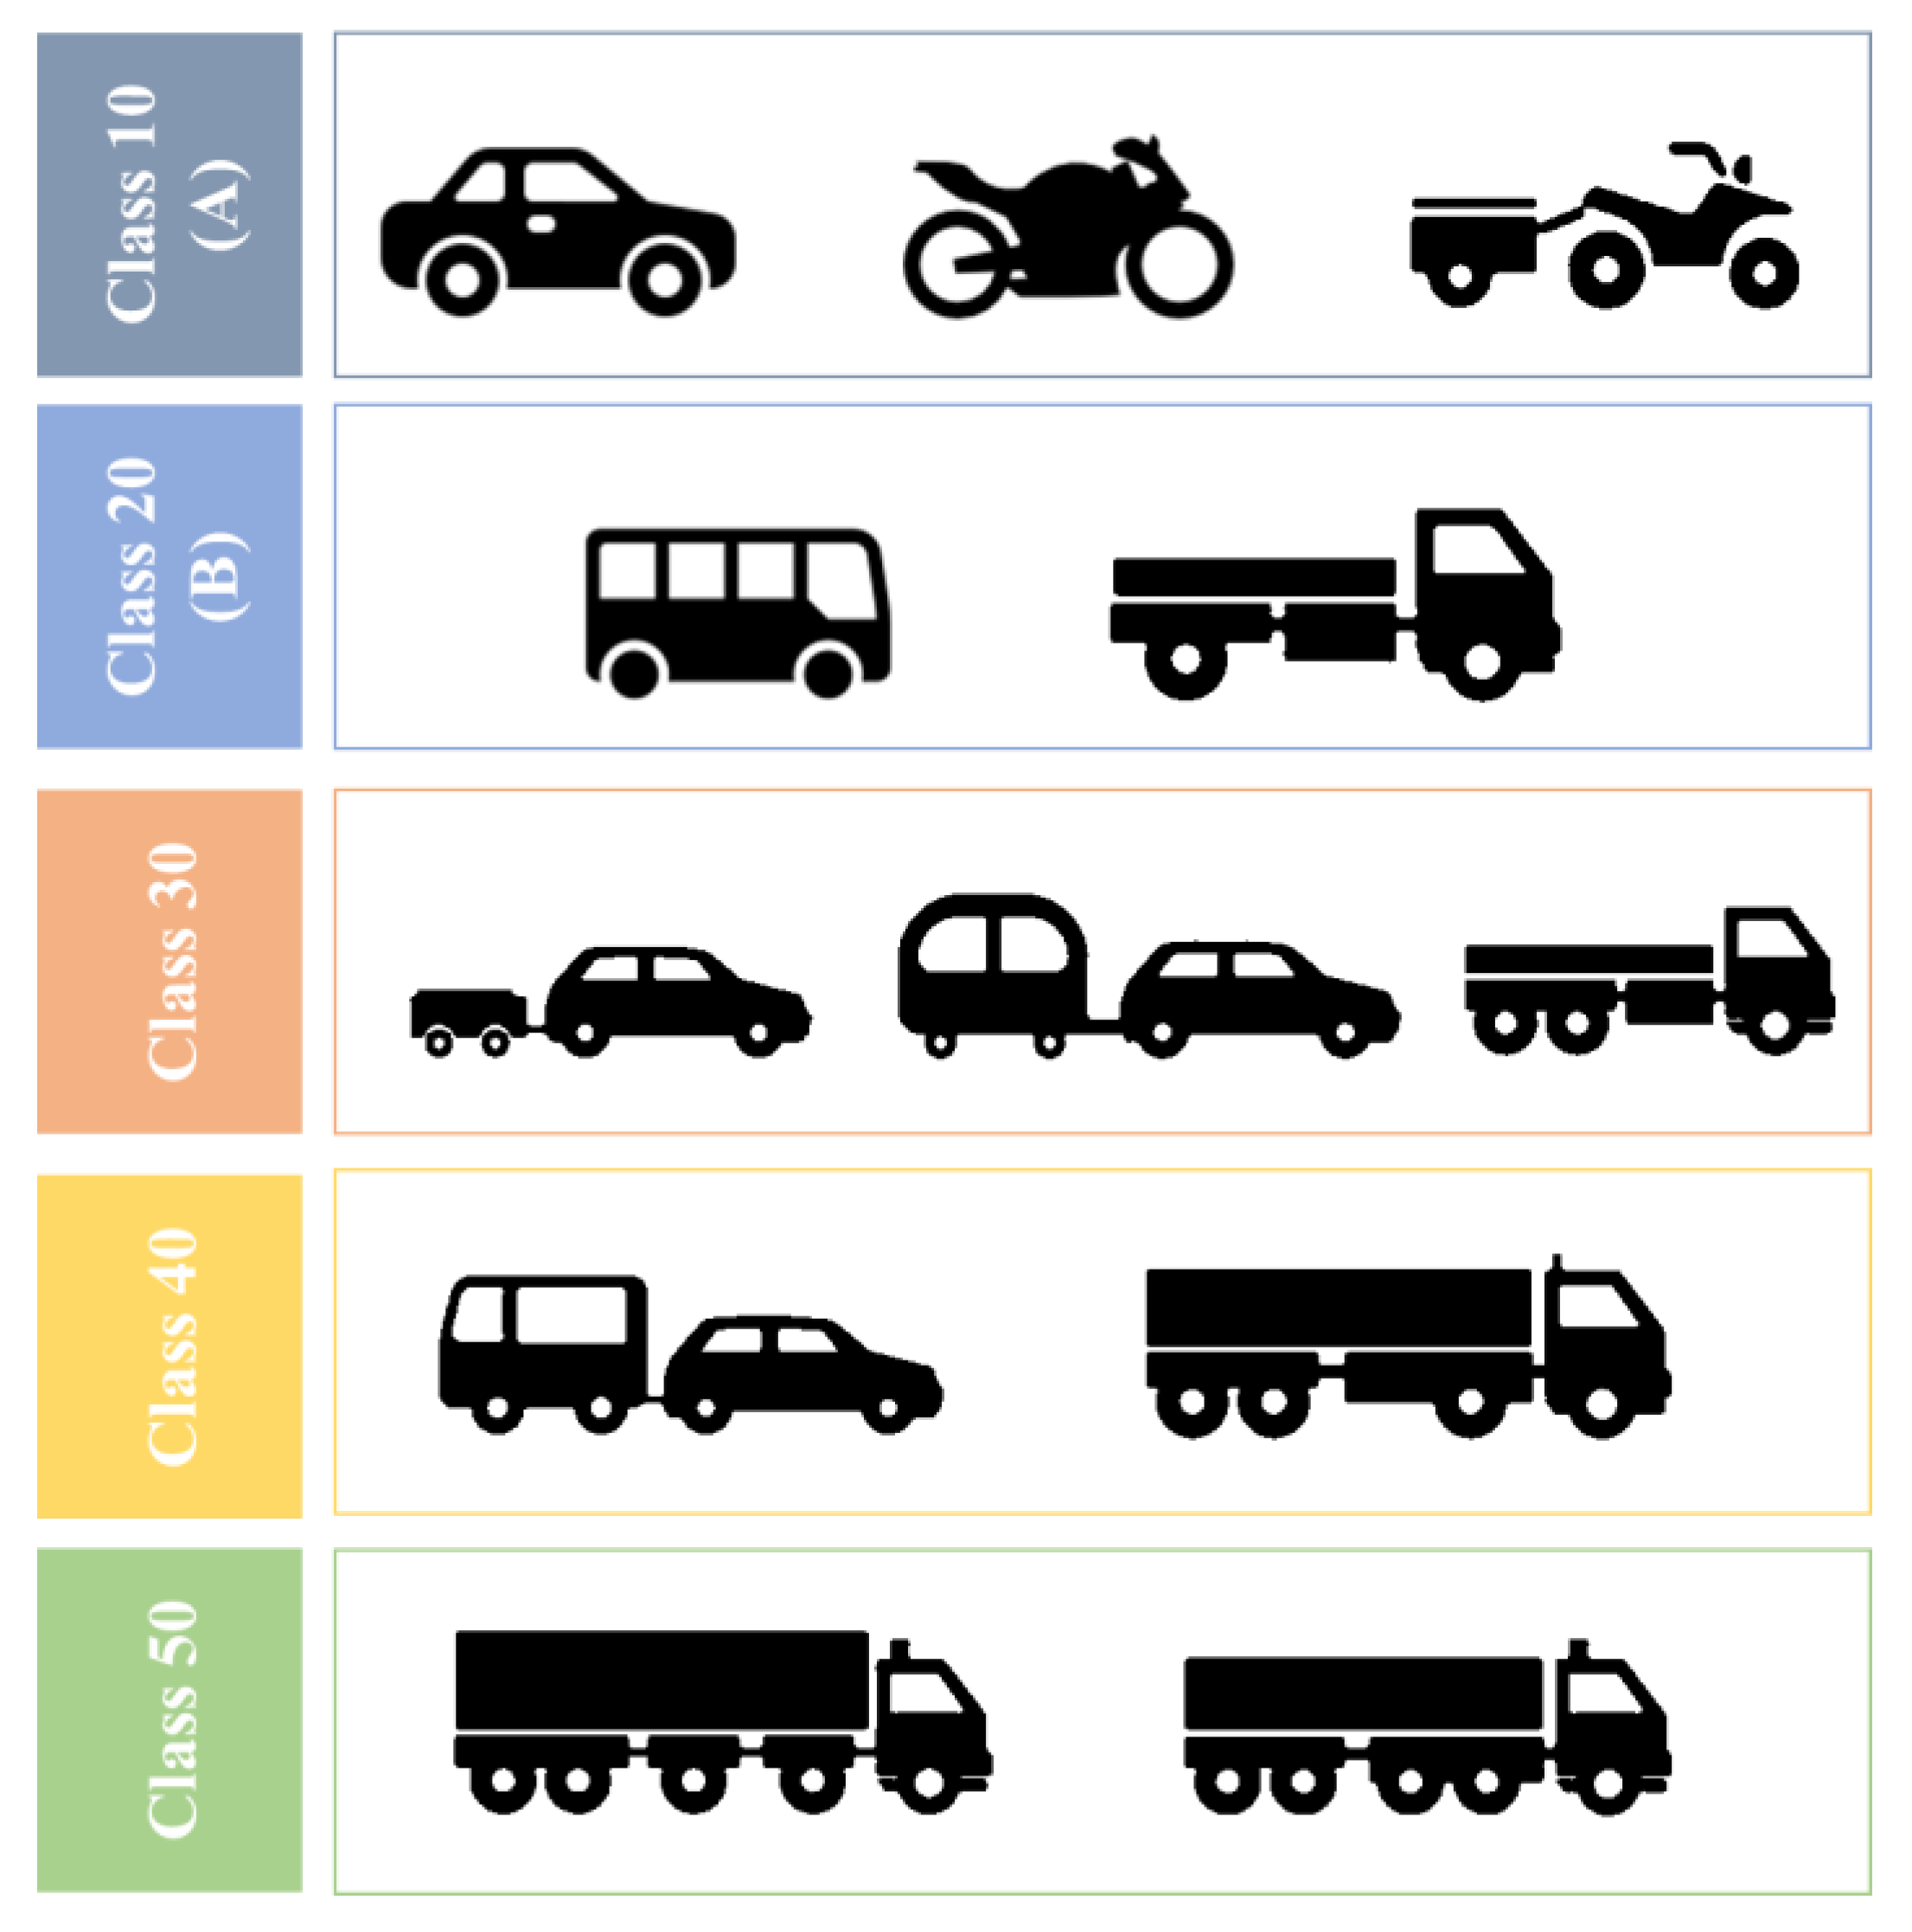
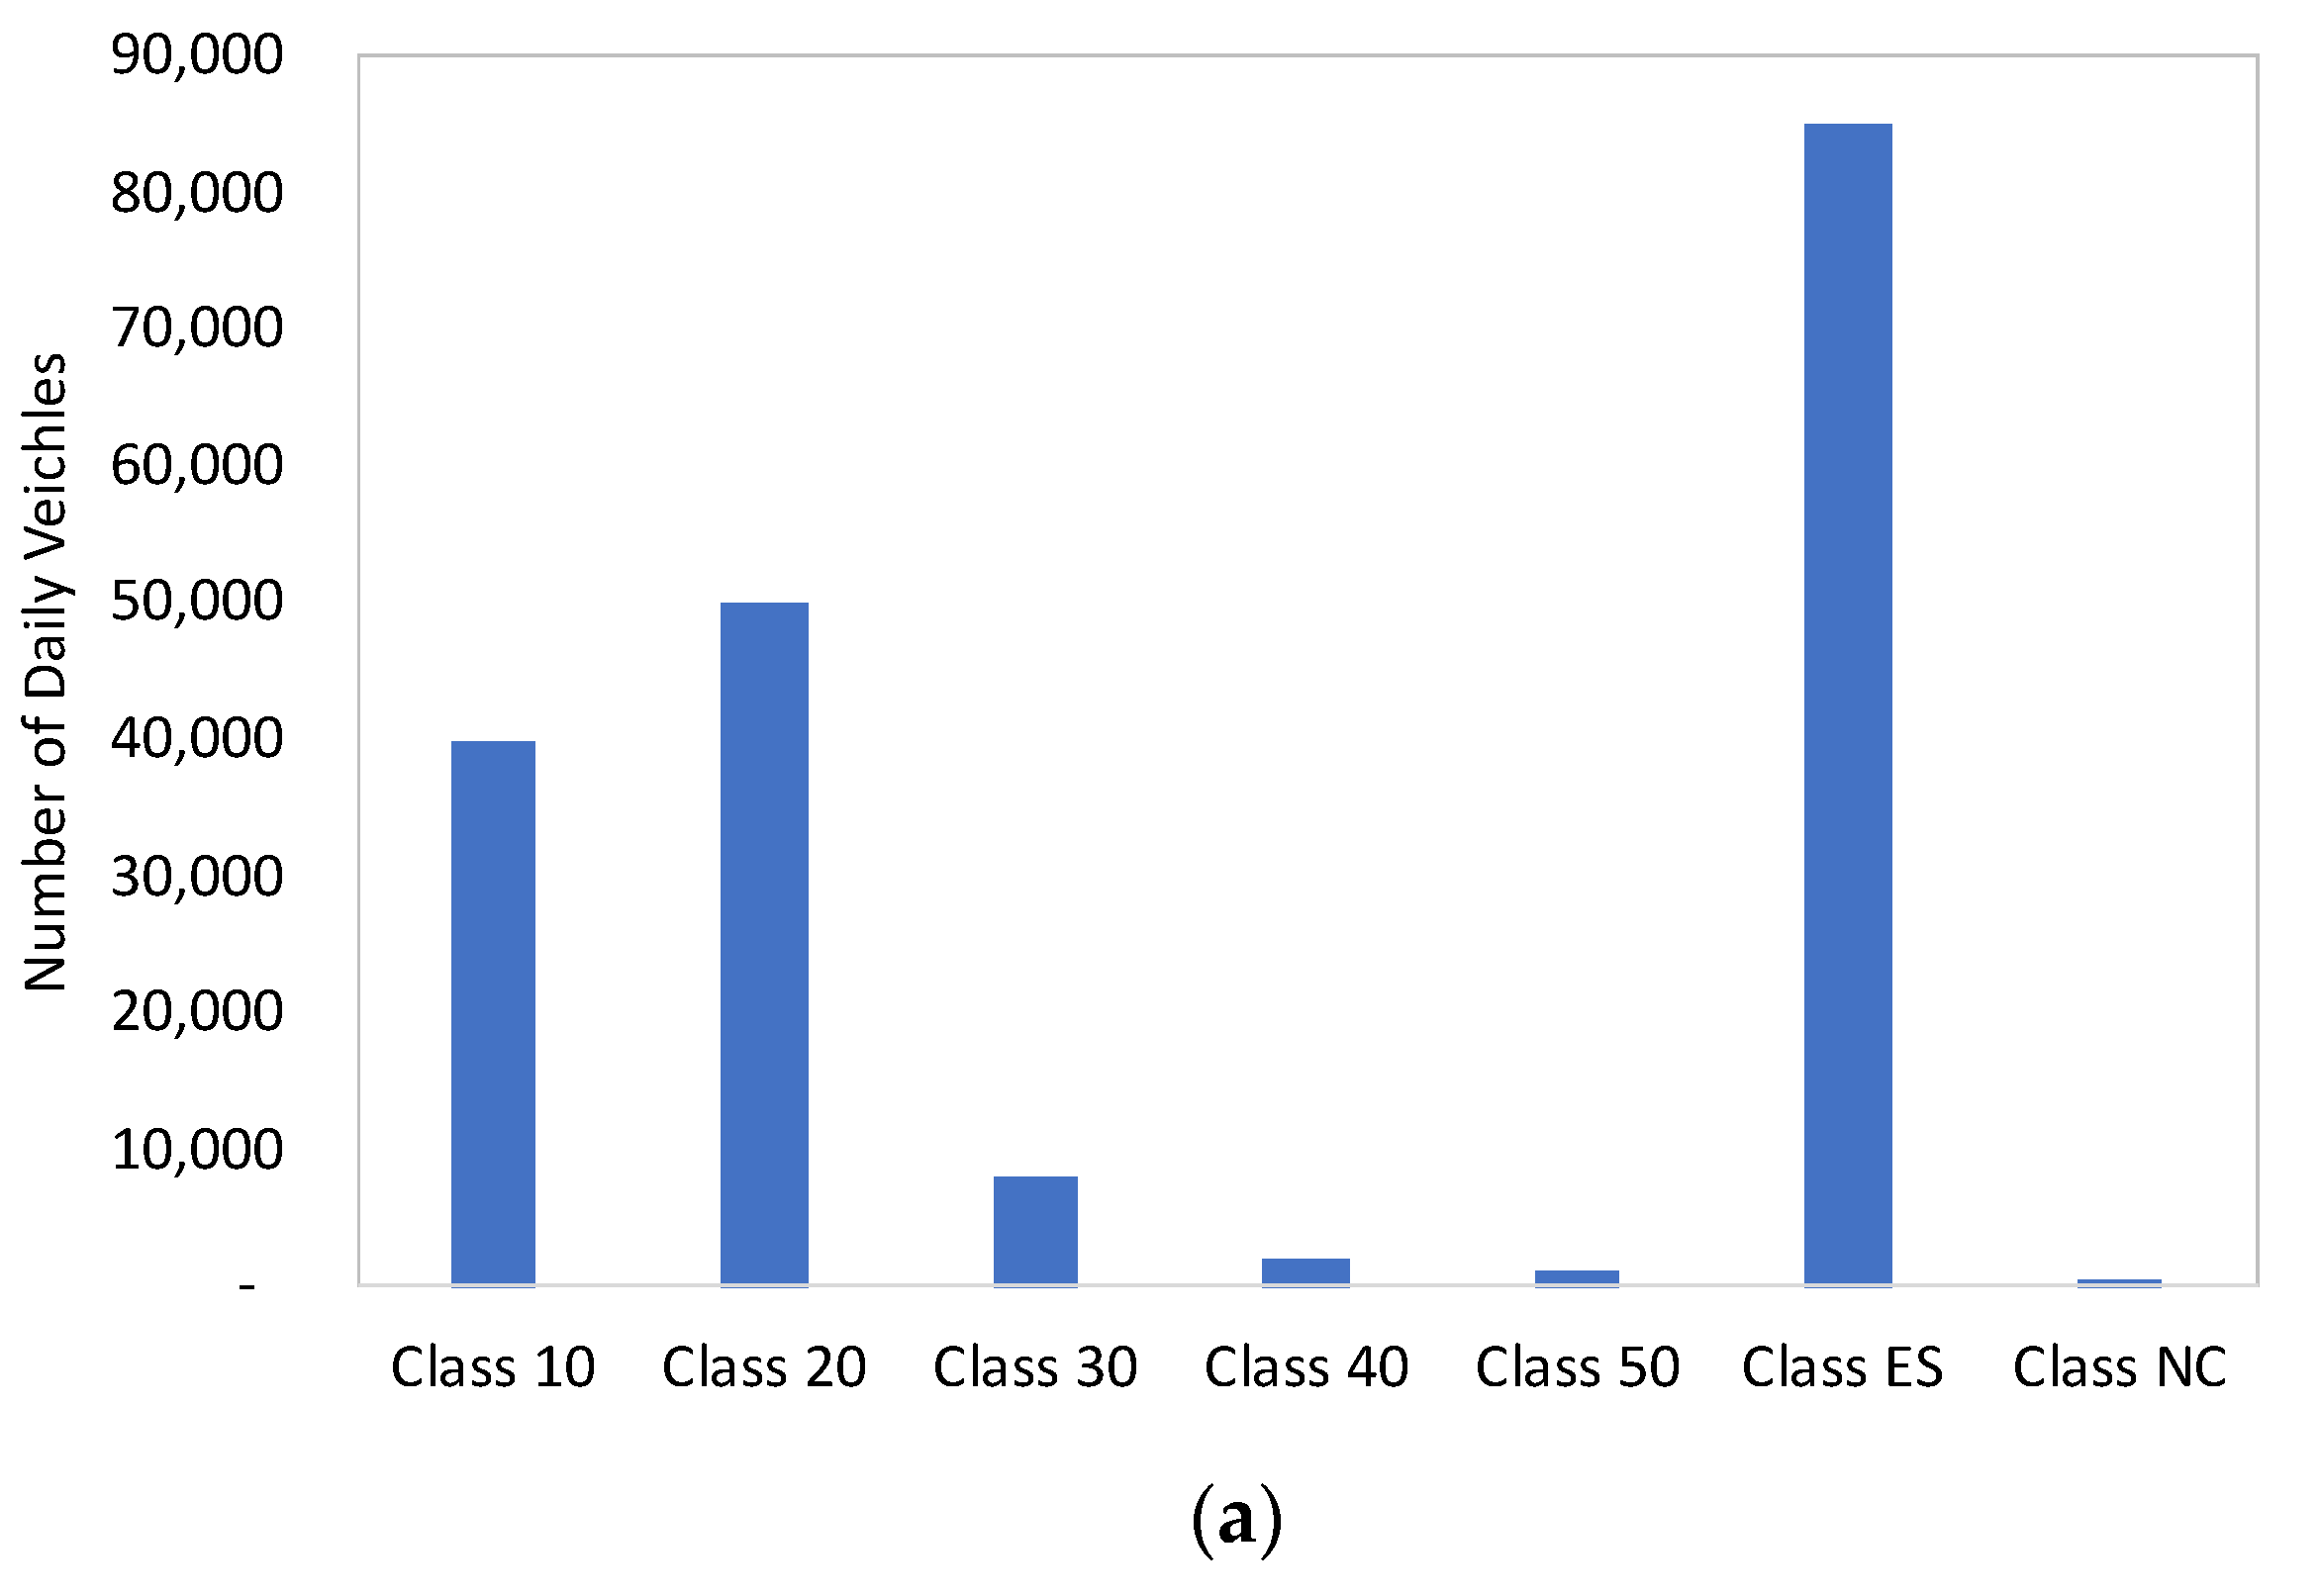
4.1. A1 Motorway Traffic Flow
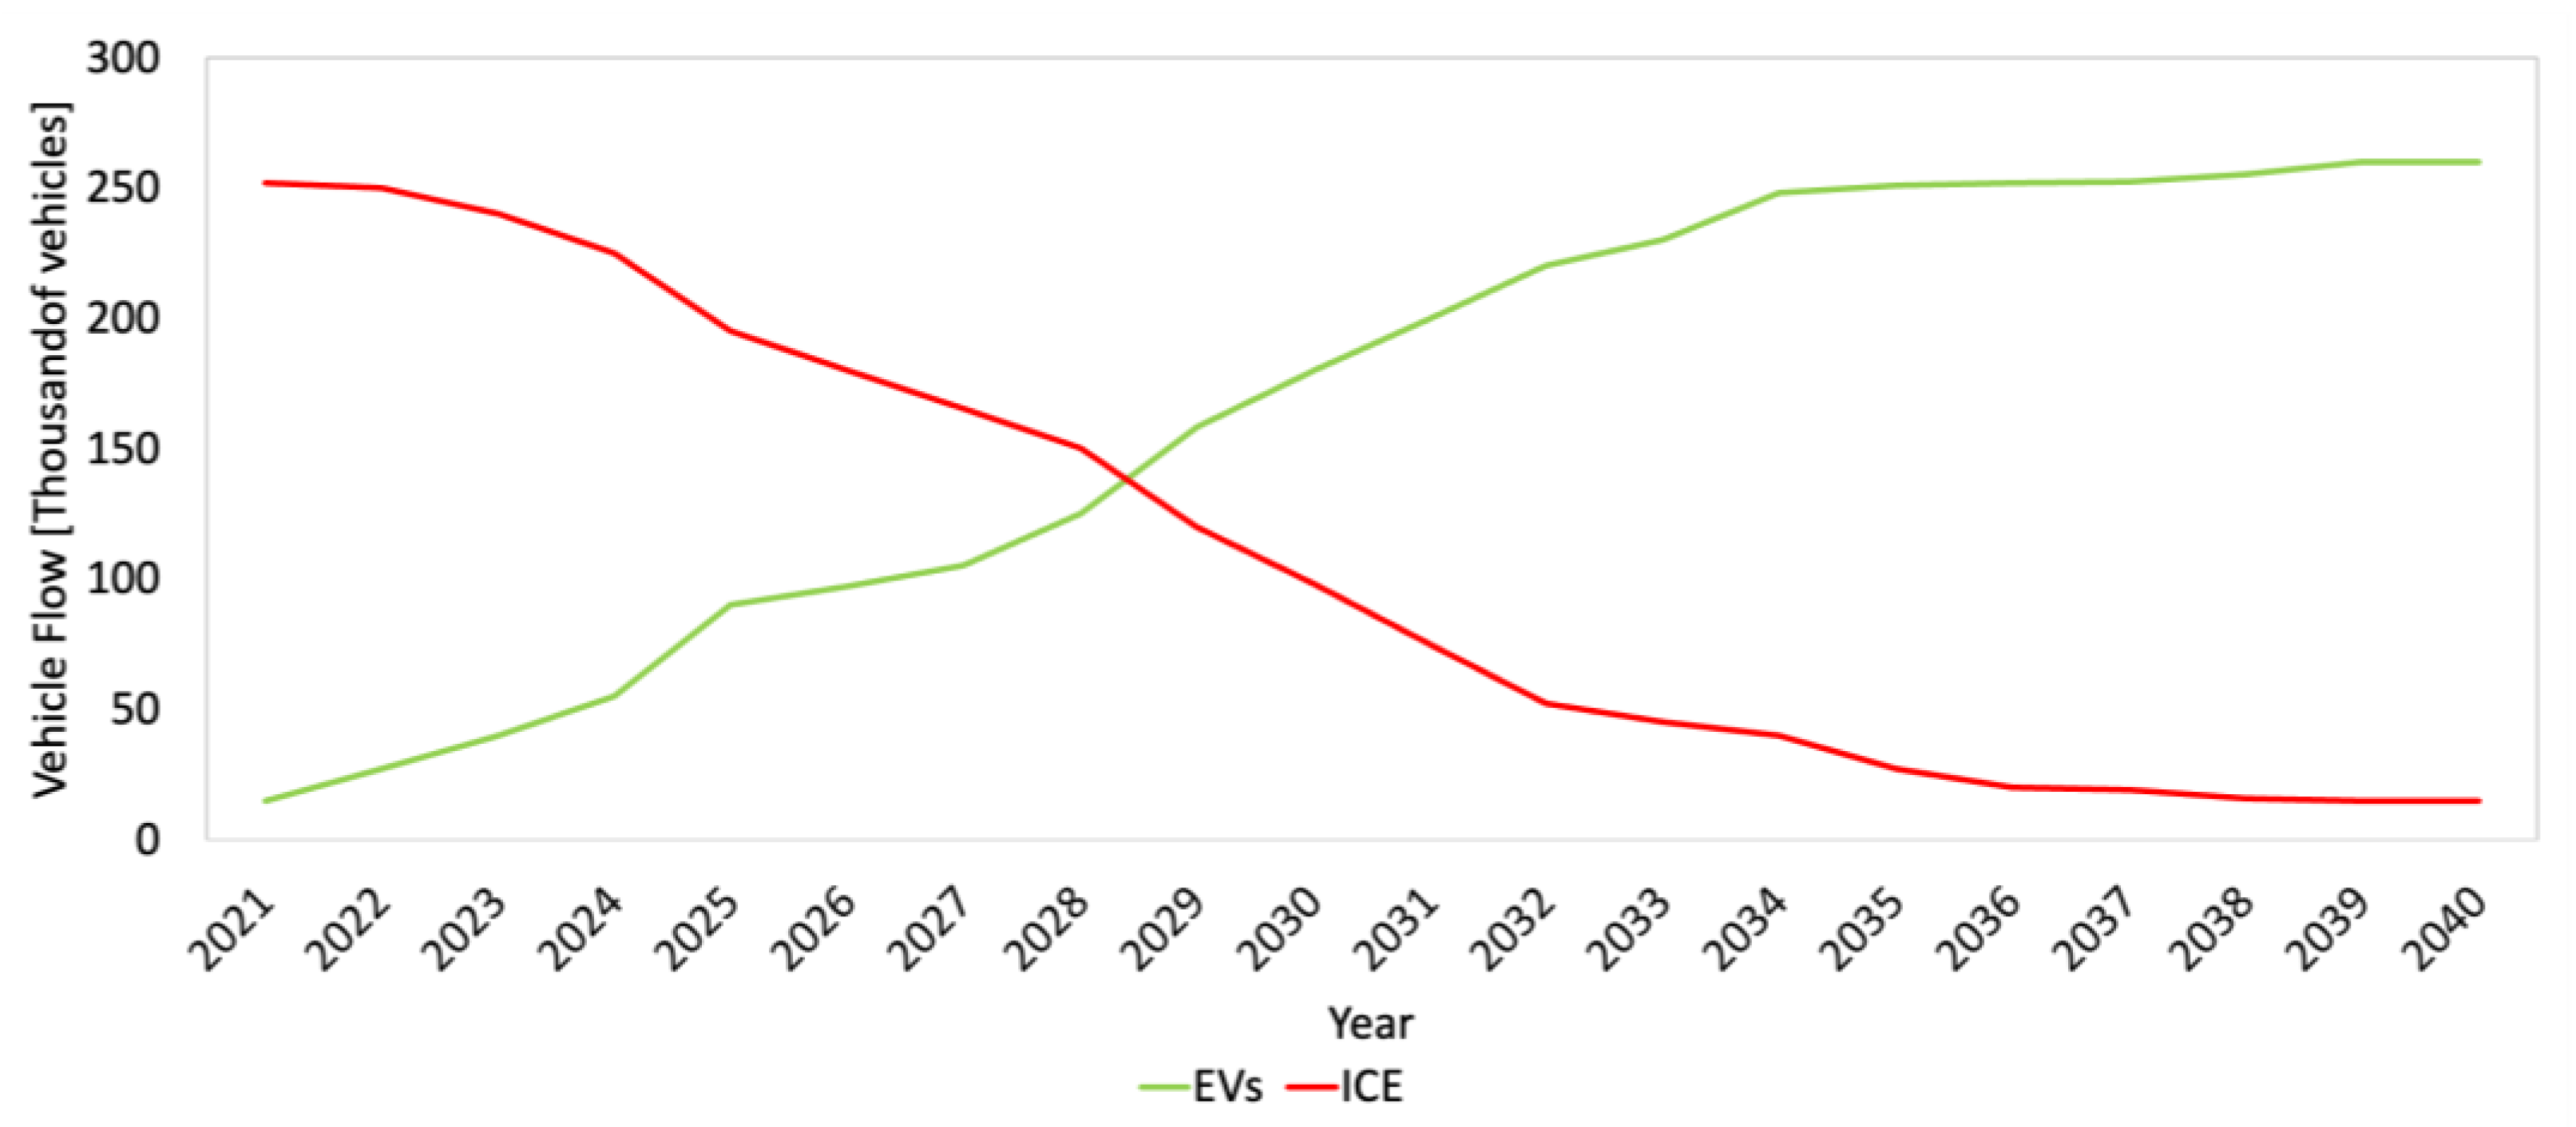
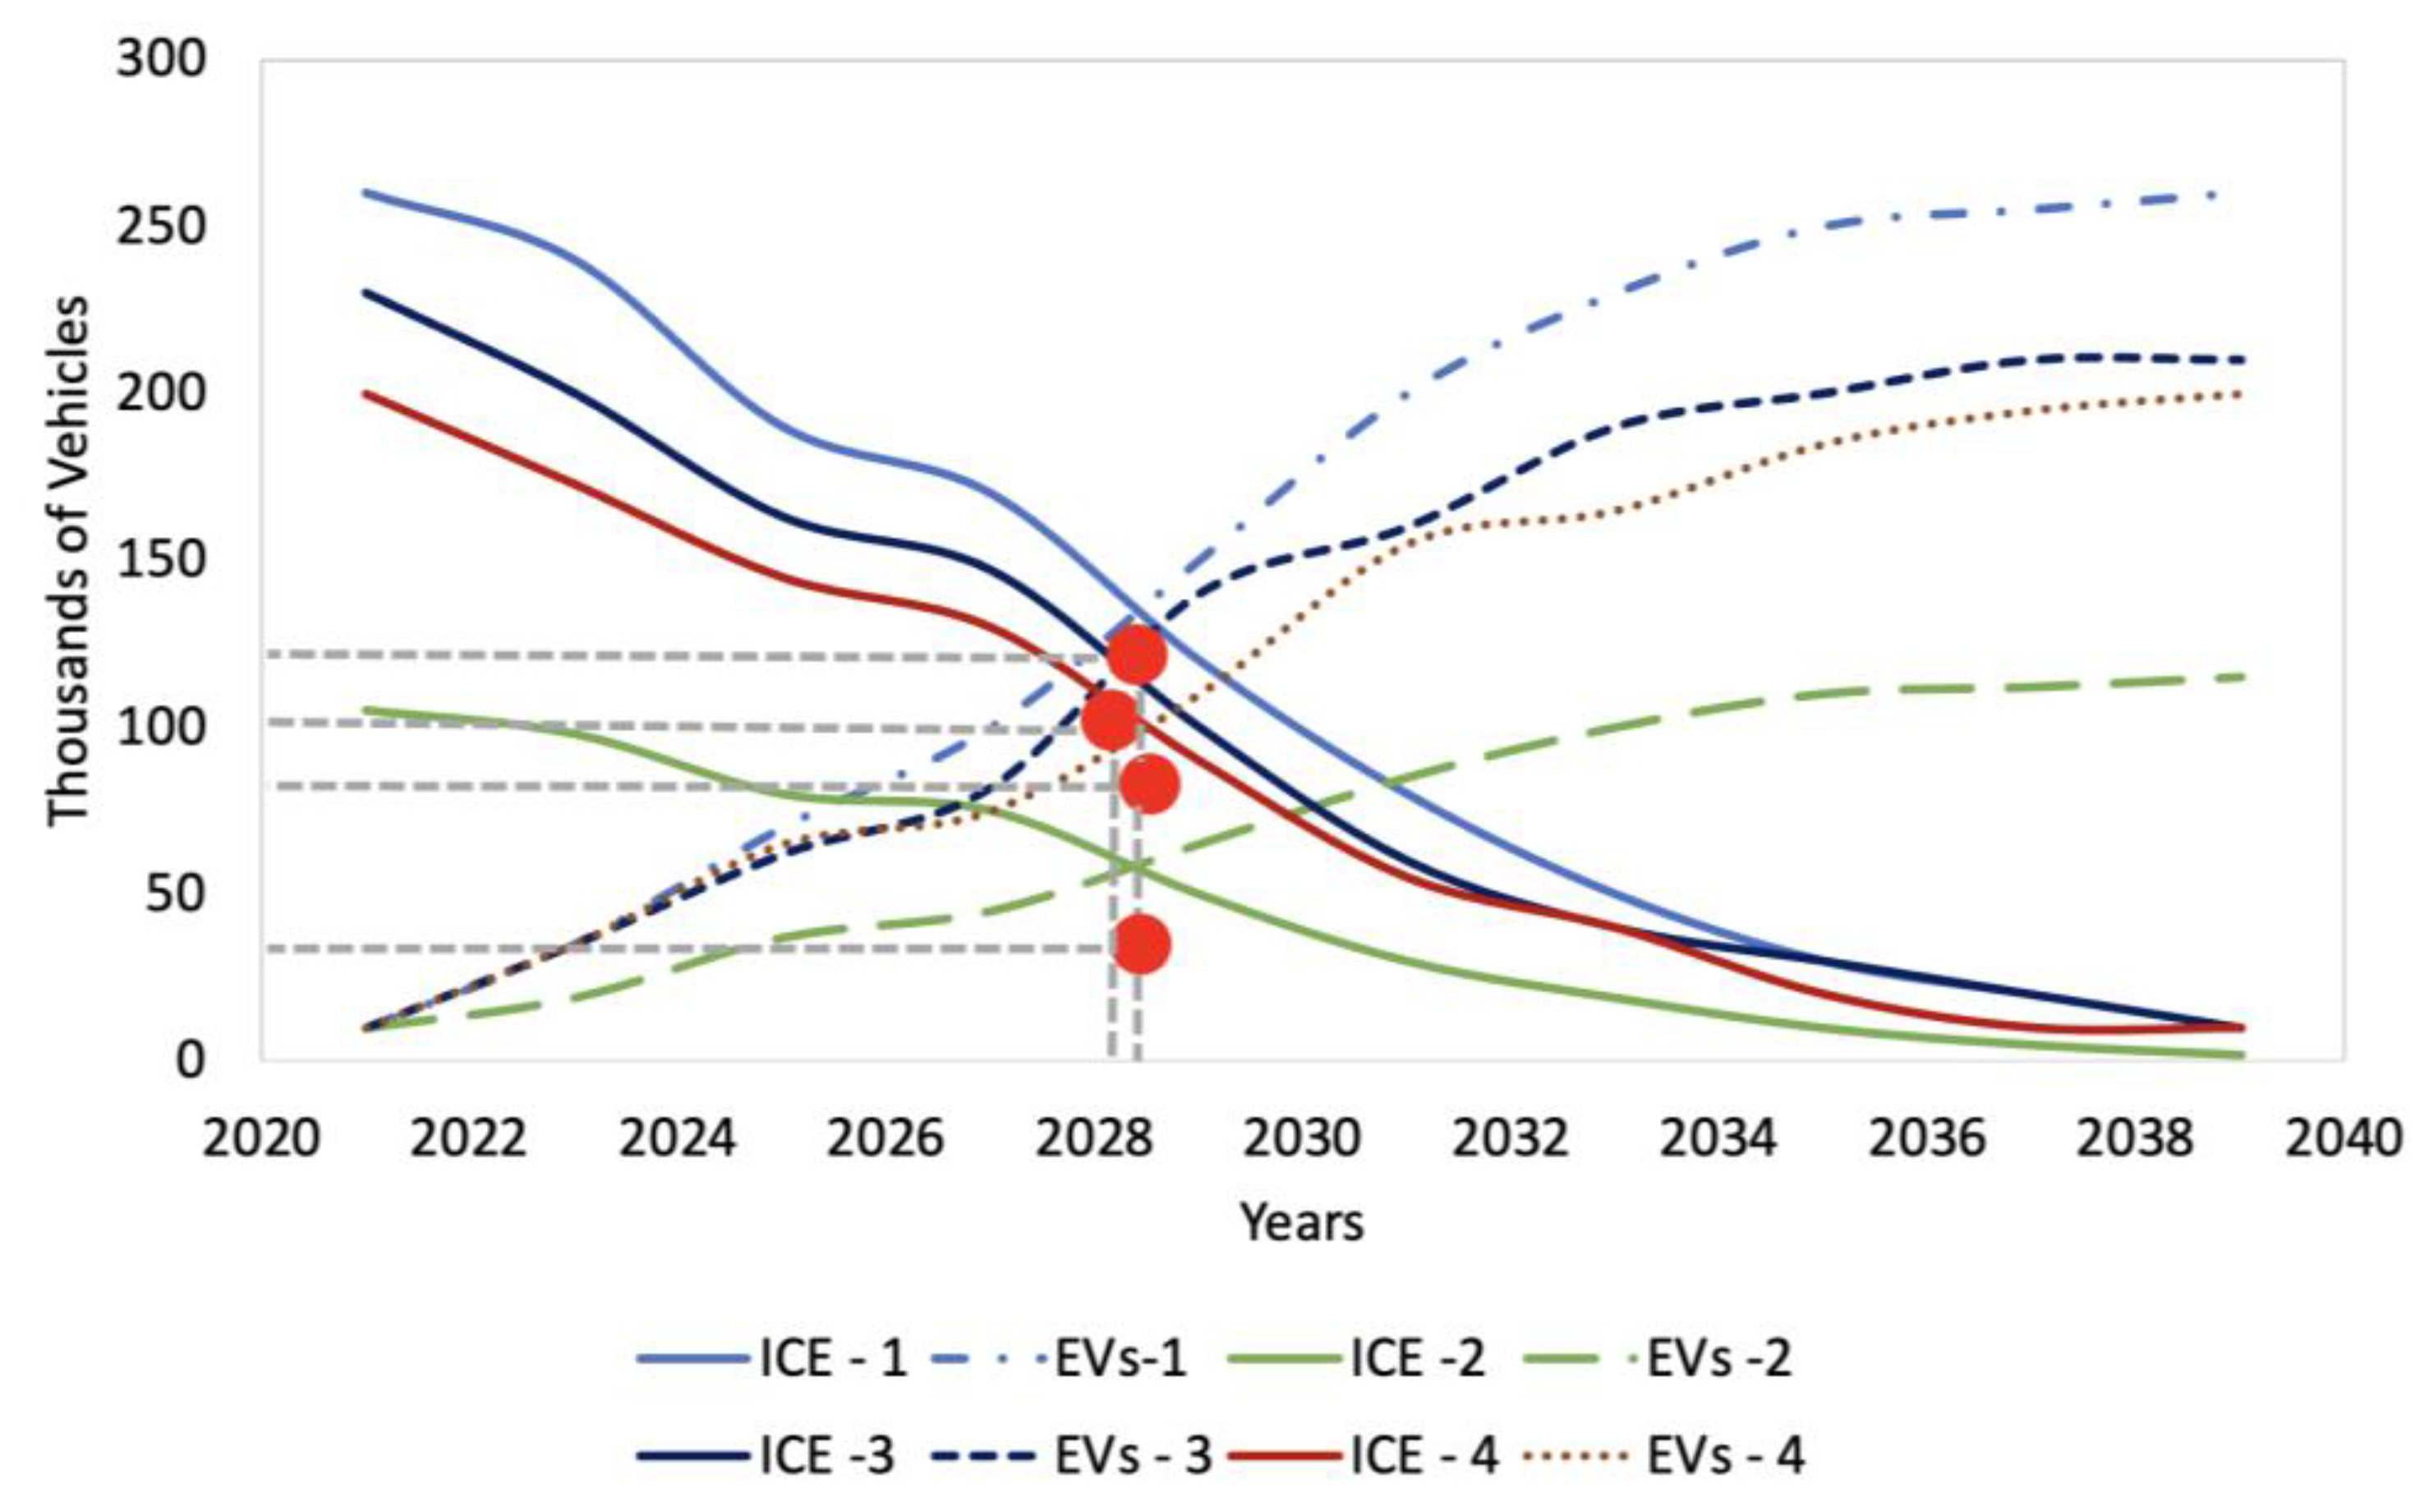
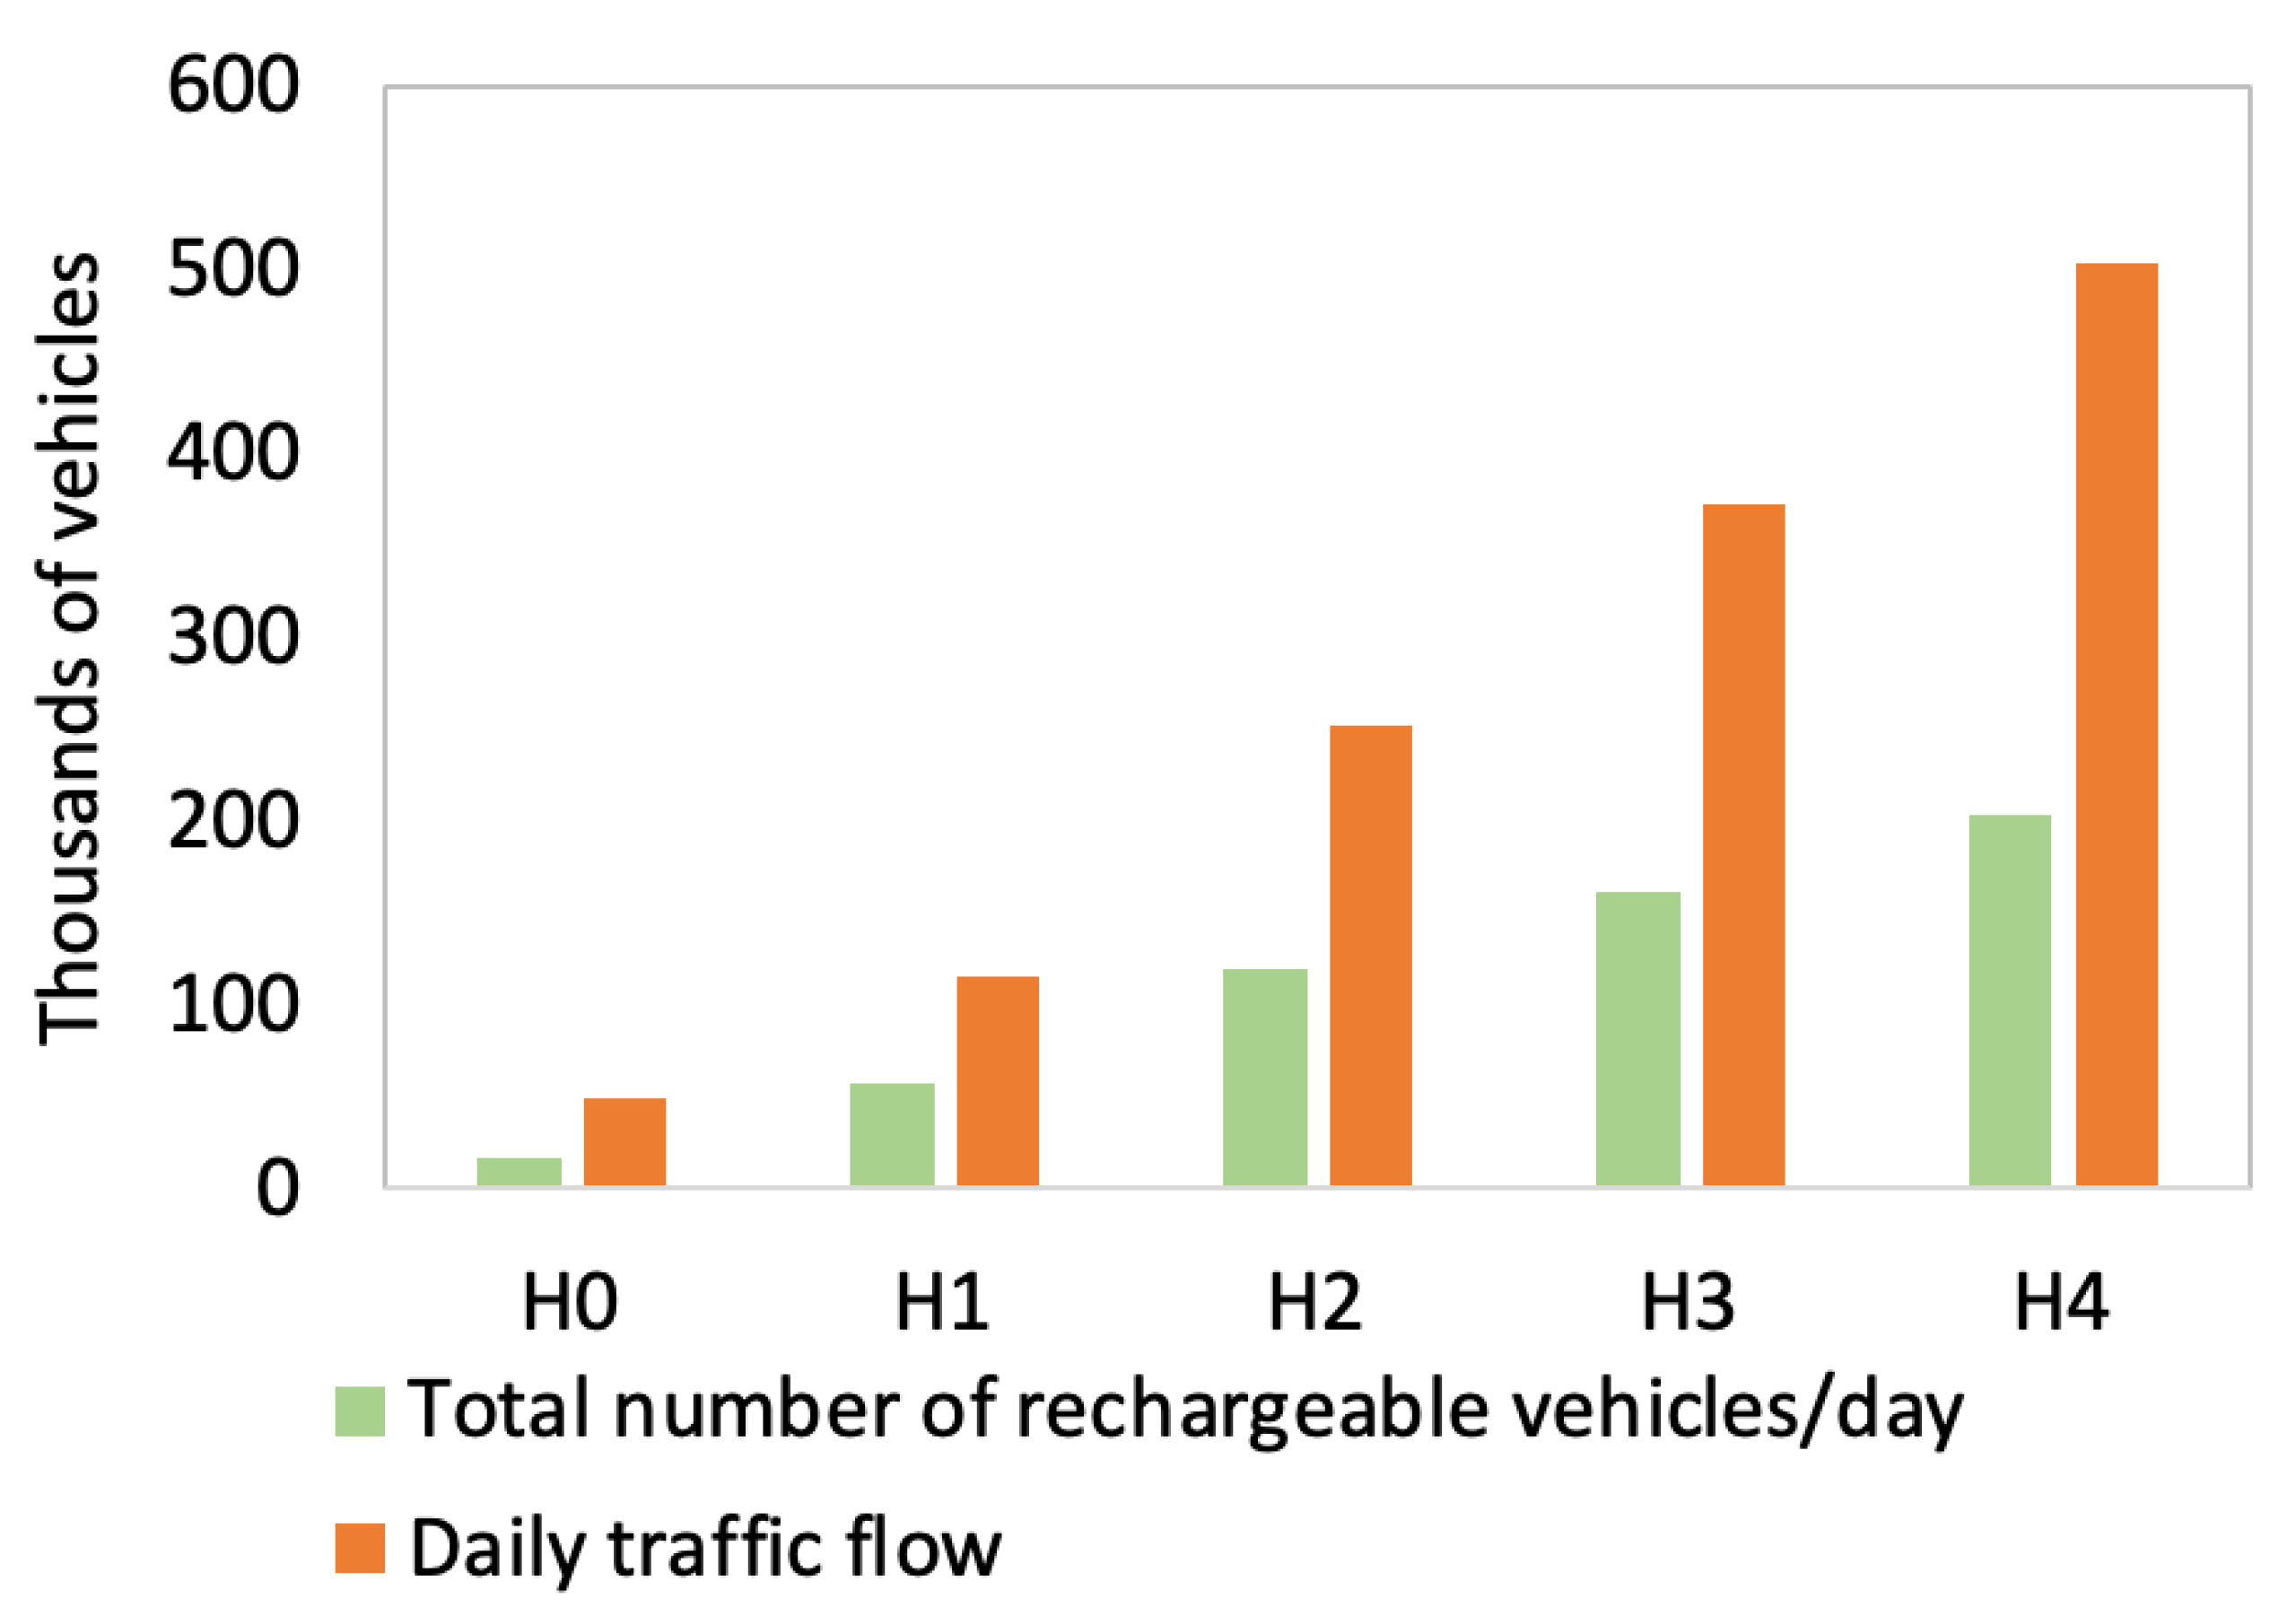
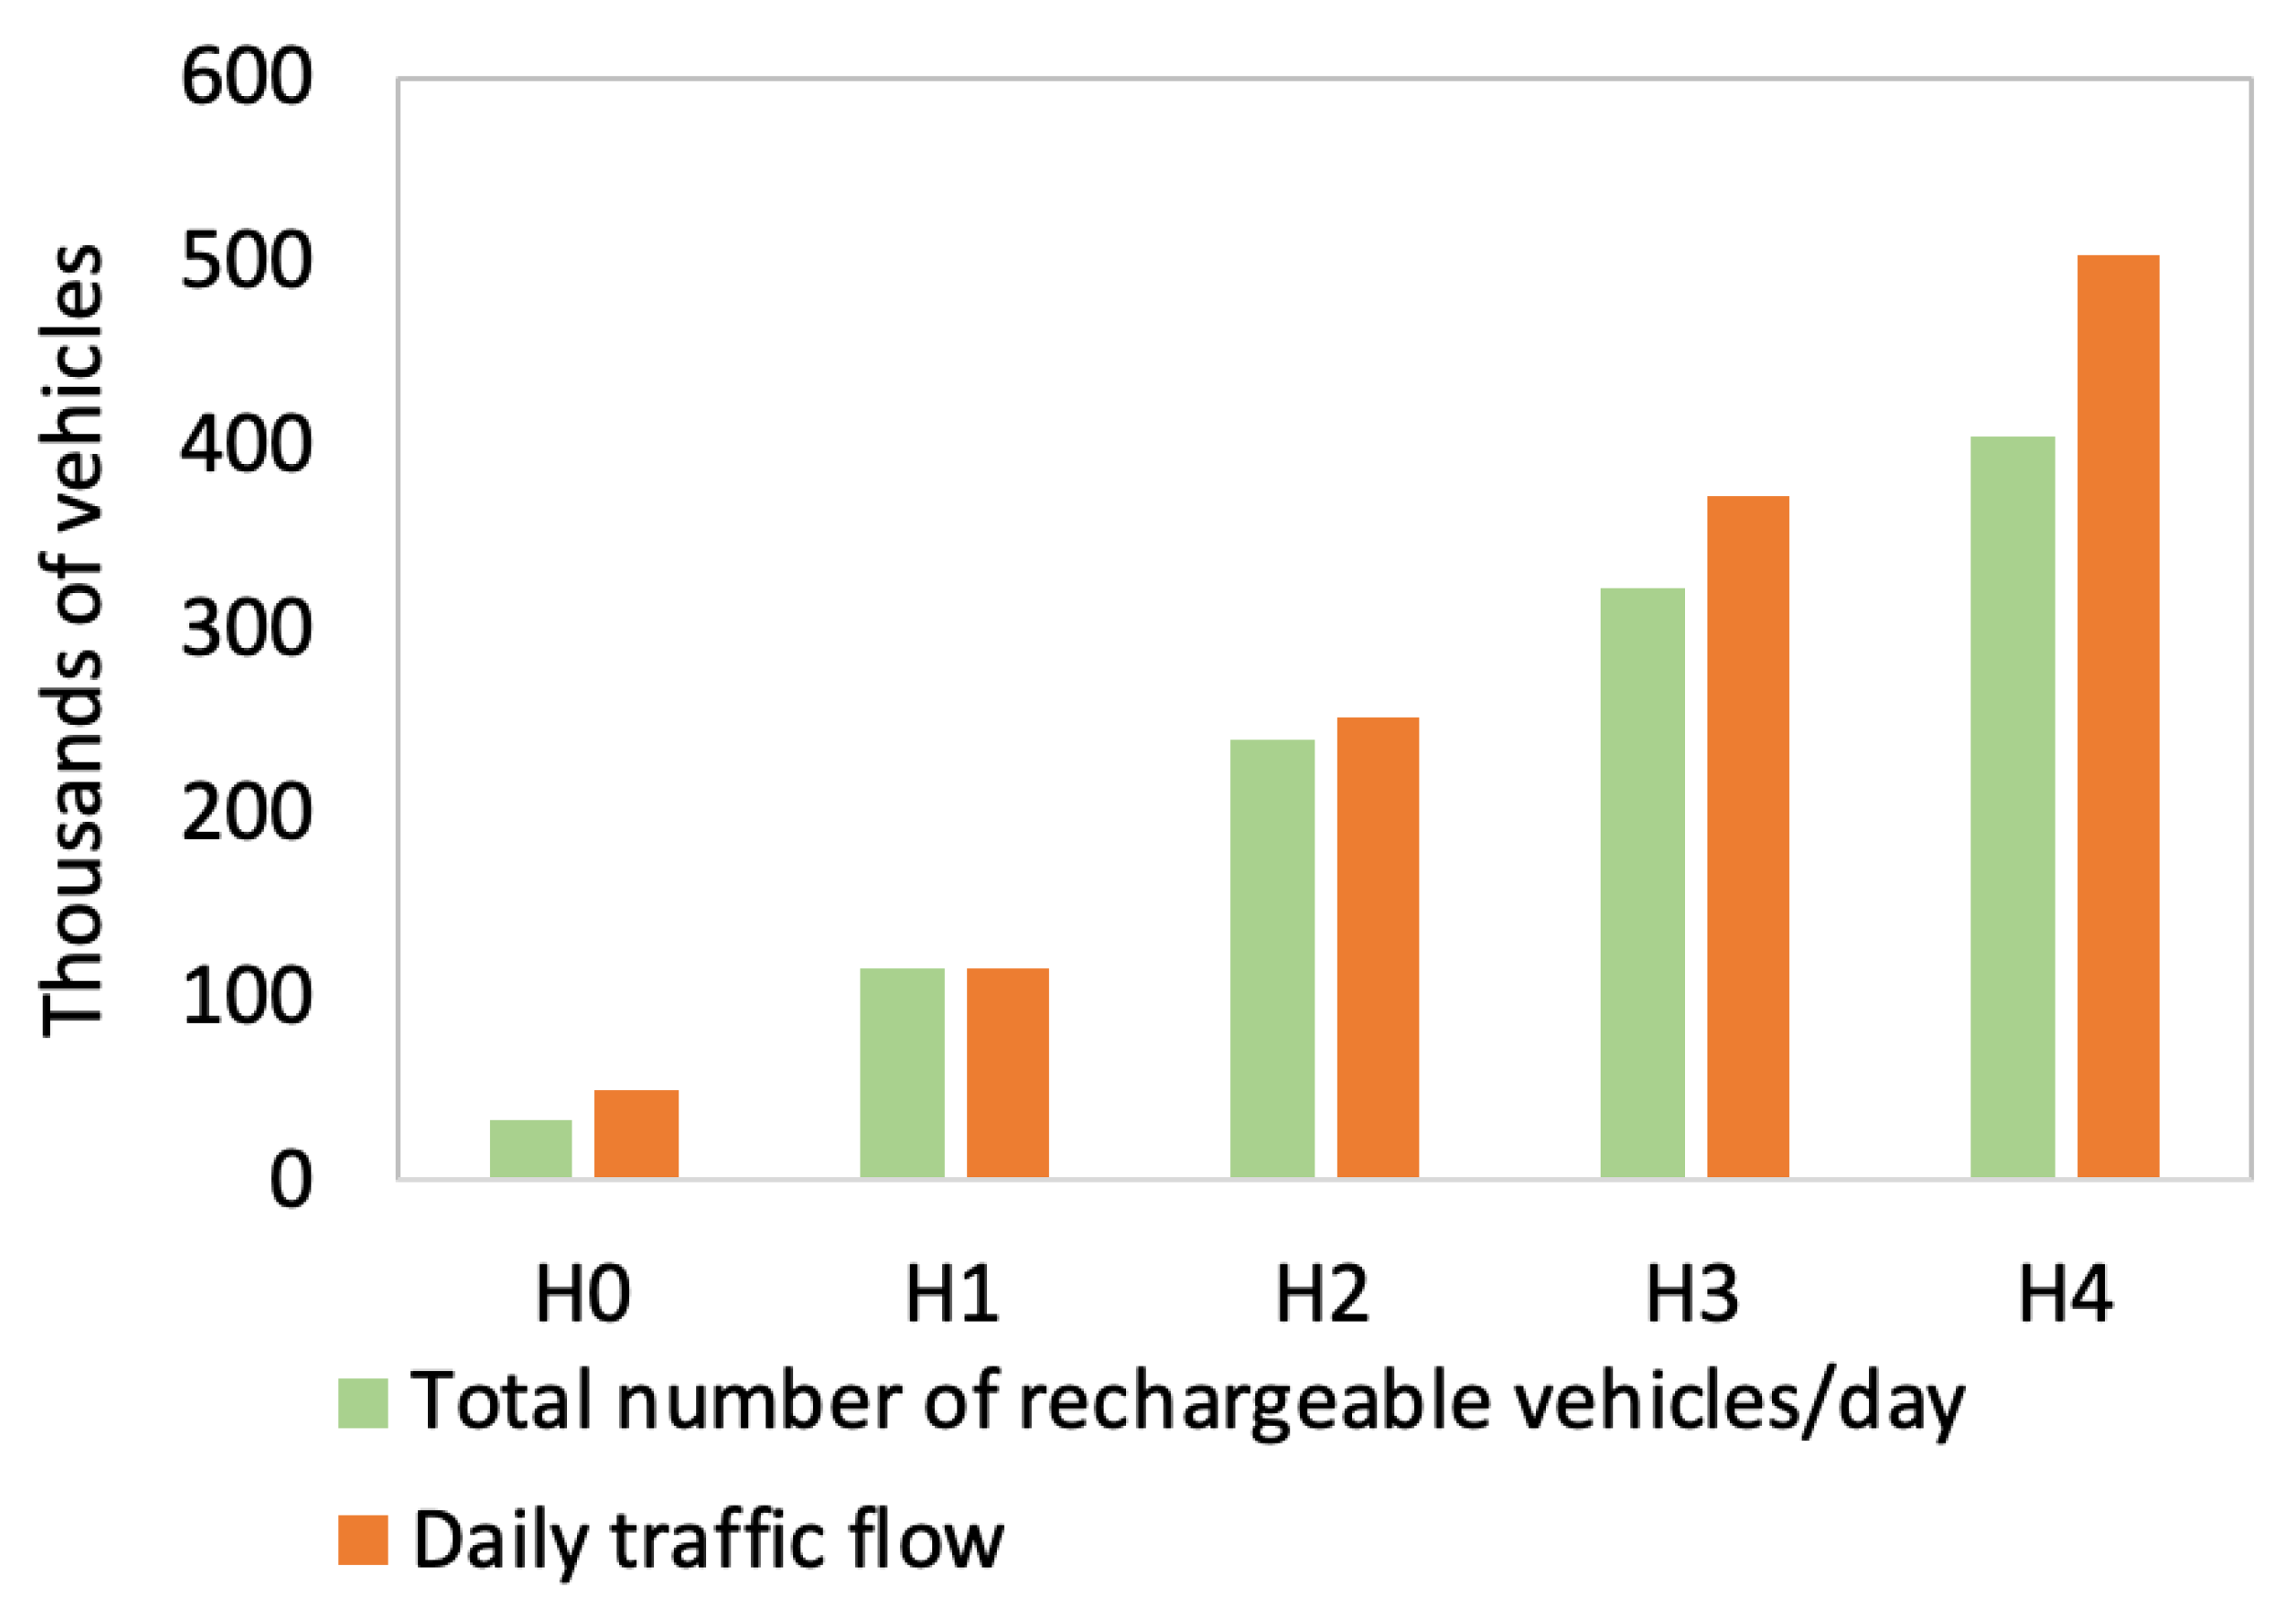
4.2. EVs Flow Forecast on A1 Motorway
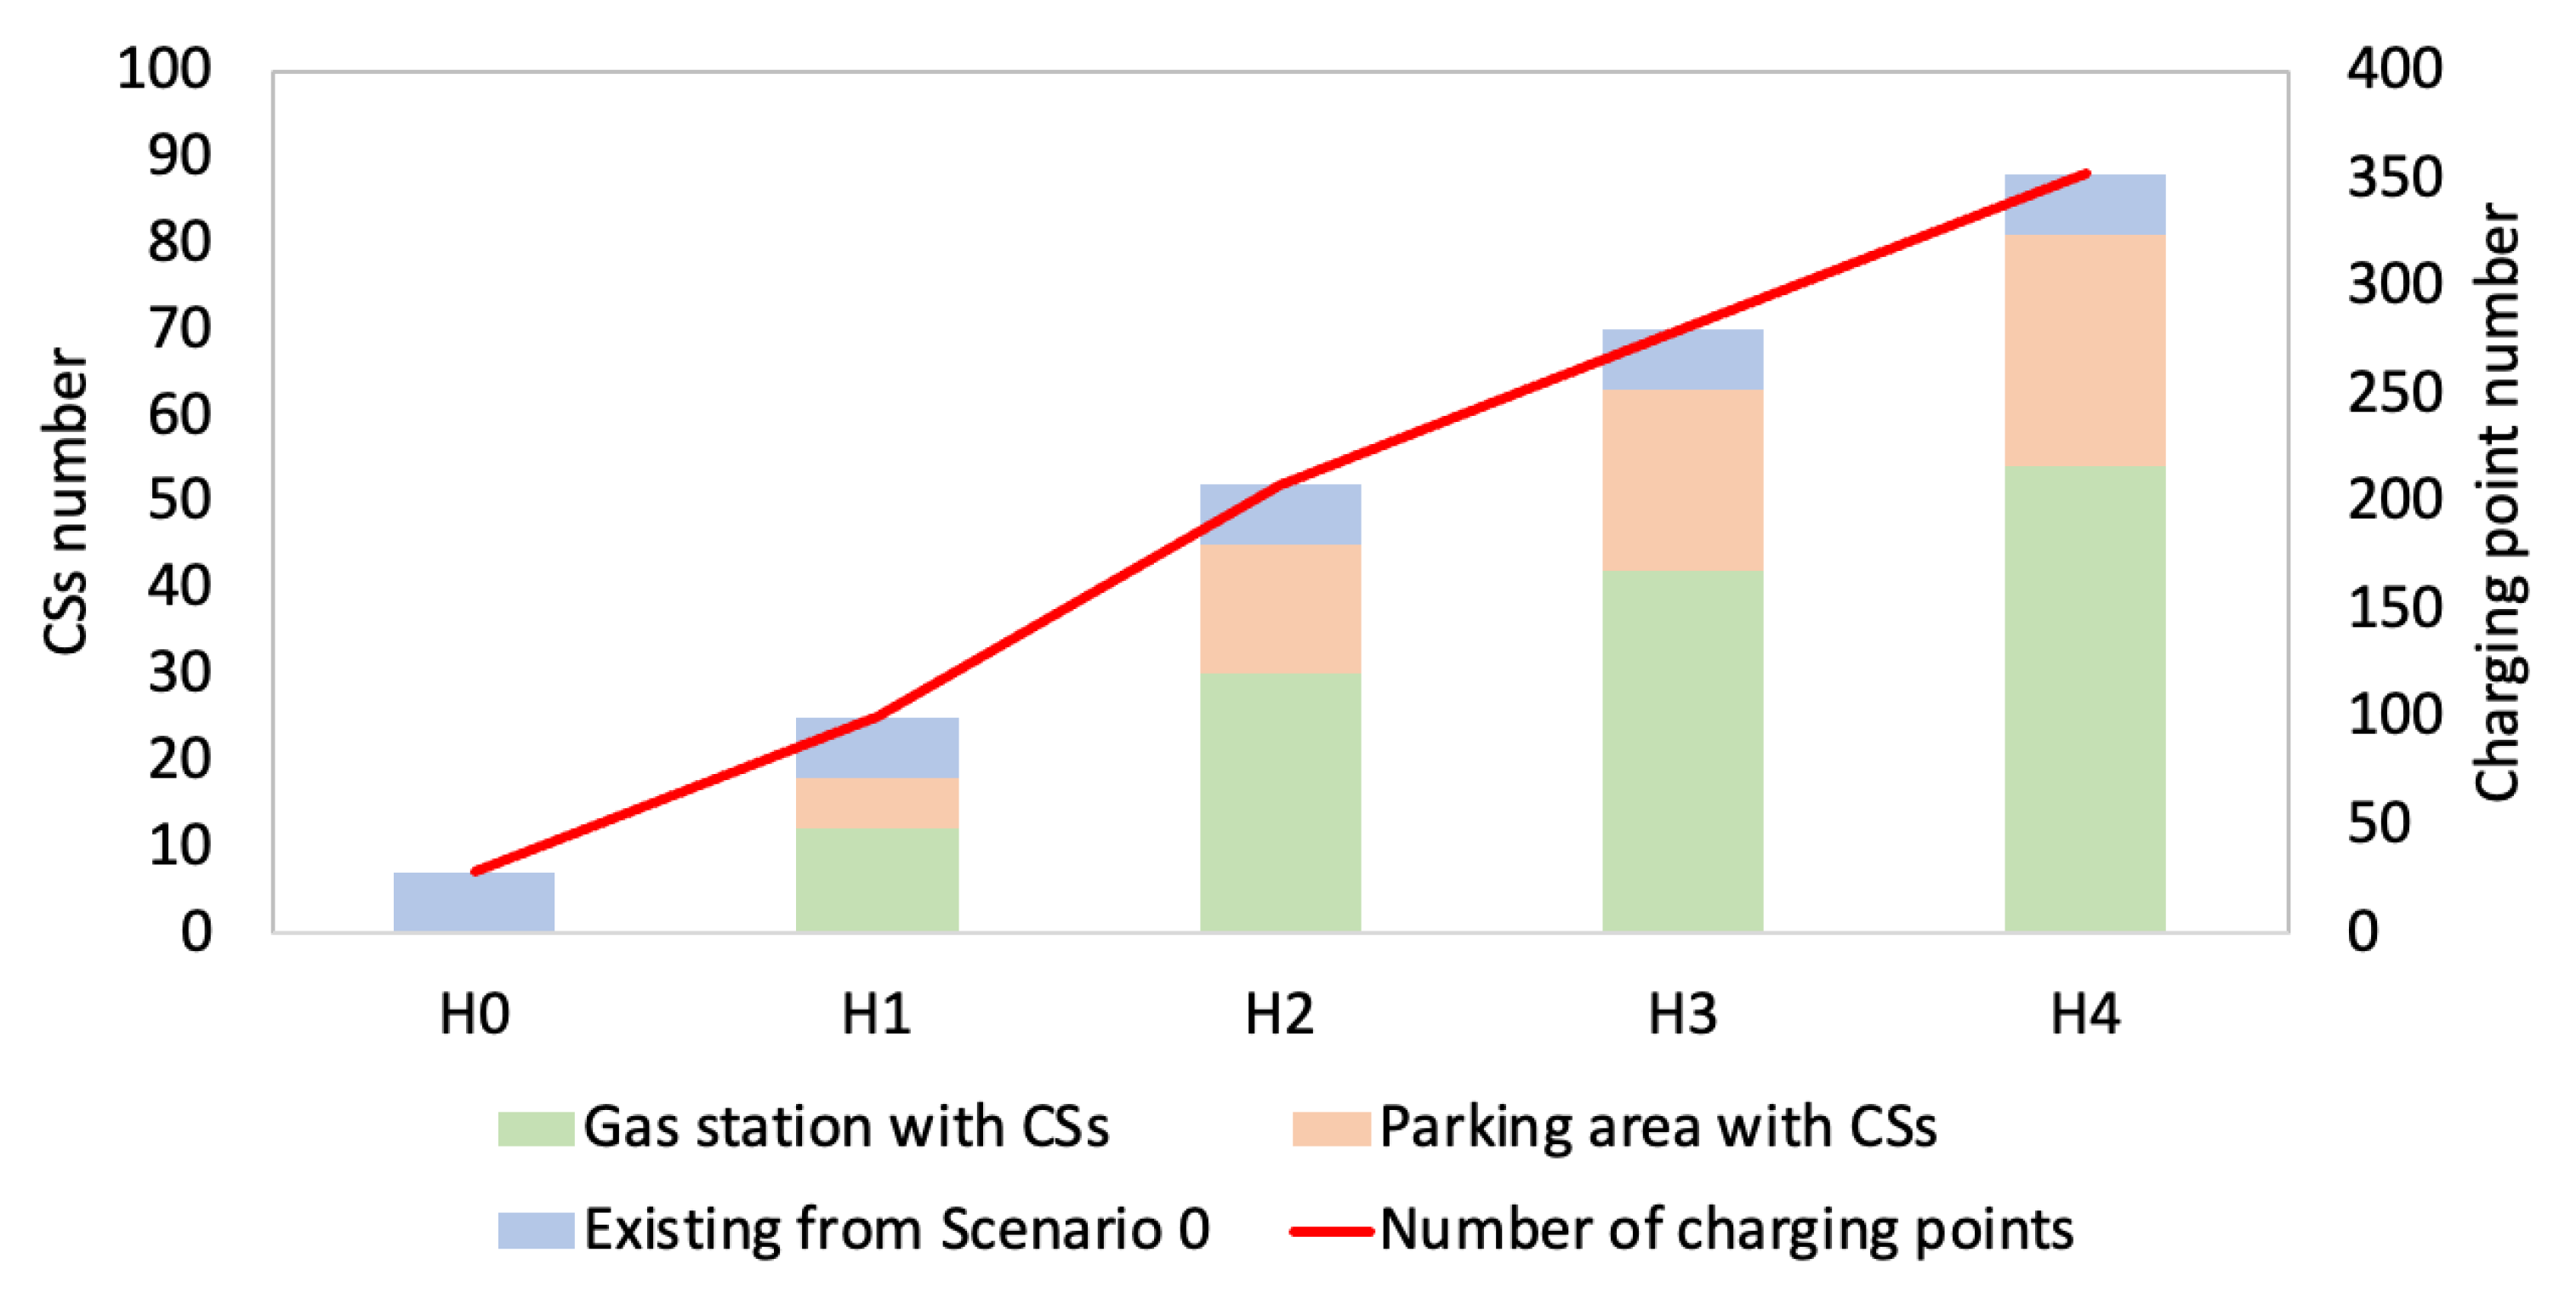
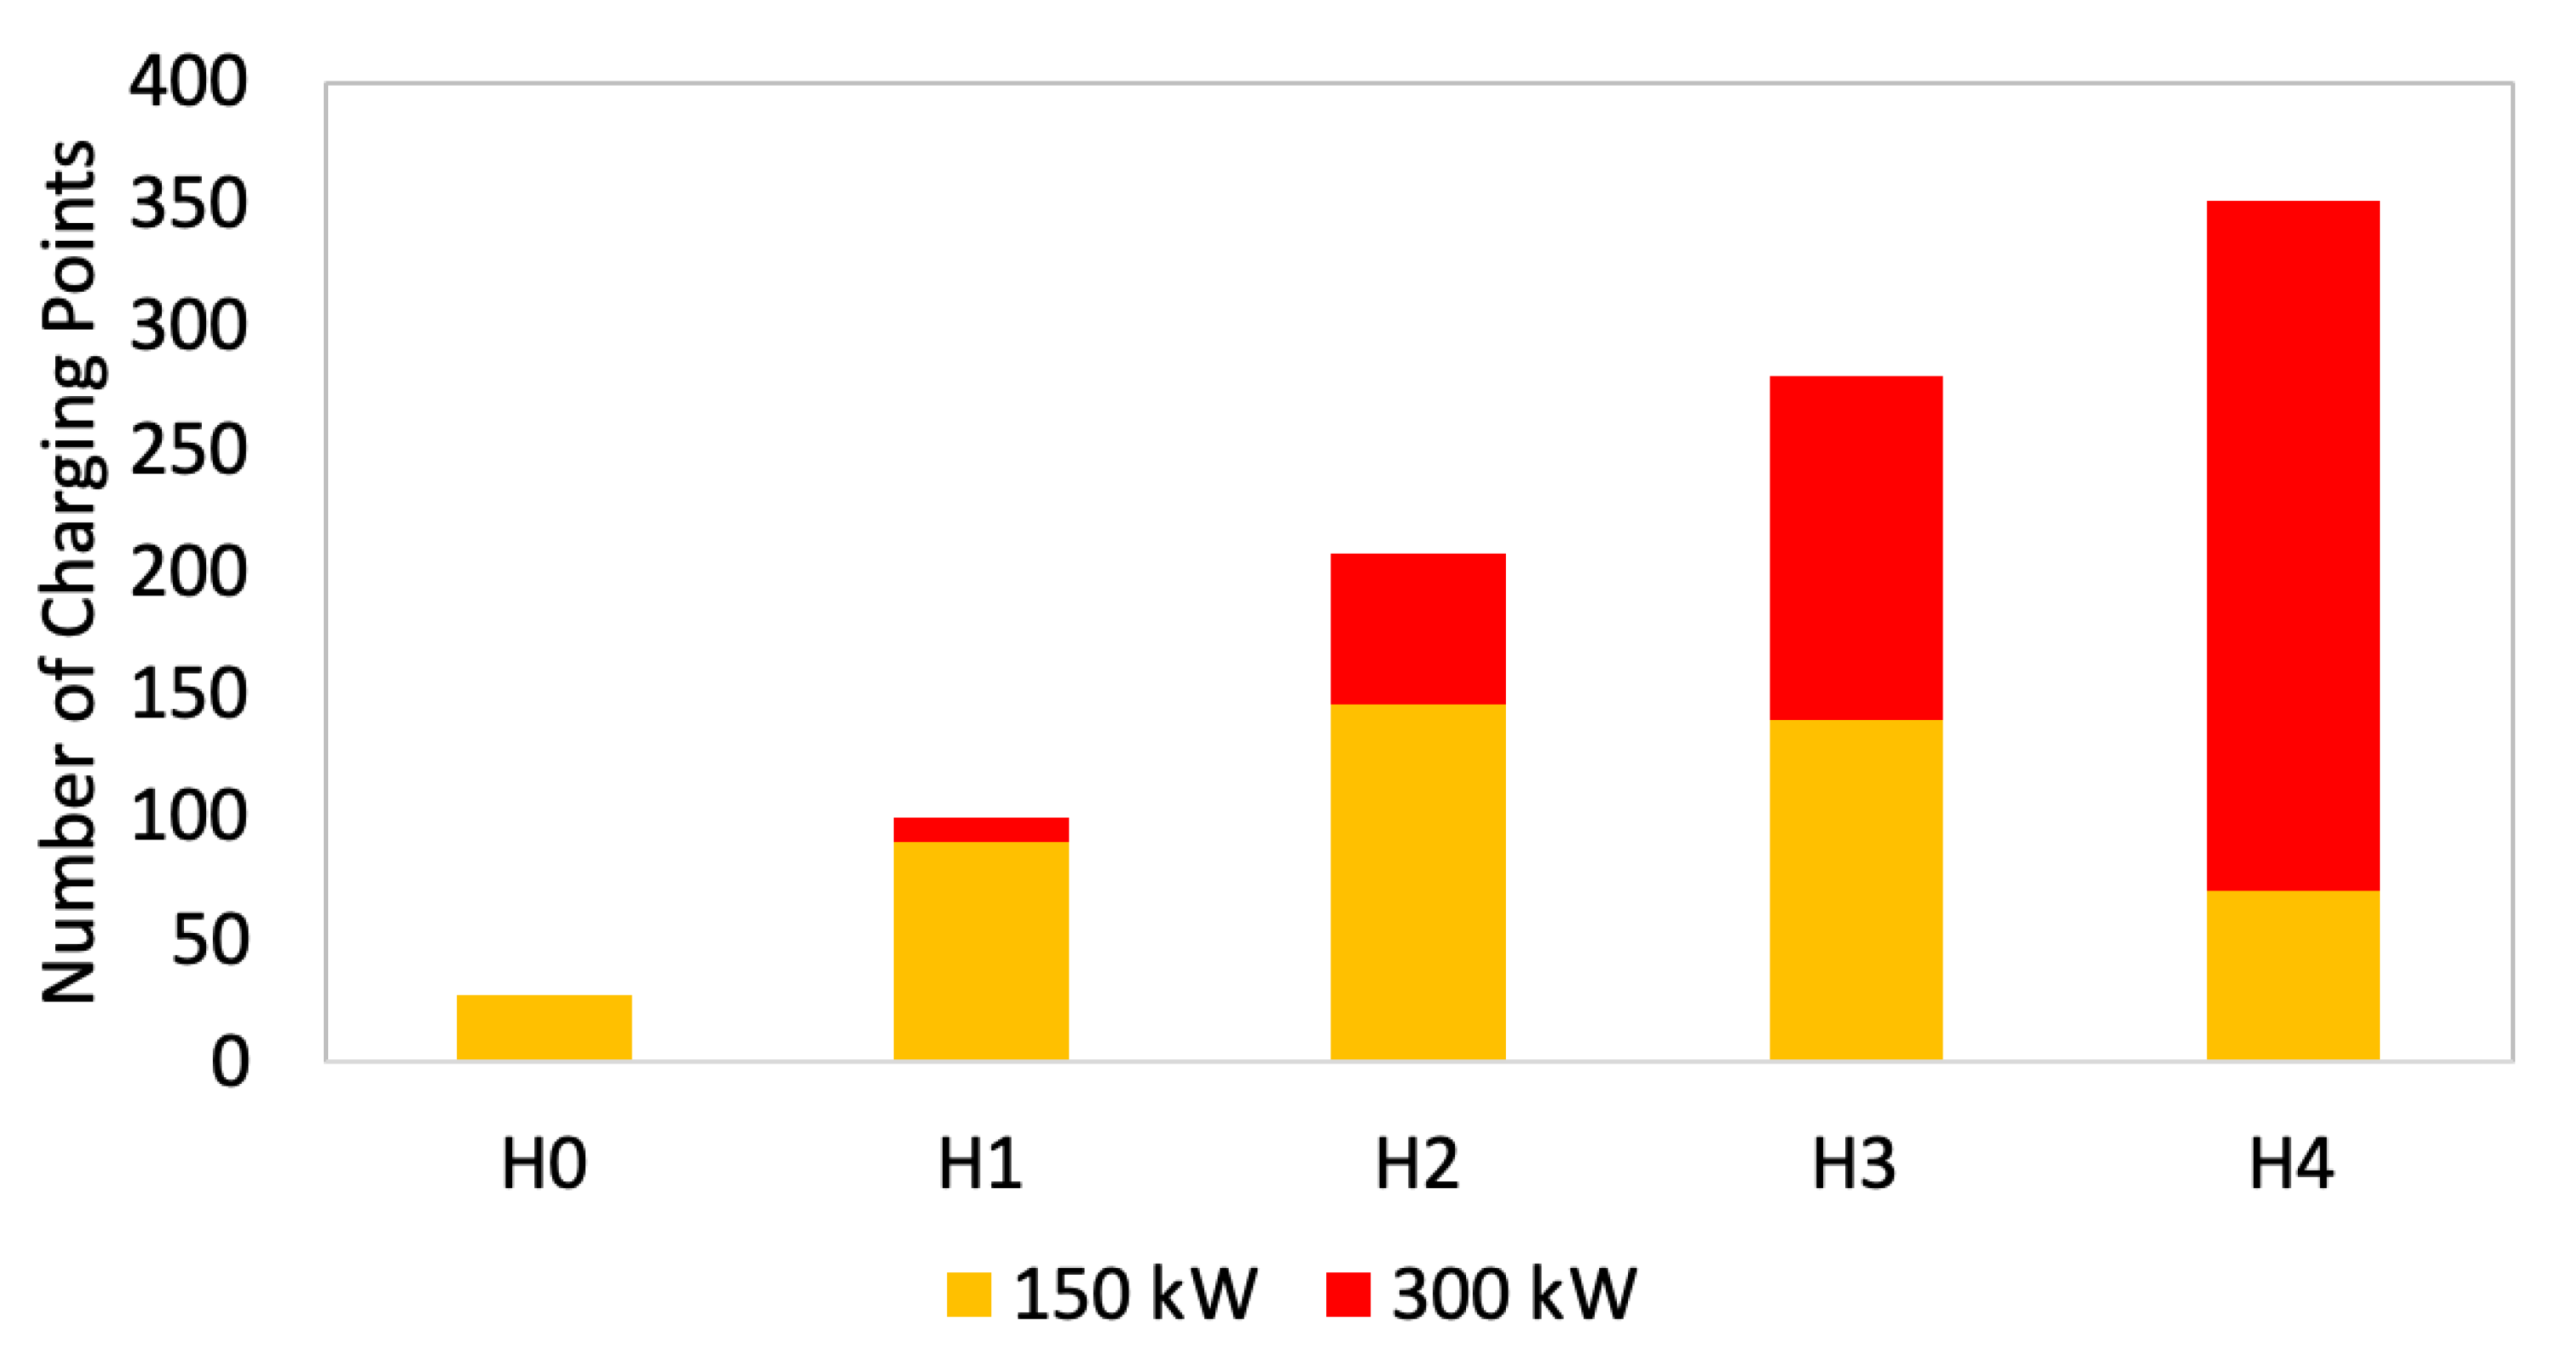
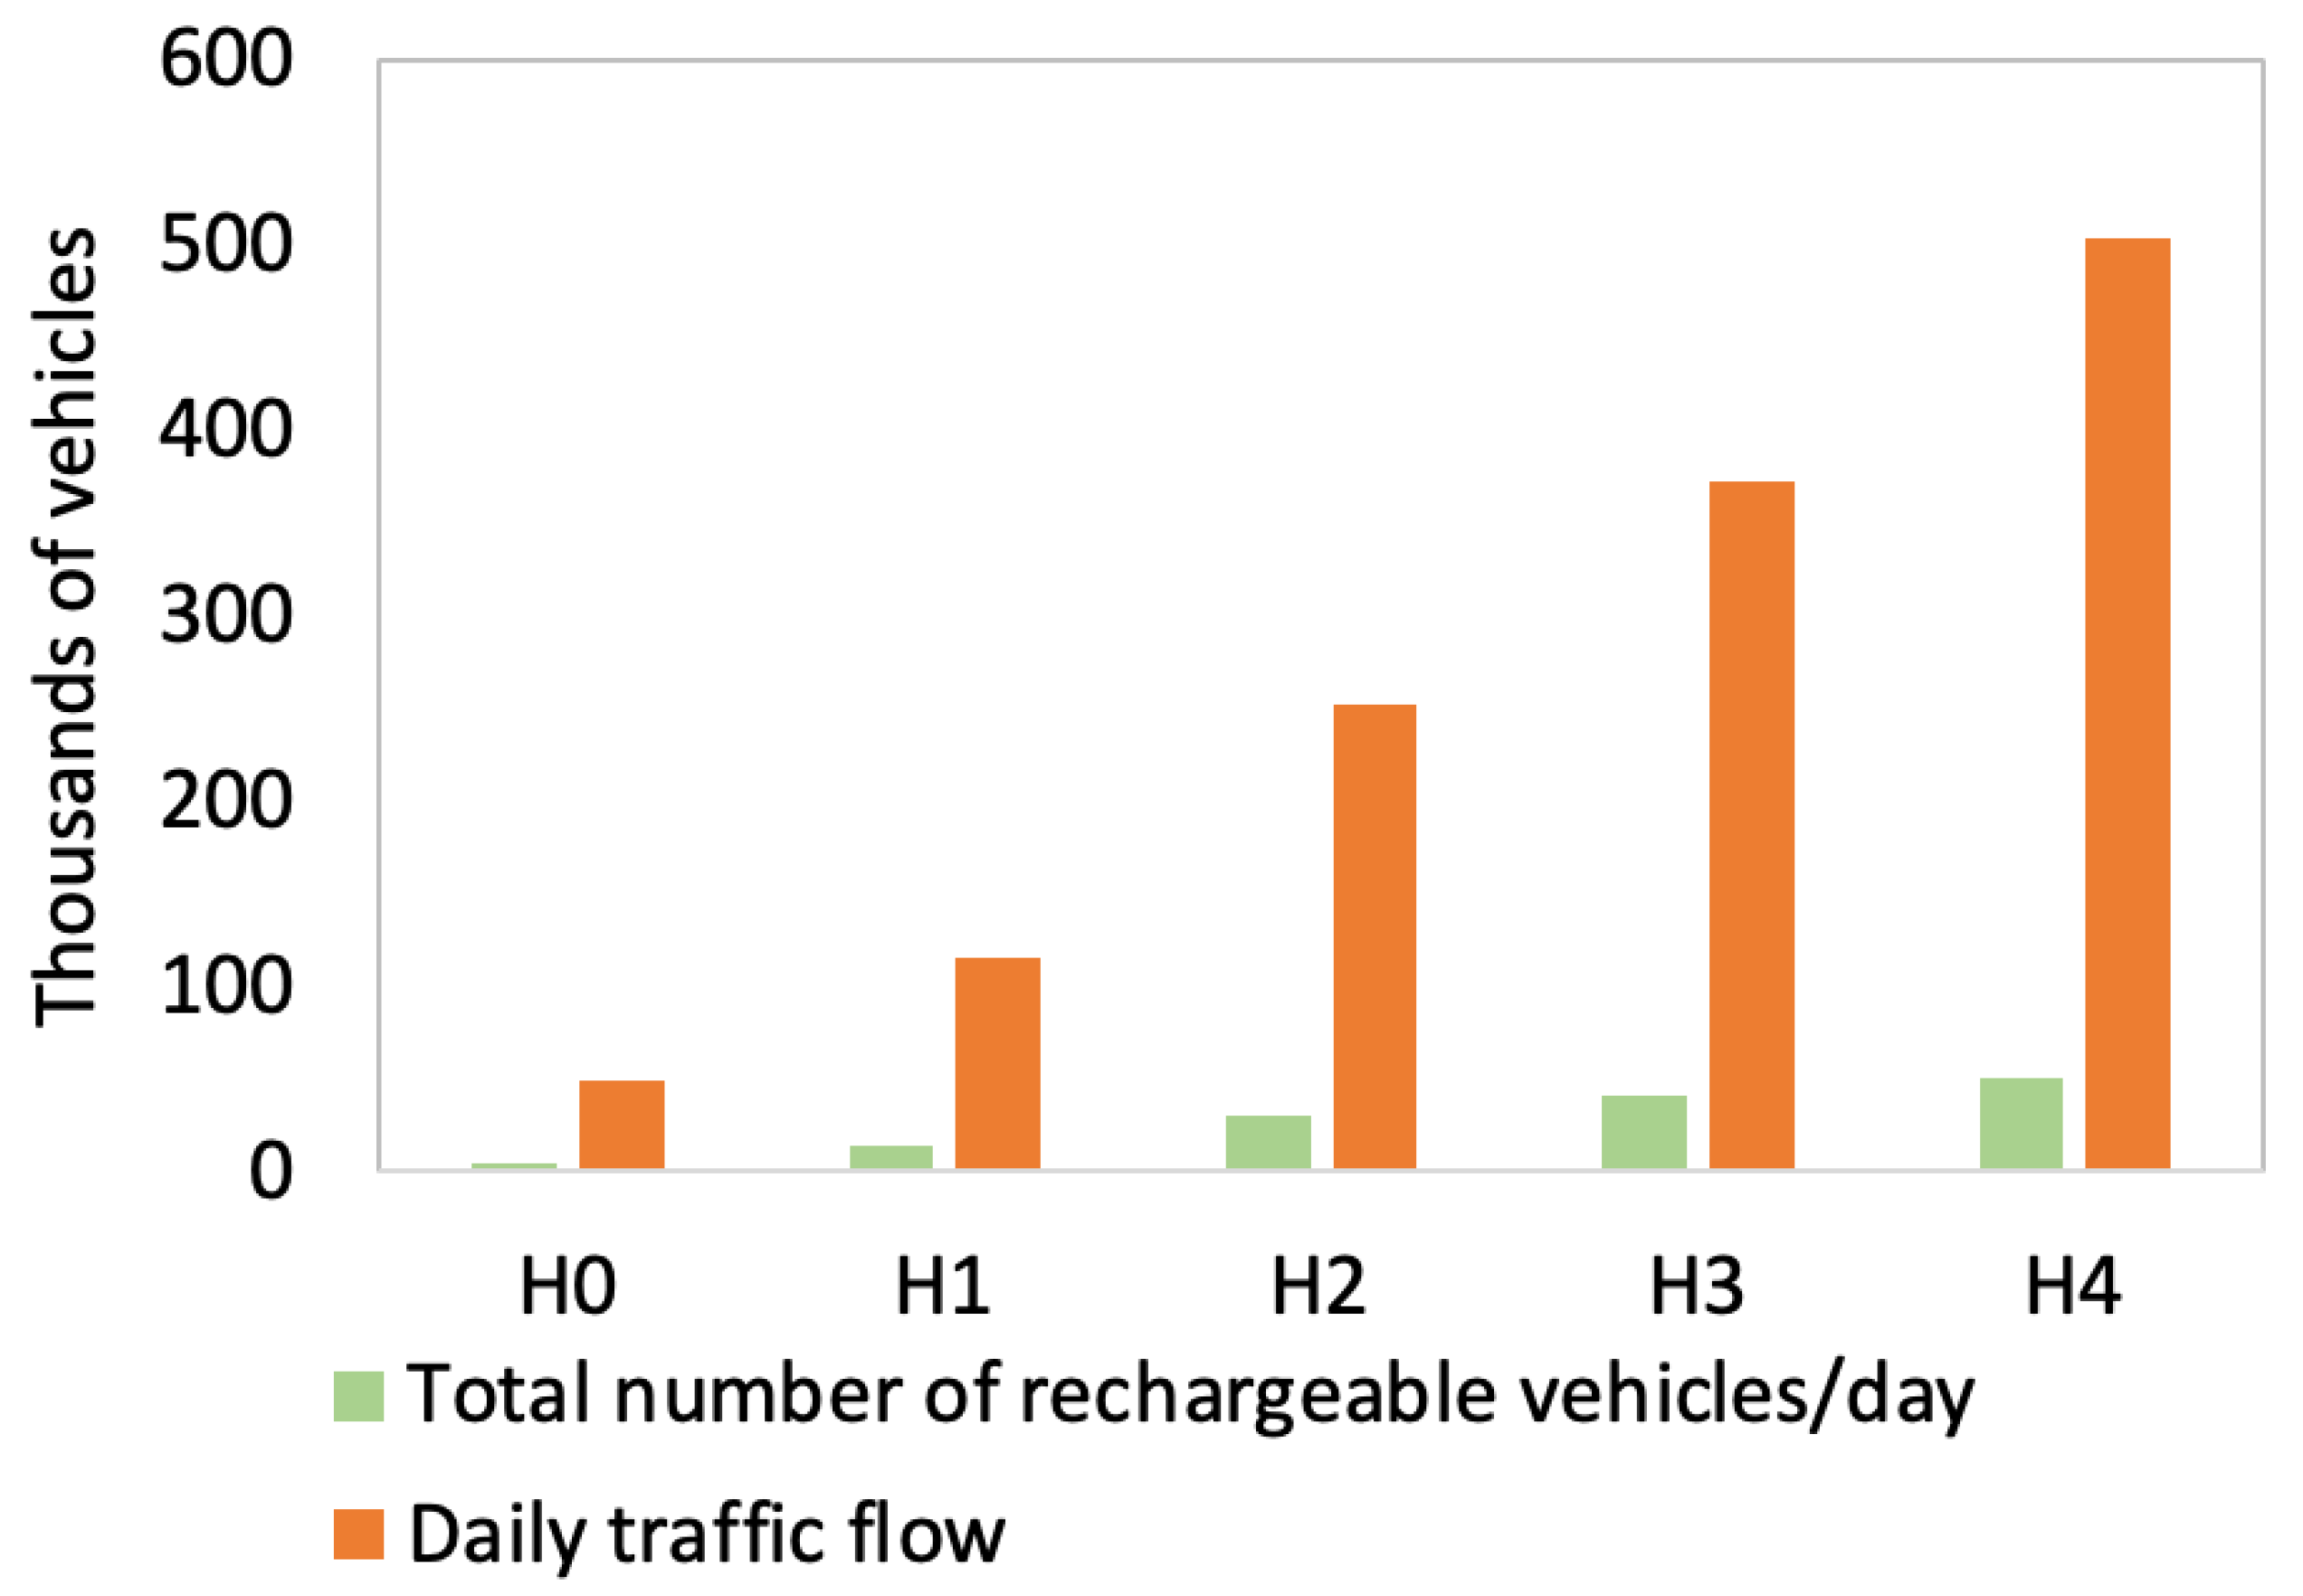
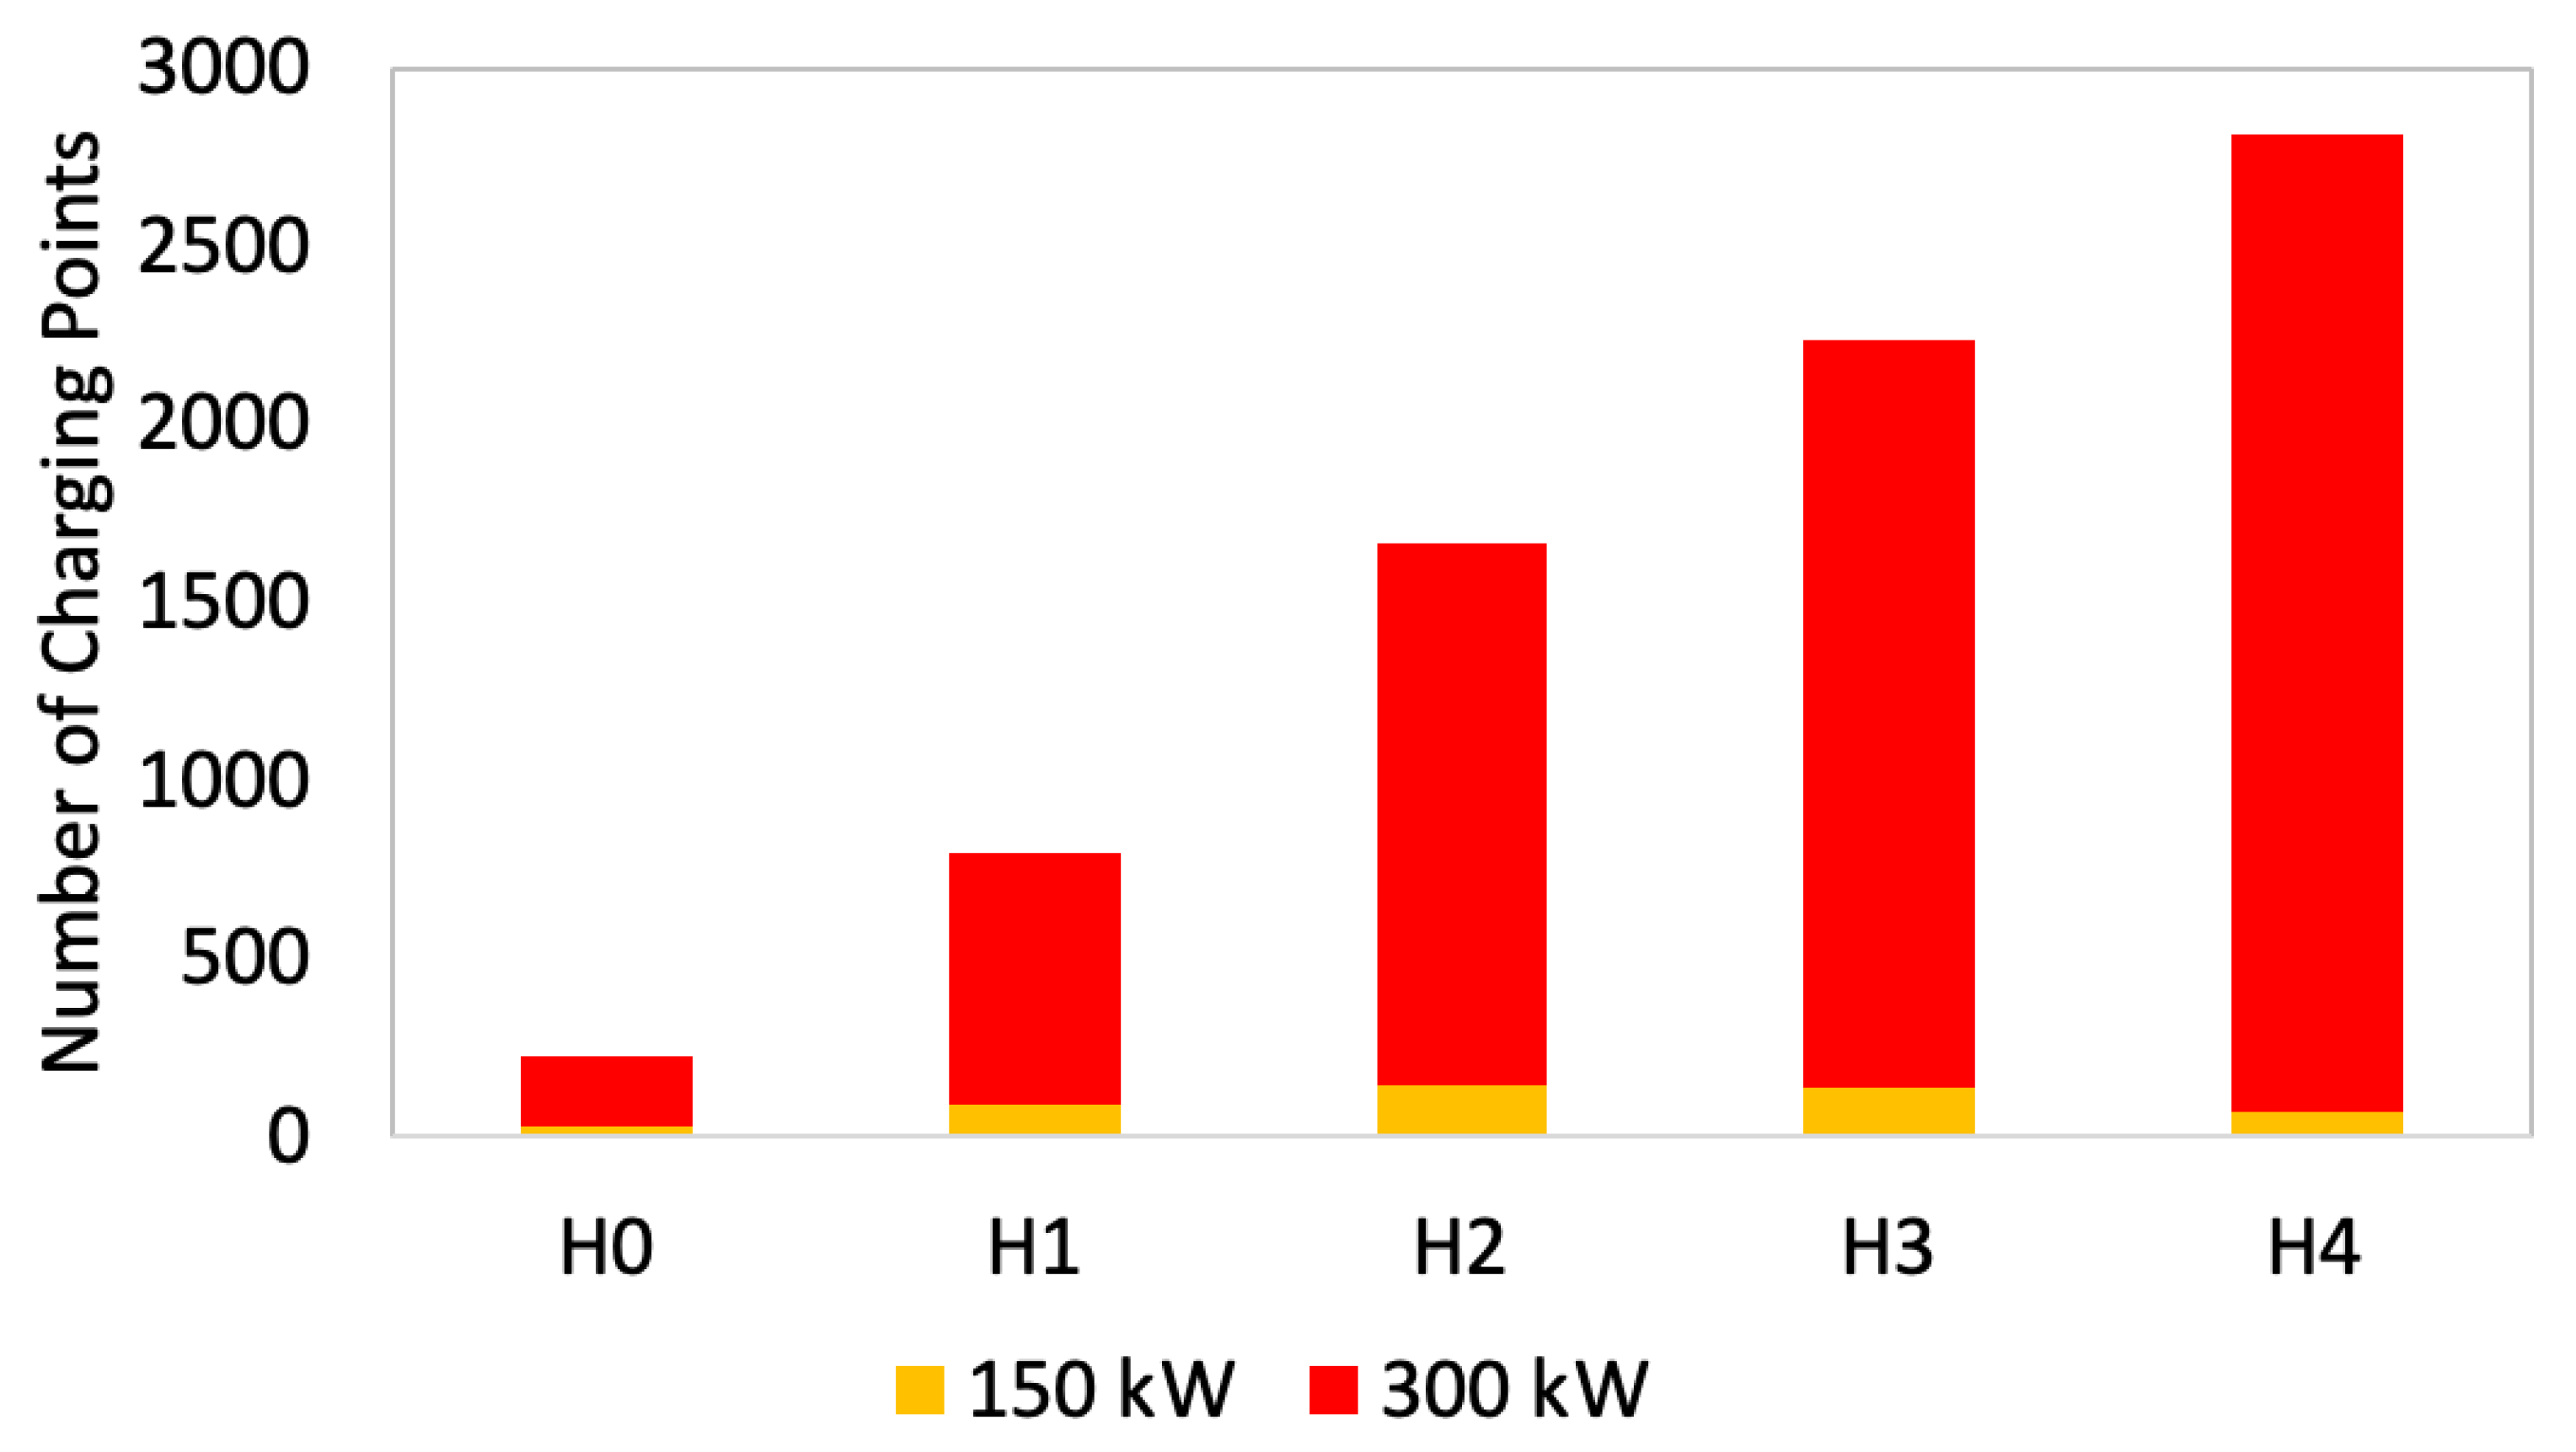
4.3. A1 Motorway Charging Stations’ Current Situation
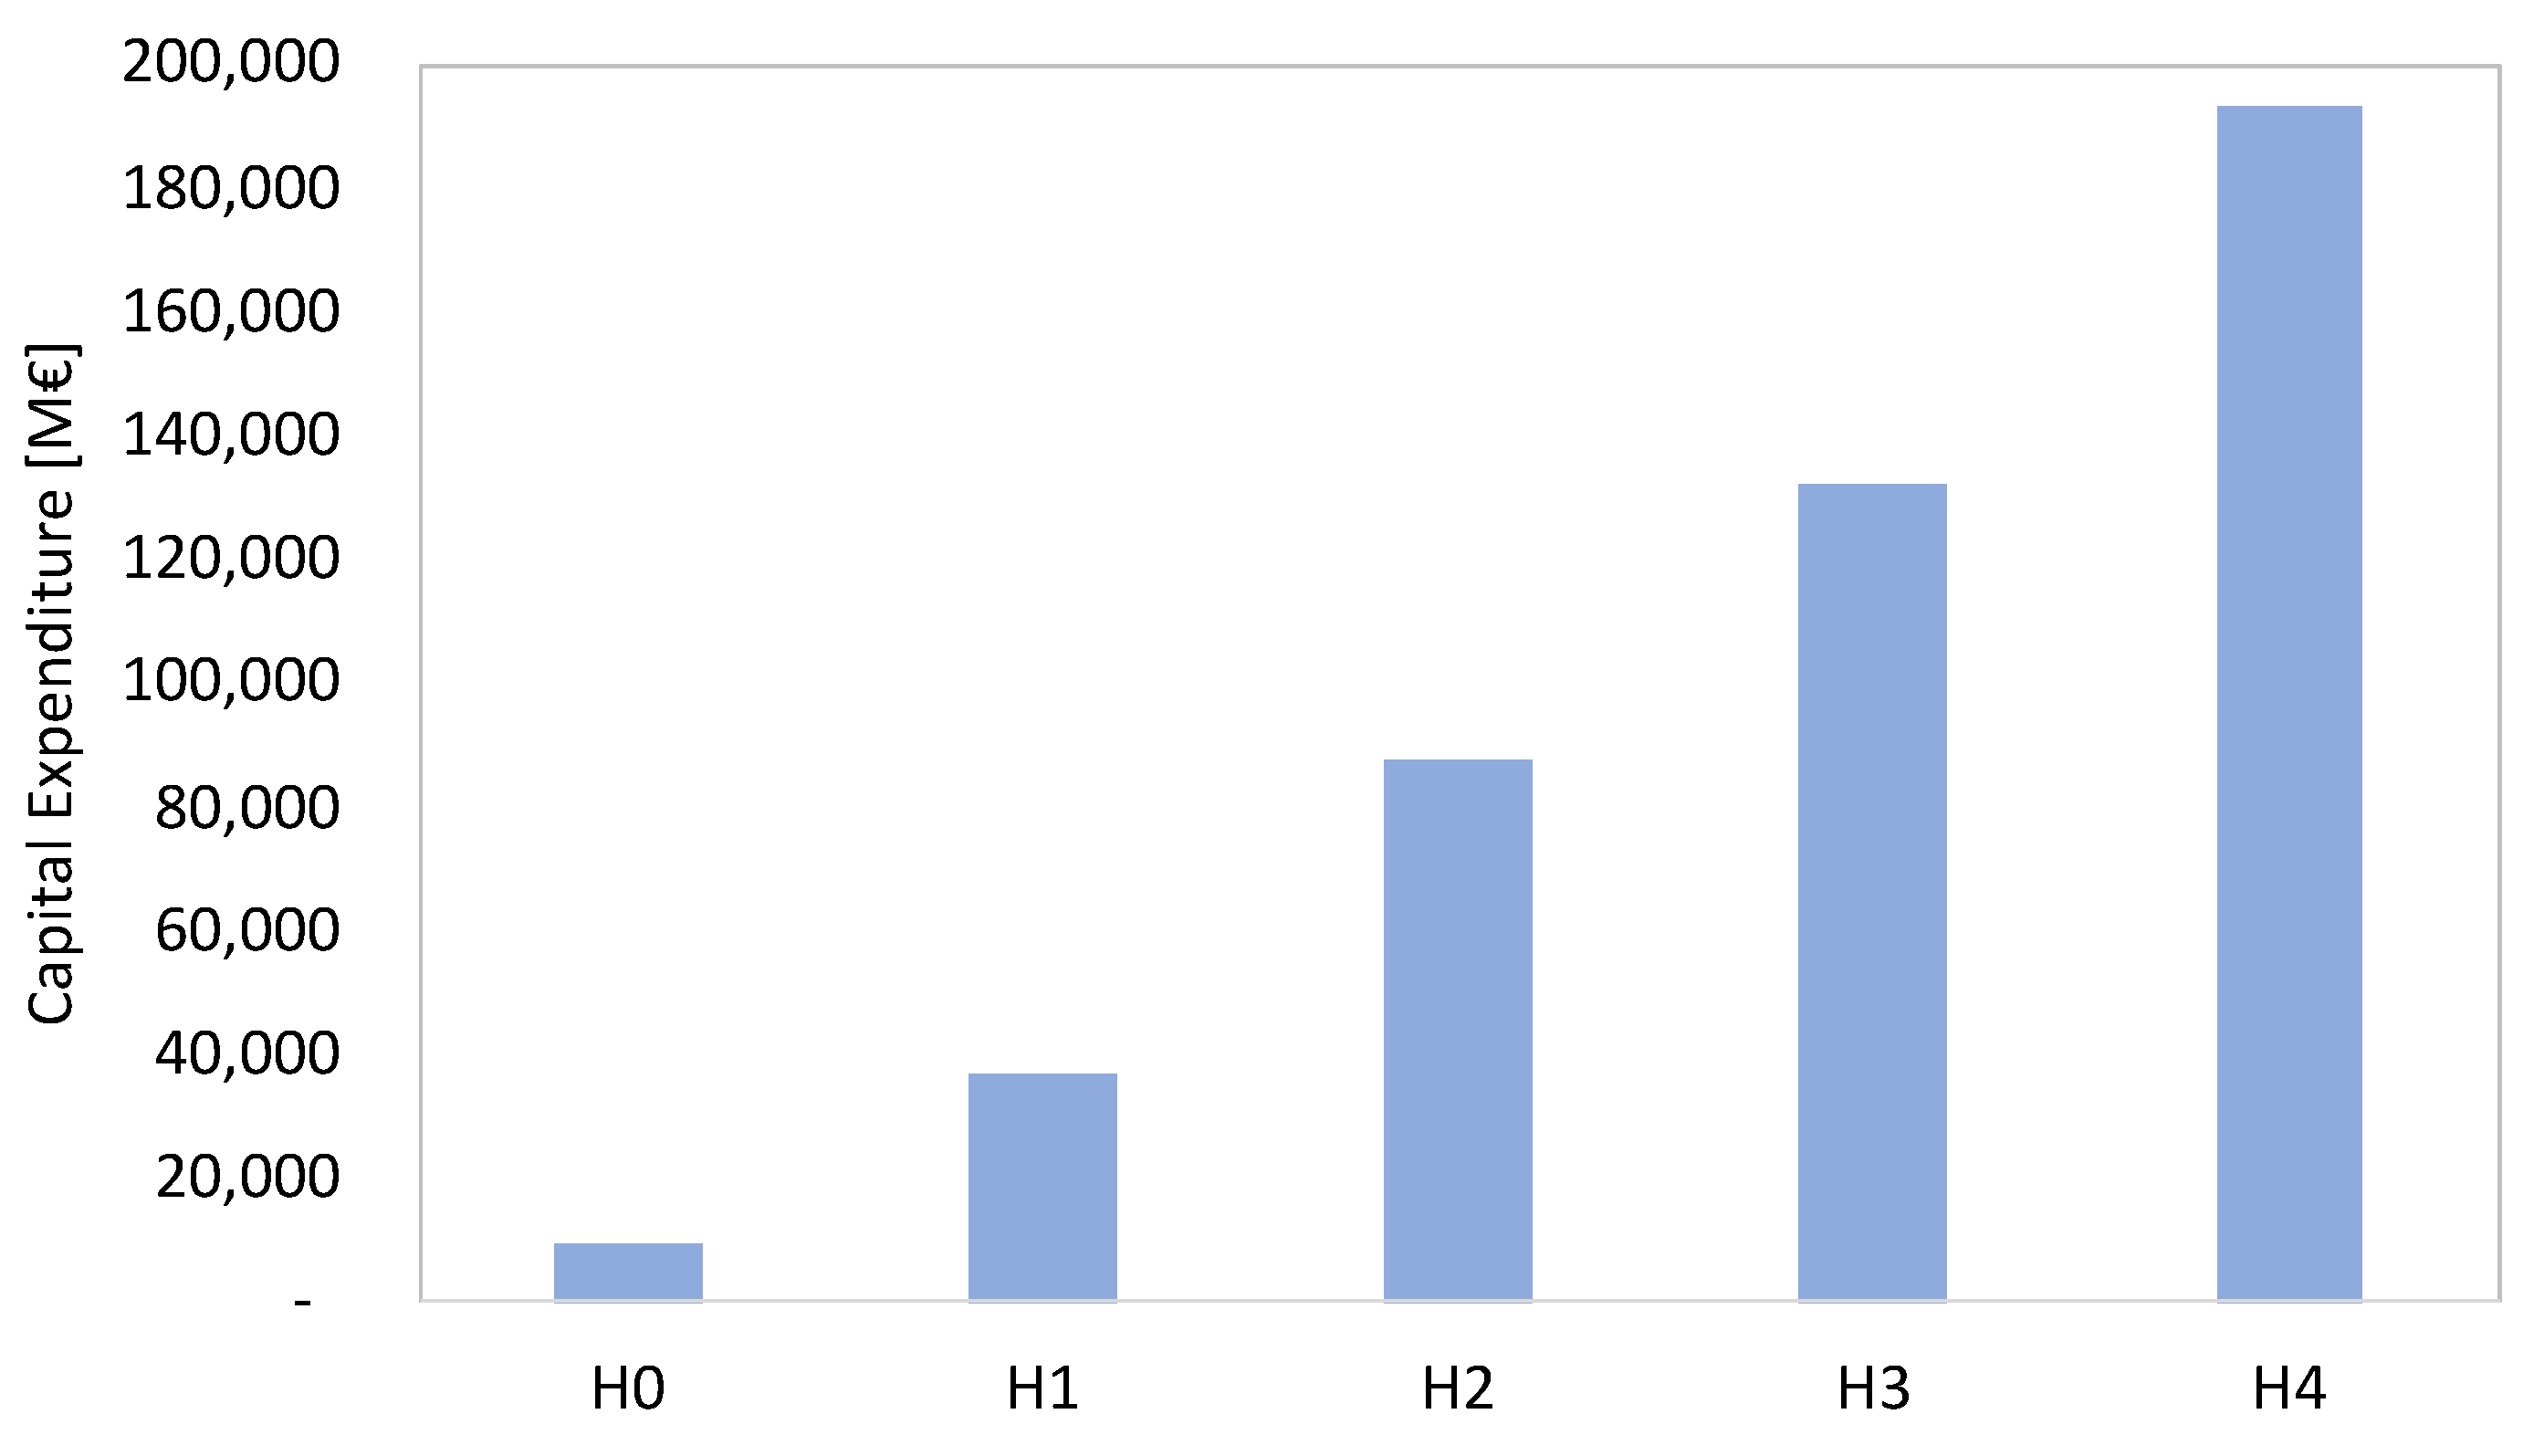
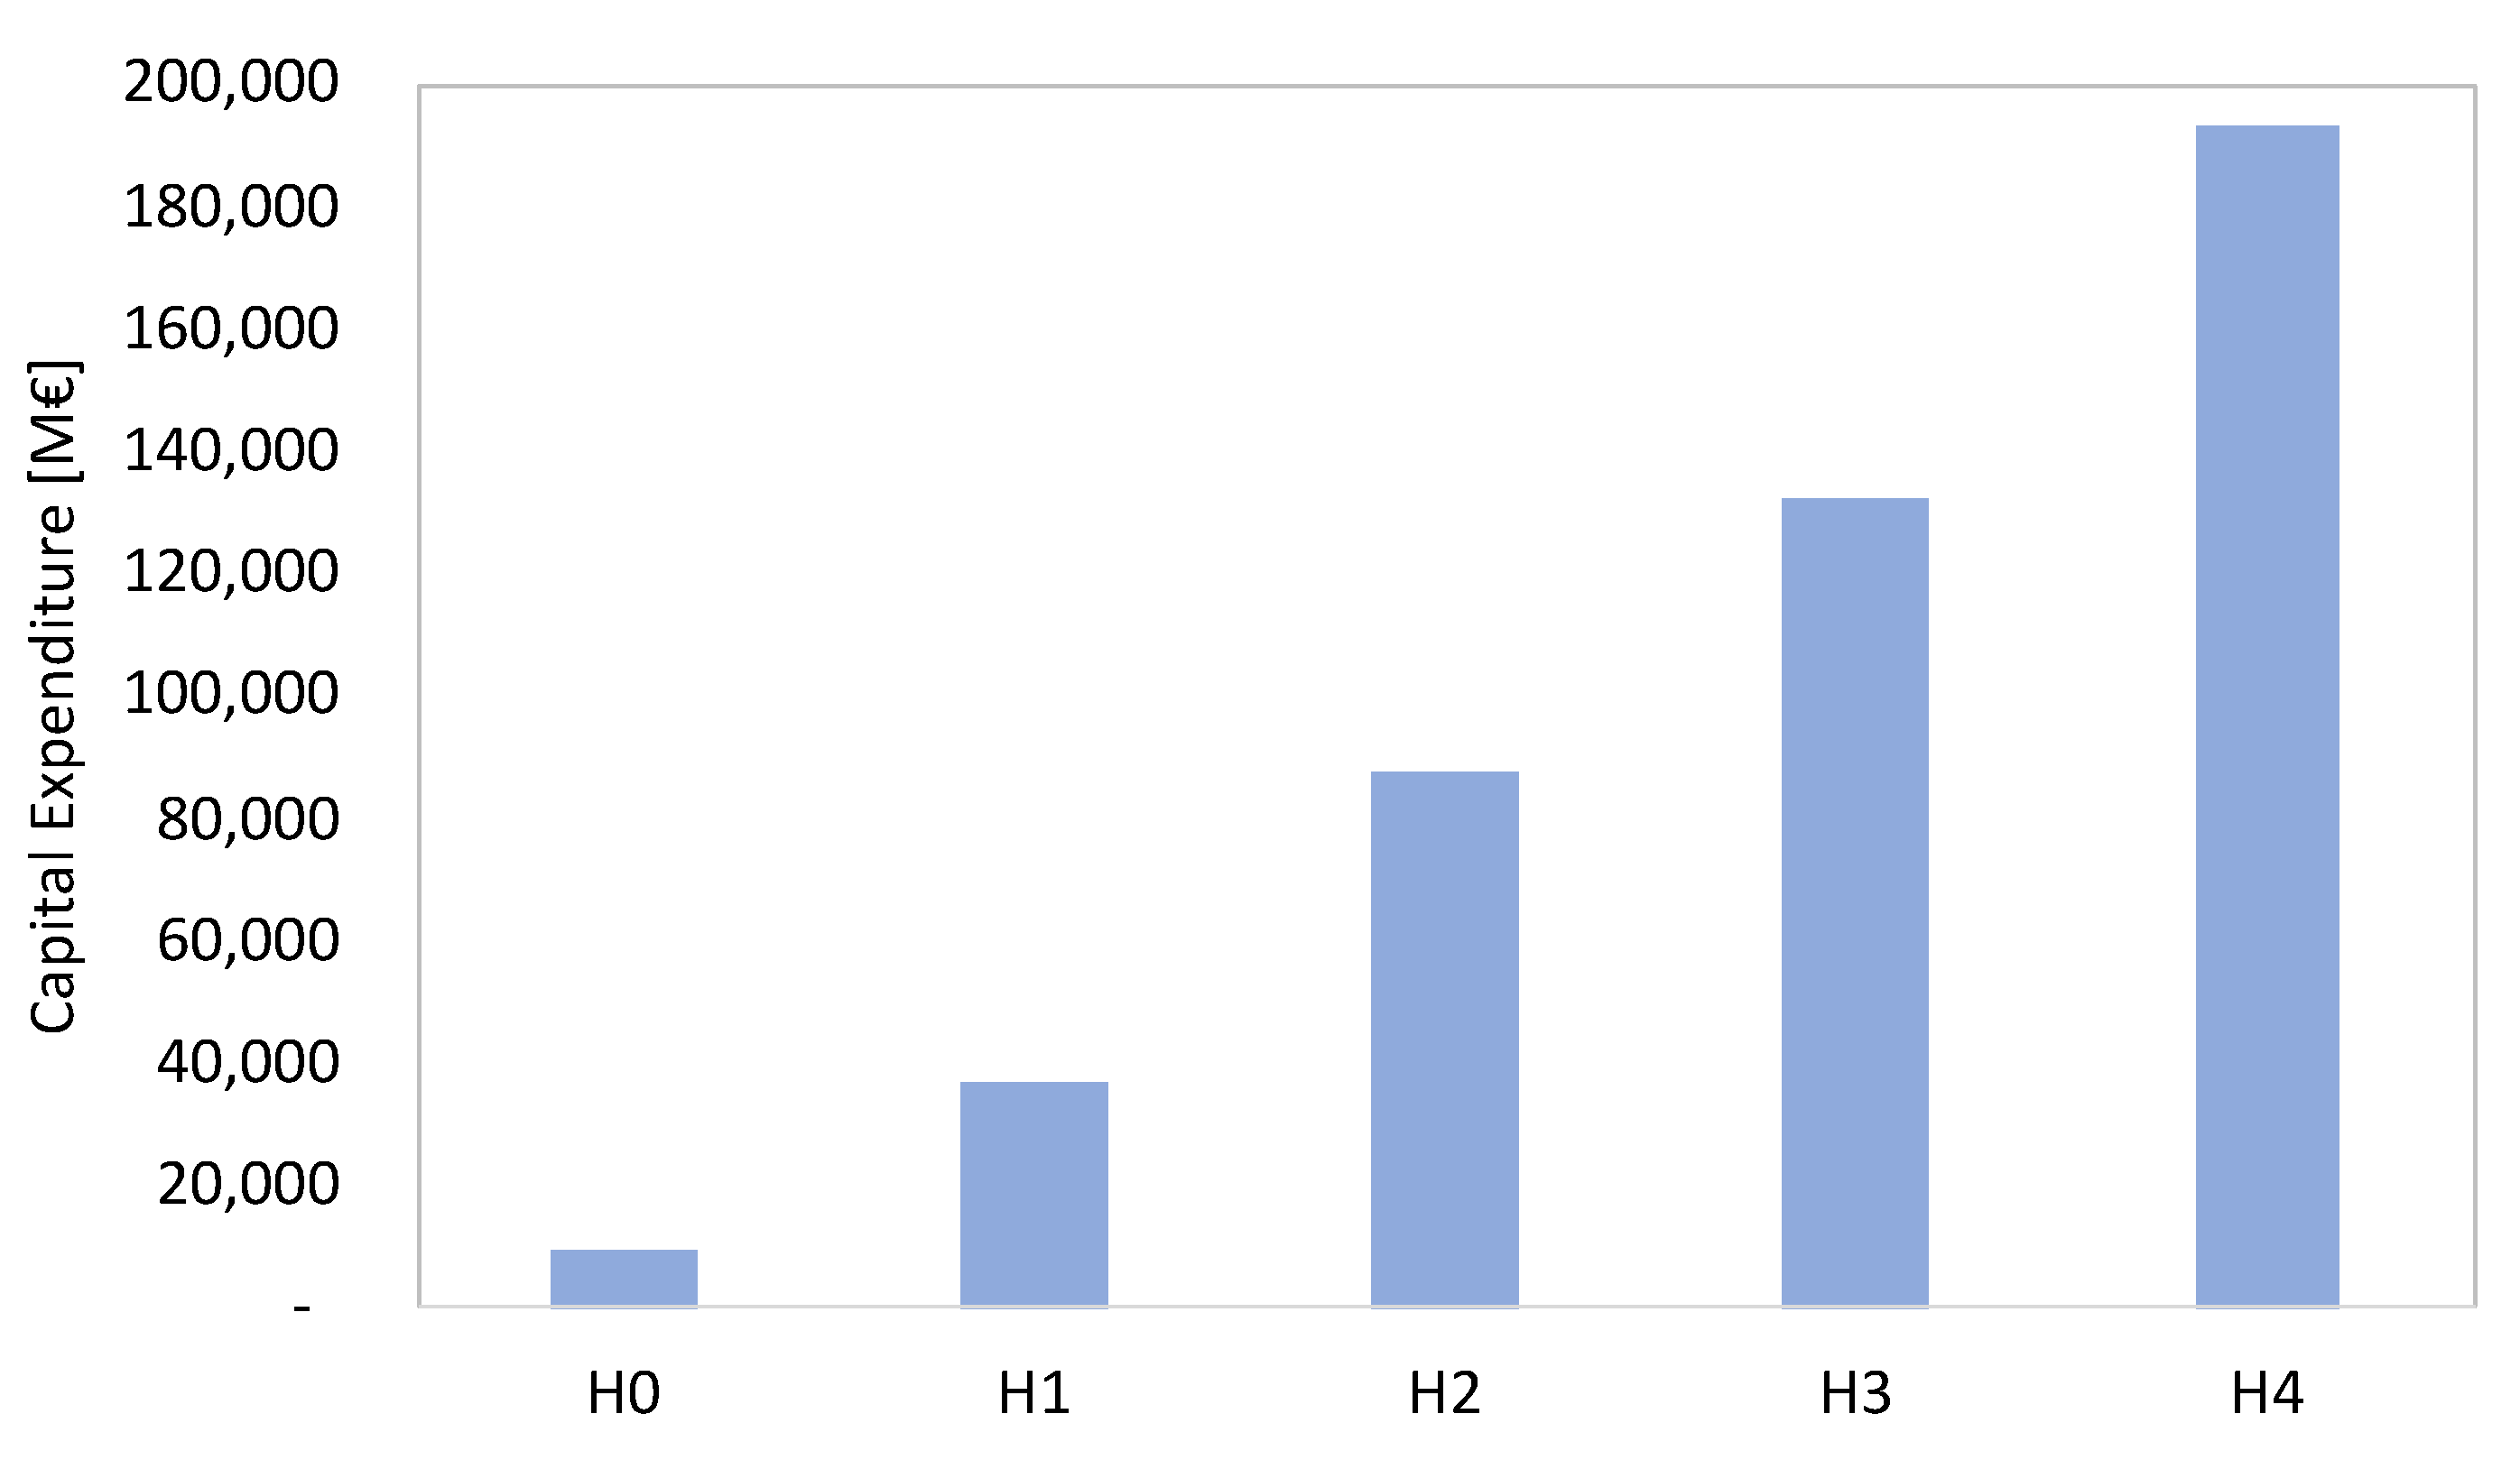
4.4. Cost Estimation Settlement
- Investment costs: equipment and installation costs;
- Operation cost: security, energy consumptions.
- The number of vehicles which use the EV charging station;
- The power output of the charging station;
- The vehicle power acceptance rate;
- The climate;
- The amount of time the vehicles charge.
4.5. Simulation Setup
5. Analysis and Discussion of Results
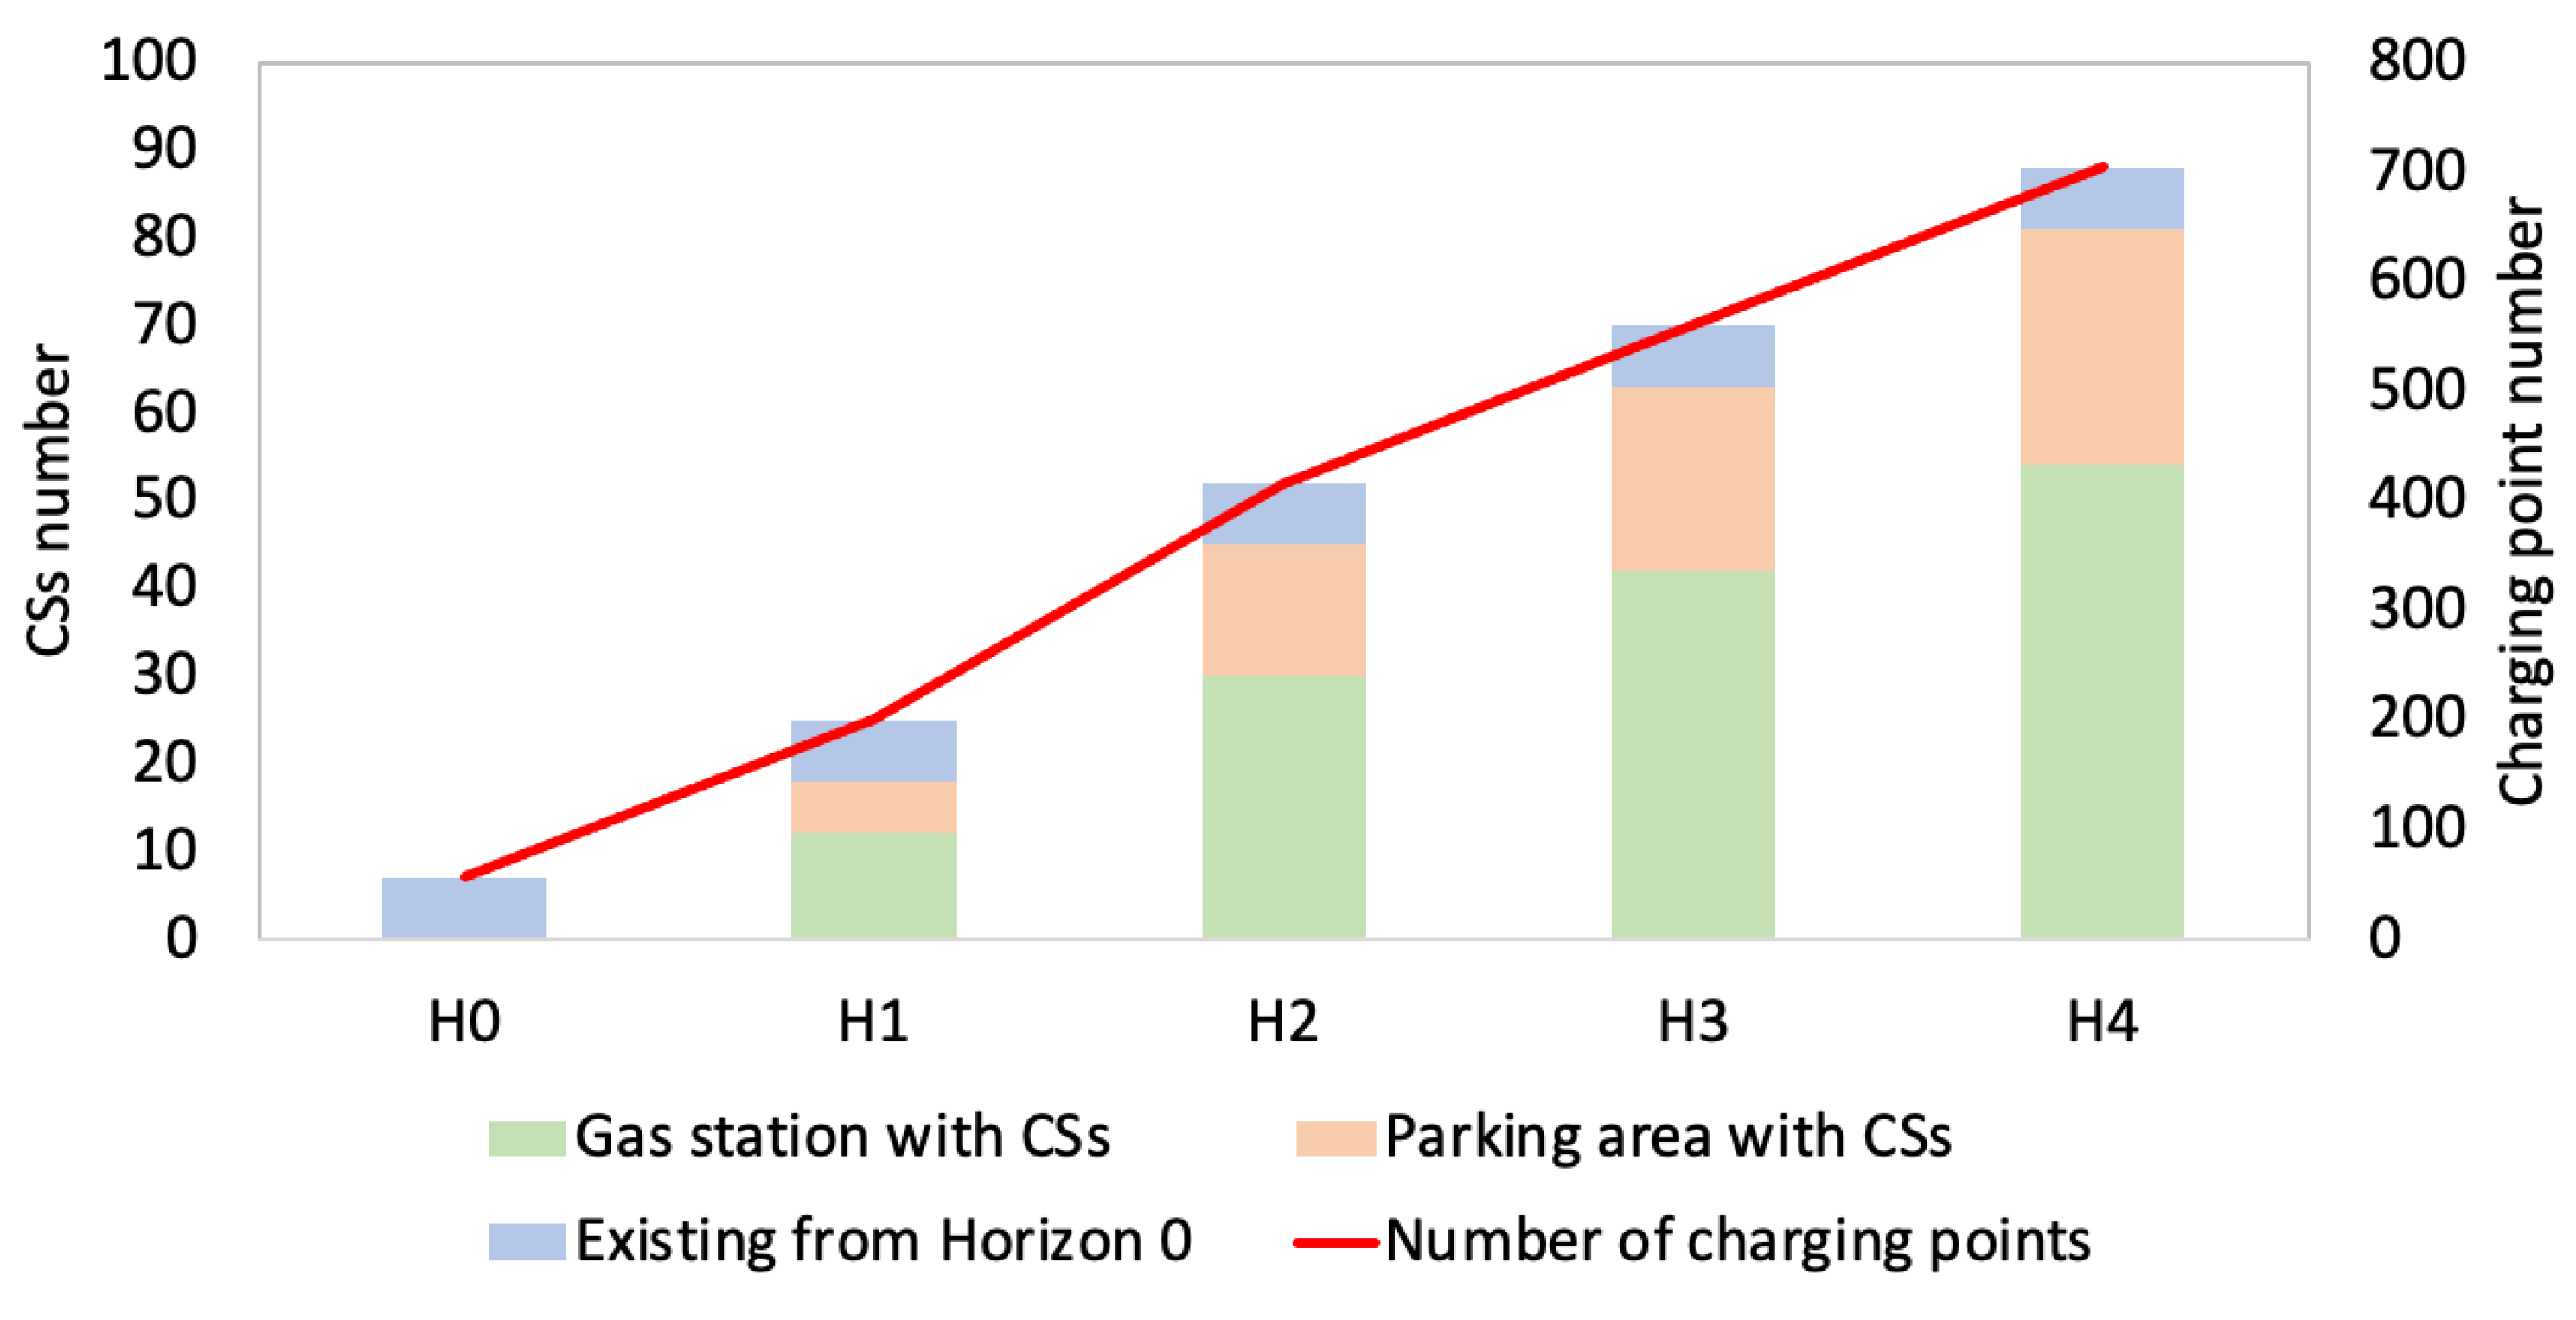
5.1. Scenario 1
5.2. Scenario 2
5.3. Scenario 3
5.4. Scenario 4
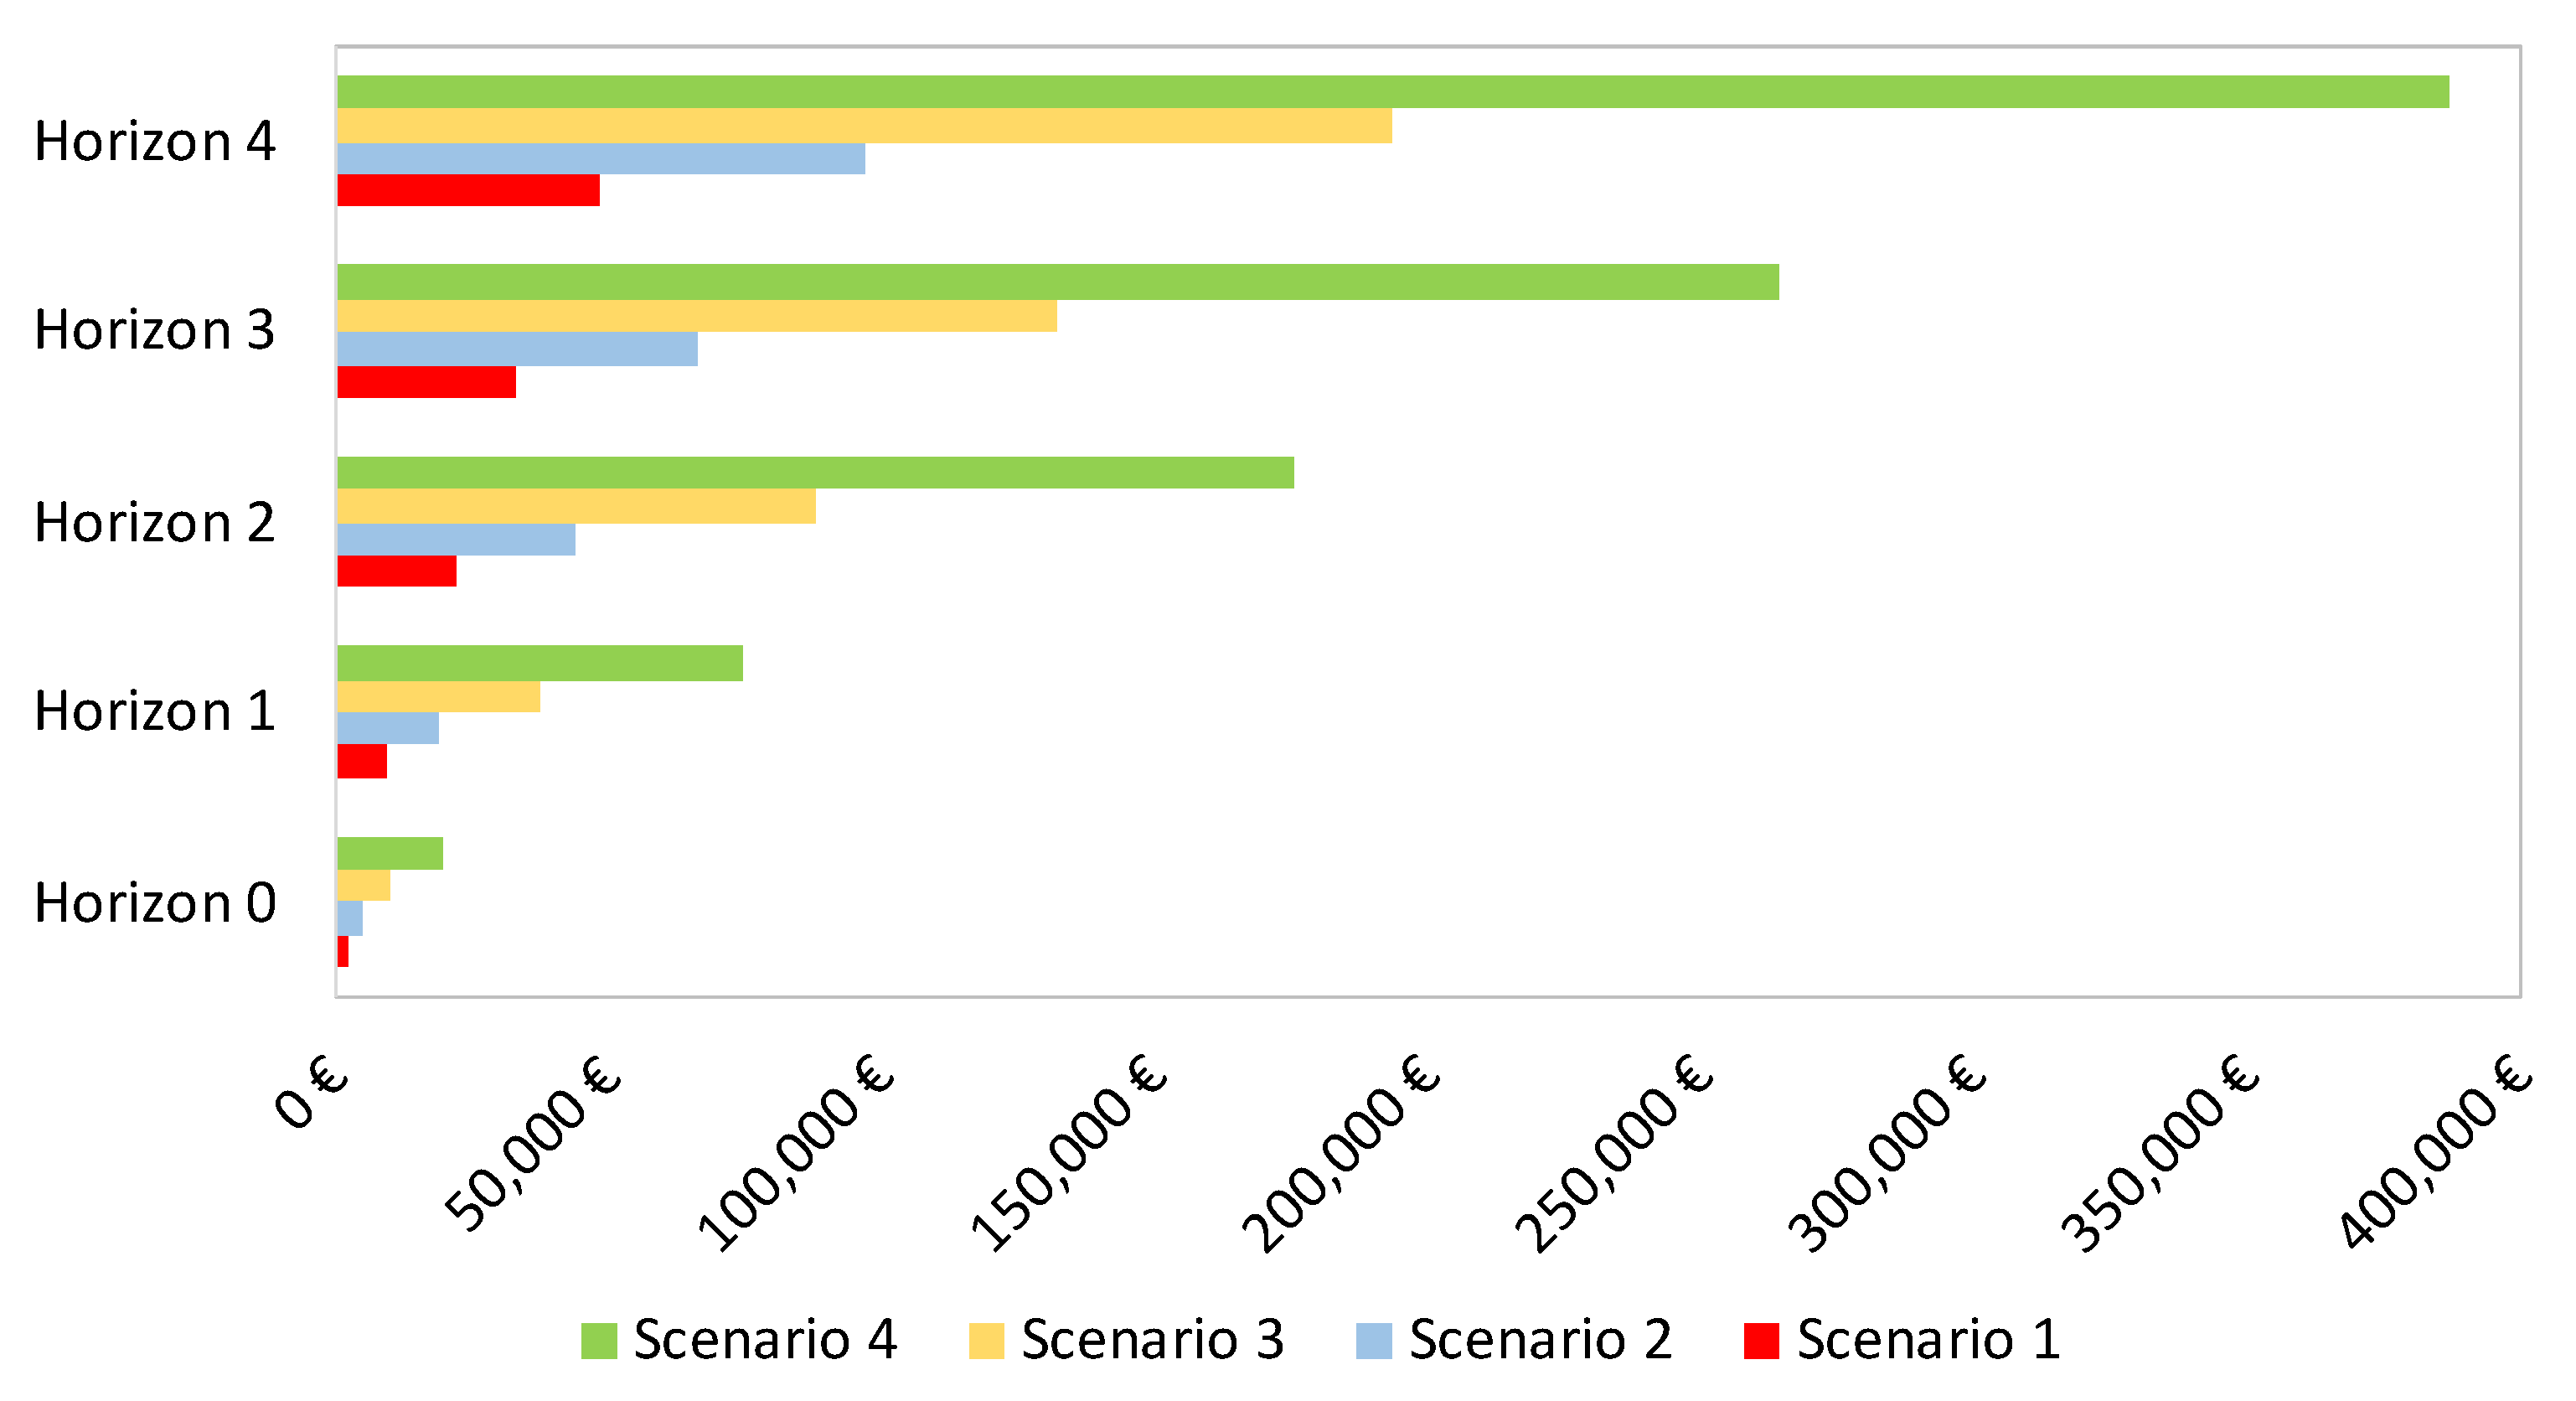
5.5. Discussion
- Scenario 1: four CSs per spot;
- Scenario 2: eight CSs per spot;
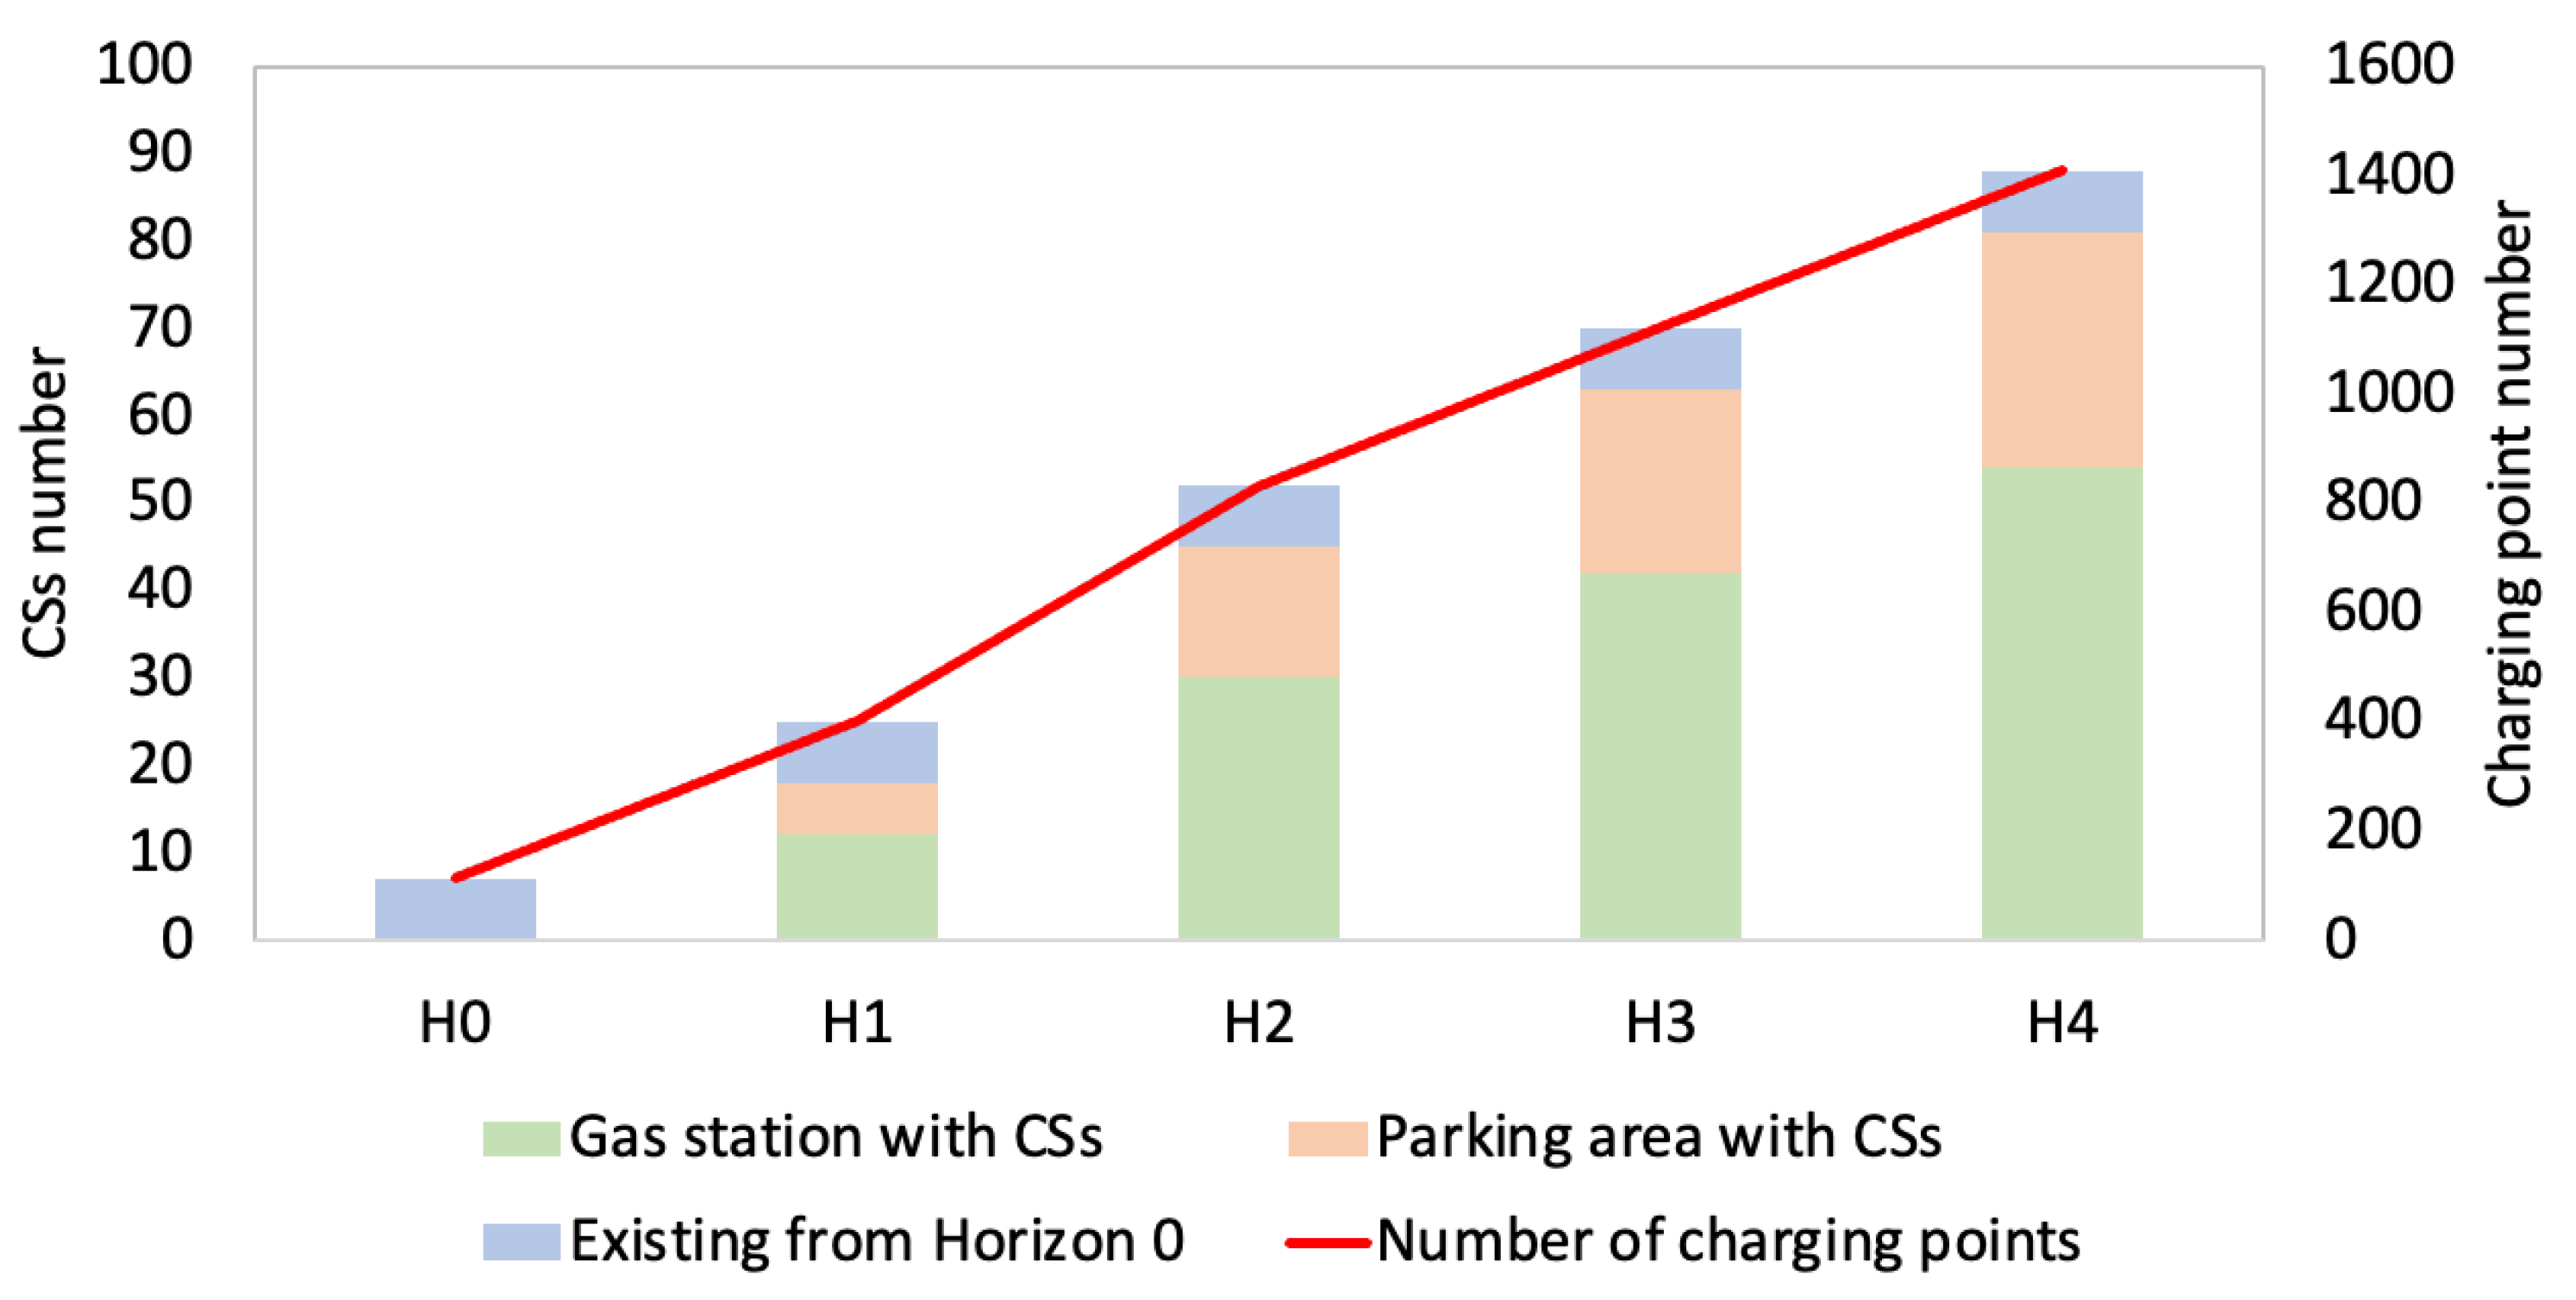
- Scenario 3: 16 CSs per spot;
- Scenario 4: 32 CSs per spot.
6. Conclusions
Author Contributions
Funding
Conflicts of Interest
References
- International Energy Agency (IEA). World Energy Outlook 2022. Available online: https://www.iea.org/t&c/ (accessed on 23 October 2023).
- Arora, N.K.; Mishra, I. COP26: More challenges than achievements. Environ. Sustain. 2021, 4, 585–588. [Google Scholar] [CrossRef]
- European Commission. Communication from the Commission, “The European Green Deal”, Brussels 11 December 2019. EUR-Lex–52019DC0640–EN–EUR-Lex. Available online: https://eur-lex.europa.eu/resource.html?uri=cellar:b828d165-1c22-11ea-8c1f-01aa75ed71a1.0002.02/DOC_1&format=PDF (accessed on 23 October 2023).
- European Commission. Communication from the Commission to the Aprile n Parliament, the Council, the Aprile n Economic and Social Committee and the Committee of the Regions, “Sustainable and Smart Mobility Strategy—Putting European Transport on Track for the Future”, Brussels 9 December 2020. Available online: https://transport.ec.europa.eu/system/files/2021-04/2021-mobility-strategy-and-action-plan.pdf (accessed on 23 October 2023).
- IEA. Transport, IEA, Paris. 2022. Available online: https://www.iea.org/reports/transport (accessed on 23 October 2023).
- Peyravi, B.; Peleckienė, V.; Vaičiūtė, K. Research on the Impact of Motorization Rate and Technological Development on Climate Change in Lithuania in the Context of the European Green Deal. Sustainability 2022, 14, 11610. [Google Scholar] [CrossRef]
- Stefaniec, A.; Hosseini, K.; Assani, S.; Hosseini, S.M.; Li, Y. Social sustainability of regional transportation: An assessment framework with application to EU road transport. Socio-Econ. Plan. Sci. 2021, 78, 101088. [Google Scholar] [CrossRef]
- Maltese, I.; Gatta, V.; Marcucci, E. Active Travel in Sustainable Urban Mobility Plans. An Italian overview. Res. Transp. Bus. Manag. 2021, 40, 100621. [Google Scholar] [CrossRef]
- Andoni, M.; Robu, V.; Flynn, D.; Abram, S.; Geach, D.; Jenkins, D.; McCallum, P.; Peacock, A. Blockchain technology in the energy sector: A systematic review of challenges and opportunities. Renew. Sustain. Energy Rev. 2019, 100, 143–174. [Google Scholar] [CrossRef]
- Sanguesa, J.A.; Torres-Sanz, V.; Garrido, P.; Martinez, F.J.; Marquez-Barja, J.M. A Review on Electric Vehicles: Technologies and Challenges. Smart Cities 2021, 4, 372–404. [Google Scholar] [CrossRef]
- Lin, B.; Wu, W. Why people want to buy electric vehicle: An empirical study in first-tier cities of China. Energy Policy 2018, 112, 233–241. [Google Scholar] [CrossRef]
- Husain, I.; Ozpineci, B.; Islam, M.S.; Gurpinar, E.; Su, G.-J.; Yu, W.; Chowdhury, S.; Xue, L.; Rahman, D.; Sahu, R. Electric Drive Technology Trends, Challenges, and Opportunities for Future Electric Vehicles. Proc. IEEE 2021, 109, 1039–1059. [Google Scholar] [CrossRef]
- Yang, X.-G.; Wang, C.-Y. Understanding the trilemma of fast charging, energy density and cycle life of lithium-ion batteries. J. Power Sources 2018, 402, 489–498. [Google Scholar] [CrossRef]
- Noel, L.; de Rubens, G.Z.; Sovacool, B.K.; Kester, J. Fear and loathing of electric vehicles: The reactionary rhetoric of range anxiety. Energy Res. Soc. Sci. 2019, 48, 96–107. [Google Scholar] [CrossRef]
- IEA. Global EV Outlook 2020, IEA, Paris. 2020. Available online: https://www.iea.org/reports/global-ev-outlook-2020 (accessed on 23 October 2023).
- Unterluggauer, T.; Rich, J.; Andersen, P.B.; Hashemi, S. Electric vehicle charging infrastructure planning for integrated transportation and power distribution networks: A review. eTransportation 2022, 12, 100163. [Google Scholar] [CrossRef]
- Hamdare, S.; Kaiwartya, O.; Jugran, M.; Brown, D.; Vyas, P. Analysis of EV charging infrastructure and its impact on public adoption: Examining the critical role of charging stations in the acceleration of electric vehicle market growth. In Proceedings of the 16th International Conference on PErvasive Technologies Related to Assistive Environments, Corfu, Greece, 5–7 July 2023; pp. 550–556. [Google Scholar] [CrossRef]
- European Alternative Fuels Observatory. Charging Infrastructure Statistics. 2021. Available online: https://www.eafo.eu/alternative-fuels/electricity/charging-infra-stats (accessed on 23 October 2023).
- Pelosi, D.; Longo, M.; Bidini, G.; Zaninelli, D.; Barelli, L. A new concept of highways infrastructure integrating energy storage devices for e-mobility transition. J. Energy Storage 2023, 65, 107364. [Google Scholar] [CrossRef]
- Napoli, G.; Polimeni, A.; Micari, S.; Andaloro, L.; Antonucci, V. Optimal allocation of electric vehicle charging stations in a highway network: Part 1. Methodology and test application. J. Energy Storage 2020, 27, 101102. [Google Scholar] [CrossRef]
- Wei, W.; Ramakrishnan, S.; Needell, Z.A.; Trancik, J.E. Personal vehicle electrification and charging solutions for high-energy days. Nat. Energy 2021, 6, 105–114. [Google Scholar] [CrossRef]
- Golab, A.; Zwickl-Bernhard, S.; Auer, H. Minimum-Cost Fast-Charging Infrastructure Planning for Electric Vehicles along the Austrian High-Level Road Network. Energies 2022, 15, 2147. [Google Scholar] [CrossRef]
- Girade, P.; Shah, H.; Kaushik, K.; Patheria, A.; Xu, B. Comparative analysis of state of charge based adaptive supervisory control strategies of plug-in Hybrid Electric Vehicles. Energy 2021, 230, 120856. [Google Scholar] [CrossRef]
- Yang, C.; Zha, M.; Wang, W.; Liu, K.; Xiang, C. Efficient energy management strategy for hybrid electric vehicles/plug-in hybrid electric vehicles: Review and recent advances under intelligent transportation system. IET Intell. Transp. Syst. 2020, 14, 702–711. [Google Scholar] [CrossRef]
- Stogios, C.; Kasraian, D.; Roorda, M.J.; Hatzopoulou, M. Simulating impacts of automated driving behavior and traffic conditions on vehicle emissions. Transp. Res. Part D Transp. Environ. 2019, 76, 176–192. [Google Scholar] [CrossRef]
- Ouyang, X.; Xu, M. Promoting green transportation under the belt and Road Initiative: Locating charging stations considering electric vehicle users’ travel behavior. Transp. Policy 2022, 116, 58–80. [Google Scholar] [CrossRef]
- Cussigh, M.; Hamacher, T. Optimal charging and driving strategies for battery electric vehicles on long distance trips: A dynamic programming approach. In Proceedings of the 2019 IEEE Intelligent Vehicles Symposium (IV), Paris, France, 9–12 June 2019; pp. 2093–2098. [Google Scholar]
- Pesch, T.; Allelein, H.-J.; Müller, D.; Witthaut, D. High-performance charging for the electrification of highway traffic: Optimal operation, infrastructure requirements and economic viability. Appl. Energy 2020, 280, 115706. [Google Scholar] [CrossRef]
- Jakobsson, N.; Hartvigsson, E.; Taljegard, M.; Johnsson, F. Substation Placement for Electric Road Systems. Energies 2023, 16, 4217. [Google Scholar] [CrossRef]
- Bischoff, J.; Marquez-Fernandez, F.J.; Domingues-Olavarria, G.; Maciejewski, M.; Nagel, K. Impacts of vehicle fleet electrification in Sweden—A simulation-based assessment of long-distance trips. In Proceedings of the 2019 6th International Conference on Models and Technologies for Intelligent Transportation Systems (MT-ITS), Krakow, Poland, 5–7 June 2019; pp. 1–7. [Google Scholar] [CrossRef]
- Wang, T.; Zhang, J.; He, J. Dynamic wireless charging lane reversal for connected and automated electric vehicles in highway. Sustain. Energy Technol. Assess. 2023, 57, 103206. [Google Scholar] [CrossRef]
- Schwerdfeger, S.; Bock, S.; Boysen, N.; Briskorn, D. Optimizing the electrification of roads with charge-while-drive technology. Eur. J. Oper. Res. 2022, 299, 1111–1127. [Google Scholar] [CrossRef]
- Colombo, C.G.; Miraftabzadeh, S.M.; Saldarini, A.; Longo, M.; Brenna, M.; Yaici, W. Literature review on wireless charging technologies: Future trend for electric vehicle? In Proceedings of the 2022 Second International Conference on Sustainable Mobility Applications, Renewables and Technology (SMART), Cassino, Italy, 23–25 November 2022; pp. 1–5. [Google Scholar] [CrossRef]
- Nguyen, V.C.; Wang, C.-T.; Hsieh, Y.-J. Electrification of Highway Transportation with Solar and Wind Energy. Sustainability 2021, 13, 5456. [Google Scholar] [CrossRef]
- Colombo, C.G.; Longo, M.; Brenna, M. Sustainable Green Island in smart road: Case study applied on Italian highway network. In Proceedings of the 2022 IEEE International Conference on Environment and Electrical Engineering and 2022 IEEE Industrial and Commercial Power Systems Europe (EEEIC/I&CPS Europe), Prague, Czech Republic, 28 June–1 July 2022; pp. 1–5. [Google Scholar]
- Clairotte, M.; Zardini, A.; Martini, G.; European Commission Joint Research Centre. Phase 1 of the Environmental Effect Study on the Euro 5 Step of L-Category Vehicles: Stocktaking and Data Mining; Publications Office of the European Union: Luxembourg, 2016. [Google Scholar]
- CEIC. Italy Motor Vehicles Sales Growth, 2006–2022|CEIC Data. Available online: https://www.ceicdata.com/en/indicator/April/motor-vehicles-sales-growth (accessed on 23 October 2023).
- Münzel, C.; Plötz, P.; Sprei, F.; Gnann, T. How large is the effect of financial incentives on electric vehicle sales?—A global review and European analysis. Energy Econ. 2019, 84, 104493. [Google Scholar] [CrossRef]
- MOTUS-E. April 2022—The Car Market Is Worse than May 2020—MOTUS-E. Available online: https://www.motus-e.org/analysis-di-mercato/Aprile-2022-mercato-peggio-maggio-2020 (accessed on 23 October 2023).
- Energy Strategy. Smart Mobility Report 2022. 2022. Available online: www.energystrategy.it (accessed on 23 October 2023).
- Mathilde Carlier. Annual Number of All-Electric Car Registrations in Italy from 2015 to 2021, 21 April 2022, Statista. Available online: https://www.statista.com/statistics/736809/electric-cars-registered-in-italy/ (accessed on 23 October 2023).
- Rietmann, N.; Hügler, B.; Lieven, T. Forecasting the trajectory of electric vehicle sales and the consequences for worldwide CO2 emissions. J. Clean. Prod. 2020, 261, 121038. [Google Scholar] [CrossRef]
- Ministero delle Infrastrutture e dei Trasporti PNire. Piano Nazionale Infrastrutturale per la Ricarica dei Veicoli Alimentati ad Energia Elettrica; Ministero delle Infrastrutture e dei Trasporti: Rome, Italy, 2015. [Google Scholar]
- Rietmann, N.; Lieven, T. How policy measures succeeded to promote electric mobility—Worldwide review and outlook. J. Clean. Prod. 2019, 206, 66–75. [Google Scholar] [CrossRef]
- Meade, N.; Islam, T. Modelling and forecasting the diffusion of innovation—A 25-year review. Int. J. Forecast. 2006, 22, 519–545. [Google Scholar] [CrossRef]
- Nicholas, M.; Wappelhorst, S. Preparing Italy’s Charging Infrastructure for Rapid Vehicle Electrification. 2022. Available online: https://www.governo.it/sites/governo.it/files/PNire.pdf (accessed on 23 October 2023).
- Jaržemskis, A.; Jaržemskienė, I. European Green Deal Implications on Country Level Energy Consumption. Folia Oeconomica Stetin. 2022, 22, 97–122. [Google Scholar] [CrossRef]
- Tsiropoulos, I.; Siskos, P.; Capros, P. The cost of recharging infrastructure for electric vehicles in the EU in a climate neutrality context: Factors influencing investments in 2030 and 2050. Appl. Energy 2022, 322, 119446. [Google Scholar] [CrossRef]
- Lanz, L.; Noll, B.; Schmidt, T.S.; Steffen, B. Comparing the levelized cost of electric vehicle charging options in Europe. Nat. Commun. 2022, 13, 5277. [Google Scholar] [CrossRef] [PubMed]


| Location | km of Positioning | Charging Type |
|---|---|---|
| S. Zenone Ovest | 15.1 | HPC 300 kW + fast-charging 64 kW |
| Arda Ovest | 73.3 | HPC 300 kW + fast-charging 64 kW |
| Secchia Est 1 | 165.5 | HPC 300 kW + fast-charging 75 kW |
| Give Ovest | 481.1 | HPC 300 kW + fast-charging 75 kW |
| Flaminia Est 1 | 509.1 | HPC 300 kW |
| Teano Ovest | 708.4 | HPC 300 kW + fast-charging 64 kW |
| Investment Type | Cost |
|---|---|
| DC charger unit | EUR 40,000 |
| DC charger Installation | EUR 64,000 |
| Remaining capital expenditure | EUR 46,000 |
| Level 1 1 charger unit | EUR 1500 |
| Level 1 charger installation | EUR 3000 |
| Level 2 2 charger unit | EUR 6500 |
| Level 2 charger installation | EUR 12,700 |
| Fast charging | 0.5 EUR/kWh |
| Slow charging | 0.3 EUR/kWh |
| Time Horizon Number | Year Prevision | % of Available Areas |
|---|---|---|
| Horizon 0—H0 | 2022 | 7% (actual situation) |
| Horizon 1—H1 | 2024 | 20% |
| Horizon 2—H2 | 2028 | 50% |
| Horizon 3—H3 | 2030 | 70% |
| Horizon 4—H4 | 2035 | 90% |
| Scenario | Time H0 | Time H1 | Time H2 | Time H3 | Time H4 |
|---|---|---|---|---|---|
| Scenario 1 | 8.18% | 12.52% | 11.89% | 10.83% | 10.86% |
| Scenario 2 | 16.36% | 25.04% | 23.77% | 21.65% | 20.12% |
| Scenario 3 | 32.72% | 50.07% | 47.55% | 43.30% | 40.23% |
| Scenario 4 | 65.43% | 100.15% | 95.10% | 86.60% | 80.47% |
Disclaimer/Publisher’s Note: The statements, opinions and data contained in all publications are solely those of the individual author(s) and contributor(s) and not of MDPI and/or the editor(s). MDPI and/or the editor(s) disclaim responsibility for any injury to people or property resulting from any ideas, methods, instructions or products referred to in the content. |
© 2023 by the authors. Licensee MDPI, Basel, Switzerland. This article is an open access article distributed under the terms and conditions of the Creative Commons Attribution (CC BY) license (https://creativecommons.org/licenses/by/4.0/).
Share and Cite
Colombo, C.G.; Borghetti, F.; Longo, M.; Foiadelli, F. Electrification of Motorway Network: A Methodological Approach to Define Location of Charging Infrastructure for EV. Sustainability 2023, 15, 16429. https://doi.org/10.3390/su152316429
Colombo CG, Borghetti F, Longo M, Foiadelli F. Electrification of Motorway Network: A Methodological Approach to Define Location of Charging Infrastructure for EV. Sustainability. 2023; 15(23):16429. https://doi.org/10.3390/su152316429
Chicago/Turabian StyleColombo, Cristian Giovanni, Fabio Borghetti, Michela Longo, and Federica Foiadelli. 2023. "Electrification of Motorway Network: A Methodological Approach to Define Location of Charging Infrastructure for EV" Sustainability 15, no. 23: 16429. https://doi.org/10.3390/su152316429