Article

A Study on Optimal Opening Configuration for Art Museum Exhibition Space Considering Daylight Performance, Indoor Thermal Comfort, and Energy Consumption

1
School of Architecture, Henan University of Technology, Zhengzhou 450001, China
2
Faculty of Design, Kyushu University, Fukuoka 815-8540, Japan
3
Graduate School of Design, Kyushu University, Fukuoka 815-8540, Japan
*
Author to whom correspondence should be addressed.
Sustainability 2023, 15(23), 16431; https://doi.org/10.3390/su152316431
Submission received: 25 September 2023 / Revised: 8 November 2023 / Accepted: 28 November 2023 / Published: 29 November 2023
(This article belongs to the Topic Building Energy Efficiency)

Abstract

:
Skylights are an efficient means of daylighting in exhibition spaces, but their design presents significant challenges. Considering that daylight utilization profoundly impacts both the visual and thermal environments while affecting energy consumption, the early application of multi-objective optimization strategies becomes imperative. However, many optimization studies provide numerical references only, without delving into the characteristics of opening distribution. This study introduces an optimized exploration approach for openings based on grid subdivision and material parameter selection, targeting Useful Daylight Illuminance (UDI), Energy Use Intensity (EUI), and Predicted Percentage of Dissatisfied (PPD). Simulations and optimizations were performed using Honeybee and Octopus, focusing on the optimal configurations of four typical skylights in Fukuoka, Japan’s climate. The results demonstrate that this novel optimization approach improves metrics for each case and challenges traditional perceptions of daylight systems. Flexible and diverse opening configurations, formed through irregular layouts and material combinations, help achieve more ideal holistic environmental effects under different climatic conditions. Thus, we should provide these research findings as design guidelines for similar scenarios.

1. Introduction

The use of daylight in art museum exhibition spaces has become a hot topic of academic discussion in recent years. Historically, early art museums were lighted by daylight. By the mid-20th century, many exhibition spaces had abandoned daylight in favor of a “white cube” with only artificial lighting due to the popularity of artificial lamps and the damage that daylight caused to artworks [1,2]. With recent theoretical developments revealing the various advantages of using daylight in art museums, integrating daylight and artificial lighting has become a major alternative to implementing artificial lighting alone.
Daylight has a continuous spectral distribution and is considered the best source of color rendering, which helps to interpret exhibits better and visually enrich displays [3,4,5]. The rational use of daylight can give visitors a better psychological experience, and its changing characteristics are a reason for people to revisit museums [6,7]. Moreover, many exhibits are created under natural light, and only artificial lighting may prevent visitors from experiencing the tiny details of the artworks [5]. It has also been significantly effective in reducing the lighting energy consumption and carbon emissions of buildings [3,4,8]. Although daylight has many advantages, it is necessary to study and plan daylight systems early in the architectural design process due to the high light and heat environment requirements of the artwork for the exhibition space [9].
The optimal design of building openings is an effective strategy to achieve comfortable daylight distribution, reduce energy consumption, and use solar heat flexibly. Unlike the side openings often used in schools and office buildings, skylights are the leading openings in art museums because the walls are usually used for exhibitions. The skylights used in art museums are closely integrated with space form, exhibit type, and layout, resulting in a more flexible daylighting approach. Few studies have systematically discussed such a variety of daylight systems. Meanwhile, since skylights are more efficient than side windows, a slight difference in the configuration of the openings and the choice of glazing material may lead to a significant difference in the indoor lighting environment [10]. This effect is particularly evident in exhibition spaces that require low illumination. However, the optimization of building skylights has not been studied as intensively as other building variables, such as form, side lighting openings, building facades, and others. This research area needs more exploration [11]. The balance between openings and opaque areas profoundly influences solar heat gain, heat loss, and daylighting. Consequently, these design nuances impact a building’s indoor thermal environment and overall energy consumption [12,13]. Deploying a multi-objective optimization is often indispensable to simultaneously maximize daylight efficiency and minimize energy demand [13,14]. Such optimizations yield a Pareto set of solutions, offering architects a gamut of choices depending on their design priorities. It is essential for designers to provide guidance and advice at the early stage of building design [15]. For museums, the recent emphasis on energy efficiency comes from the significant energy consumption needed to maintain a consistent temperature and humidity in exhibition spaces [16].
For decades, architects have innovated with skylight designs; pyramids, sawtooth, and monitor configurations have become emblematic of art museums’ natural light solutions. In Japan, architects such as Shin Isozaki, Tadao Ando, and SANAA have skillfully integrated natural light into art museum designs, offering a counterpoint to spaces traditionally lit artificially. As passive architectural principles gain traction and natural lighting regains prominence, traditional daylighting techniques are anticipated to continually influence the design of upcoming art museums. Nonetheless, subtle shifts in opening design and materials may deeply affect the indoor environment of exhibition spaces. As such, these daylight systems necessitate sophisticated multi-objective evaluations to find optimal design strategies for exhibition contexts.
In summary, this study addresses the complexity of the environmental demands within exhibition spaces, questioning whether traditional daylight design systems are adequately suited to meet such intricate needs. It explores the potential for further optimization of these conventional systems, investigating how a more refined multi-objective optimization process could unveil new insights and deepen the understanding of skylight design, thereby providing valuable guidance to enhance designers’ approaches.

2. Previous Research and Research Objectives
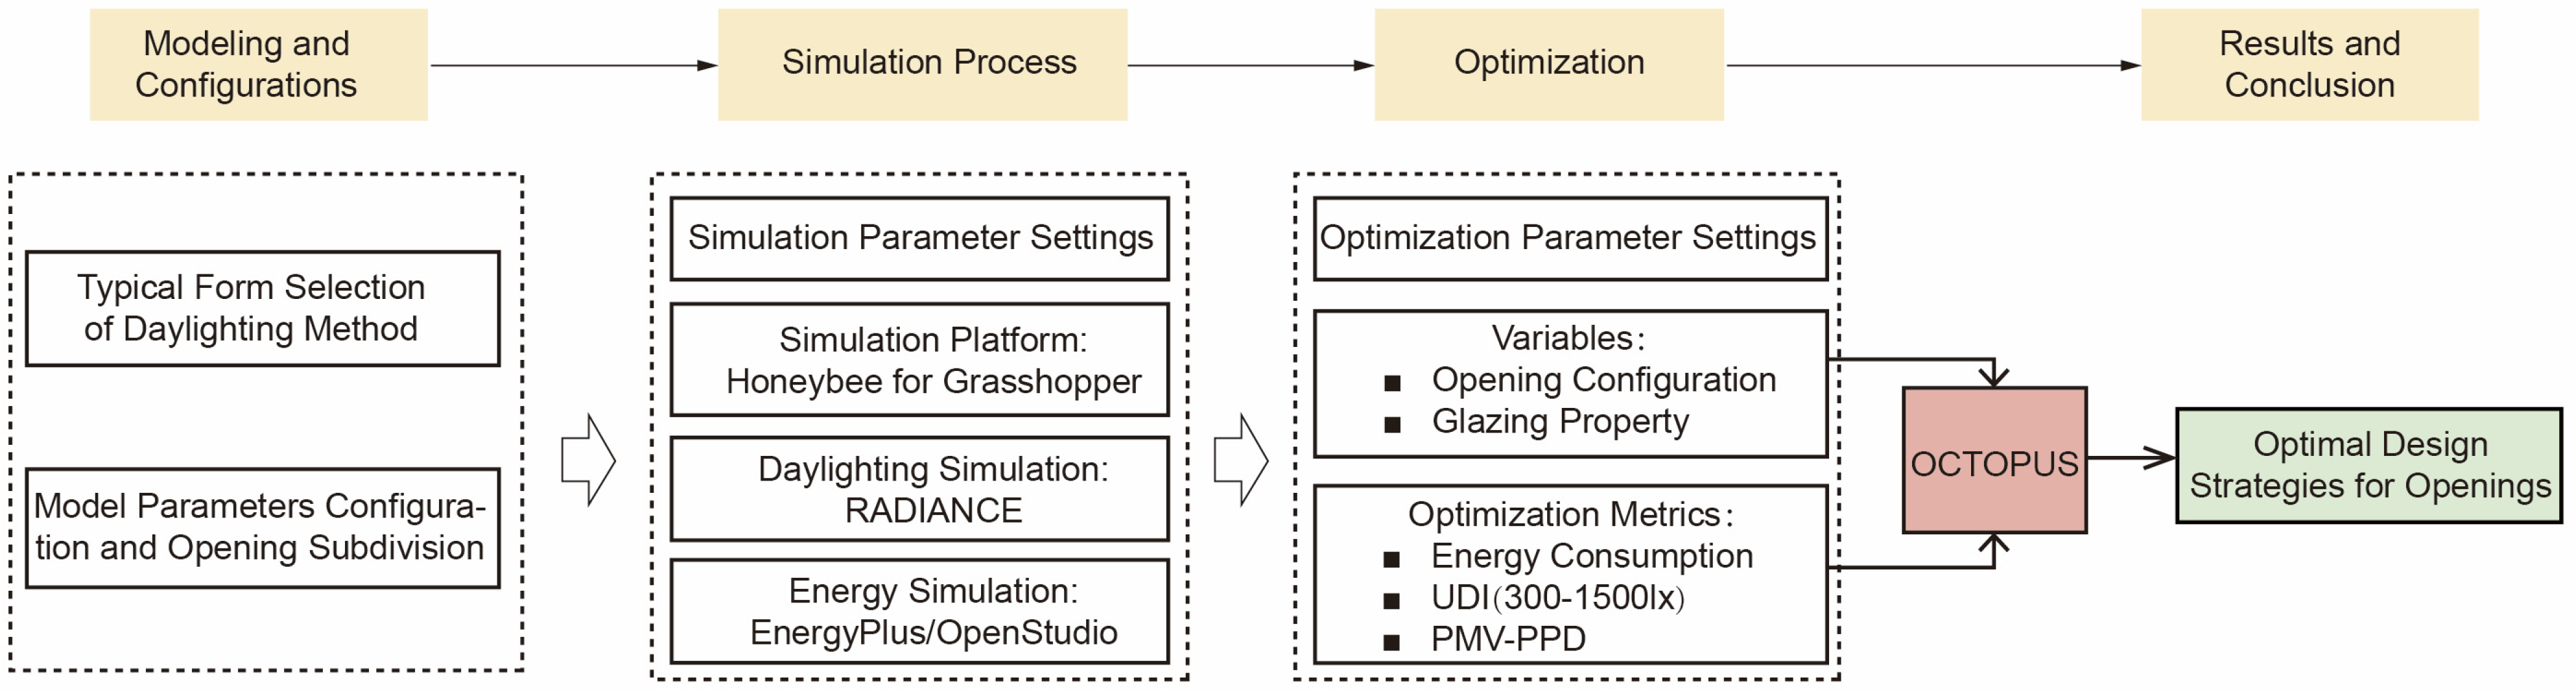
Daylight utilization in exhibition spaces has been studied to a certain extent in previous research, evolving from simulation analysis of indoor light environments to multi-objective optimization analysis in recent years. Kim et al. [9,17] conducted a comparative analysis of the effects of applying different shapes to skylights in existing museums in Korea through a validated daylight simulation based on the software RADIANCE, verifying the effectiveness of applying daylighting simulation at an early stage of architectural design and evaluating the possibility of using skylights in museums. Brzezicki [18] evaluated the annual exposure of a museum exhibition space with translucent clerestory windows and a dropped ceiling using daylight simulations. Huang et al. [19,20] studied the light environment of museum paintings, calligraphy halls, and sculpture halls in China. The daylighting parameters under different daylighting schemes were calculated by simulation, and the corresponding optimization strategies were proposed based on the simulation results. These studies mainly focused on exploring the visual effects of using daylight in museums based on daylight simulations, without mentioning the combination with other factors such as energy consumption and thermal comfort. Fathy et al. [5] proposed a framework for finding the optimal design of daylighting for museum exhibition space façades. This was achieved by pixelating the facade into small openings and finding a combination of the location and size of the openings that met the needs of the exhibition space through a genetic algorithm or exhaustive search. Their study provided a new perspective in the search for proper daylight design of exhibition space façades. In contrast, the optimal design of skylights and the impact of optimization on energy consumption has yet to be mentioned.
On the other hand, some studies have focused on daylight utilization and energy consumption when heritage buildings are retrofitted as exhibition buildings. Marzouk et al. [21] addressed the issue of skylight configurations for the retrofit of an Egyptian heritage palace by conducting daylight and energy consumption simulations with Rhino + Grasshopper and multi-objective genetic optimization with the Octopus plug-in. They discussed the improvement of daylight utilization and energy efficiency by the optimal skylight configurations obtained through the relevant techniques. Further, a similar multi-objective optimization technique was used to explore the optimal daylight utilization for applying vertical and horizontal skylight mullions in an Egyptian heritage palace using size and glass material as parameters [11]. The studies mentioned above mainly focused on optimizing specific skylight forms for specific Egyptian buildings in hot climatic conditions. At the same time, the various daylight systems for exhibition spaces in other climates have yet to be systematically studied. From the overall view of the related studies, most of them explored transparent glazing materials, and only a few studies have involved diffuse glazing materials. Since direct daylight is generally not expected to reach exhibits in exhibition spaces, and uniformity of illuminance of the exhibition plane is required, diffuse glazing materials are more widely used in exhibition buildings than transparent glazing materials. The transmittance and transmission characteristics of transparent and diffuse materials differ, and their selection can significantly affect the indoor light environment. Therefore, in the early design stages, it is essential to strategically select glazing materials that seamlessly integrate both transparent and diffuse elements for optimized openings. At present, research on this issue remains limited.
Based on the current research status, this study aims to develop a multi-objective optimization approach that factors in the placement of openings and the characteristics of glazing to evaluate and optimize daylight systems for typical exhibition spaces from the perspectives of daylighting, indoor thermal comfort, and energy consumption. Our scope primarily focuses on the situations of permanent exhibition spaces where the displays do not change over time, which is also the main exhibition approach in Japanese art museums. The insights gained from this research are valuable for the future creation of exhibition spaces that can sustain a natural lighting environment.

3. Methodology

To investigate the optimal opening configurations for daylighting in typical exhibition spaces, this study presents a multi-objective optimization workflow that partitions the building surface into a grid and permits material selection for each grid. This workflow integrates numerical simulation techniques encompassing dynamic daylighting simulation, thermal environment analysis, and energy consumption simulation, along with a genetic algorithm-based multi-objective optimization approach. The objectives of the optimization endeavor are to minimize energy usage, maximize the availability of daylight hours throughout the year, and maximize thermal comfort. The efficacy of this workflow is scrutinized and validated through a case study approach, thus revealing the potential for harnessing daylight in exhibition spaces. Building upon extensive literature research, four exemplary daylight systems for art gallery exhibition spaces were chosen as pivotal forms for evaluation and optimization. The comprehensive research methodology and procedural steps are elucidated in Figure 1 and Figure 2. Initially, the representative exhibition spaces were modeled, and the openings were subdivided into smaller apertures that aligned with the spatial configuration. Each smaller opening offered three options: transparent, diffusing, and closed. Subsequently, utilizing the Honeybee plugin in the Rhino + Grasshopper platform, simulations for daylighting, thermal comfort, and energy consumption were conducted. Furthermore, the combinations of smaller openings were optimized using the genetic algorithm embedded in the Octopus plugin, thereby furnishing prospective design solutions for exhibition spaces that capitalize on natural daylight. Elaborate methodological particulars for each step are expounded in Section 3.1, Section 3.2 and Section 3.3, while the outcomes are explicated in Section 4.

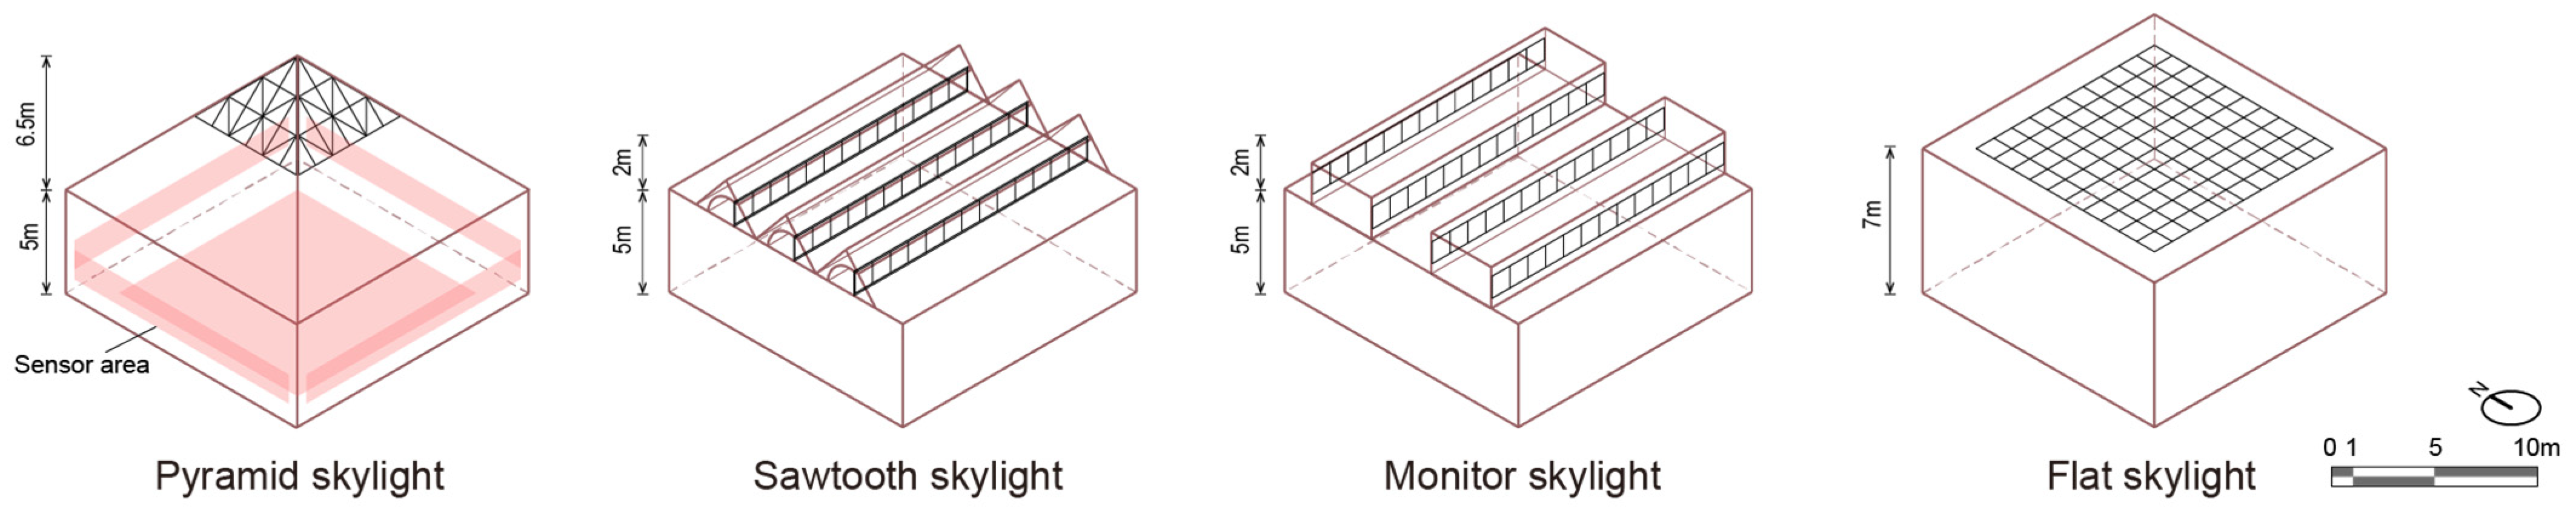
3.1. Model Parameters

Based on an extensive review of the literature and considering real-world utilization conditions, this study carefully selected four daylight systems for exhibition spaces, as depicted in Figure 3 [9,20,21,22,23]. The models, arranged from left to right, include the pyramid skylight model (PMS), sawtooth skylight model (STS), monitor skylight model (MTS), and flat skylight model (FLS). To ensure consistency, the floor size of all models was fixed at 13 m × 13 m, while the height was adjusted to accommodate different roof shapes. The openings were thoughtfully designed to align with the architectural form of each model. Recognizing that actual openings often consist of multiple panels and that irregular patterns tend to enhance user experience, we subdivided the openings for each model and facilitated intriguing combinations of daylight patterns through subsequent optimization processes [5]. Detailed information regarding the orientation, size of the openings, and window-to-floor ratio (WFR) for each model can be found in Table 1. Additionally, considering the influence of orientation, the sawtooth skylight model was further divided into four cases, with openings facing north, south, east, and west. Similarly, the monitor skylight model was divided into two cases: one with the opening facing north-south and the other with the opening facing east-west. Daylight simulation sensors were strategically positioned in both the floor and wall areas of the exhibition space. In the floor area, sensors were evenly spaced at 1 m intervals, resulting in a total of 90 sensors distributed across a 12 m × 12 m plane. The wall area comprised four rectangular regions, each measuring 12 m in length, 2.5 m in width, and situated 0.9 m above the ground. For each wall area, sensor intervals were set at 0.5 m, yielding a total of 72 sensors. The sensor points on the wall were strategically designed based on the recommended exhibition arrangement values from the Illuminating Engineering Institute of Japan [24]. Consideration was also given to ensure a uniform distribution and a reasonable quantity of sensor points throughout the area.

3.2. Evaluation Metrics

The selection of evaluation metrics for each optimization objective was based on a literature survey and tailored to the specific requirements of the exhibition space. These objectives primarily included annual dynamic daylighting metrics, thermal comfort metrics, and annual energy consumption for air conditioning and lighting.
In recent years, various metrics have been proposed to assess the effectiveness of daylight utilization. Illuminance value is the most commonly used fundamental metric, describing the received light intensity at sensor points. However, it fails to comprehensively consider factors such as dynamic changes in daylight and visual comfort. The Daylight Factor (DF) has been adopted as a standard metric in certain regions such as China and Japan. It represents the ratio of indoor illuminance to outdoor horizontal illuminance and describes indoor daylighting performance under overcast sky conditions. However, DF inadequately reflects regional daylighting climate characteristics and building orientations [25]. Given the limitations of static daylighting metrics, climate-based dynamic daylighting metrics like Daylight Autonomy (DA) and Useful Daylight Illuminance (UDI) have gained widespread usage and demonstrated their utility in evaluating indoor daylight quality. DA represents the percentage of time during a year when the horizontal illuminance at a specific point indoors reaches a predefined threshold. However, DA fails to evaluate daylight utilization when illuminance falls below the threshold and lacks a constraint on maximum illuminance values. UDI addresses these limitations by assessing the proportion of time during a year when the illuminance at a specific point indoors falls within a specified threshold range. Initially, the threshold range for UDI was defined as 100–2000 lux [26] and later modified to 300–3000 lux [27]. Within this range, daylight illuminance levels are considered sufficient to provide adequate lighting for most daily tasks without additional artificial lighting. Due to its comprehensive nature, UDI has been employed as an optimization objective for daylight utilization in numerous studies involving multi-objective optimization in buildings [21,28,29]. In the case of exhibition spaces, determining the ideal illuminance range is crucial not only for visual comfort but also based on the types of exhibits. The Japanese industrial standard classifies exhibits according to their photosensitivity and provides recommended illuminance levels and ranges for various exhibit types, as shown in Table 2 [30]. It can be observed that some exhibits are more sensitive to light, with recommended illuminance levels of 100 lux and 200 lux, making it challenging to effectively utilize natural light in the actual space. On the other hand, the recommended illuminance ranges for the other two exhibit types are all above 300 lux, indicating a higher potential for natural light utilization. The UDI range of 300–3000 lux appears suitable for evaluating the availability and spatial distribution of natural light in exhibition spaces. To ensure exhibit protection and avoid excessive sunlight, we have referenced the recommended illuminance levels from the aforementioned standards and modified the maximum threshold of the UDI metric to 1500 lux. Furthermore, most daylighting metrics analyze indoor daylighting performance based on grid points in the daylighting zone at the height of the working plane. When considering the entire room, it is necessary to average the values of all measurement points in the analysis area to obtain an overall value, known as the average Useful Daylight Illuminance (UDIavg) daylight performance metric. Based on these considerations, in this study, UDIavg (300–1500 lux) was employed as the optimization metric for daylighting objectives.
Considering the continuous human traffic and prolonged stay in exhibition spaces, thermal comfort becomes an indispensable factor. In the assessment of thermal comfort, it is necessary to comprehensively consider individual characteristics such as metabolic rate and clothing as well as indoor thermal environmental parameters such as air temperature, mean radiant temperature, humidity, and air velocity. Currently, two main thermal comfort models are widely used: the PMV-PPD model according to ISO 7730 [31,32] and the adaptive thermal comfort model of ASHRAE 55 [33]. The Predicted Mean Vote (PMV) is an assessment index of thermal comfort in a specific environment, ranging from −3 (cold) to +3 (hot), and considers multiple factors including individual characteristics and environmental parameters. The Predicted Percentage of Dissatisfied (PPD) is based on PMV and estimates the proportion of people feeling uncomfortable under given environmental conditions. While the PMV-PPD model is extensively applied in statically controlled environments with mechanical ventilation and air conditioning, its accuracy may be limited in naturally ventilated environments and for diverse populations. In contrast, the adaptive thermal comfort model considers individual differences and adaptability, aiming to accurately assess an individual’s thermal comfort requirements, thus demonstrating better performance in naturally ventilated environments [34,35]. In our research on exhibition spaces, which heavily rely on mechanical ventilation and air conditioning systems to maintain consistent indoor temperature and humidity for exhibit preservation, the PMV-PPD model is more appropriate. Furthermore, in optimization algorithms that aim to maximize or minimize specific indices, minimizing the PPD value allows for a more intuitive representation of the optimization effect on thermal comfort. Therefore, the PPD has been selected as the metric to evaluate thermal comfort conditions in the exhibition space, which is commonly used in multi-objective optimization studies in architecture [36,37,38].
In the context of global low-carbon development, optimizing building energy consumption has become crucial. With increasing comfort requirements, HVAC systems and their associated energy consumption play a significant role, accounting for nearly half of the building energy consumption [39]. Energy Use Intensity (EUI), a widely used energy metric, typically includes annual heating, cooling, and artificial lighting loads of a building [28,40]. The calculation method involves dividing the total energy consumption of a building by its effective area. Due to its ability to reflect the impacts of both internal and external factors such as weather and heating/cooling loads, this study selected an EUI composed of annual heating, cooling, and lighting energy consumption from air conditioning as the optimization metric for energy consumption.

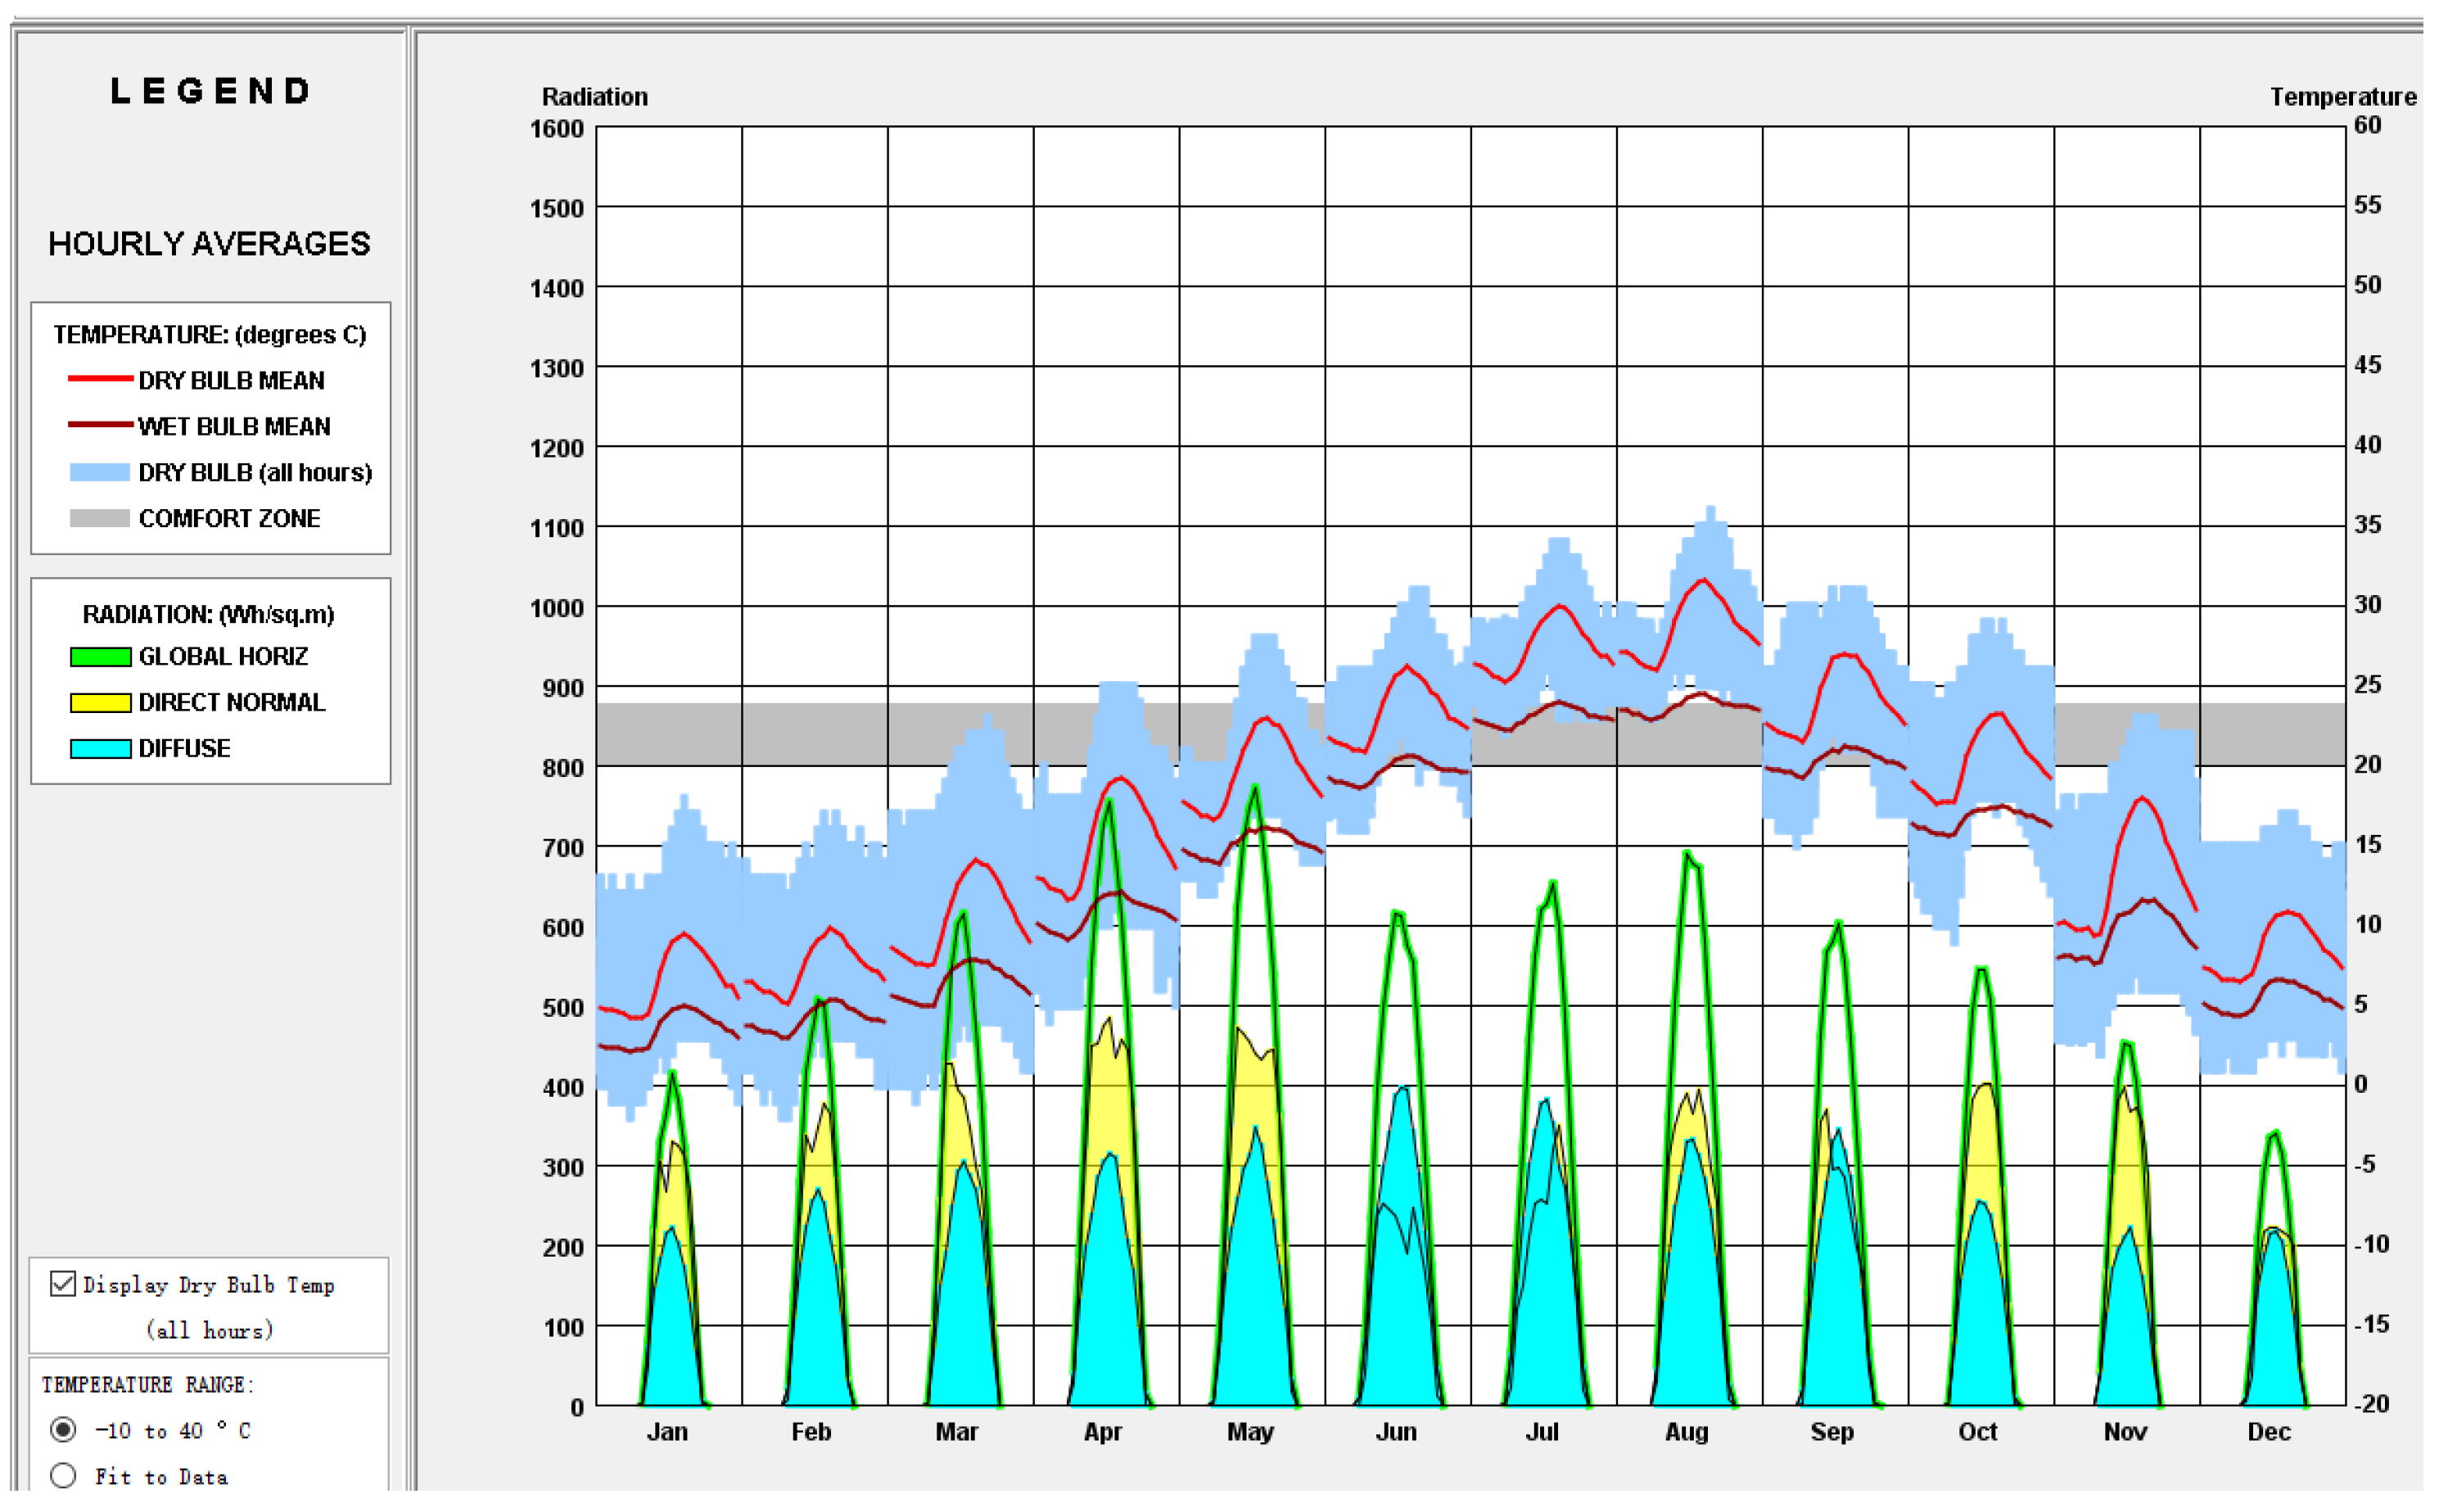
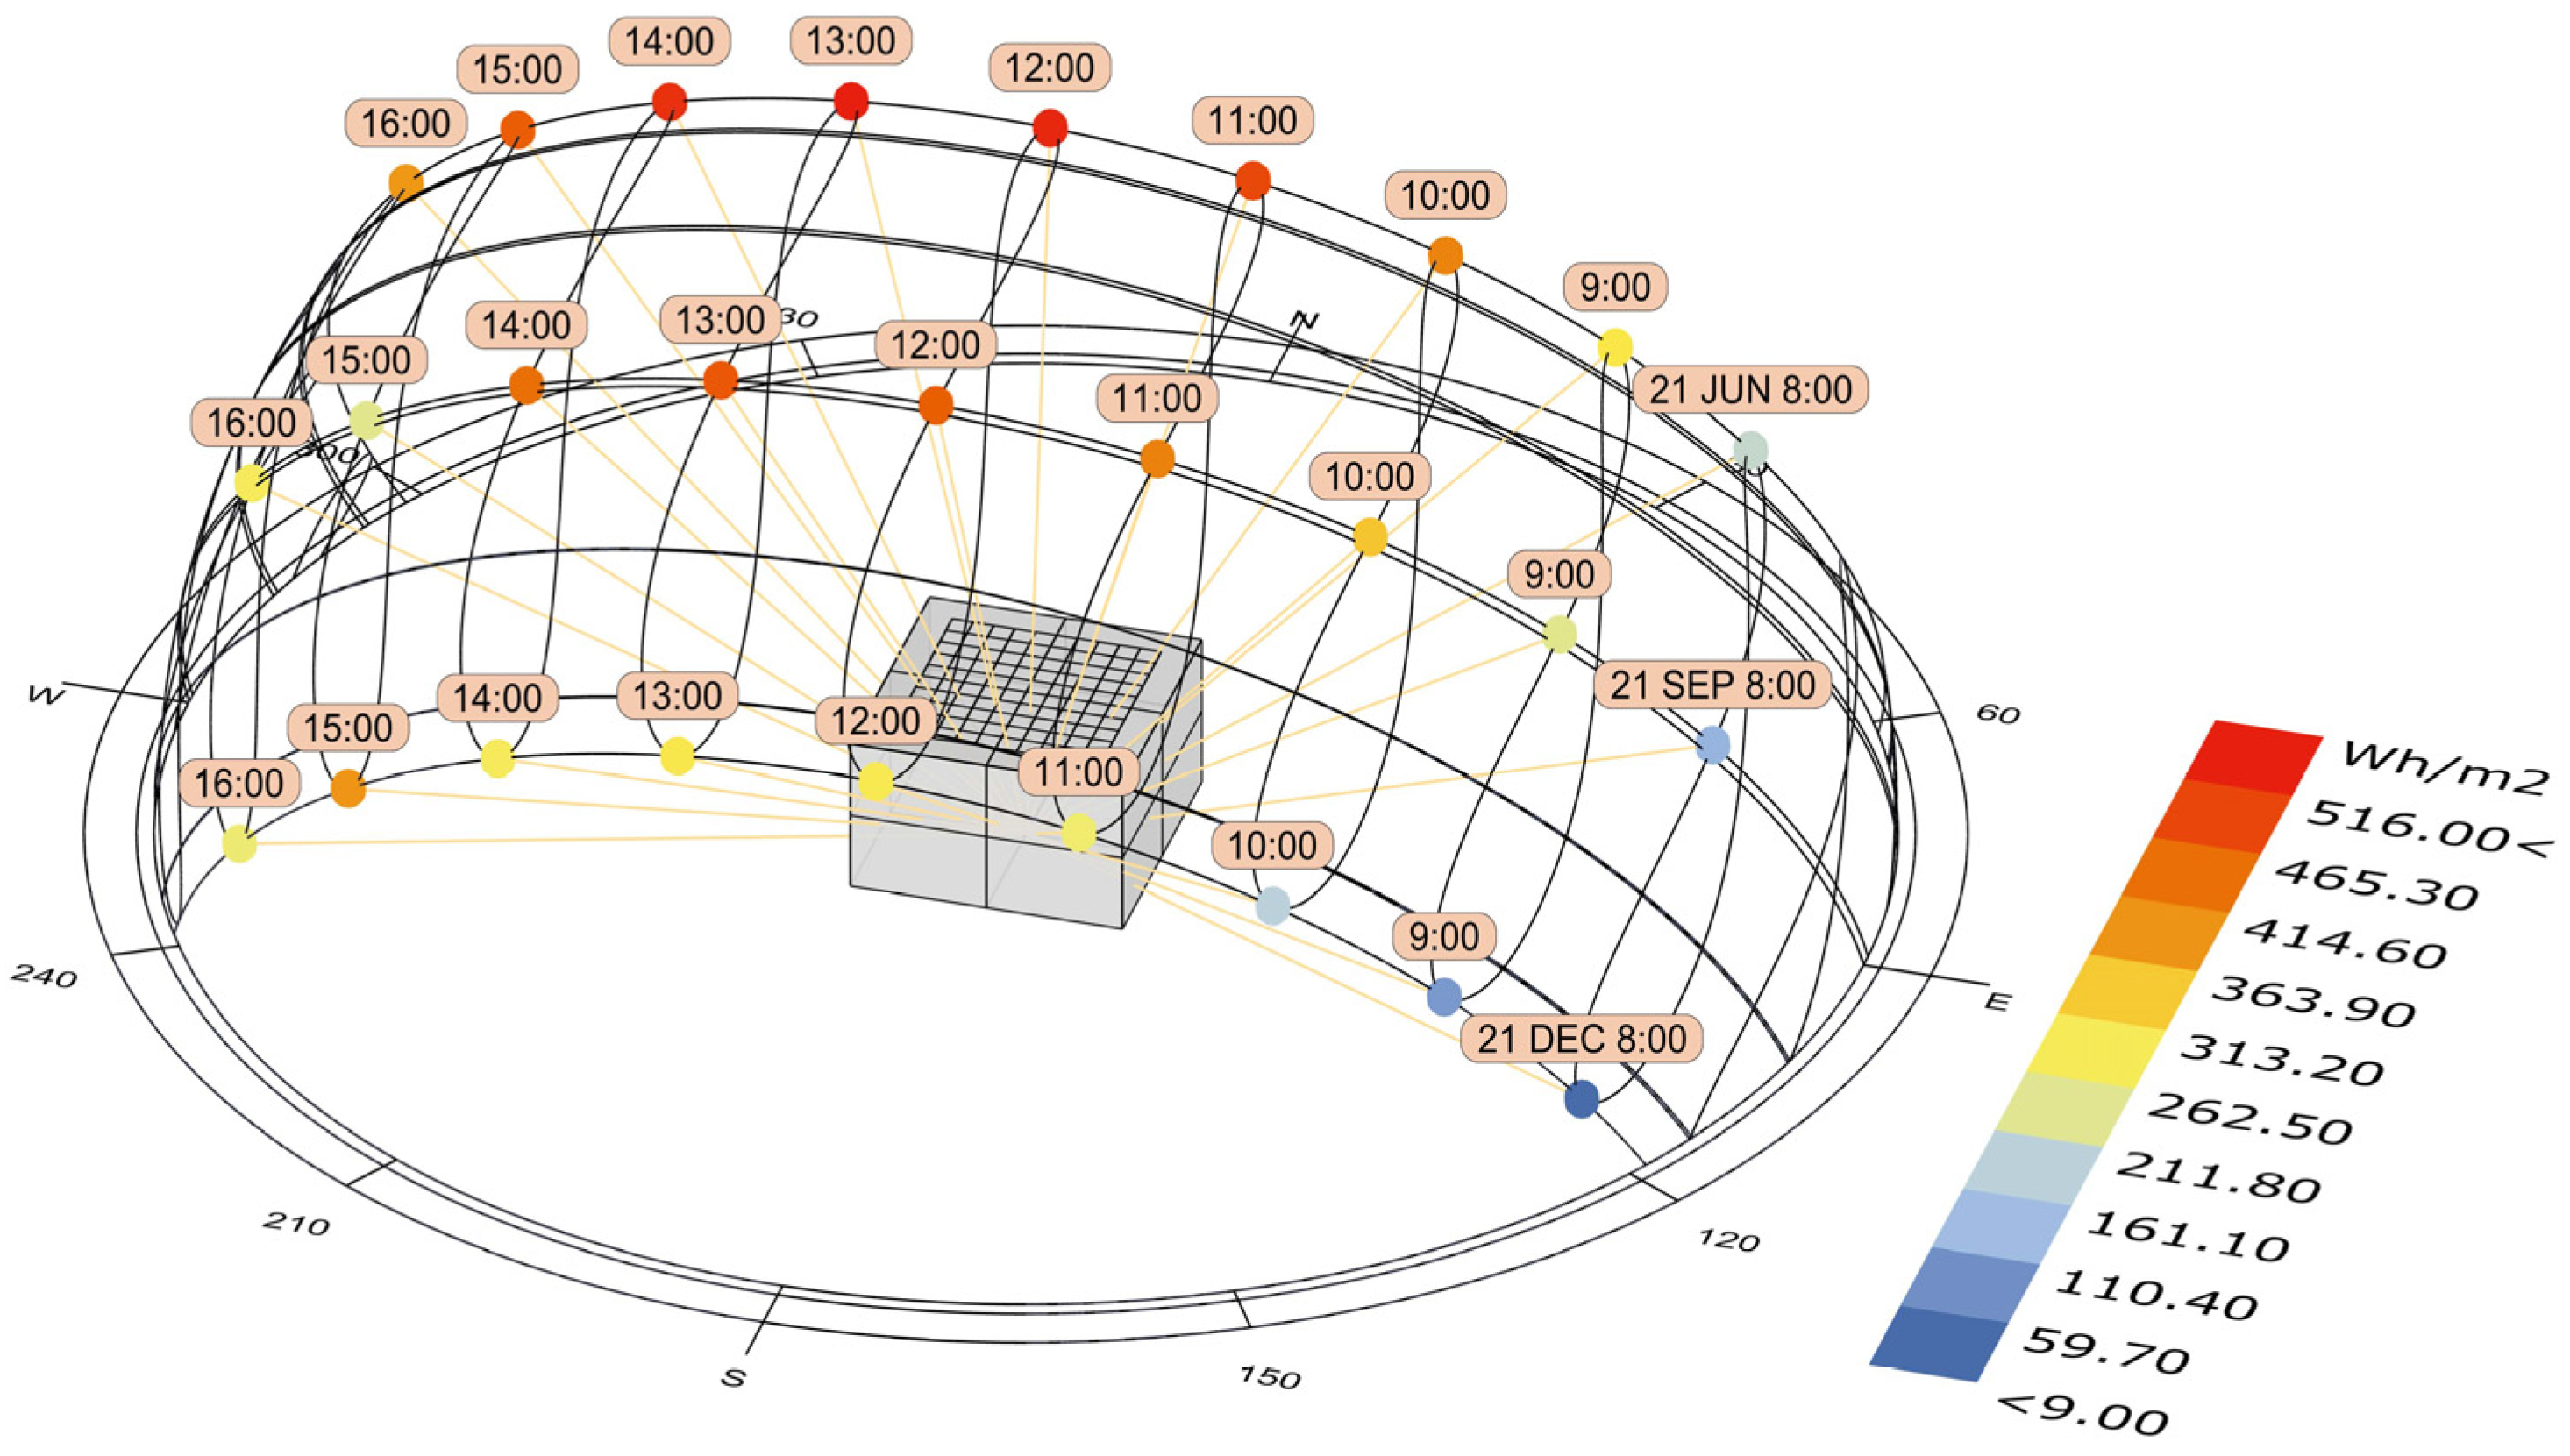
3.3. Climate Condition

The selection of meteorological data has a direct impact on the subsequent analysis of the results. The Building Research Institute of Japan (BRI) categorizes Japan into five daylight climate zones from A1 to A5 based on ascending levels of annual solar radiation [41]. Zones A1, A2, and A5 are less expansive, while A3 and A4 have broader representation. Considering this study’s emphasis on daylight utilization, Fukuoka City in Fukuoka Prefecture, located in the solar-abundant A4 zone, was selected as the simulation subject. This choice aims to derive optimized design strategies applicable to a wider range of regions. Hourly climate data from a global public dataset applicable to EnergyPlus, representing typical meteorological years, were utilized as the input for climate data [42]. The original measured meteorological dataset was obtained from the Integrated Surface Database of the National Oceanic and Atmospheric Administration (NOAA) in the United States for the years 2004 to 2018. Figure 4 is a monthly diurnal average chart generated using meteorological data through Climate Consultant 6.0. This software is developed by the UCLA Energy Design Tools Group (Los Angeles, CA, USA). It can process hourly climate data for an entire year and produce visual analysis charts.
Fukuoka City (33.60° N, 130.40° E) is situated in the northern part of Kyushu Island, Japan, and serves as the economic and cultural center of the Kyushu region. It falls within the classification of a region with a “very hot” summer and a “moderate cold” winter. Based on Figure 4, the hottest month, August, has an average temperature of about 28.4 °C, while the coldest month, January, has an average temperature of about 6.9 °C. Fukuoka City has an annual sunshine duration of approximately 1889.4 h, and the annual total radiation is estimated to be about 4850 MJ/m2. Additionally, the peak monthly diurnal averages from March to September each exceed 600 Wh/m2. This indicates that this region is rich in solar energy resources in Japan.

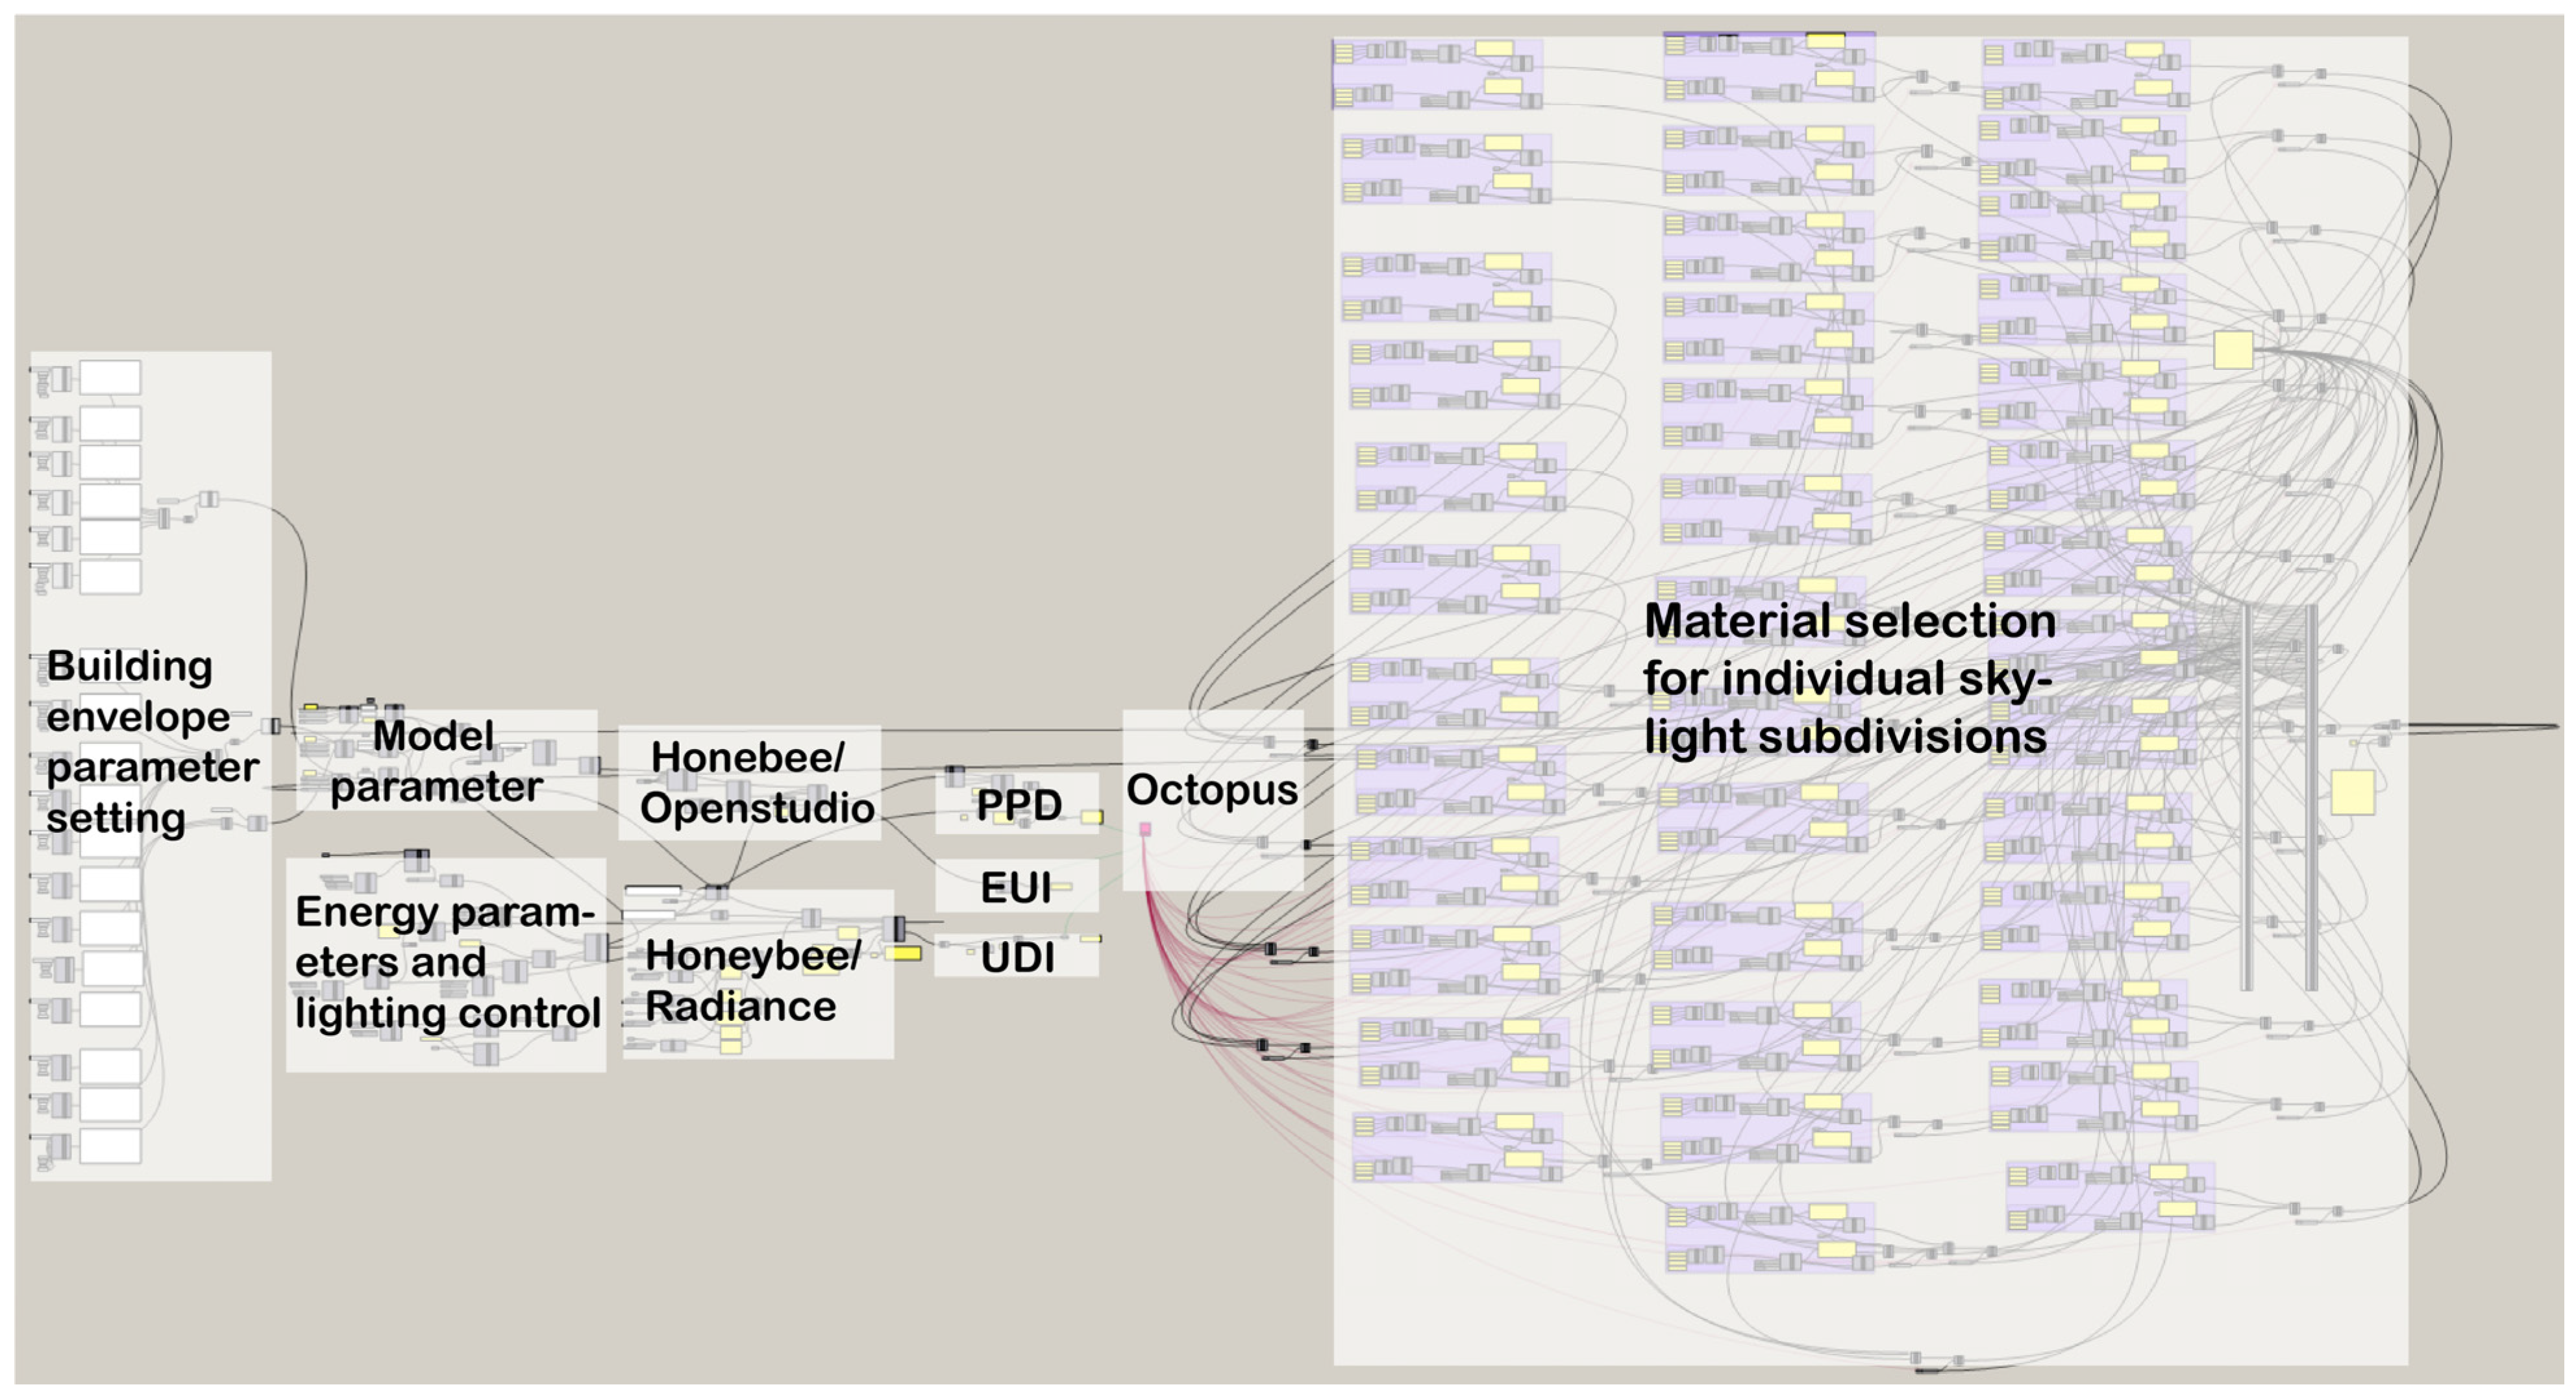
3.4. Simulation and Optimization Settings

The daylight simulations were conducted using the Honeybee plug-in, which is based on the Rhino + Grasshopper platform. The computational core of Honeybee, Radiance, is widely recognized as the de facto standard for daylight simulation programs and has undergone extensive validation to ensure its accuracy [43,44,45]. Energy consumption simulations were performed using the OpenStudio/EnergyPlus plug-in (National Renewable Energy Laboratory, Golden, CO, USA). OpenStudio is a building energy simulation software platform based on EnergyPlus, which is a widely adopted program for comprehensive analysis of energy consumption in buildings, encompassing heating, cooling, lighting, ventilation, and other energy-related aspects. In the simulations, the parameters such as building envelope materials, occupancy time, air conditioning, and ventilation were meticulously configured based on the energy consumption performance calculation method recommended by the Building Research Institute (BRI) and the Ministry of Land, Infrastructure, Transport and Tourism (MLIT). This ensured adherence to standard design and usage conditions. The configuration of the occupancy schedule for the art museum was tailored to its unique usage patterns, employing the standard settings as recommended by MLIT. Throughout the year, the art museum remains closed for a total of 58 days, which includes designated public adjustment days on the Japanese calendar and every Monday that does not coincide with specified opening days. On the remaining 307 days of the year, the art museum operates from 9:00 A.M. to 5:00 P.M. each day, totaling 8 h of work per day and accumulating a total annual operating time of 2456 h. The specific Calendar Pattern is detailed in the referenced literature [46].
Table 3 and Table 4 present the settings of all simulation and optimization parameters. These values were meticulously chosen, drawing from previous research, to ascertain the robustness of the results that we generated [18,28]. For the openings, transparent and diffusive materials were used as specified in Table 5. The setting of glazing material parameters was guided by the official parameters provided by AGC Corporation (Tokyo, Japan). To calculate the annual lighting energy consumption, a controllable lighting system integrated with daylight sensors was installed in the room. The overall target illuminance for the exhibition space was set at 300 lux. The photocell adjusts the intensity of the activated lighting until the combined illuminance from natural daylight and electric light reaches the minimum threshold required for sufficient illumination. The adjustments ensure that the integrated illuminance meets the necessary level for adequate lighting. Regarding the check for 300 lux, the strategy of using a single sensor control point to manage the automatic dimming system was not employed. Instead, a built-in component in Honeybee named “HB Daylight Control Schedule” was utilized. This component is capable of directly using results from the daylight simulation sensor grid as inputs. It can adjust the ideal light intensity ratios, which are then used to calculate lighting energy consumption. The values of the thermal comfort index PPD were calculated based on the simulation results obtained from OpenStudio using the Ladybug plug-in. The optimization process was conducted using the Octopus plugin, which is based on the genetic algorithm. This plugin has gained considerable recognition as a powerful optimization tool and has been extensively employed in numerous recent research studies [21,29,47]. To explore a broad range of optimal compromise solutions across different objectives, a fast multi-objective optimization method based on HypE constraints was chosen [21].
The design variables considered in this research involved the selection of materials for all openings. These material choices were encoded as genetic information and incorporated into the Octopus optimization framework. The primary objectives were to assess the metrics of UDI, EUI, and PPD. Multi-objective optimization does not yield a singular, globally optimal solution but rather a set of diverse solutions along the Pareto front. Architects can then select solutions from this front based on their specific priorities and requirements. The extreme points within the set represent the optimal solutions for individual objectives, while the solutions that strike the best balance between the optimization objectives are determined by evaluating the fitness function values. Specifically, the fitness function used in this study, proposed by Konis et al. [48] and employed in several prior multi-objective optimization studies [28,40], is expressed in Equation (1).
Y = U D I i U D I m i n C 1 + 1 E U I i E U I m i n C 2 + 1 P P D i P P D m i n C 3
C 1 = 100 U D I m a x U D I m i n C 2 = 100 E U I m a x E U I m i n C 3 = 100 P P D m a x P P D m i n
where i denotes the result of a particular computational solution, min and max represent the minimum and maximum values available within the optimization solution set, and Y corresponds to the fitness function value. It is worth noting that to prevent an overemphasis on one metric at the expense of others during the final aggregation, the results of EUI, UDI, and PPD were scaled to a common numerical range, typically between 0 and 100, using range normalization [48]. Additionally, the EUI and PPD metrics were multiplied by −1 since they represent energy consumption and expected discomfort percentage, respectively, which were desired to be minimized. Finally, the results were combined to determine the ultimate outcome.
The simulations and optimizations were performed on a computer with an AMD Ryzen 9 7950X 16-Core Processor @4.50 GHz, 64-bit operating system, and Microsoft Windows 10. The calculation took approximately 11 days for each model.

4. Results and Discussion

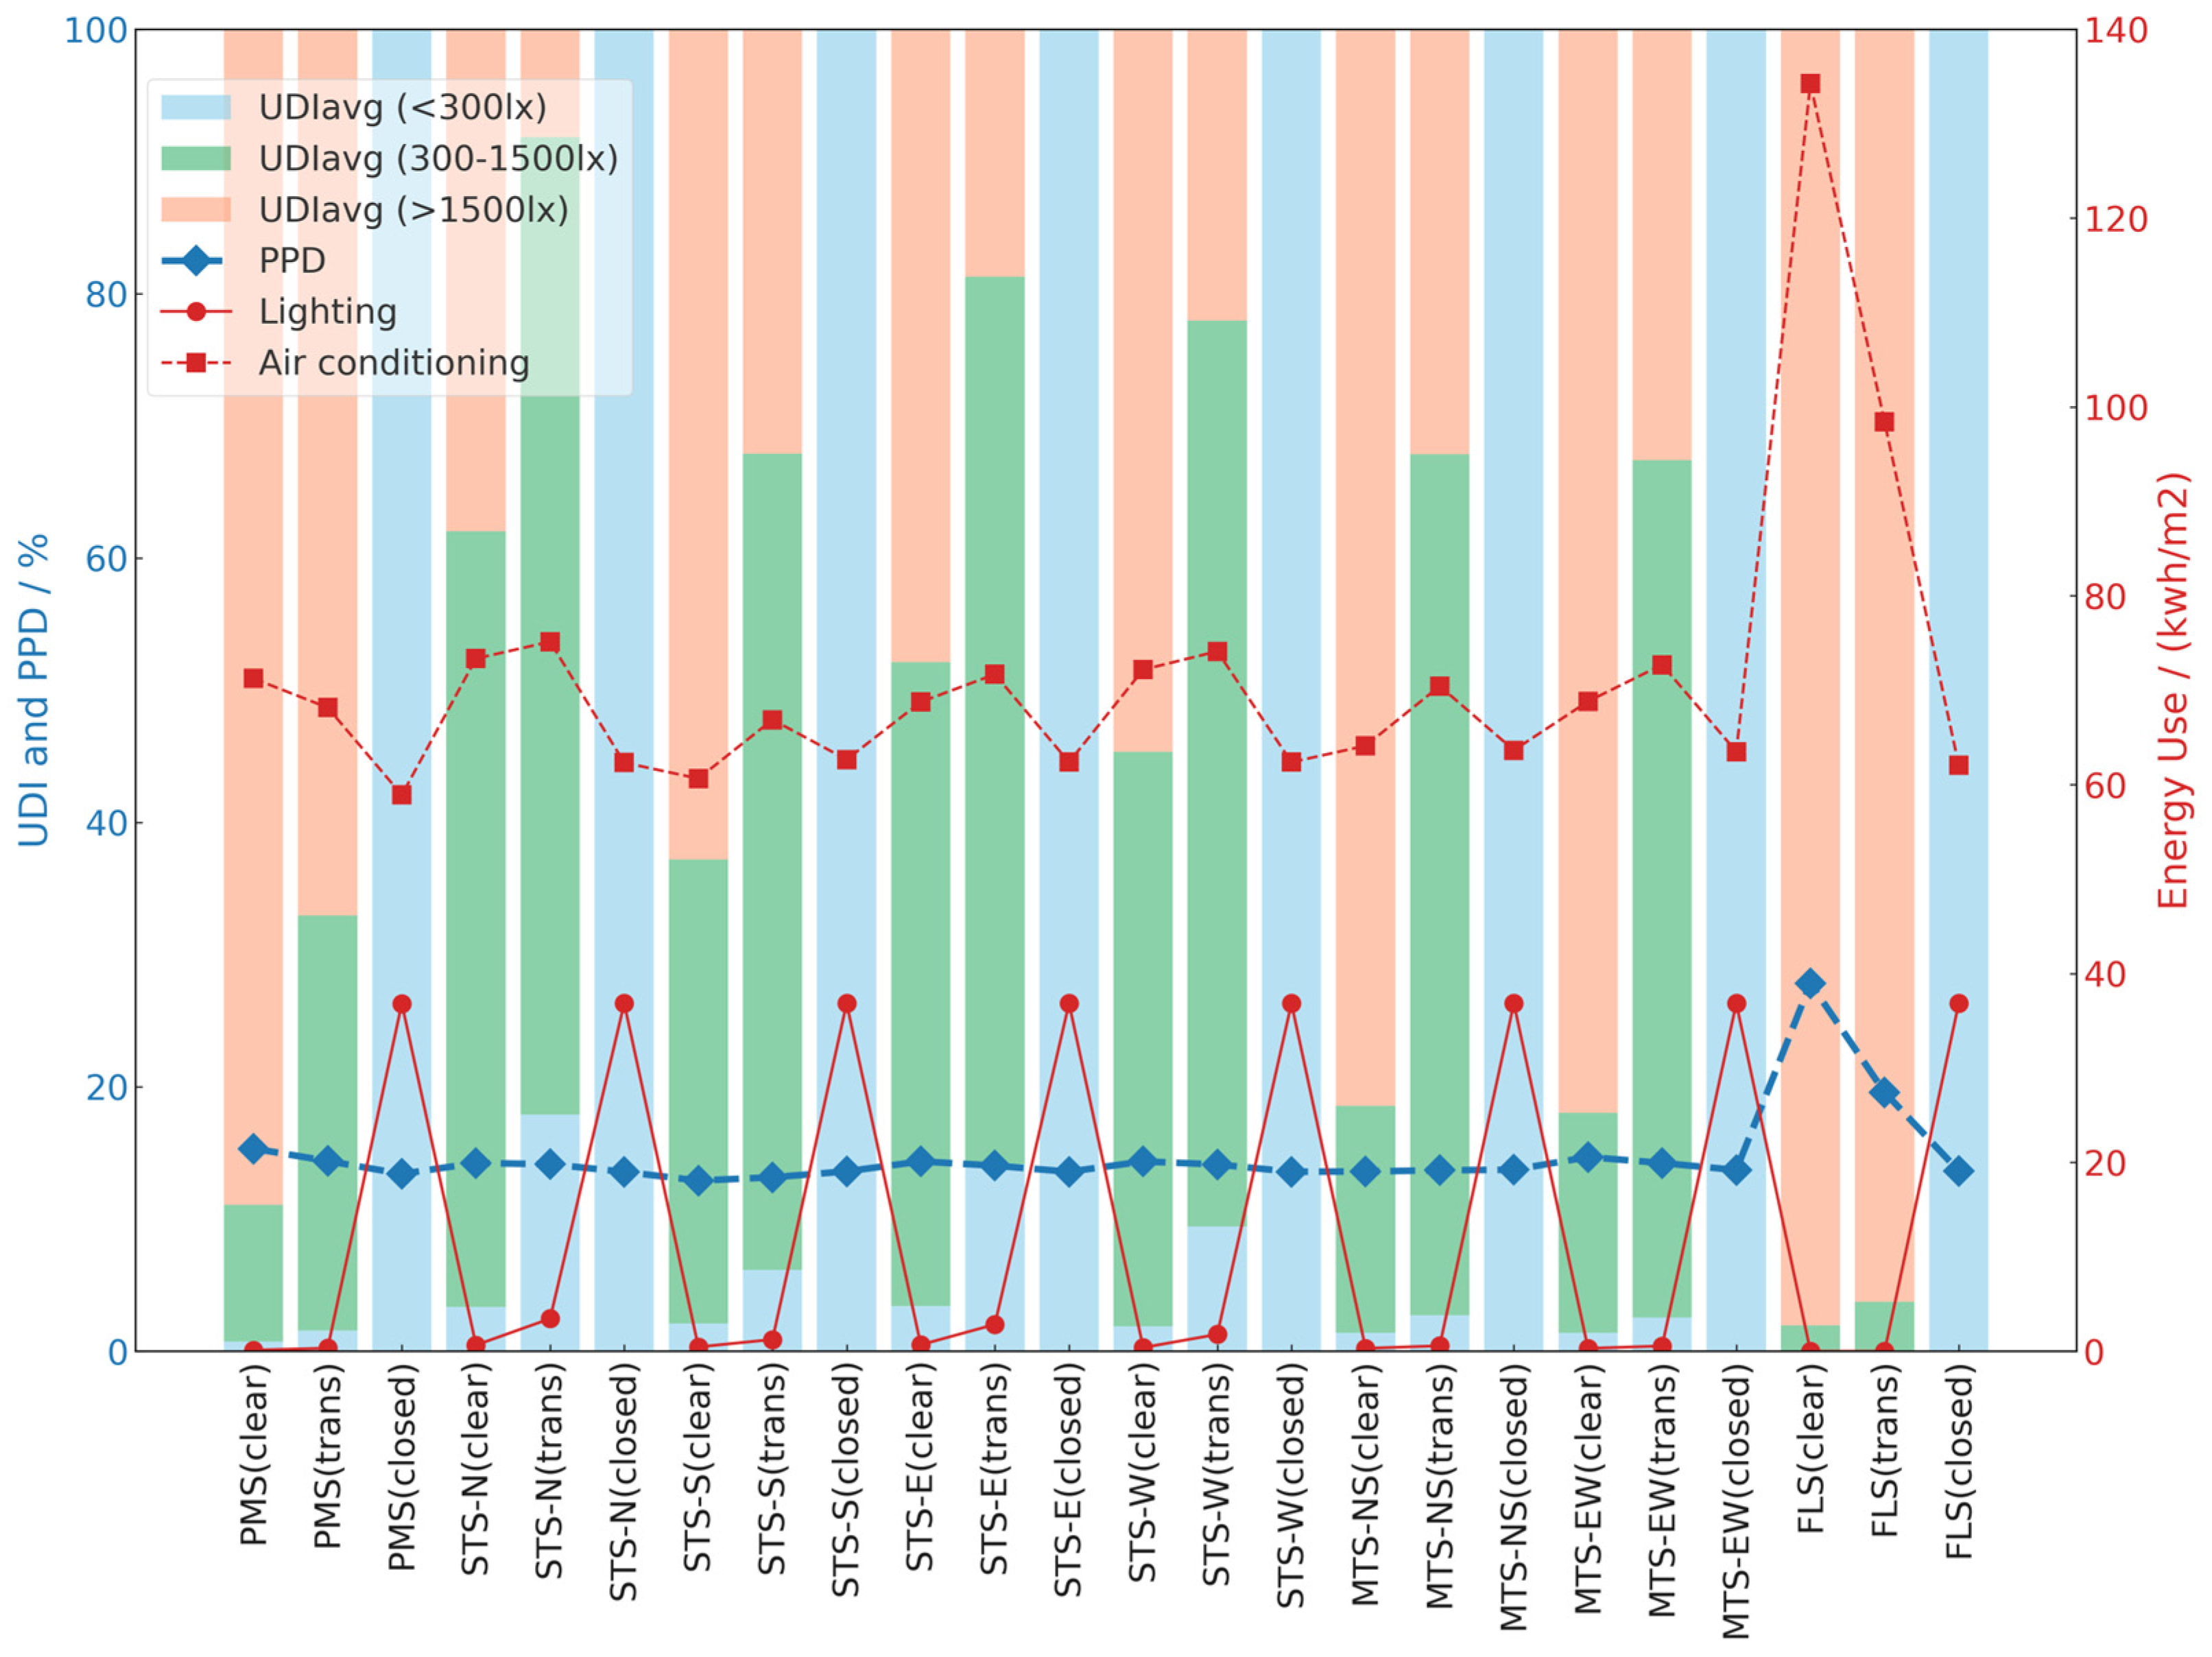
4.1. Base Model Simulation Analysis

To evaluate the effectiveness of optimization strategies, we conducted an analysis of the baseline models for each case, with a focus on performance evaluation in terms of daylight availability, thermal comfort, and energy consumption. Each baseline model was categorized into three types: using transparent materials for openings, using diffusing materials for openings, or being completely enclosed. Figure 5 presents the results for each exhibition space, showing the UDIavg values; average PPD values; and energy consumption for cooling, heating, and lighting during occupancy. The UDIavg values are represented as stacked bar charts with different colors indicating different UDIavg ranges. The UDIavg (<300 lux) for the completely enclosed condition are displayed as 100%. PPD and energy consumption are represented using line charts.
In terms of daylighting performance, compared to STS and MTS, PMS and FLS exhibit lower UDIavg (300–1500 lux) values overall. This difference is not influenced by the material of the opening parts, and for most of the year, the average illuminance exceeds 1500 lux. This may be because in the baseline models, the opening direction of PMS and FLS is essentially facing upward, allowing more direct sunlight to enter the indoor space when the sun’s altitude angle is higher. Clearly, there is an excess of daylight in various working areas, indicating that the current single window design is insufficient to meet the needs of the exhibition space. Figure 6 shows the sun path diagrams for representative days throughout the year at the summer solstice, autumnal equinox, and winter solstice for the basic rectangular box model. The colors represent the Global Horizontal Radiation at different time points. It can be observed that there are significant differences in solar radiation entering the interior space during different seasons and times of the day.
On the other hand, UDIavg values for STS and MTS are significantly affected by orientation and glass material. Under transparent materials, STS-N (clear) has a higher proportion of useful daylight time compared to other orientations, consistent with the conventional use of sawtooth skylights for north-facing daylighting. UDIavg values for STS-E (clear) and STS-W (clear) are similar, ranging from 40% to 50%. STS-S (clear) is more affected by direct sunlight, resulting in less available daylight throughout the year.
Meanwhile, regardless of the north-south or east-west orientation, MTS shows lower UDIavg (300–1500 lux) values. This could be due to the higher amount of direct sunlight entering south-facing orientations throughout the day and the combined impact of direct sunlight during sunrise and sunset for east-west orientations, leading to significantly less available daylight throughout the year compared to the single orientation of STS. Overall, all cases with transparent materials experience excessive annual sunlight exposure, confirming the need for improvements in the current daylight systems. Under diffused materials, all cases of STS and MTS have UDIavg (300–1500 lux) values exceeding 60%, demonstrating a higher potential for daylight utilization with the use of diffused glass. However, in some cases, such as STS-S (trans) and MTS-EW (trans), the UDIavg (>1500 lux) data still exceed 30%, indicating considerable room for optimization even if all opening parts use diffused materials.
The PPD values of PMS, STS, and MTS are close, generally ranging from 13% to 16%. The recommended indoor thermal comfort is to maintain the PMV value within the range of ±0.5 while ensuring PPD is below 10% [49]. Although the daylighting conditions of these three skylight types slightly exceed the recommended range, most individuals still perceive comfort and satisfaction within this environment. However, there is still some room for optimization. It is noteworthy that the PPD value of FLS significantly exceeds the recommended range, potentially due to excessive direct sunlight exposure. These results indicate that variations in skylight daylighting, while maintaining the building envelope unchanged and equipping the rooms with air conditioning, have a limited impact on indoor thermal comfort. However, if the total amount of incoming solar radiation remains excessive, it may still result in significant thermal discomfort indoors. Therefore, further optimization measures are required to ensure the comfort of the indoor environment.
Regarding the annual energy consumption, we observed a significant correlation between lighting energy consumption and UDIavg (<300 lux) values, which aligns with the fundamental operating principles of daylight control systems. With all openings fully closed, the lighting energy consumption for all cases reaches 36.8 kWh/m2/year, accounting for approximately 37% of the total energy consumption. This far exceeds the lighting energy levels when daylight utilization is factored in, highlighting the importance of employing daylight in exhibition spaces for energy efficiency. It should be noted that cases with excessively low lighting energy consumption, such as PMS and FLS, may be due to an overabundance of daylight. Therefore, in the assessment of energy consumption for optimization schemes, it is essential to consider the utilization of daylight. On the other hand, the proportion of air conditioning energy consumption in the total energy consumption is significantly higher than that of lighting energy consumption. Apart from FLS, the baseline models show only marginal differences in air conditioning energy consumption when utilizing transparent materials and diffusive materials. However, both models exhibit significantly higher energy consumption compared to the fully enclosed cases. This implies that daylight utilization has a discernible impact on the energy requirements for cooling and heating. By optimizing the layout of the openings, better control over solar radiation gain and heat loss can be achieved, resulting in reduced energy demand.

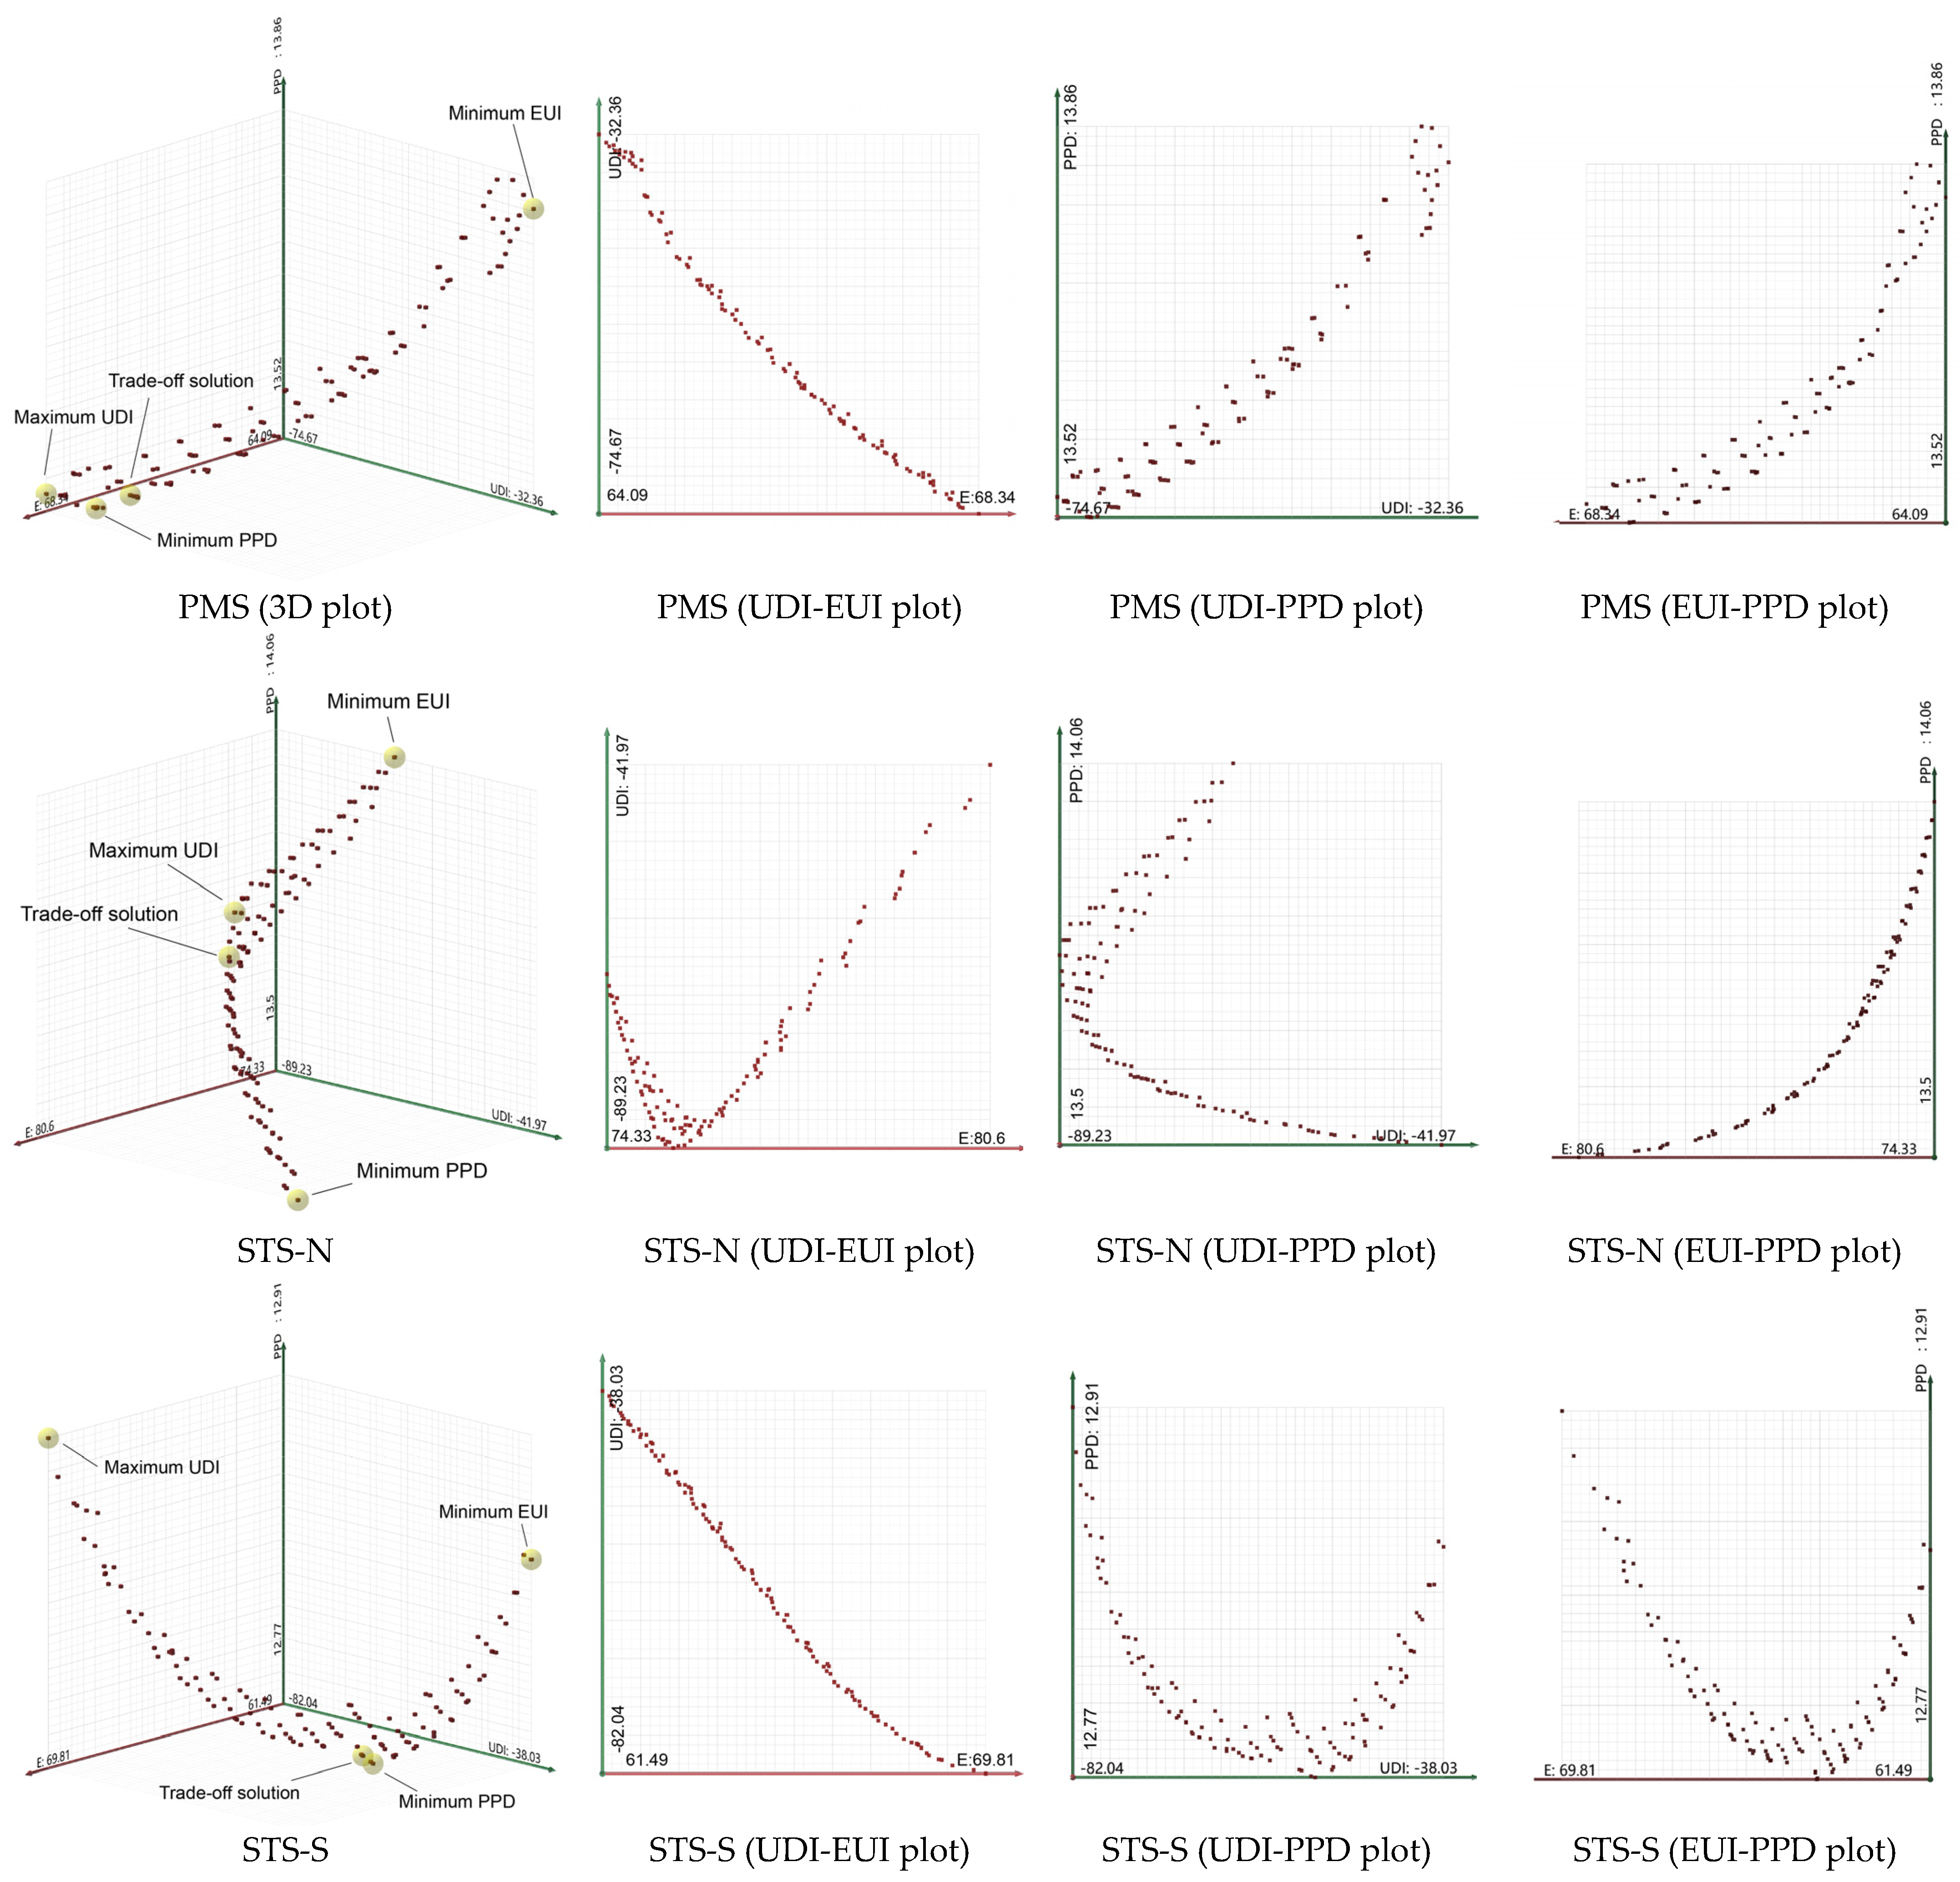
4.2. Optimization Solutions for Case Studies

After iterating through 200 generations in the simulation loop, each case’s solution set demonstrated good convergence. This signifies that the genetic algorithm has achieved remarkable advancement in multi-objective optimization and effectively explored a broad search space. Figure 7 presents the optimization results of the last generation of all cases in the three-dimensional space, where the X-axis represents UDIavg (300–1500 lux), the Y-axis represents EUI, and the Z-axis represents PPD. The red blocks represent non-dominated solutions, forming the Pareto front in the three-dimensional space.
The extreme solutions for various optimization objectives, as well as the optimal trade-off solution determined based on the fitness function (Equation (1)), are explicitly marked. From the Pareto front scatter plots across all cases, it is revealed that the distribution of solutions manifests a pronounced stair-step characteristic rather than a continuous distribution. This characteristic deviates from conventional multi-objective optimization findings in architecture, attributable to the use of subdivided individual grids as design variables in the proposed multi-objective optimization process. Each grid alteration could induce significant fluctuations in objective values, hindering their continuity.
Additionally, extreme values on each plot’s axes reveal substantial disparities in optimization outcomes for different metrics. The disparity between the maximum and minimum values of UDI is notable, clearly indicating that changes in openings have a direct impact on indoor daylighting efficiency. The disparity in EUI values suggests that the daylighting, solar heat gain, and heat loss effects introduced by openings play a certain role in overall energy demand. Subtle shifts in PPD suggest solutions causing significant thermal discomfort from excessive sunlight were excluded during optimization.
From the shifts in these metrics, two primary distribution features are discernible. The first observation is that in the PMS and MTS-NS cases, a linear relationship is evident amongst the metrics on the Pareto frontier. In PMS, an increase in UDI is accompanied by an increase in EUI. This trend is likely influenced by Fukuoka City’s climatic traits, where winter heating demands surpass summer cooling needs. To achieve minimal energy consumption, there is a need to judiciously increase transparent window areas to harness solar heat. Yet, increasing these windows can lead to a direct sunlight influx, reducing UDI. Consequently, a rise in UDI suggests a measured reduction in window area, culminating in a rise in EUI. As UDI escalates, PPD shows a slight decline, always remaining under 15%. This underlines that a well-considered window distribution, facilitating appropriate daylight use, positively impacts thermal comfort. However, given the intricate seasonal shifts in comfort needs, the solar heat gain from windows can only offer limited comfort enhancement annually. In the EUI-PPD association, a rise in EUI aligns with a dip in PPD—a consistent pattern since higher EUI correlates with elevated UDI values. On the other hand, while the MTS-NS case exhibits a similar UDI and EUI trend as PMS, the relationship between UDI-PPD and EUI-PPD is diametrically opposite. This contrast could be tied to the unique window orientations of this case. To achieve minimal energy consumption here, it is essential to maximize south-facing transparent windows. However, excessive daylight results in a UDI drop. Hence, an increase in UDI signifies reduced south-facing windows, causing an uptick in EUI. For UDI-PPD and EUI-PPD, as UDI and EUI rise, PPD follows suit, a consequence of predominant winter solar radiation heat only arriving from specific angles of south-facing direct light. Reducing south-facing windows can, therefore, lead to insufficient heating, degrading thermal comfort.
The second characteristic is observed in STS, FLS, and MTS-EW, where parabolic optimization results have been noted in all directional cases. Except for STS-S, a trend is evident where a decrease in EUI leads to an increase in PPD, but no clear linear relationship exists between UDI-EUI and UDI-PPD. This might be attributed to the use of diffusive materials in certain locations, causing specific window distributions to reach UDI extremities, but the consequent energy consumption variations are not as influential as those caused by transparent glass. When transparent and diffusive glasses are combined, maximizing UDI, the alteration of transparent windows correlates with optimal directions for the extremal values of EUI and PPD, establishing a negative linear correlation. Conversely, in MTS-NS and PMS, a broader range and a more diverse combination of patterns are available to evade this extremity effect due to their capacity to offer extensive variations. This is likely because the north-facing aspects solely provide daylight performance without affecting the solar heat gains, ensuring UDI performance while minimizing the direct sunlight impacts on both UDI and EUI from the south. Similarly, the relationships among other indices have also been simplified to linear ones. In STS-S, with a reduction in EUI, UDI reduces too. No clear linear relationship is seen between PPD-UDI and PPD-EUI. High daylighting efficiency and solar heating of south-facing windows could increase the combination possibilities for UDI and EUI extremum solutions, allowing PPD to reach its peak in certain window layouts. Increasing and decreasing windows could then correspond to the optimal directions for EUI and UDI extrema, establishing a positive linear relationship.
In summary, the methodology of combining transparent and diffusive materials can significantly influence the metric variations in most scenarios, elucidating the necessity of optimizing exploratory efforts on the distribution characteristics of openings. Moreover, in cases combining both south and north orientations, the northern daylight tends to mitigate the simultaneous impacts of direct sunlight on UDI and EUI, offering more combinational possibilities for optimizing opening distributions.
In the architectural design decision-making process, architects can choose any solution from the Pareto front according to their needs, where the optimal trade-off solution (S1) refers to the solution with the highest fitness function score (Y value) in the optimization set. Figure 8 illustrates the opening distribution characteristics and spatial distribution of UDIavg (300–1500 lux) for one optimal solution and three extremum solutions for each case model, aiming to better understand the relationship between design variables and objectives as well as distinctions between model types. The corresponding Y values, WFR, UDI, EUI, and PPD for each solution are summarized in Table 6.

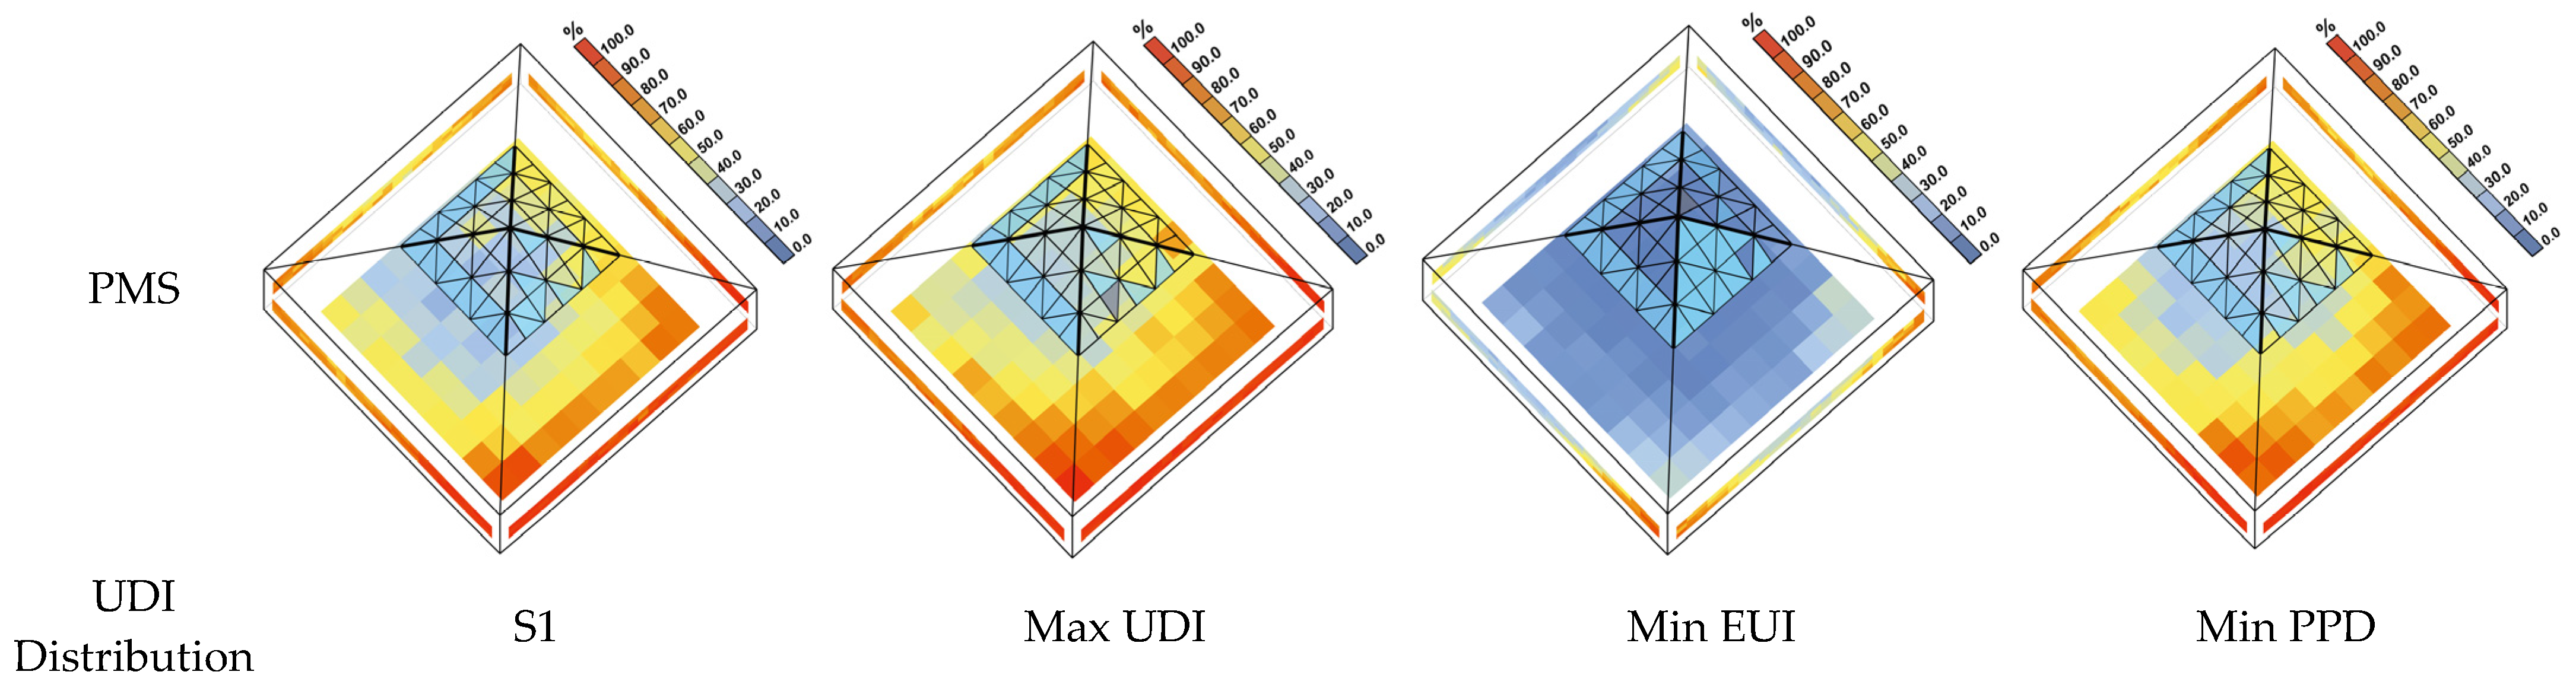
4.2.1. Pyramid Skylight (PMS)

The WFR value of the optimal trade-off solution (S1) for PMS is 0.104, approximately half of the baseline model. This indicates that the optimization process chosen closes more apertures to better meet the requirements. Compared to the baseline model with fully transparent and fully diffusive materials, the S1 model achieves UDI, EUI, and PPD values of 69.17%, 67.42 kWh/m2, and 13.53%, respectively. These data indicate improvements across all metrics for the S1 model, with UDI showing a particularly significant enhancement. The maximum UDI solution and the minimum PPD solution have WFR values and three metric values that are very close to S1, indicating that the optimization of S1 has reached a relatively good balanced state. Although the minimum EUI solution has about a 5% optimization in EUI values compared to the optimal solution, it shows a huge gap in the Y value and the other two metrics, indicating that it represents an extreme tendency of optimization. Observing the distribution of UDI within the optimized space of S1, most surfaces have UDI values higher than 50%. However, in the northern area, UDI values on the ground and walls are relatively lower, possibly due to excessive illumination caused by the angle of sunlight incidence. In terms of window design, it is noteworthy that all windows were selected as transparent materials and mainly located in the north, south, and west directions. Such optimization decisions are likely based on higher heating demands since transparent materials bring significant solar heat gains. This also implies limitations on the use of diffusive materials in such scenarios. Additionally, many windows were primarily placed at the lower part of the pyramid rather than its top. This is likely because the top of the pyramid is susceptible to intense direct sunlight, leading to a rapid decrease in UDI values. Moreover, due to the sloping angles of the pyramid-shaped roof, daylight entering from the lower part is more likely to produce diffusive reflections on the opposite ceiling. This reflection helps distribute direct sunlight more evenly throughout the interior. The optimal UDI and PPD solutions closely resemble the S1 solution in terms of window design, with their key metrics showing very similar performance. On the other hand, although the optimal EUI solution achieve a certain reduction in energy consumption, it leads to a significant decrease in UDI and an increase in PPD. It is worth noting that this solution features a noticeable increase in windows on the south and west sides. These results imply that the S1 solution achieves a state close to optimal for both lighting and thermal comfort. While adding more windows can further reduce heating demands by harnessing solar heat, it may compromise the performance of other critical metrics.
From the data and analysis presented above, it becomes evident that in PMS, characterized by a core feature of centrally concentrated light sources at the top, the most ideal window design appears to be distributed and concentrated in non-top areas. This approach challenges conventional understandings and expectations of central light source design to some extent.

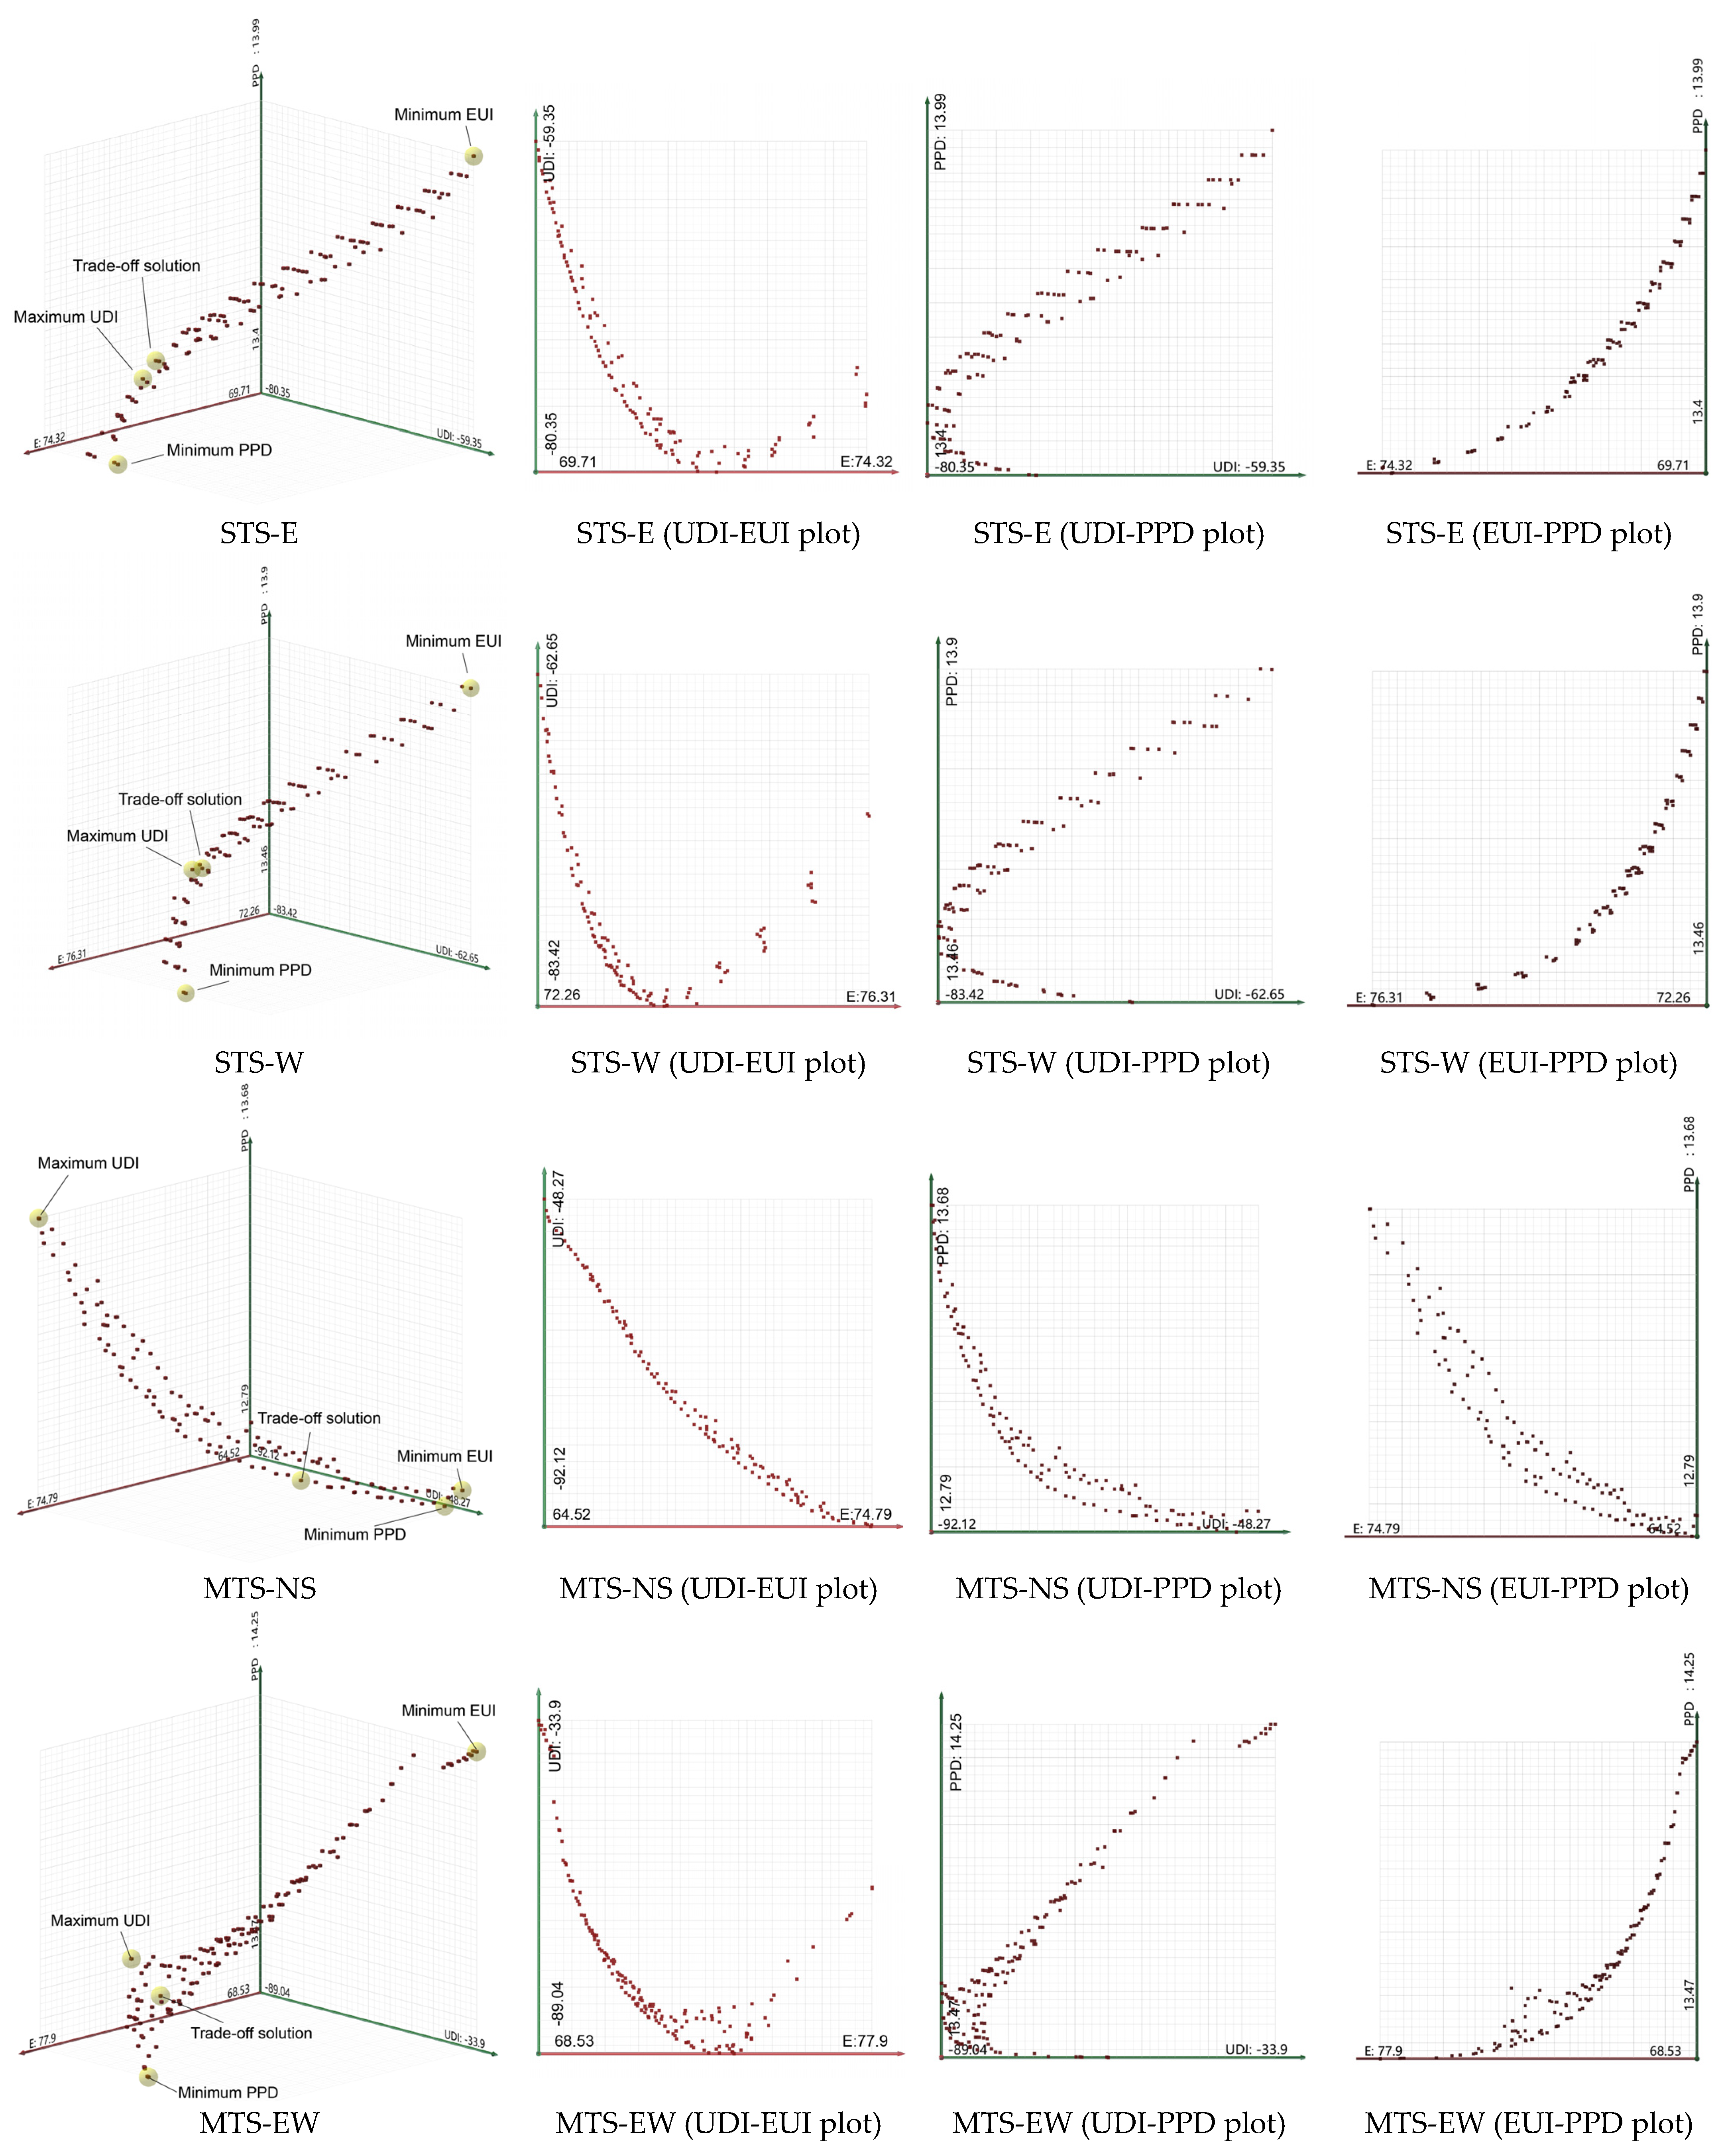
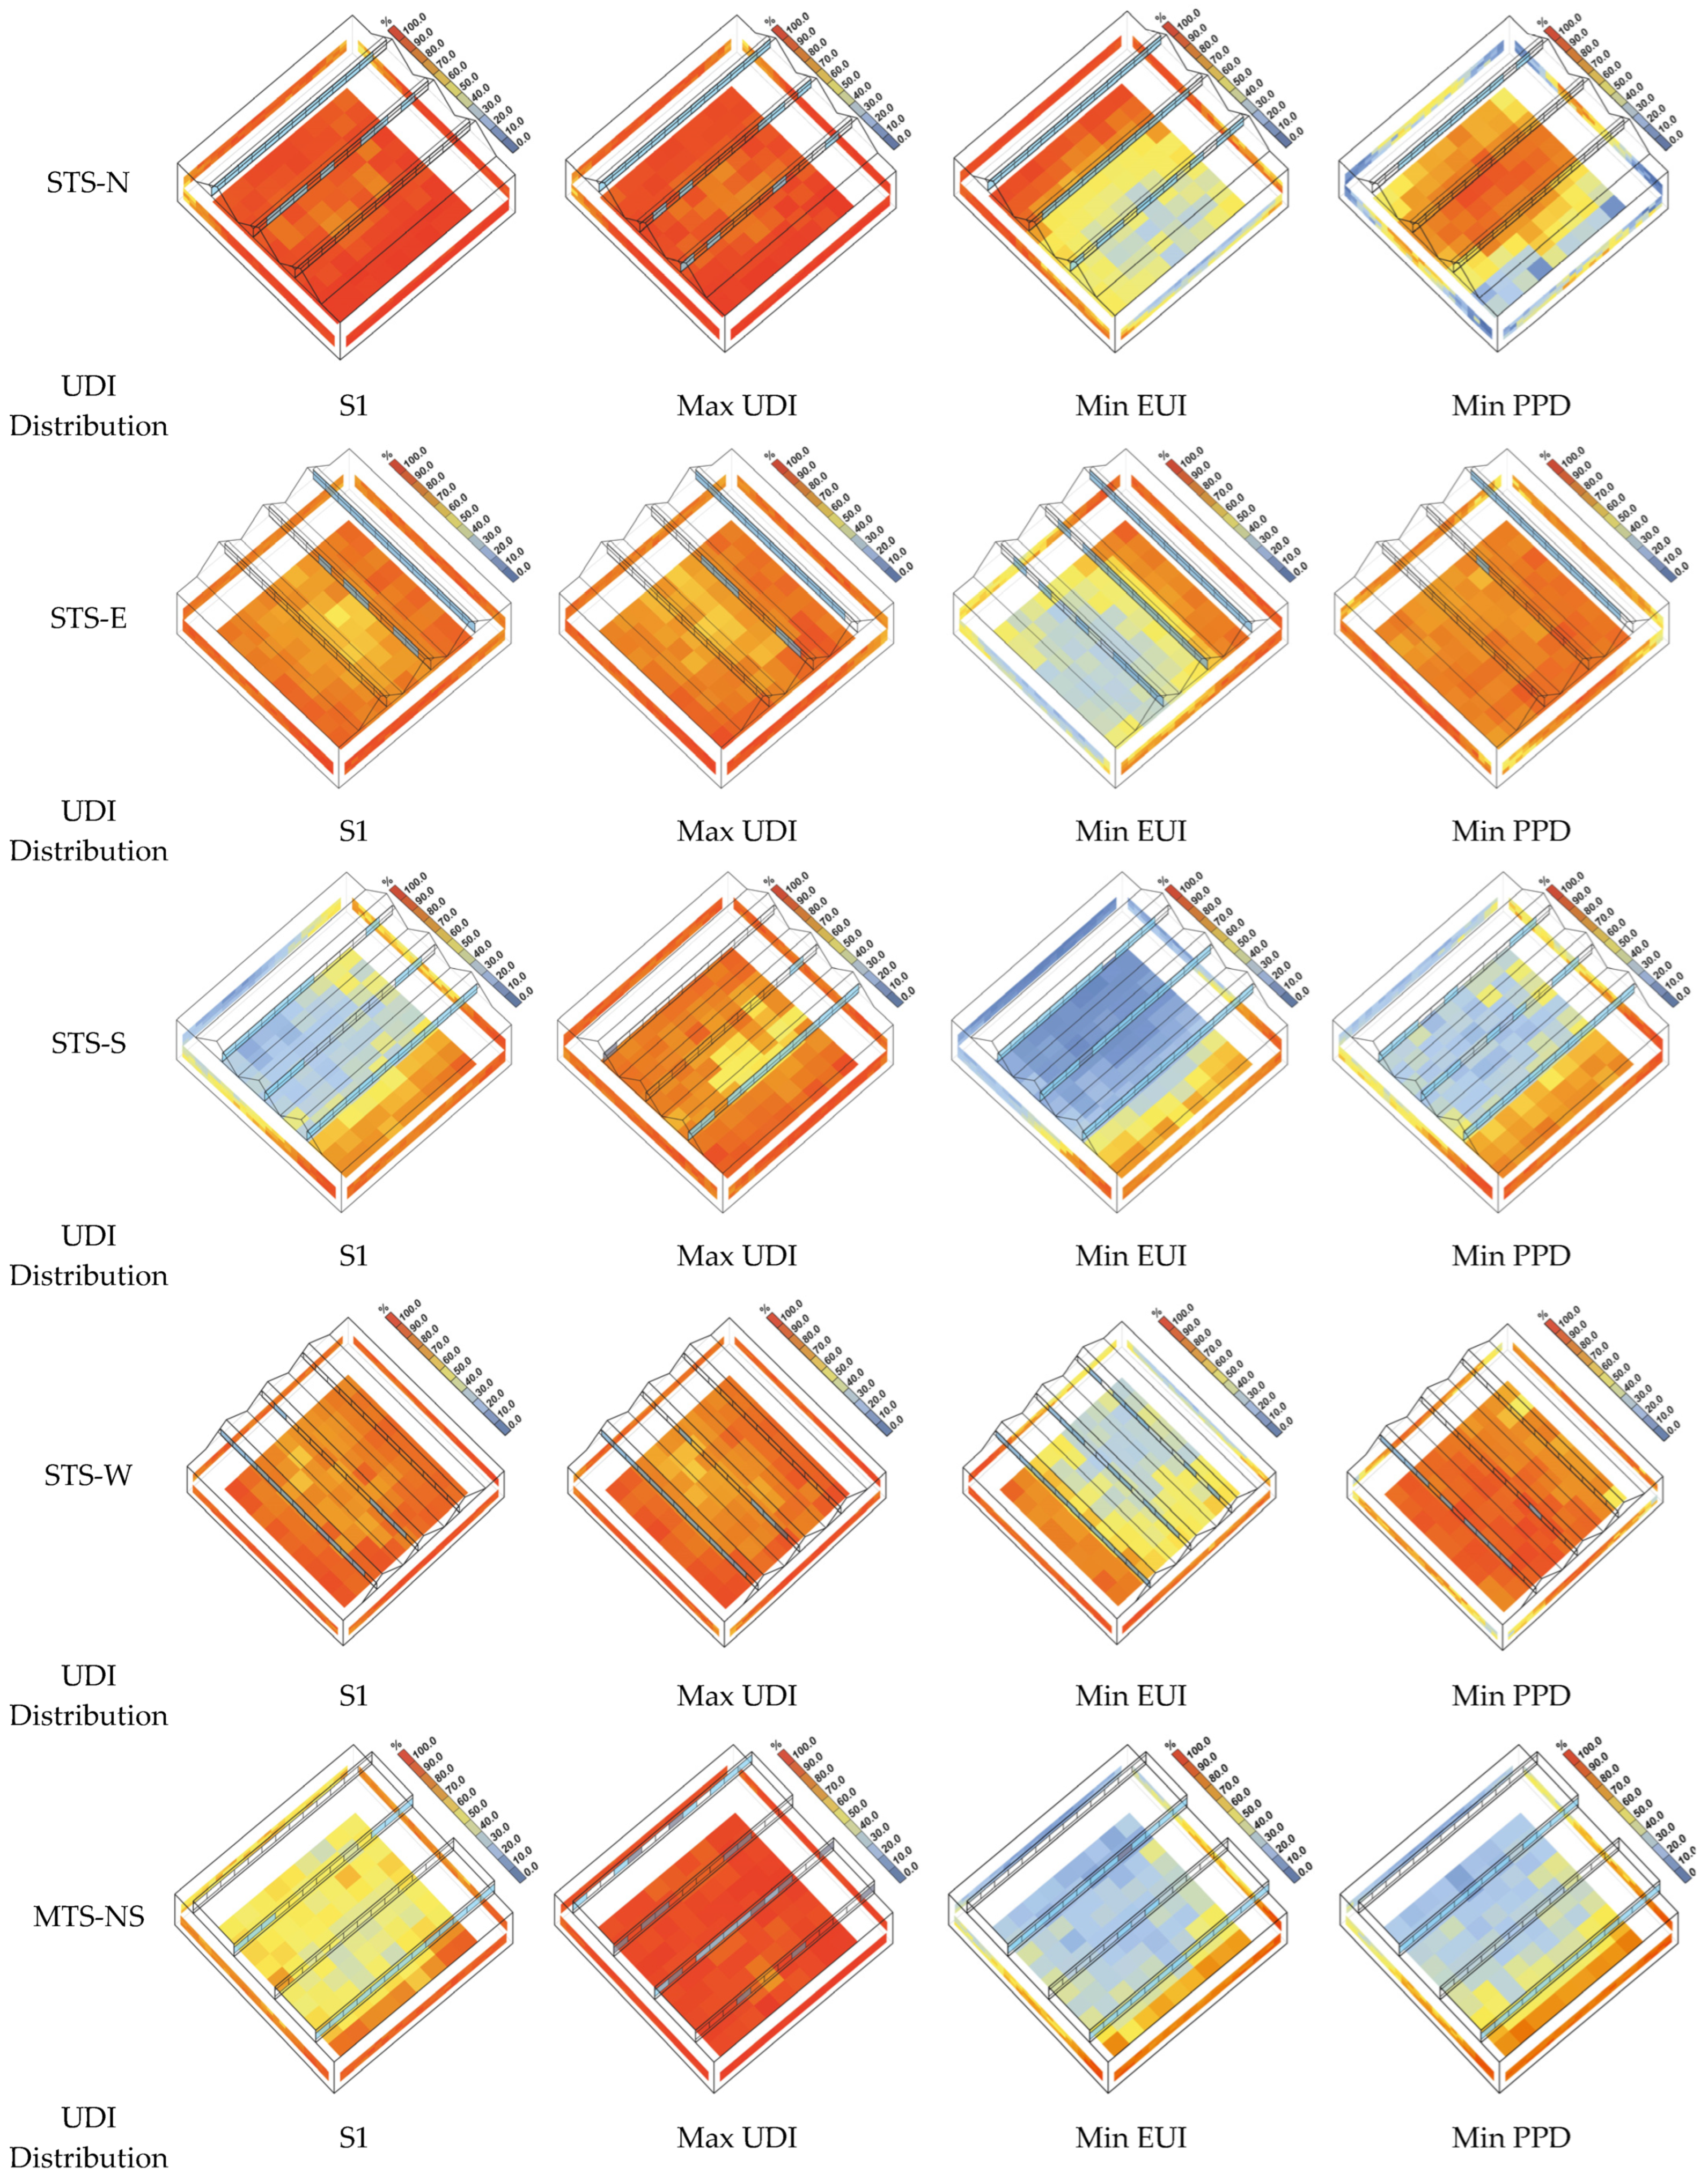
4.2.2. Sawtooth Skylight (STS)

In the case of STS categorized by different orientations, there are four scenarios for discussion. In the north-facing STS-N, the optimal trade-off solution (S1) yields a WFR value of 0.112, approximately half of the baseline model. When compared to the baseline model, the S1 for UDI, EUI, and PPD achieves values of 88.31%, 75.70 kWh/m2, and 13.72%, respectively. Except for a slightly higher EUI compared to the fully transparent case, all other performance metrics exhibit improvements. The WFR and the three metric values of the maximum UDI solution are very close to those of S1, indicating that lighting optimization plays a significant role in the north-facing case. Although the minimum EUI solution and the minimum PPD solution both have a large gap in the Y value compared to S1, they demonstrate two distinct tendencies. The former has a significantly increased WFR, while the latter has a notable reduction, reflecting two extreme optimization tendencies consistent with what is shown in Figure 7. Examining the spatial distribution of UDI in S1 after optimization, most surfaces attain UDI values exceeding 80%, displaying a uniform distribution in line with the absence of direct sunlight in the north direction. Regarding window design, transparent materials were exclusively chosen, with a preference for north-facing placement. This configuration appears closely related to the spatial form. The row of windows situated furthest north has the most prominent impact on illuminating the entire space. Conversely, windows further south have a smaller influence on the space and may result in localized over-illumination. The optimal UDI solution closely resembles S1 in terms of window design, and both exhibit proximity in key performance metrics. On the other hand, in order to harness the winter heating effect of the sun, the window configuration in the optimal EUI solution closely aligns with the fully transparent baseline model. The optimal PPD solution selects a reduction in some windows, sacrificing UDI and EUI performance in exchange for a more stable indoor environment, albeit with no significant difference in PPD values compared to S1.
The optimal trade-off solutions (S1) for STS-E and STS-W exhibit close WFR values, approximately half of the baseline model. Compared to the baseline model, S1 for both orientations reaches 80.31% and 83.24% for UDI, 71.96 kWh/m2 and 73.64 kWh/m2 for EUI, and 13.52% and 13.56% for PPD. Excluding EUI, all metrics show significant improvements. The maximum UDI solutions for these two cases have WFR as well as three metric values that are very close to those of S1, indicating that in the east- and west-facing cases, similar to the north-facing case, daylighting optimization still holds substantial weight. Although the minimum EUI solution and the minimum PPD solution both show significant disparities in the Y values compared to S1, they exhibit two distinct tendencies. The former has a markedly increased WFR, while the latter is significantly decreased, demonstrating two extreme optimization tendencies. The optimized solutions S1 reveal excellent UDI distribution within the space, with most surfaces exceeding an 80% UDI and exhibiting uniform distribution. All windows in these solutions employ transparent materials, and the window layouts for STS-E and STS-W are notably symmetrical. The primary window designs are situated close to their main orientations, which is likely due to the room geometry, as windows closer to the main orientations bring daylight to a larger area. As for the optimal UDI, EUI, and PPD solutions, their characteristics closely resemble those of STS-N. This similarity could be due to the fact that, although the east and west orientations do receive direct sunlight during certain periods, they primarily rely on diffuse sky radiation like the north orientation for most of the time.
For STS-S, the optimal trade-off solution (S1) shows a WFR value of 0.154, constituting about two-thirds of the total window area. Compared to the baseline model, S1 reaches 55.16% for UDI, 64.09 kWh/m2 for EUI, and 12.77% for PPD. Besides PPD, other metrics do not show significant improvements. The WFR and the three metric values of the minimum PPD solution are very close to those of S1, indicating that thermal comfort has a significant influence on the optimization choices in the south-facing case. Although the minimum EUI solution and the maximum UDI solution both have a significant difference in the Y value compared to S1, they demonstrate two different tendencies. The former shows a significant increase in WFR, while the latter shows a notable decrease, reflecting two extreme optimization tendencies. The UDI distribution of S1 indicates that the space is significantly influenced by direct south-facing sunlight, resulting in a lower UDI in many areas. All windows in this solution use transparent materials and are distributed across different areas. This choice is likely influenced by solar heat gain, and S1 could be viewed as a balance between solar heat gain and adequate daylighting. Compared to S1, the optimal UDI solutions reduce the number of windows and improve UDI significantly by replacing most transparent windows with a small amount of diffusing glass, although this results in some increases in EUI and PPD. The optimal PPD solution is overall similar to S1, and due to solar gains in winter, the optimal EUI solution closely resembles the all-transparent baseline model.
From the data and analyses presented, it is clear that for STS systems characterized by a single-direction light source, window distribution is notably influenced by the spatial geometry. Windows should be preferentially arranged in areas that can impact a larger spatial extent. Except for the south orientation, windows facing north, east, and west produce quite similar effects and adequately meet various requirements. For south-facing orientations, optimization results indicate that balancing solar heat gains and daylight utilization can be challenging when direct sunlight is abundant. This requires careful consideration based on actual conditions. Additionally, when the primary focus is on daylighting performance, significant improvements to the indoor lighting environment can be achieved by installing windows with diffusing materials in specific areas, without the need for large expanses of windows.

4.2.3. Monitor Skylight (MTS)

In MTS, two scenarios can be examined based on orientation. For MTS-NS with a north-south orientation, the optimal trade-off solution (S1) displays a WFR value of 0.112, approximately one-third of the total window area. Compared to the baseline model, S1’s UDI, EUI, and PPD are 68.70%, 67.54 kWh/m2, and 12.85%, respectively. Apart from a slightly higher EUI than the fully transparent baseline model, other metrics exhibit some improvements. The values of the three measures in the minimal EUI solution and the minimal PPD solution closely align with those of S1, but there is a noticeable difference in WFR. This indicates that in the north-south oriented cases, there are more combination options available, and the S1 optimization has reached a relatively balanced state. Meanwhile, the Y values in the maximum UDI solution differ significantly from S1, representing a tendency towards extreme optimization. The UDI distribution pattern of S1 in MTS-NS is similar to that of STS-S, attributable to the exclusive use of south-facing windows, eliminating north-facing ones. The windows are transparent and are mainly situated near the southern side, signifying spatial geometry’s influence. Compared to S1, the optimal UDI solution reduces south-facing transparent windows, replacing them with a small amount of diffusing glass, and adds numerous windows facing north, improving UDI but leading to a slight increase in EUI and PPD. The optimal PPD and optimal EUI solutions mainly share a similar window design, with most windows located on the south side and very few on the north.
For MTS-EW with an east-west orientation, the optimal trade-off solution (S1) shows a WFR value of 0.101, constituting approximately one-third of the total window area. Compared to the baseline model, S1 achieves 86.95% for UDI, 73.13 kWh/m2 for EUI, and 13.54% for PPD. All metrics, except for EUI, show substantial improvements. The maximum UDI solution’s WFR, as well as the values of the three other metrics, are very close to those of S1, indicating that in east-west oriented cases, similar to the STS ones, daylighting optimization still holds significant weight. The minimum EUI solution and the minimum PPD solution, despite having Y values that largely differ from S1, exhibit two different trends. The former shows a notable increase in WFR, while the latter shows a significant decrease, revealing two opposite optimization tendencies. The optimized solution S1 reveals excellent UDI distribution, with most surfaces exceeding 80% UDI, displaying uniform distribution. Windows are transparent and predominantly located near the eastern and western edges of the room, likely influenced by room geometry and variations in solar radiation. The optimal UDI solution incorporates some diffusing glass to disperse light more uniformly across the space, albeit with limited overall gains. The optimal EUI and optimal PPD solutions display different design approaches. Specifically, the optimal EUI solution leans toward increasing transparent windows to harness more solar radiation for reduced energy consumption, while the optimal PPD solution tends to minimize transparent windows to mitigate direct sunlight, maintaining a stable indoor environment.
From the data and analysis presented, it is evident that the bi-directional light source MTS offers a greater variety and flexibility in window design compared to STS. The optimal trade-off solution for window layout challenges traditional design expectations. Although still influenced by the spatial geometry, MTS demonstrates highly flexible window configurations across various orientations and for different optimization goals, achieving acceptable results post-optimization.

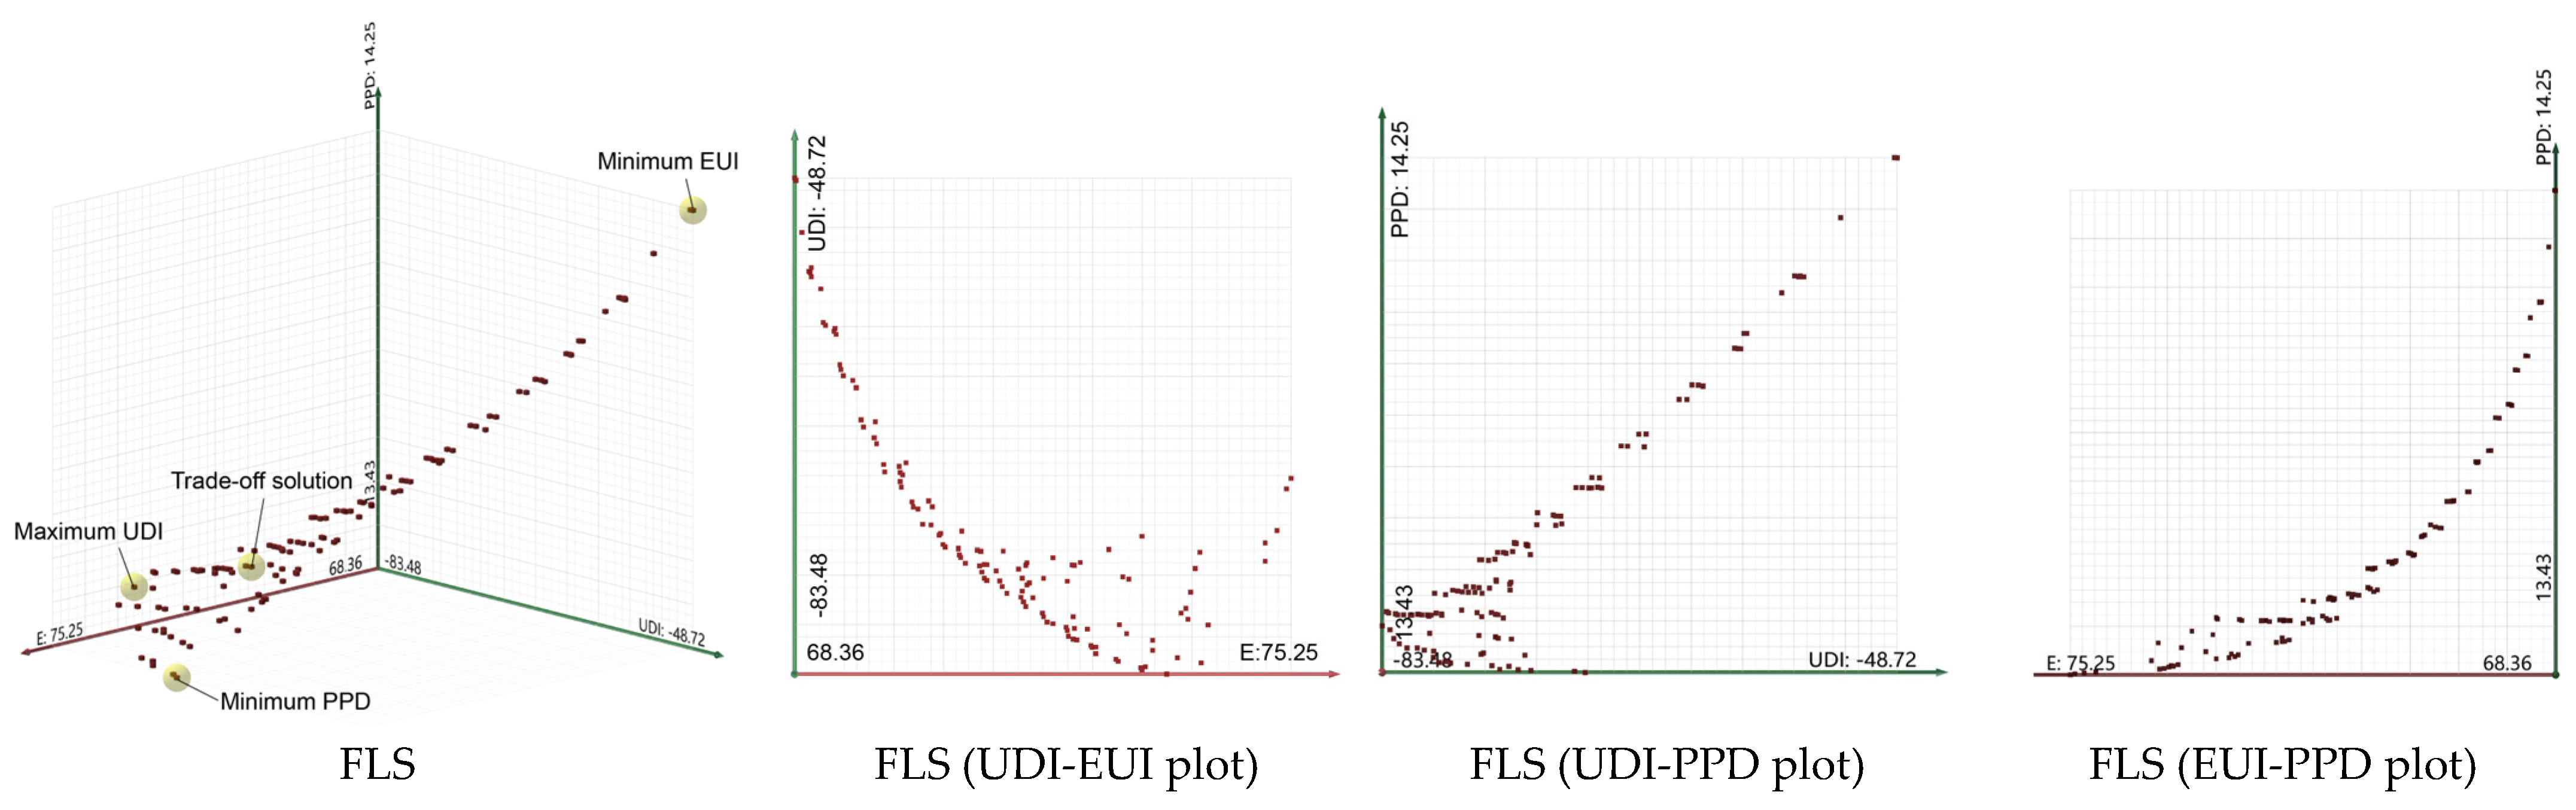
4.2.4. Flat Skylight (FLS)

The optimal trade-off solution (S1) and extremum solutions of FLS exhibit distinctive characteristics inherent to horizontal daylighting. S1 is a model with a WFR of 0.059, approximately one-tenth the size of the comprehensive daylighting baseline model. This indicates that the optimization favors enclosing the majority of openings while requiring only a minimal open area to effectively meet the requirements. Compared to the baseline model, the S1 model achieves significant improvements in UDI, EUI, and PPD, reaching 79.83%, 71.87 kWh/m2, and 13.52%, respectively. The maximum UDI solution’s WFR and the values of the three other metrics are extremely close to those of S1, illustrating that daylighting optimization holds considerable significance in planar cases. The minimum EUI solution and the minimum PPD solution, despite having Y values quite divergent from S1, exhibit tendencies where the former significantly increases in WFR, while the latter notably decreases, demonstrating two extreme optimization directions. Observing the distribution of UDI within the optimized space of S1, except for the northwest area where over-illumination occurs due to the angle of sunlight, most surfaces have a UDI exceeding 70%. In terms of window design, the majority of windows are crafted from transparent materials and are concentrated at the periphery, avoiding the central area. This layout strategy likely arises from the fact that southern openings can have a broader influence on overall spatial daylighting, while northern openings can reflect sunlight into the exhibition area to achieve a more suitable light intensity and distribution. Consequently, the central area is sealed off to prevent excessive direct sunlight. In comparison to the S1 model, the best UDI solution reduces transparent windows on the northern side while increasing diffused windows on the southern side, with overall performance metrics being remarkably similar. The best EUI solution entails placing large windows on the northern side, possibly due to excessive sunlight in the central and southern regions. Meanwhile, the best PPD solution primarily upholds indoor environmental stability by closing off most openings, even though the enhancement in overall comfort is relatively limited.
For a horizontal daylighting FLS model, selecting an irregular window layout near the edges evidently emerges as a superior design approach compared to central windows or windows arranged in a regular pattern along the periphery. Specifically, windows located on the sun-exposed southern side are better suited for utilizing diffusive materials, while northern windows are more appropriate for choosing transparent materials. Such an irregular layout and material combination goes beyond the expectations of conventional design principles and optimization methods.
In summary, the above sections extensively discussed four skylight optimization strategies in multi-objective optimization based on grid division, demonstrating the effectiveness of the positioning and material selection of openings in improving daylight performance, energy efficiency, and indoor thermal comfort. Based on these findings, architects can passively maximize the fulfillment of comprehensive indoor environmental needs in practical applications by adjusting the number of openings or employing diffusive materials at specific locations. Moreover, these research results, from a new perspective, illustrate the implementation of multi-objective optimization using genetic algorithms based on distribution characteristics, providing rich insights and references for studies optimizing based on parameters.

5. Conclusions

This study introduces a novel multi-objective optimization approach aiming to integrate window positions and glass properties to identify the optimal skylight configuration, thereby maximizing daylight utilization and thermal comfort while minimizing energy consumption. In the sun-rich city of Fukuoka, Japan, we conducted case studies on typical daylight systems. The results indicate that this approach can effectively optimize the opening configurations, enhancing their overall performance, with results that are easy to interpret and understand.
In the optimization process, four case models reveal substantial potential for enhancing daylight utilization and energy efficiency. For the PMS model, reducing window area leads to marked gains in UDI, EUI, and PPD, specifically at 69.17%, 67.42 kWh/m2, and 13.53%, respectively. The optimization primarily favors transparent materials, particularly at the lower portions of the pyramid rather than the top, to mitigate excessive direct sunlight and enhance overall lighting and thermal performance. This defies conventional thinking on centralized top lighting, demonstrating that a more dispersed, non-apical window arrangement can be more effective in lighting and thermal comfort. In the direction-specific STS models, the optimal solutions typically utilize transparent materials and contract the window area to about half or two-thirds for balanced performance. Similar optimization results are achieved for north, east, and west orientations, whereas the south necessitates more nuanced adjustments. Window layouts are shaped by spatial geometry and are likely to be distributed where they most broadly influence the space. In the bi-directional light source MTS models, the optimal solutions demonstrate more diverse and adaptable window design strategies compared to the single-source-dependent STS. These design strategies not only accommodate different orientations but also result in improvements across the majority of performance metrics. In the FLS model, closing off most openings and focusing a few transparent or diffused windows at the edge meet daylight and energy performance criteria effectively. This novel window layout and material selection yield notable improvements across performance metrics and challenge traditional design assumptions.
On the other hand, this study still has some limitations. Firstly, due to constraints in computational resources and model complexity, we did not consider the direct impact of shortwave radiation, which is a factor closely related to spatial location, especially the differences between areas exposed to sunlight and those in shaded areas. Currently, in the assessment of thermal comfort, we did not employ virtual sensors but instead used the thermal zone average temperature obtained by Honeybee through OpenStudio/EnergyPlus. Therefore, the PMV-PPD metric in this study should be regarded as the overall average for the space. Given that there are no restrictions on the flow of people within the exhibition space, unlike fixed-position office spaces, every location within the space is of utmost importance. Based on this, our study aimed to evaluate the thermal comfort of the entire space from a macro perspective. In the future, we intend to incorporate shortwave radiation and location effects more effectively into the optimization approach. Meanwhile, the optimization approach introduces a broad search space, but due to the substantial time required for dynamic daylight simulation, the optimization approach can be relatively lengthy even for simplified spatial unit models, which may not keep up with the rapid progress of actual projects. Therefore, future research could consider integrating machine learning models for quick prediction of daylighting performance or energy consumption to speed up the optimization approach. Regarding window design, the current focus of this study was on the selection of the opening position and materials, but it did not take into account the frame ratio and the influence of a wider range of glass materials. In the future, we will consider incorporating parameters such as window frame thickness, color, material selection, and the use of double-glazed or low-emissivity glass to enhance the applicability of the workflow. Furthermore, due to limitations such as computational capacity, we did not take into account factors such as glare protection, sun shading systems, and building facade materials, which also impact the environmental conditions of the exhibition space. Numerically based design variables such as Window-to-Wall Ratio (WWR) and Window-to-Floor Ratio (WFR) were also not included. The current study aimed to preliminarily explore more intuitive optimization solutions from a passive perspective, and we plan to gradually incorporate active and numerical methods in future work. These factors mentioned above serve as limitations of this study, and subsequent work will further investigate how to integrate these elements into the current framework with the aim of providing a broader reference for design strategies.
Despite the existing limitations, our optimization approach enhances the comprehension and selection of daylighting design strategies. Compared to numerical parameters, the optimization results are more intuitive and easily understandable for architects. Furthermore, they can be flexibly applied to different building types and climate zones, such as optimizing the facade opening layouts of office buildings or building renovations and seeking architectural form solutions that adapt to complex environmental and functional needs. These solutions serve as effective tools for achieving climate-adaptive design and improving building performance.

Author Contributions

Conceptualization, J.M.; methodology, J.M.; software, J.M., Q.F. and M.L.; writing—original draft preparation, J.M.; writing—review and editing, J.M., Q.F., T.I. and K.L.; visualization, J.M., Q.F., K.L. and M.L.; supervision, T.I.; funding acquisition, J.M. and Q.F. All authors have read and agreed to the published version of the manuscript.

Funding

This research was funded by the Zhengzhou R&D special fund program (22ZZRDZX39), the High-level Talents Scientific Research Fund Project of Henan University of Technology (2022BS029), the College Student Innovation and Entrepreneurship Training Program of Henan University of Technology (PX-38233961), and JST SPRING, Grant Number JPMJSP2136.

Institutional Review Board Statement

Not applicable.

Informed Consent Statement

Not applicable.

Data Availability Statement

The data presented in this study are available on request from the corresponding author. The data are not publicly available due to privacy restriction.

Conflicts of Interest

The authors declare no conflict of interest.

References

  1. Pavlogeorgatos, G. Environmental Parameters in Museums. Build. Environ. 2003, 38, 1457–1462. [Google Scholar] [CrossRef]
  2. Del Hoyo-Meléndez, J.M.; Mecklenburg, M.F.; Doménech-Carbó, M.T. An Evaluation of Daylight Distribution as an Initial Preventive Conservation Measure at Two Smithsonian Institution Museums, Washington DC, USA. J. Cult. Herit. 2010, 12, 54–64. [Google Scholar] [CrossRef]
  3. Mueller, H.F.O. Energy efficient museum buildings. Renew. Energy 2013, 49, 232–236. [Google Scholar] [CrossRef]
  4. Alrubaih, M.S.; Zain, M.F.M.; Alghoul, M.A.; Ibrahim, N.L.N.; Shameri, M.A.; Elayeb, O. Research and development on aspects of daylighting fundamentals. Renew. Sustain. Energy Rev. 2013, 21, 494–505. [Google Scholar] [CrossRef]
  5. Fathy, F.; Mansour, Y.; Sabry, H.; Refat, M.; Wagdy, A. Conceptual framework for daylighting and facade design in museums and exhibition spaces. Sol. Energy 2020, 204, 673–682. [Google Scholar] [CrossRef]
  6. Zhao, G. The Influence of Natural Light on the Design of Electrical Lighting—Taking Liaohe Art Museum as an Example. J. Phys. Conf. Ser. 2020, 1601, 022009. [Google Scholar] [CrossRef]
  7. Hurlbert, A.; Cuttle, C. New Museum Lighting for People and Paintings. Leukos 2019, 16, 1–5. [Google Scholar] [CrossRef]
  8. Yu, X.; Su, Y. Daylight availability assessment and its potential energy saving estimation—A literature review. Renew. Sustain. Energy Rev. 2015, 52, 494–503. [Google Scholar] [CrossRef]
  9. Kim, C.-S.; Chung, S.-J. Daylighting simulation as an architectural design process in museums installed with toplights. Build. Environ. 2011, 46, 210–222. [Google Scholar] [CrossRef]
  10. Eiz, H.M.; Mushtaha, E.; Janbih, L.; El Rifai, R. The Visual and Thermal Impact of Skylight Design on the Interior Space of an Educational Building in a Hot Climate. Eng. J. 2021, 25, 187–198. [Google Scholar] [CrossRef]
  11. Marzouk, M.; ElSharkawy, M.; Mahmoud, A. Optimizing daylight utilization of flat skylights in heritage buildings. J. Adv. Res. 2022, 37, 133–145. [Google Scholar] [CrossRef]
  12. Marino, C.; Nucara, A.; Pietrafesa, M. Does window-to-wall ratio have a significant effect on the energy consumption of buildings? A parametric analysis in Italian climate conditions. J. Build. Eng. 2017, 13, 169–183. [Google Scholar] [CrossRef]
  13. Goia, F. Search for the optimal window-to-wall ratio in office buildings in different European climates and the implications on total energy saving potential. Sol. Energy 2016, 132, 467–492. [Google Scholar] [CrossRef]
  14. Mangkuto, R.A.; Rohmah, M.; Asri, A.D. Design optimisation for window size, orientation, and wall reflectance with regard to various daylight metrics and lighting energy demand: A case study of buildings in the tropics. Appl. Energy 2016, 164, 211–219. [Google Scholar] [CrossRef]
  15. Zhao, J.; Du, Y. Multi-objective optimization design for windows and shading configuration considering energy consumption and thermal comfort: A case study for office building in different climatic regions of China. Sol. Energy 2020, 206, 997–1017. [Google Scholar] [CrossRef]
  16. Schito, E.; Conti, P.; Testi, D. Multi-objective optimization of microclimate in museums for concurrent reduction of energy needs, visitors’ discomfort and artwork preservation risks. Appl. Energy 2018, 224, 147–159. [Google Scholar] [CrossRef]
  17. Kim, C.-S.; Seo, K.-W. Integrated daylighting simulation into the architectural design process for museums. Build. Simul. 2012, 5, 325–336. [Google Scholar] [CrossRef]
  18. Brzezicki, M. An Evaluation of Annual Luminous Exposure from Daylight in a Museum Room with a Translucent Ceiling. Buildings 2021, 11, 193. [Google Scholar] [CrossRef]
  19. Huang, X.; Wei, S.; Zhu, S. Study on Daylighting Optimization in the Exhibition Halls of Museums for Chinese Calligraphy and Painting Works. Energies 2020, 13, 240. [Google Scholar] [CrossRef]
  20. Huang, X.; Zhu, S. Optimization of Daylighting Pattern of Museum Sculpture Exhibition Hall. Sustainability 2021, 13, 1918. [Google Scholar] [CrossRef]
  21. Marzouk, M.; ElSharkawy, M.; Eissa, A. Optimizing thermal and visual efficiency using parametric configuration of skylights in heritage buildings. J. Build. Eng. 2020, 31, 101385. [Google Scholar] [CrossRef]
  22. Mavridou, T.; Doulos, L.T. Evaluation of Different Roof Types Concerning Daylight in Industrial Buildings during the Initial Design Phase: Methodology and Case Study. Buildings 2019, 9, 170. [Google Scholar] [CrossRef]
  23. Mandala, A.; Sutanto, E.B.H.; Santoso, A.R. The effectiveness of dayligting through the toplighting design in large-volume building models. ARTEKS J. Tek. Arsit. 2021, 6, 223–234. [Google Scholar] [CrossRef]
  24. The Illuminating Engineering Institute of Japan. Illumination Handbook, 2nd ed.; Ohmsha: Tokyo, Japan, 2003; ISBN 978-4-274-03615-6. [Google Scholar]
  25. Reinhart, C.F.; Mardaljevic, J.; Rogers, Z. Dynamic daylight performance metrics for sustainable building design. Leukos 2006, 3, 7–31. [Google Scholar] [CrossRef]
  26. Nabil, A.; Mardaljevic, J. Useful daylight illuminances: A replacement for daylight factors. Energy Build. 2006, 38, 905–913. [Google Scholar] [CrossRef]
  27. Mardaljevic, J. Climate-based daylight modelling and its discontents. In Proceedings of the CIBSE Technical Symposium, London, UK, 16–17 April 2015; pp. 1–12. [Google Scholar]
  28. Lakhdari, K.; Sriti, L.; Painter, B. Parametric optimization of daylight, thermal and energy performance of middle school classrooms, case of hot and dry regions. Build. Environ. 2021, 204, 108173. [Google Scholar] [CrossRef]
  29. Zhang, A.; Bokel, R.; van den Dobbelsteen, A.; Sun, Y.; Huang, Q.; Zhang, Q. Optimization of thermal and daylight performance of school buildings based on a multi-objective genetic algorithm in the cold climate of China. Energy Build. 2017, 139, 371–384. [Google Scholar] [CrossRef]
  30. JIS Z 9110–2010; General Rules of Recommended Lighting Levels. JIS: Hong Kong, China, 2010.
  31. ISO 7730:2005; Ergonomics of the Thermal Environment, English. ISO: Geneva, Switzerland, 2005.
  32. Fanger, P.O. Thermal Comfort: Analysis and Applications in Environmental Engineering; Danish Techinical Press: Copenhagen, Denmark, 1970. [Google Scholar]
  33. ASHRAE Standard 55-2013; Thermal Environmental Conditions for Human Occupancy. ASHRAE: Chicago, IL, USA, 2013.
  34. De Dear, R.J.; Brager, G.S.; Reardon, J.; Nicol, F. Developing an Adaptive Model of Thermal Comfort and Preference. ASHRAE Trans. 1998, 104, 145. [Google Scholar]
  35. Moujalled, B.; Cantin, R.; Guarracino, G. Comparison of Thermal Comfort Algorithms in Naturally Ventilated Office Buildings. Energy Build. 2008, 40, 2215–2223. [Google Scholar] [CrossRef]
  36. Naderi, E.; Sajadi, B.; Behabadi, M.A.; Naderi, E. Multi-Objective Simulation-Based Optimization of Controlled Blind Specifications to Reduce Energy Consumption, and Thermal and Visual Discomfort: Case Studies in Iran. Build. Environ. 2020, 169, 106570. [Google Scholar] [CrossRef]
  37. Bagheri-Esfeh, H.; Dehghan, M.R. Multi-Objective Optimization of Setpoint Temperature of Thermostats in Residential Buildings. Energy Build. 2022, 261, 111955. [Google Scholar] [CrossRef]
  38. Hosamo, H.H.; Tingstveit, M.S.; Nielsen, H.K.; Svennevig, P.R.; Svidt, K. Multiobjective Optimization of Building Energy Consumption and Thermal Comfort Based on Integrated BIM Framework with Machine Learning-NSGA II. Energy Build. 2022, 277, 112479. [Google Scholar] [CrossRef]
  39. Pérez-Lombard, L.; Ortiz, J.; Pout, C. A Review on Buildings Energy Consumption Information. Energy Build. 2008, 40, 394–398. [Google Scholar] [CrossRef]
  40. Wu, H.; Zhang, T. Multi-Objective Optimization of Energy, Visual, and Thermal Performance for Building Envelopes in China’s Hot Summer and Cold Winter Climate Zone. J. Build. Eng. 2022, 59, 105034. [Google Scholar] [CrossRef]
  41. Technical Information on the Evaluation of Energy Consumption Performance in Accordance with the 2016 Energy Conservation Standards (Non-Residential Buildings). Available online: https://www.kenken.go.jp/becc/building.html (accessed on 7 July 2023). (In Japanese).
  42. Meteorological Data Sources. Available online: https://climate.onebuilding.org/ (accessed on 7 July 2023).
  43. International Commission on Illumination (CIE). Test Cases to Assess the Accuracy of Lighting Computer Programs (CIE171:2006); International Commission on Illumination (CIE): Vienna, Austria, 2006. [Google Scholar]
  44. Reinhart, C.F.; Walkenhorst, O. Validation of dynamic RADIANCE-based daylight simulations for a test office with external blinds. Energy Build. 2001, 33, 683–697. [Google Scholar] [CrossRef]
  45. Kharvari, F. An empirical validation of daylighting tools: Assessing radiance parameters and simulation settings in Ladybug and Honeybee against field measurements. Sol. Energy 2020, 207, 1021–1036. [Google Scholar] [CrossRef]
  46. Calender Pattern, E. Available online: https://webpro-nr.github.io/BESJP_EngineeringReference/index.html (accessed on 8 November 2023).
  47. Shahbazi, Y.; Heydari, M.; Haghparast, F. An Early-Stage Design Optimization for Office Buildings’ Facade Providing High-Energy Performance and Daylight. Indoor Built Environ. 2019, 28, 1350–1367. [Google Scholar] [CrossRef]
  48. Konis, K.; Gamas, A.; Kensek, K. Passive performance and building form: An optimization framework for early-stage design support. Sol. Energy 2016, 125, 161–179. [Google Scholar] [CrossRef]
  49. ASHRAE Standard 55-2010; Thermal Environmental Conditions for Human Occupancy. ASHRAE: Chicago, IL, USA, 2010.
Figure 1. Overall research methodology.
Sustainability 15 16431 g001
Figure 2. Multi-objective optimization workflow in Grasshopper script.
Sustainability 15 16431 g002
Figure 3. Four spatial forms of typical daylight systems.
Sustainability 15 16431 g003
Figure 4. Weather data summary chart generated by Climate Consultant (developed by UCLA Energy Design Tools Group, © Regents of the University of California).
Sustainability 15 16431 g004
Figure 5. Performance of the baseline model.
Sustainability 15 16431 g005
Figure 6. Sun path diagrams for representative days throughout the year.
Sustainability 15 16431 g006
Figure 7. The Pareto front solutions for all models after 200 generations of optimization.
Sustainability 15 16431 g007aSustainability 15 16431 g007bSustainability 15 16431 g007c
Figure 8. Skylight distribution features in characteristic solutions of all models.
Sustainability 15 16431 g008aSustainability 15 16431 g008bSustainability 15 16431 g008c
Table 1. Detailed parameters of each model.
FormOrientationSubdivided Opening Size & NumberWindow-to-Floor RatioAbbr.
Pyramid skylightNorth-South-East-West1 m × 1.3 m × 1.6 m/720.20PMS
Sawtooth skylightNorth/South/East/West1 m × 1 m/390.23STS-N/STS-S/STS-E/STS-W
Monitor skylightNorth-South/East-West1 m × 1 m/520.31MTS-NS/MTS-EW
Flat skylightUpward1 m × 1 m/1000.59FLS
Table 2. Recommended illumination levels for different types of exhibits [30].
Artwork TypeRecommended
Illumination
Design Illumination Range
sculpture (stone, metal), formed object, model1000 lux750–1500 lux
sculpture (plaster, wood, paper), Western painting500 lux300–750 lux
painting, Japanese painting, craft, general exhibits200 lux150–300 lux
specimen, taxidermy100 lux75–150 lux
Table 3. Thermal construction materials [41].
ConstructionMaterialThickness (m)Total U-Value (W/m2·K)Reflectance
WallPlaster board0.0080.9150.60
Air gap
XPS insulation0.025
Concrete0.150
Cement mortar0.025
Tile0.010
RoofRockwool panel0.0120.4940.75
Plaster board0.010
Air gap
Concrete0.150
Cement mortar0.015
Asphalt0.005
Cement mortar0.015
XPS insulation0.050
Concrete0.060
FloorVinyl flooring0.0033.4330.30
Cement mortar0.027
Concrete0.150
Table 4. Simulation and optimization setting parameters [21,29].
Radiance ParametersAmbient bounces: 5
Ambient division: 1500
Ambient sampling: 100
Direct thresholding: 0.15
Direct certainty: 0.75
OptimizationElitism: 0.5
Mutation probability: 0.2
Mutation rate: 0.9
Crossover rate: 0.8
Population size: 100
Maximum no. of generations: 200
Energy ParametersOccupancy: 0.03/m2
Annual occupancy time: 2456 h
Lighting: 15 W/m2
Cooling period set points: 26°
Heating period set points: 22°
Transition season set points: 24°
Ventilation: 6 m3/m2·h
Thermal Comfort ParametersAir temperature: Based on OpenStudio results
Mean radiant temperature: Based on OpenStudio results
Relative humidity: Based on OpenStudio results
Metabolic rate: 1.2 met
Air speed: 0.1 m/s
Clothing insulation: 0.7 clo
Table 5. Characteristics of the different glazing materials.
GlazingThickness (m)U-Value
(W/m2·K)
Visible TransmittanceSolar Heat
Gain Coefficient
Transparent Glass
(double glazing)
0.0223.30.790.72
Translucent Glass0.0163.30.360.39
Table 6. Performance of characteristic solutions for all models.
SolutionYWFRUDI/%EUI/(kwh/m2)PPD/%
PMSS15.630.10469.1767.4213.53
Max UDI−5.260.09674.6768.3413.54
Min EUI−90.800.16232.3664.0913.83
Min PPD3.310.10071.0167.8313.52
STS-NS138.250.11288.3175.7013.72
Max UDI32.840.13089.2375.4213.78
Min EUI−45.470.19567.7474.3314.06
Min PPD−100.000.05341.9780.6013.50
STS-SS15.640.15455.1664.0912.77
Max UDI−100.000.08382.0469.8112.91
Min EUI−62.230.21338.0361.4912.86
Min PPD3.790.15453.2764.0612.77
STS-ES130.440.10780.3171.9613.52
Max UDI30.170.10180.3572.2313.49
Min EUI−100.000.18359.3569.7113.99
Min PPD−28.700.07773.7374.1813.40
STS-WS142.130.09583.2473.6413.56
Max UDI38.850.09583.4273.8113.56
Min EUI−99.900.16062.6572.2613.90
Min PPD−57.740.05971.3476.2913.46
MTS-NSS110.500.11268.7067.5412.85
Max UDI−99.680.15492.1274.7613.68
Min EUI−6.400.16648.2764.5012.85
Min PPD5.120.14851.2264.6812.79
MTS-EWS138.170.10186.9573.1313.54
Max UDI19.070.12489.0474.0213.64
Min EUI−100.000.24933.9068.5314.25
Min PPD−50.000.06561.4777.9013.47
FLSS127.160.05979.8371.8713.52
Max UDI16.020.05383.4873.5313.50
Min EUI−99.920.11848.7268.3614.25
Min PPD−39.440.03669.7775.2513.43
Disclaimer/Publisher’s Note: The statements, opinions and data contained in all publications are solely those of the individual author(s) and contributor(s) and not of MDPI and/or the editor(s). MDPI and/or the editor(s) disclaim responsibility for any injury to people or property resulting from any ideas, methods, instructions or products referred to in the content.

