Abstract
Boarding time constitutes a critical element of turnaround time, which is used to measure the efficiency of airline operations. Therefore, to reduce boarding time, it is imperative to reconsider traditional passenger boarding strategies to make them more efficient. In this sense, this study seeks to analyze the impact of different strategies on boarding times using discrete event simulation on an Airbus 320. Seven boarding strategies have been identified and considered in our study, as follows: random, back-to-front, outside-in, reverse pyramid, blocks, Steffen, and modified optimal. The impact of carrying hand luggage and the presence of priority passengers has been considered, as well as the impact of having a continuous arrival of passengers during the boarding process versus having all passengers available at boarding time. In general, simulation results have pointed out that the outside-in and reverse pyramid strategies are the most effective, improving boarding time by up to 15%, when compared to the random strategy. Moreover, the back-to-front strategy, which is generally implemented by airline companies, has been shown to be the most inefficient strategy. Efficient boarding strategies are expected to contribute to the sustainability of air travel by minimizing the turnaround time, improving operational efficiency, and reducing emissions.
1. Introduction
Aircraft have become an essential means of transport and, as such, air travel has increased dramatically over the last decades [1]. This demand for air travel has caused enormous competition in the aviation sector with a view to reducing costs, increasing efficiency, and meeting customer satisfaction [2,3]. To avoid congestion at airports, as well as to enhance operational efficiency, airlines have been compelled to reduce their turnaround time [4]. This is because airlines only generate revenue when planes fly, as having aircraft on the ground is considered unproductive [3,5]. The turnaround time mainly consists of passengers deboarding, cleaning, and passengers boarding; however, the most critical point resides in the boarding activity. It is estimated that a 1 min reduction in boarding time represents a saving of $30 United States Dollars (USD) for each turnaround [2]. Nevertheless, the process of boarding passengers on an aircraft is not always carried out in the best possible manner [6], with airline companies having limited control over passengers [5].
To reduce boarding time, the amount of interference amongst passengers should be minimized. This means that airlines must adopt an efficient boarding strategy to control the order in which passengers enter the aircraft [3,5]. The literature addressing strategies to improve the boarding process is still rather scant [2,3,5,7]. Boarding processes, if executed incorrectly, can lead to delays and additional costs for the airline [8].
In the case of well-implemented strategies, the three main parts involved—airlines, airport operators, and passengers—ultimately benefit from this reduction in boarding time [6]. Additionally, passengers valorize solutions that minimize waiting time at the boarding gate [9].
The main purpose of our study is to design a simulation tool that will be able to analyze different boarding strategies on an Airbus A320. This aircraft, which can carry up to 156 passengers, is used for short- and medium-haul flights and is commonly used by many airlines. This work adds to scientific knowledge by analyzing the performance of different boarding strategies under both the continuous arrival of passengers during the boarding process and the availability of all passengers at the beginning of the boarding process. The model was developed in a flexible manner, allowing for the simulation of different strategies, which can be adapted to the percentage of passengers carrying hand luggage, as well as the number of priority passengers involved in the boarding process. One can, thus, acquire a better understanding of which strategies present a greater efficiency in the context of specific scenarios.
The field of aviation has been requested to minimize its carbon footprint. To this end, a significant contribution includes the implementation of sustainable boarding procedures, thus ensuring that the aviation sector moves further along the path of environmentally friendly and responsible practices [10,11,12,13]. There are several external factors that impact airline boarding procedures, such as the following: the layout of the airport, security regulations, type of aircraft, weather conditions, gate availability, customer service, among others. To ensure a straightforward and efficient boarding process, boarding strategies must be adapted to these variables.
The remainder of the paper is organized as follows: Section 2 comprises an overview of the current literature concerning the boarding of passengers on an aircraft. Section 3 describes the methods used to carry out the study, including the simulation model and considered assumptions. The simulation results and a discussion of these are both included in Section 4. Lastly, Section 5 concludes the study and defines guidelines for future research work.
2. Literature Review
Marelli et al. [14] define the turnaround time of an aircraft as “the time required to unload an airplane after its arrival at the gate and to prepare it for departure again”. During this time, several events occur, namely: deboarding and boarding of passengers, unloading and loading of luggage and/or cargo, refueling, crew replacement, cabin cleaning, and kitchen maintenance [1,3,5]. The study developed by Van Landeghem & Beuselinck [4] concluded from interviews that the turnaround time can range from 30 to 60 min. Theoretically, the activity of deboarding requires approximately 10 to 15 min, cleaning about 15 to 20 min, and boarding approximately 10 min. Yet, in practical terms, the latter is almost always exceeded, often reaching 30 min [4]. Average boarding speed has seen a drop in the last 30 years of about 55% [14]. This decline in the efficiency of the boarding process can be attributed to the more generalized use of carry-on baggage, a greater convenience on the part of passengers, and passenger demographic data, as well as the strategies implemented by an airline and the flight distance [2]. Lower boarding rates will certainly lead to an increase in boarding times.
The main cause of delay in passenger boarding is interference among passengers. Soolaki et al. [3] define this interference in boarding as an instance when a passenger blocks another passenger or the aisle itself, or when passenger access to a seat is obstructed. Interference can be classified into the following two types: aisle interference and seat interference. Aisle interference occurs when passengers wish to reach their seats and are blocked in the aisle by other passengers who have stopped in front of them, usually stowing hand luggage in the upper lockers. Seat interference occurs, for example, when the window passenger wishes to take his seat and must ask the passenger already sitting in the aisle seat or in the middle to get up and allow their passage. According to Delcea et al. [15] and Cotfas et al. [16], there are four types of seat interference that passengers are faced with during their journey. Moreover, according to the same authors [15,16], the greatest interference delay is generated by type 1, during which the passenger with a window seat is required to wait for the other two passengers to move out before occupying their corresponding seat. The second longest delay, generated by the fact that a window seat passenger must wait for the occupant of the middle seat to clear the way is presented as a type 2 seat interference. Types 3 and 4, which refer to the passenger in the middle or window seat waiting for the passenger in the aisle seat to clear the way, both generate an identical delay time, which is still shorter than the first two types.
To reduce passenger interference and, in turn, boarding time, several boarding strategies have been considered. The main boarding strategies used by airlines are summarized as follows [7,17]:
- Random: One single boarding group of passengers randomly accesses the plane’s entry point. This procedure is often used as a point of reference for subsequent comparison with other boarding methods [17] (see Figure 1a).
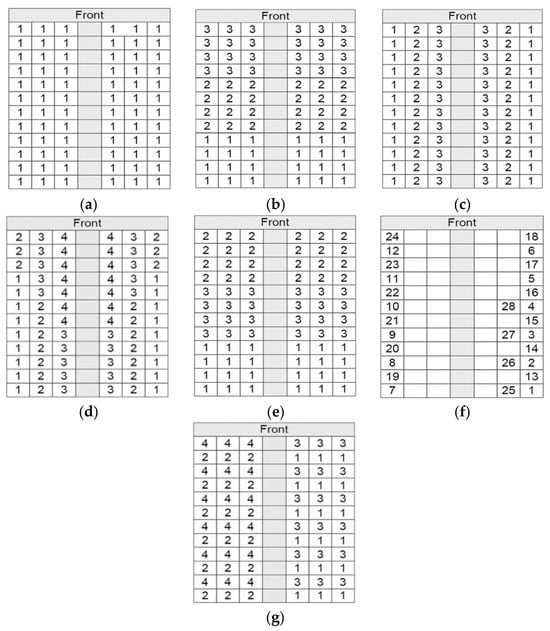 Figure 1. Illustration of the following boarding strategies [17]: (a) random; (b) back-to-front; (c) outside-in; (d) reverse pyramid; (e) blocks; (f) Steffen; and (g) modified optimal.
 - Back-to-Front: In this method of boarding, the first passengers to board are those in the last rows of the plane. Boarding continues until the front rows are reached. The rows on the plane are divided into zones (or blocks). Any number can be attributed to these zones, from two to the total number of actual rows. Despite being a straightforward strategy to implement, it can easily result in inefficiency, as congestion often occurs in the boarding queues [17] (see Figure 1b).
- Outside-In: also denominated as WMA or Wilma (Window–Middle–Aisle), this method first boards passengers who have window seats and, subsequently, those in the middle seats, finally followed by passengers sitting next to the aisle. This method has so far led to very efficient boarding times, eliminating seat interference [5] (see Figure 1c).
- Reverse Pyramid: In this method, the boarding of passengers occurs from the external rear to the inner front section of the cabin. In fact, it combines the back-to-front and outside-in strategies, so that simultaneous boarding occurs on the aircraft from back-to-front and from the outside-in. During this procedure, the first passengers to board are those with a window seat and a middle seat located at the rear of the airplane. Passengers with an aisle seat at the front of the plane are the last to board. This strategy has proved to be an efficient method and is implemented by American West Airlines [5] (see Figure 1d).
- Blocks: In this case, the rows in an aircraft are divided into zones or blocks, each consisting of several rows, with each passenger assigned to a designated block. This method first boards passengers seated in the last rows (block 1) and then passengers that are in the front rows (block 2). Subsequently, the order proceeds once again, beginning with the farthest zone (last unoccupied rows), then the front rows, and so forth. The positive aspect of this procedure is that when passengers enter the aircraft from the back and front, they do not block each other’s paths [5] (see Figure 1e).
- Steffen: The Steffen method organizes passengers in a specific order. Boarding is carried out from back to front and from the windows to the corridor. Passengers occupying a specific seat in the row are seated two rows from each other, in the same seat position (e.g., 12F, 10F, 8F, 6F, 4F, 2F). Firstly, on each side of the cabin, passengers are seated according to even and odd rows, occupying the window seats, then the middle seats, and, finally, the aisle seats [17] (see Figure 1f).
- Modified Optimal: This method consists of boarding passengers in alternating queues, providing them with enough space to carry their luggage. Passengers are divided into four boarding groups. The first of these consists of all those passengers who will occupy seats in the even rows, which are limited to the right or left sides of the plane only. The second group includes all the passengers who will sit on the unoccupied side of the plane. The third and fourth groups consist of passengers occupying seats in the odd rows on each side of the plane [5] (see Figure 1g).
Several studies have already been carried out with a view to implement aircraft boarding strategies. Different techniques have been used to address the problem, including the following: (1) simulation [1,4,5,9,14,18,19], (2) analytical methods [2,3,20,21], and (3) experiments in the aircraft [17,22]. The study developed by Bidanda et al. [8], for example, reviews the literature dealing with the implementation of models aiming to optimize boarding processes, thus achieving maximum efficiency. A more extensive comparative study [6] considered previous and future research studies in this area. On analyzing the results found in the research pertaining to boarding strategies, the authors Jaehn & Neumann [6] concluded that simple methods such as random boarding are more effective than the most commonly used back-to-front strategy. Nyquist & McFadden [2] demonstrated that luggage restriction reduces boarding time. Qiang et al. [19] developed a simulation model in which passengers carrying more luggage are boarded first. Kisiel [18] looked into the potentially problematic issues of generalized strategies, more specifically those which concern the number of priority passengers involved. Ren & Xu (2018) [22] claimed that the absence of music during boarding reduces the time required for this activity. A study conducted by Schultz [20] proposed changing the aircraft’s infrastructure to reduce the number of interference events. Tang et al. [21] presented a boarding strategy that considers the characteristics of individual passengers. This study was one of the first to discuss the correlation between boarding time and the percentage of passengers carrying hand luggage and/or the number of priority passengers, using seven different boarding strategies. Although this study used the Airbus 320 aircraft in its analysis, this is simply a general example which can be applied to different aircraft. Indeed, our chief objective is to enable airline companies to implement better boarding methods. Another more recent study undertaken by Kobbaey et al. [11] implements independent agent-based simulation in order to evaluate the most widespread research pertaining to the boarding of individual passengers and groups. The aspects considered include luggage, walking speed, and passengers’ disrespect of required norms. The analysis also puts forward a new procedure to reduce delays in boarding. The research results point to an improved performance of this new strategy when compared to previously implemented ones, especially when there are greater levels of seating and luggage capacity in an aircraft.
3. Methods
Computer simulation constitutes a critical tool for the study and analysis of complex processes and systems [23]. Simulation makes it possible to design a model that anchors on a real or hypothetical system, which can predict events from prior data, as well as analyzing areas of potential improvement and evaluating the impact of different operating strategies [24]. Discrete event simulation allows for the modeling of complex systems for which analytical models are not available, see, e.g., Milne and Kelly [25], Steffen [26], Tang et al. [21], Briel et al. [27], among others. To identify the best boarding strategies, a discrete event simulation model was developed using the Arena® 14.0 software. Arena allows for flowchart modeling, performance metrics and dashboards, and realistic 2D and 3D animation, including a complete range of statistical distribution options to accurately model process variability. The developed model includes not only logic and animation, but also a graphical interface, which allows the user to parameterize the logical model.
3.1. Model Assumptions and Performance Measures
Different parameters have been considered in the simulation model to implement the previously mentioned boarding strategies, namely, random, back-to-front, outside-in, reverse pyramid, blocks, Steffen, and modified optimal. The main parameters considered are the following:
- Inter-arrival time: the time-lapse between two passengers arriving at the boarding gate.
- Hand luggage delay: the time required for a passenger to stow his hand baggage in the designated compartment.
- Response time: the response time of all involved passengers.
- Type 1 seat delay: the time caused by a type 1 seat interference.
- Type 2 seat delay: the time caused by a type 2 seat interference.
- Types 3 and 4 seat delay: the time caused by type 3 and type 4 seat interferences.
Table 1 presents the various parameters adopted in the simulation model with their respective values.

Table 1.
Simulation parameters and values.
According to Schultz [28], the time each passenger needs to take his seat depends on the hand luggage delay, the seat delay, and the response time of all the involved passengers. These times in our study are modelled with stochastic probabilities distributions, as indicated in Table 1. For the hand luggage delay we follow Schultz [29] and use the Weibull distribution, while the seat delay is determined, as in Schultz [28,29], as the sum of the required movement times using the proposed probability distribution for a single movement, i.e., triangular (1.8, 2.4, 3) seconds. Finally, concerning the inter-arrival time between passengers we follow Schultz [29], while passenger speed was adopted from Schultz [28].
3.2. Simulation Model
The graphical interface for the simulation model was developed on Visual Basic for Applications (VBA). This allows the user to configure the boarding strategies and boarding parameters in a simple and intuitive manner; the user does not need to have prior knowledge of simulation modeling techniques to manipulate this graphical interface. The operation of the graphical interface is presented in detail in the flowchart in Figure 2, while the graphical interface is presented in Figure 3. This interface allows for the automatic generation of different boarding strategy models according to the user’s needs.

Figure 2.
Flowchart for the graphical interface developed.

Figure 3.
Graphical interface—initial page.
The animation of the simulation model aims to generate its dynamic animated representation, showing the boarding of passengers on the aircraft during the execution time. It is, thus, possible to obtain feedback from the constructed system, verifying whether it corresponds to what was initially envisioned. Figure 4 illustrates the developed animation of the model, which presents a simplified version of an aircraft layout.
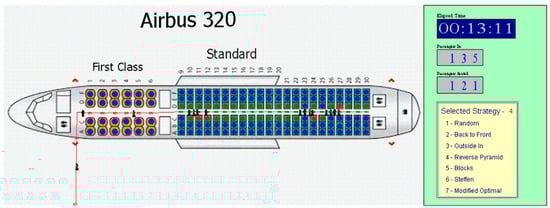
Figure 4.
Example of the animated model developed (partly adapted from [30]).
The Airbus A320 aircraft is used as a case study and boarding is carried out starting from the front of the aircraft using a jet bridge. The arrangement of the cabin in question consists of 30 passenger rows and one hundred and fifty-six seats, as follows: rows 1 to 6 have four seats, where first-class passengers are located; rows 7 and 8 do not have any seats, thus forming a division between the classes; and the remaining rows have six seats, where the economy class passengers are located. Seat numbering is in accordance with the rows and follows a lettering sequence of A–F, from left to right.
At the beginning of the simulation, the passengers are organized in boarding groups depending on the boarding strategy. Each boarding group has seats in a specific location. The first boarding group to embark refers to the first class, followed by the priority passengers, and then by the groups defined for each boarding strategy.
Once the boarding process starts, the first passenger leaves the boarding gate and walks thought the jet bridge followed by the other passengers. Upon entering the aircraft, the passengers make their way to find their assigned seats. The aisle is divided into cells, one per row of seats, and the passengers move from cell to cell along the aisle until they reach their assigned seat row. Before entering a cell, we check for possible blocking; if the cell in front of the passenger is occupied by another passenger we have a blocking situation, and the passenger has to wait. At each cell, we can have two passengers at a time. Once a passenger reaches his seat, the time to stow their hand luggage in the overhead compartment and to take his seat is generated, blocking the aisle for all the other passengers that are behind him, creating an aisle interference. For the passengers that reach their seats, a seat delay is generated depending on the type of seat interference. After the passenger is seated, the aisle is unblocked for the passengers waiting behind. This process is repeated for each one of the passengers, whenever necessary, until the last passenger is seated.
4. Simulation Results
To compare the performance of the strategies implemented, the total boarding time and the boarding time per passenger were recorded as outputs of the simulation. Each experimental scenario was replicated 100 times. We also considered the seating rate, which is the inverse of the mean time between the seating of two passengers. To replicate a real-life situation, data incorporating 24 first-class passengers was also acquired and analyzed.
Figure 5 presents the results for the average total boarding times of each boarding strategy using the maximum number of passengers seated in the aircraft. A simulation was carried out under the following two main scenarios: (1) the continuous arrival of passengers during the boarding process following an exponential of (3.7) seconds; and (2) the availability of all passengers at boarding time. The aircraft’s (maximum) capacity, 75% of passengers carrying hand luggage, and no priority passengers were assumed. According to the results obtained, the Steffen strategy provides a reference point, constituting the “fastest” boarding method. This is true for both scenarios, while performing relatively better when all passengers are available at the beginning of the boarding process. However, this strategy is rather impractical as it may cause enormous queues at the boarding gate. The procedure ensures that passengers enter the cabin one by one, in accordance with seat numbers in decreasing order (except for first-class passengers). The strategies that were closest to this reference point were achieved using the outside-in and reverse pyramid strategies. The back-to-front boarding and blocks strategies presented the worst results. A slightly better performance was observed in the random and modified optimal strategies; yet, these were not as good as the outside-in and reverse pyramid strategies.

Figure 5.
Total boarding time for each one of the boarding strategies. (a) Continuous arrival of passengers during boarding; and (b) all passengers available at boarding time.
Table 2 and Table 3 present the average boarding time per passenger (p.p.) and seating rate for the scenarios of continuous arrival of passengers during boarding and for all passengers available, respectively. These measures are of considerable importance as they point to the amount of interference that aisle and seat passengers experience before being able to take their seats. Among the various strategies, the greatest difference in individual boarding time lies in those that include seat interferences (random, back-to-front, block, and modified optimal), as well as those that do not (outside-in, reverse pyramid, and Steffen). When compared to the back-to-front and blocks strategies, the difference between the random and modified optimal strategies relates to the amount of passenger congestion in the same area of the plane.
Table 2.
Boarding time per passenger and seating rate for the continuous arrival of passengers.
Table 3.
Boarding time per passenger and seating rate for all passengers available at boarding time.
When comparing the results from Table 2 (continuous arrival of passengers) with those from Table 3 (all passengers available at boarding time), we can observe a higher boarding time per passenger in the latter, as passengers, on average, arrive earlier to the boarding gate. We also can see that the relative performance of the strategies is maintained concerning the boarding time per passenger and the seating rate. However, all passengers being available at boarding time results in a higher seating rate across the strategies, as could be expected.
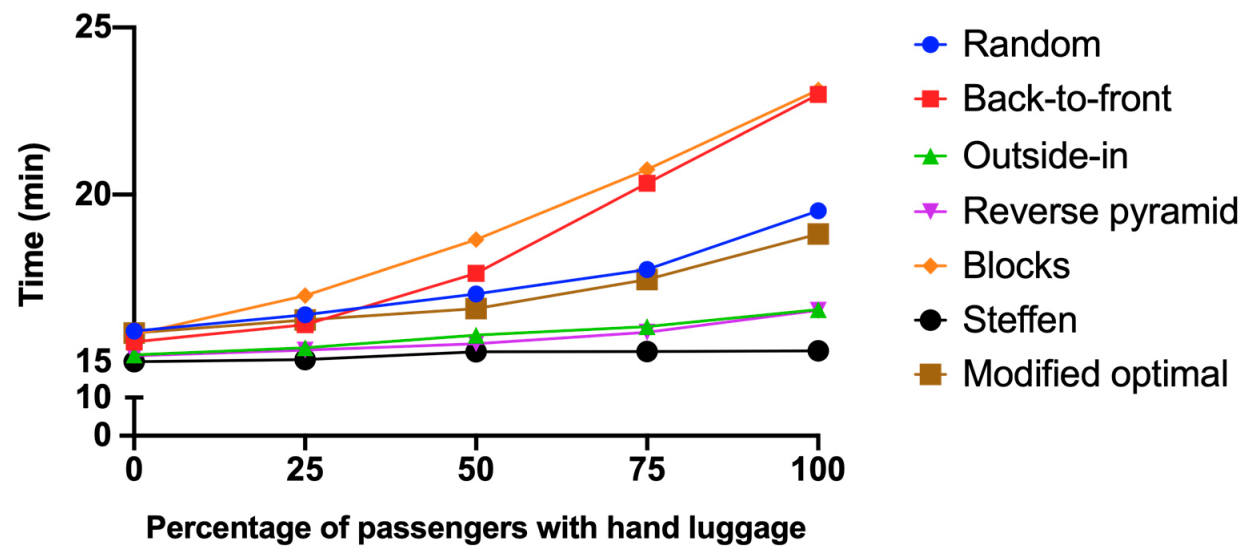
Figure 6 and Figure 7 refer to the situation of the continuous arrival of passengers during boarding time. Figure 6 presents a graph which reveals potential issues arising from each boarding strategy, associated with the number of passengers carrying hand luggage. For any of the procedures adopted, the chart indicates that there is a positive correlation between the percentage of passengers with carry-on luggage and the total boarding time. What can be observed is that, as the percentage of these passengers increases, so does the total boarding time, regardless of which strategy is implemented. However, this rate of escalation may vary, depending on the strategy chosen. The Steffen strategy indicates an escalation rate close to zero due to the virtual inexistence of interference. The outside-in and reverse pyramid strategies tend to perform closer to an optimal level. This is chiefly attributed to the elimination of seat interference at boarding. Performance deterioration is moderate in the random and modified optimal strategies. The highest performance deterioration occurs in the back-to-front and blocks strategies, where the aircraft is parted into blocks, five in our case. This performance deterioration is due to the increase in aisle and seat interference within each block (for the back-to-front strategy) and within and between blocks (for the blocks strategy) when a higher percentage of passengers is carrying hand luggage. When a scenario of the absence of luggage is contemplated, there are virtually no differences between the various boarding strategies. As can be seen in Figure 7, when all passengers carry hand baggage, there is a greater disparity in the boarding times for the different strategies.
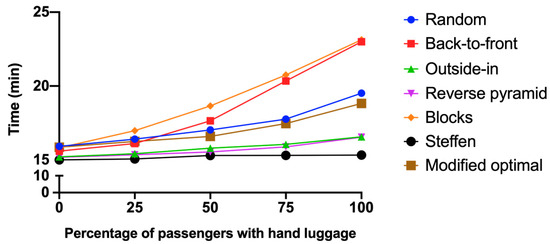
Figure 6.
Impact of the number of passengers carrying hand luggage on the total boarding time.
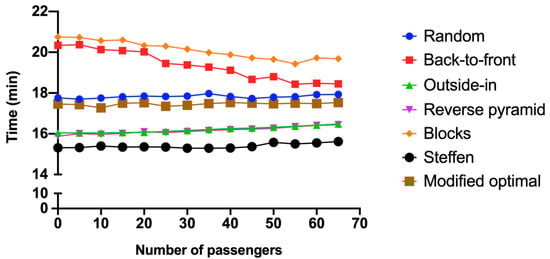
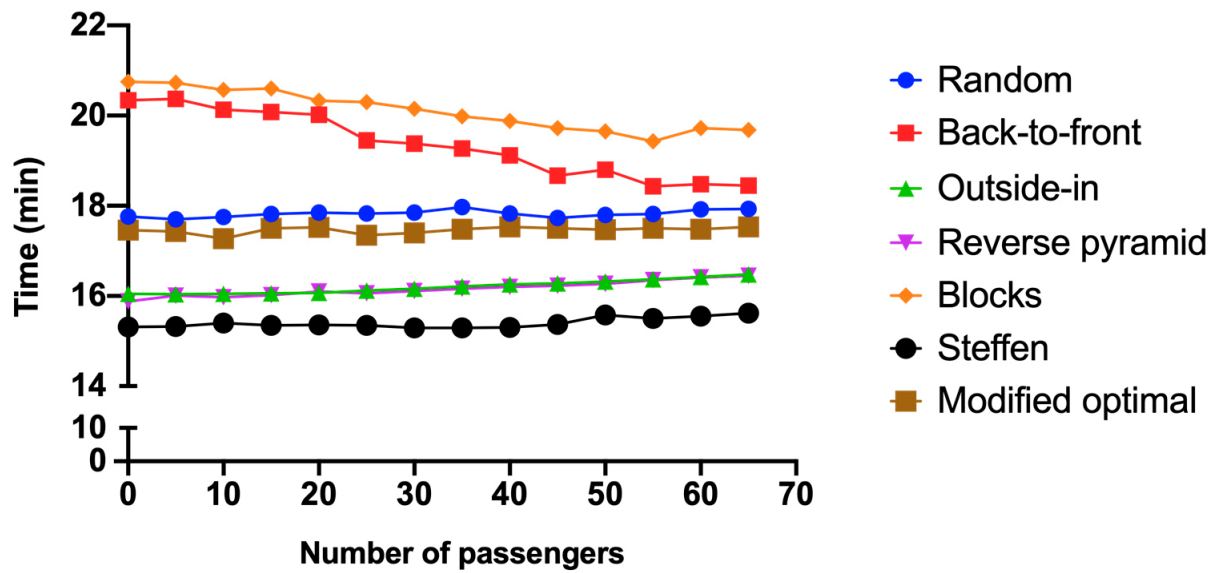
Figure 7.
Impact of priority passengers on the total boarding time.
Figure 7 presents a graph that indicates the possible differences in each boarding strategy when associated with the number of priority passengers on the aircraft. The chart shows a positive correlation between the number of priority passengers and the total boarding time for the seven strategies. The random and modified optimal strategies reveal no change when priority passengers are added. The outside-in, reverse pyramid, and Steffen strategies tend towards lengthier boarding times as the number of priority passengers increases. This is explained by the fact that these strategies are designed to eliminate seat interference; it follows that, when priority passengers are included, these interferences emerge once again. On the other hand, the back-to-front and blocks strategies show an improved performance as the number of priority passengers increases. This is due to a reduction in passenger congestion in the same area of the aircraft. Despite the better performance of these strategies, they are unable to surpass those of the outside-in, reverse pyramid, and Steffen strategies, even when the second group is less efficient, and the first group reveals an improved performance. Were the number of priority passengers equal to the number of seats available for the economy class (132 seats), any of the strategies would result in the same boarding times as the random strategy. This resides in the fact that their behavior is identical; namely, there is only one boarding group.
5. Conclusions
A study of the efficiency of passenger boarding strategies on an Airbus A320 was carried out using discrete event simulation and the Arena software. By resorting to the simulation, seven strategies were evaluated when boarding is carried out starting from the front of the aircraft using a jet bridge, namely: random, back-to-front, outside-in, reverse pyramid, blocks, Steffen, and modified optimal.
The study was carried out under two main scenarios, the continuous arrival of passengers during the boarding process and the availability of all passengers at boarding time. The relative performance of the boarding strategies considered in the study seems to be independent of the arrival process of the passengers to the boarding gate. We, therefore, focused the study on one of the scenarios—the continuous arrival of passengers during the boarding process. Concerning the relative performance of the boarding strategies in this scenario, the outside-in and the reverse pyramid led to the shortest boarding time, while the back-to-front and blocks strategies proved to be inefficient. Assuming that 75% of passengers carried hand luggage, the reverse pyramid strategy achieved an improvement of 11% over the random strategy. Compared to the back-to-front strategy, the reverse pyramid method indicated a 22% improvement under the same conditions. For this reason, one can conclude that the back-to-front strategy implemented by several airlines is inefficient. When virtually all passengers carry hand luggage, the most effective boarding strategies are those of the reverse pyramid and outside-in. A comparison with the random strategy leads to the conclusion that the boarding time is improved by up to 15%. If one were to compare the best scenario (reverse pyramid) with the worst (blocks), there is a 29% reduction in boarding time.
Following this study, we intend to analyze the most cost-effective boarding scenario for airline companies, allowing them to make informed decisions about their boarding procedures and improve operational efficiency. Additionally, the impact of late passengers on boarding strategies will be tested.
Author Contributions
Conceptualization, H.M., L.P.F. and P.Á.; Methodology, H.M., L.P.F., A.L.R. and P.Á.; Software, H.M., L.P.F., N.O.F. and A.L.R.; Validation, H.M., L.P.F., N.O.F. and P.Á.; Formal analysis, A.L.R.; Investigation, H.M., L.P.F. and N.O.F.; Resources, P.Á.; Data curation, A.L.R.; Writing—original draft, H.M., L.P.F. and P.Á.; Writing—review & editing, H.M., L.P.F., N.O.F., A.L.R. and P.Á.; Supervision, L.P.F. and P.Á. All authors have read and agreed to the published version of the manuscript.
Funding
This research received no external funding.
Data Availability Statement
Data is contained within the article.
Conflicts of Interest
The authors declare no conflict of interest.
References
- Kalic, M.; Markovic, B.; Kuljanin, J. The airline boarding problem: Simulation based approach from different players’ perspective. In Proceedings of the 1st Logistics International Conference, Belgrade, Serbia, 28–30 November 2013; Vidović, M., Kilibarda, M., Zečević, S., Miljuš, M., Radivojević, G., Eds.; pp. 49–54. [Google Scholar]
- Nyquist, D.; McFadden, K. A study of the airline boarding problem. J. Air Transp. Manag. 2008, 14, 197–204. [Google Scholar] [CrossRef]
- Soolaki, M.; Mahdavi, I.; Mahdavi-Amiri, N.; Hassanzadeh, R.; Aghajani, A. A new linear programming approach and genetic algorithm for solving airline boarding problem. Appl. Math. Model. 2012, 36, 4060–4072. [Google Scholar] [CrossRef]
- Van Landeghem, H.; Beuselinck, A. Reducing passenger boarding time in airplanes: A simulation based approach. Eur. J. Oper. Res. 2002, 142, 294–308. [Google Scholar] [CrossRef]
- Jafer, S.; Mi, W. Comparative Study of Aircraft Boarding Strategies Using Cellular Discrete Event Simulation. Aerospace 2017, 4, 57. [Google Scholar] [CrossRef]
- Jaehn, F.; Neumann, S. Airplane Boarding. Eur. J. Oper. Res. 2015, 244, 339–359. [Google Scholar] [CrossRef]
- Kierzkowski, A.; Kisiel, T. The human factor in the passenger boarding process at the airport. Procedia Eng. 2017, 187, 348–355. [Google Scholar] [CrossRef]
- Bidanda, R.; Winakor, J.; Geng, Z.; Vidic, N. A review of optimization models for boarding a commercial airplane. In Proceedings of the 24th International Conference on Production Research, Poznan, Poland, 30 July–3 August 2017; pp. 1–6. [Google Scholar]
- Zeineddine, H. A dynamically optimized aircraft boarding strategy. J. Air Transp. Manag. 2017, 58, 144–151. [Google Scholar] [CrossRef]
- Delcea, C.; Cotfas, L.-A.; Paun, R. Agent-Based Evaluation of the Airplane Boarding Strategies’ Efficiency and Sustainability. Sustainability 2018, 10, 1879. [Google Scholar] [CrossRef]
- Kobbaey, T.; Bilquise, G.; Naqi, A.A. A Comparative Evaluation of Airplane Boarding Strategies with a Novel Method for Sustainable Air Travel. In Proceedings of the 2023 9th International Conference on Information Technology Trends (ITT), Dubai, United Arab Emirates, 24–25 May 2023; IEEE: New York, NY, USA, 2023; pp. 169–174. [Google Scholar]
- Ansell, P.J. Review of sustainable energy carriers for aviation: Benefits, challenges, and future viability. Prog. Aerosp. Sci. 2023, 141, 100919. [Google Scholar] [CrossRef]
- Afonso, F.; Sohst, M.; Diogo, C.M.; Rodrigues, S.S.; Ferreira, A.; Ribeiro, I.; Marques, R.; Rego, F.F.; Sohouli, A.; Portugal-Pereira, J.; et al. Strategies towards a more sustainable aviation: A systematic review. Prog. Aerosp. Sci. 2023, 137, 100878. [Google Scholar] [CrossRef]
- Marelli, S.; Mattocks, G.; Merry, R. The Role of Computer Simulation in Reducing Airplane Turn Time. 1998. Available online: https://www.boeing.com/commercial/aeromagazine/aero_01/textonly/t01txt.html (accessed on 26 October 2020).
- Delcea, C.; Cotfas, L.-A.; Chirita, N.; Nica, I. A Two-Door Airplane Boarding Approach When Using Apron Buses. Sustainability 2018, 10, 3619. [Google Scholar] [CrossRef]
- Cotfas, L.A.; Delcea, C.; Milne, R.J.; Salari, M. Evaluating Classical Airplane Boarding Methods Considering COVID-19 Flying Restrictions. Symmetry 2020, 12, 1087. [Google Scholar] [CrossRef]
- Steffen, J.; Hotchkiss, J. Experimental test of airplane boarding methods. J. Air Transp. Manag. 2012, 18, 64–67. [Google Scholar] [CrossRef]
- Kisiel, T. Resilience of passenger boarding strategies to priority fares offered by airlines. J. Air Transp. Manag. 2020, 87, 101853. [Google Scholar] [CrossRef]
- Qiang, S.-J.; Jia, B.; Xie, D.-F.; Gao, Z.-Y. Reducing airplane boarding time by accounting for passengers’ individual properties: A simulation based on cellular automaton. J. Air Transp. Manag. 2014, 40, 42–47. [Google Scholar] [CrossRef]
- Schultz, M. Dynamic change of aircraft seat condition for fast boarding. Transp. Res. Part C Emerg. Technol. 2017, 85, 131–147. [Google Scholar] [CrossRef]
- Tang, T.; Wu, Y.H.; Huang, H.; Caccetta, L. An aircraft boarding model accounting for passengers’ individual properties. Transp. Res. Part C Emerg. Technol. 2012, 22, 1–16. [Google Scholar] [CrossRef]
- Ren, X.; Xu, X. Experimental analyses of airplane boarding based on interference classification. J. Air Transp. Manag. 2018, 71, 55–63. [Google Scholar] [CrossRef]
- Silva, V.; Ferreira, L.P.; Silva, F.J.G.; Tjahjono, B.; Ávila, P. Simulation-Based Decision Support System to Improve Material Flow of a Textile Company. Sustainability 2021, 13, 2947. [Google Scholar] [CrossRef]
- Ferreira, L.P.; Gómez, E.A.; Lourido, G.C.P.; Quintas, J.D.; Tjahjono, B. Analysis and optimisation of a network of closed-loop automobile assembly line using simulation. Int. J. Adv. Manuf. Technol. 2012, 59, 351–366. [Google Scholar] [CrossRef]
- Milne, R.J.; Kelly, A.R. A new method for boarding passengers onto an airplane. J. Air Transp. Manag. 2014, 34, 93–100. [Google Scholar] [CrossRef]
- Steffen, J.H. Optimal boarding method for airline passengers. J. Air Transp. Manag. 2008, 14, 146–150. [Google Scholar] [CrossRef]
- Van Den Briel, M.H.; Villalobos, J.R.; Hogg, G.L.; Lindemann, T.; Mulé, A.V. America west airlines develops efficient boarding strategies. Interfaces 2005, 35, 191–201. [Google Scholar] [CrossRef]
- Schultz, M.; Kunze, T.; Fricke, H. Boarding on the Critical Path of the Turnaround. In Proceedings of the 10th USA/Europe Air Traffic Management Research and Development Seminar, Chicago, IL, USA, 10–13 June 2013. [Google Scholar]
- Schultz, M. Aircraft Boarding—Data, Validation, Analysis. In Proceedings of the 12th USA/Europe Air Traffic Management Research and Development Seminar, Seattle, WA, USA, 27–30 June 2017. [Google Scholar]
- Seatplans.com. Airbus A320. 2021. Available online: http://seatplans.krankikom.de/airlines/azerbaijan-hava-yollary/azerbaijan-airlines-a320-seating-map/airbus-a320-business-short-haul (accessed on 20 March 2020).

Disclaimer/Publisher’s Note: The statements, opinions and data contained in all publications are solely those of the individual author(s) and contributor(s) and not of MDPI and/or the editor(s). MDPI and/or the editor(s) disclaim responsibility for any injury to people or property resulting from any ideas, methods, instructions or products referred to in the content. |
© 2023 by the authors. Licensee MDPI, Basel, Switzerland. This article is an open access article distributed under the terms and conditions of the Creative Commons Attribution (CC BY) license (https://creativecommons.org/licenses/by/4.0/).