Abstract
High-temperature Superconducting (HTS) maglev trains are vulnerable to the effects of crosswinds when operating at high speeds in open-air conditions, potentially compromising riding comfort and safety. This study established a vehicle dynamic model based on the nonlinear maglev-track relationship and added aerodynamic loads under crosswinds to the train’s simplified load center to address this issue. Using the maximum vibration acceleration limit and the Sperling index, we evaluated the riding comfort of the HTS maglev train under different conditions. Further, the vibration acceleration power spectral density was analyzed to reveal the impact of increasing the train’s operating speed and crosswind speed. The results indicated that the lateral and vertical Sperling index achieved an “excellent” rating, even at crosswind speeds of up to 20.7 m/s when the train was traveling at speeds of up to 600 km/h. However, it was noted that particular attention should be given to the riding comfort in the head car when the speed reaches 600 km/h. Moreover, the influence of the increase in train speed on the vibration frequency domain distribution of the three car bodies and the train’s riding comfort is greater than that of the increase in the crosswind speed. These findings may provide a valuable reference for the future engineering application of the HTS maglev train.
1. Introduction
Maglev trains have the potential for sustainable development due to their advantages of energy saving, environmental protection, and fast speed. Compared with wheel–rail trains, taking the permanent maglev line in mature commercial operation in Shanghai, China, for example, its energy consumption per seat per kilometer is only one-third of that of an aircraft when it runs at a speed of 500 km/h. At 300 km/h, maglev trains consume one-third less energy than high-speed wheel–rail trains [1]. The high-temperature superconducting (HTS) maglev train has a great application prospect because of its unique advantages, such as no source stability, low power consumption, and high-speed operation potential. The interaction between the high-speed operation of HTS maglev trains and their surrounding environment is an important issue for the sustainable development of transportation. However, the high-speed operation of maglev trains in open-air environments still presents several critical issues. For instance, when the train operates at high speeds under strong winds, it can result in increased aerodynamic loads, including lateral forces, lift forces, drag forces, and overturning moments. In severe cases, this can lead to accidents such as derailment or overturning. This includes concerns regarding the riding comfort and safety of operation under crosswind conditions. By addressing these issues, it contributes to the overall sustainability of the HTS maglev system.
HTS maglev technology holds significant promise for high-speed rail transportation due to its flux pinning property (a passive stability without any mechanical contact) [2,3,4,5]. The HTS maglev system utilizes cost-effective liquid nitrogen-cooled superconducting material to generate levitation and guidance forces, making it energy-efficient, environmentally friendly, and a highly sustainable mode of transportation. This characteristic showcases its considerable potential for sustainable development. Our group [6] conducted a comprehensive analysis of the flux pinning characteristic and determined the lateral and vertical dynamic coupling interactions between HTS bulks and the Permanent Magnetic Guideway (PMG), a relationship we have termed the “magnetic-track relationship”. The dynamic characteristics of the HTS maglev vehicle have been studied to verify its application feasibility [7,8,9]. Several prototypes of HTS maglev vehicles have been created, envisioning the future of high-speed train transit, including the 45 m HTS maglev test ring, known as “Super-Maglev”. On 13 January 2021, a notable achievement was recorded in China with the launch of the inaugural HTS high-speed maglev engineering vehicle prototype and its test line, signifying a landmark development in the field of HTS maglev engineering research.
However, with the increase in the operation speed, the corresponding growing vibration becomes a major problem which affects safety and riding comfort [10,11], especially when HTS maglev trains operate at high speeds in open environments, such as in strong crosswinds, where they are not only affected by the irregularity of the track, but also subjected to the increased aerodynamic loads [12,13], which can severely impact riding comfort, even leading to derailments or overturning incidents [14,15,16].
When trains run under the open line, they are subjected to a variety of crosswind environments, such as the steady crosswind, gradual crosswind [17] (such as the train driving out of the tunnel exit, passing the windbreak gap, etc.), and the unsteady crosswind with turbulence intensity and characteristics [18]. Numerous studies have been conducted by scholars through wind tunnel testing and vehicle testing [19,20,21,22] to investigate the methodologies for measuring aerodynamic forces and the response of train bodies when subjected to strong lateral gusts of wind. The numerical simulation method has become a mainstream approach in the aerodynamic assessment of high-speed trains when faced with crosswinds [23,24]. However, current research [25,26] primarily addresses the influence of strong crosswinds on conventional wheel–rail trains, with maglev trains being somewhat overlooked in this area of research. Additionally, the current research focuses on medium- and low-speed maglev systems. With high-speed maglevs expected to reach 400–600 km/h, it is critical to examine the impact of strong crosswinds on the riding comfort and safety of HTS high-speed maglev trains. A simulation of the high-speed operation of the HTS maglev train under a steady-state crosswind load is studied. Wang [27] et al. studied the aerodynamic characteristics of the HTS maglev train under crosswind conditions, considering the magnet–track relationship, and the safety performance of the HTS Maglev train was analyzed using indicators such as the overturning coefficient, the vertical and lateral safety displacement of the HTS levitators (a cryostat device that contains liquid nitrogen and superconductors), and the minimum levitation gap. The results showed that the safety performance of the head car exhibited the greatest variation, but the overall safety of the train was found to be satisfactory. Continuing the analysis and evaluation of the safety and riding comfort of HTS maglev trains is crucial due to their potential as a high-speed transportation solution that is energy-efficient and environmentally friendly. For the HTS maglev train’s operation at high speed, magnetic track irregularities and aerodynamic loads are two important excitation sources. In this paper, the riding comfort of the HTS maglev train is studied by establishing a dynamic model considering the magnet–track relationship and track irregularities and adding the aerodynamic loads under a steady-state crosswind. So, in this paper, we further analyze and evaluate the riding comfort of HTS maglev trains subjected to steady-state crosswinds; the results may provide a reference for future engineering applications.
2. Calculation Model
2.1. The HTS Maglev Train Dynamic Model
The non-contact magnet–track interaction is the key component in the HTS maglev system, distinguishing it from conventional wheel–track contact forces. This relationship is crucial for the smooth and stable operation of the HTS maglev vehicle. HTS maglev trains employ a distinctive magnet–track relationship for levitation and guidance, relying on the interaction between the permanent magnet guideway (PMG) and the HTS bulks. Therefore, constructing an accurate mathematical model of levitation and guidance forces is crucial to simulating the dynamics of HTS maglev trains. Kou [28] et al., through the vector superposition method, successfully established a mathematical model of a two-dimensional force as the magnet–track relationship for HTS maglev trains and determined unknown parameters with the least squares method, as follows:
where and represent the levitation and guiding forces of the system, respectively. is composed of two parts: represents the exponential variation of the levitation force in the vertical direction, while represents the sinusoidal variation of the levitation force in the transverse direction. In the equation, , , , , and are the six unknown parameters in the two-dimensional levitation force model, and is the unit vector in the Z direction. is also composed of two parts: represents the sinusoidal variation of the guiding force in the transverse direction, while reflects the exponential variation of the guiding force in the vertical direction. In these equations, , , , , and are the five unknown parameters in the two-dimensional guidance force model, and is the unit vector in the Y direction.
The comprehensive two-dimensional force model is derived by performing a vector addition of the levitation and guidance forces. The mathematical representation of this combined force model is given by the equation:
In addition, the simulated force–displacement surface diagram of the two-dimensional force model adopted in this paper has been supplemented in the manuscript, as shown in Figure 1.
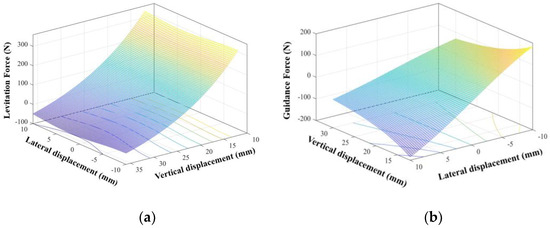
Figure 1.
Two-dimensional force model force–displacement surface diagram. (a) Two−dimensional levitation force simulation results. (b) Two−dimensional guidance force simulation results.
This paper develops a vehicle dynamic model for the HTS maglev train operating under crosswinds, as shown in Figure 2. In practical operation, the train must consider the impact of track irregularities, including geometric and magnetic variations. We use the track irregularity sample of Shanghai Maglev to simulate the dynamics of the HTS maglev train in this paper.
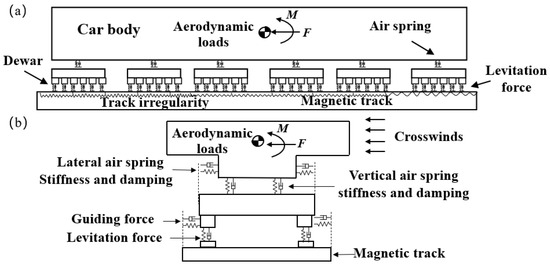
Figure 2.
The schematic diagram of the topological relation of the HTS maglev trains on (a) side view and (b) front view.
Figure 3 shows the geometric model used for the simulation. In the process of building the simulation model, a reference is made to the real prototype structure (Figure 3b). The engineering prototype of the train adopts the form of the rail holding train, with a streamlined design for the front section. Underneath the levitation system two permanent magnet guideways (PMG) are installed, and a linear motor is placed in the middle as the driving and traction device. The dynamics model comprises three interconnected sections corresponding to the head, middle, and tail cars, each outfitted with six levitation frames. Within each frame, 24 HTS levitators (a cryostat device that contains liquid nitrogen and superconductors, as shown in Figure 3d) generate the levitation and guiding forces as per the mathematical expressions in Equation (1). Additionally, each frame contains two shock absorbers for damping and is linked by force elements simulating the train’s coupling mechanisms. The model we have established consists of a complete train with a length of 63.16 m, a height of 3.47 m, and a maximum width of 2.9 m. The three sections of the train are connected by defined coupler forces. The head and tail cars are composed of streamlined and non-streamlined sections, as shown in Figure 3a. The levitation height is set to 10 mm based on the design parameters. The parameters of a single-car body model are provided in Table 1.
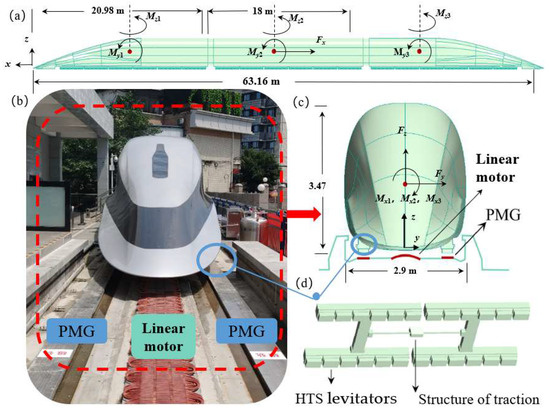
Figure 3.
(a) The size of the train and the load center of aerodynamic loads. (b) The HTS maglev vehicle prototype and test line. (c) Front view. (d) Bogies and HTS levitators.

Table 1.
Parameters of the HTS maglev vehicle (take a single car body as an example).
2.2. Aerodynamic Load
With a reliable dynamic model established, the next task is to add aerodynamic loads. We use aerodynamic load data extracted by Wang [27] et al. for the HTS maglev train under a crosswind and add various aerodynamic loads (drag (Fx), lateral force (Fy), including lift (Fz), overturning moment (Mx), lateral moment (My), and pitching moment (Mz)) to the simplified center of each car body in the dynamic model, as shown in Figure 2a,c. The definitions for the aerodynamic force (Fi) and aerodynamic moment (Mi) are as follows:
where Cx, Cy, and Cz represent the coefficients for the aerodynamic drag, lateral force, and lift force, each relative to their respective projected areas, Ax, Ay, and Az. Similarly, Mx, My, and Mz represent the overturning moment, pitching moment, and sideslip moment, each aligned with their corresponding moment coefficients, CMx, CMy, and CMz.
When HTS maglev trains operate under a crosswind environment, the maglev trains will inevitably be subjected to aerodynamic loads (including three aerodynamic forces and three aerodynamic moments). When extracting aerodynamic loads in fluid simulation, it is necessary to define not only the direction of each aerodynamic force, but also the extraction center of each aerodynamic moment. The extraction center of aerodynamic direction and torque is shown in Figure 3a,c. In Figure 3a,c, the red dot is the extraction center of each torque. The extraction center coordinate of the head car is (−11.21 m, 0, 1.735 m), the extraction center coordinate of the middle car is (−30.68 m, 0, 1.735 m), and the extraction center coordinate distance from the nose tip of the tail car is (−50.87 m, 0, 1.735 m). Mx1, Mx2, Mx3, My1, My2, My3, Mz1, Mz2, and Mz3 are, respectively, expressed as the overturning moment, pitching moment, and side deflection moment of the three cars, and Fx, Fy, and Fz represent the extraction direction of the aerodynamic drag, aerodynamic transverse force, and aerodynamic lift, respectively.
The specified simulation conditions include a range of operating speeds (VT) for the subject of study, set at 400, 450, 500, 550, and 600 km/h. Additionally, crosswind velocities (VC) have been chosen to be 0, 10.7, 13.8, 17.1, and 20.7 m/s. These values correspond to the wind speeds of grade 6, grade 7, grade 8, and grade 9, respectively. According to the high-speed maglev design standard CJJ/T 310-2021 [29] the operational speed of the maglev train is limited when the wind speed reaches grade 10.
Figure 4 shows the extracted aerodynamic load of the head car under a 17.1 m/s crosswind speed, with a wind angle of 90° when the train is running at 400 km/h, and mainly illustrates the process of loading the aerodynamic lateral force. In general, the complete loading process of an aerodynamic load can be divided into three stages: the loading stage, the sustained action stage, and the unloading stage. Take the loading process of the aerodynamic load on the head car under the operation conditions (VT 600 km/h, VC 17.1 m/s) as an example. During the loading phase (2–5 s), the aerodynamic load smoothly transitions from zero to a certain value, and the time taken for this process is known as the loading time of the aerodynamic load. The sustained action phase refers to the process where the aerodynamic load continues to act at a certain value, and the time taken for this process is known as the sustained action time of the aerodynamic load. The unloading phase (11–14 s) corresponds to the process where the aerodynamic load smoothly transitions from a certain value to zero, and the time taken for this process is known as the unloading time of the aerodynamic load. The duration of the loading time can have varying impacts on the results of dynamic simulations, with larger or smaller effects. However, when the wind shear time (the time for aerodynamic load changes) is greater than or equal to 3 s, the influence of the aerodynamic load loading time on the dynamic calculation results can be neglected [30]. Therefore, in this study, a wind shear time of 3 s (2–5 s, 11–14 s) is selected for each working condition.
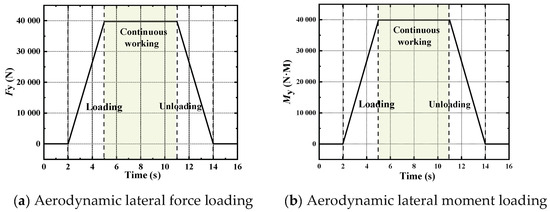
Figure 4.
The aerodynamic loading process of aerodynamic loads (take lateral forces and lateral moment, for example).
2.3. Evaluation Method of Riding Comfort for HTS Maglev Trains
Comfort is the perception of vibrations by passengers when riding a train. There is no difference between maglev trains and conventional wheel–rail trains, so the comfort evaluation methods used for wheel–rail trains can be directly applied. Firstly, the limitation on the acceleration response of the train body is considered.
According to the national standard, GB/T 5599-2019 [31] sets the limit for the acceleration response of the passenger cars and the trainsets’ body at 2.5 m/s2 (both in lateral and vertical directions). In addition, the “Technical Standards for Maglev Railways (Trial)” [1] specifies that the acceleration limit for the comfort of high-speed maglev trains traveling at 600 km/h is set at 0.5 m/s2. Therefore, this study considers the lateral and vertical acceleration of the train body as one of the indicators for evaluating riding comfort, with a particular focus on accelerations exceeding 0.5 m/s2.
In addition to the acceleration limits, the most indicative criterion reflecting the actual comfort experienced by passengers is the Sperling index, which takes into account the human sensitivity to different vibration frequencies through weighted processing. The Sperling stability index W is categorized into the vertical stability index (WV) and lateral stability index (WL); running smoothness is considered optimal when the Sperling index, W, is less than 2.5. The calculation method for the Sperling index specified in GB/T 5599-2019 is adopted in this study, with acceleration measurements taken at the bottom of the car body, 1000 mm away from the center of the bogie on one side. Since HTS maglev trains have six suspension systems fully spread along the body, to better comply with the specified position, the acceleration data are collected at the bottom of the train body, 1 m away from the center of the bogies on one side, which are the suspension systems located at the front and rear of the train, as shown in Figure 5. In conclusion, this study will use four indexes to evaluate the riding comfort of the HTS maglev train, summarized in Table 2.
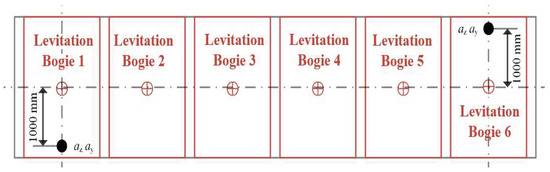
Figure 5.
Schematic diagram of the position of acceleration measurement points.
Table 2.
Riding comfort evaluation indexes and limits for HTS maglev trains.
3. Results and Discussion
3.1. The Maximum Vibration Acceleration of the HTS Maglev Train
According to the evaluation method of riding comfort for HTS maglev trains, this study first extracts the maximum lateral and vertical acceleration of the HTS train operating at different speeds under the crosswind speed of 17.1 m/s and then focuses on the 600 km/h running speed under different crosswind speeds (0, 10.7, 13.8, 17.1, 20.7 m/s), summarized in Table 3. It can be found that the azmax and aymax value of the head car is significantly greater than that of the mid-car and the tail car, and the azmax is always greater than the aymax, which indicates that the vertical vibration degree of the train body is greater than that of the lateral vibration When the crosswind speed is unchanged, both the azmax and aymax have a significant increase with the increase in the operating speed. When the train is running at ultra-high speeds (600 km/h), we need to pay attention to the vertical vibration of the head car; at crosswind speeds of (0–20.7 m/s), its azmax value exceeds 0.5 m/s2. By analyzing the effects of different crosswind speeds, we can observe a slight increase in the values of both variables azmax and aymax with the increase in the crosswind speed.
Table 3.
Maximum acceleration of HTS maglev train operating at different speeds under different crosswind speeds.
3.2. The Sperling Index Value and the Vibration Acceleration Power Spectral Density of the HTS Maglev Train
Next, this study examines the Sperling index of the HTS train operating at different speeds under the crosswind speed of 17.1 m/s. The Sperling index is calculated for speeds of 400, 450, 500, 550, and 600 km/h, as shown in Figure 6. Figure 6a shows the lateral Sperling indexes of the HTS train at different train speeds under a crosswind load with a wind speed of 17.1 m/s, and Figure 6b shows the vertical performance. After that, we focused on a train speed of 600 km/h and analyzed the train’s running smoothness under various crosswind loads and wind speeds ranging from 0 m/s to 20.7 m/s. Figure 6 displays the resultant calculations. Based on the analysis of the curves in Figure 6 and Figure 7, it can be concluded that the lateral and vertical Sperling index for the three car bodies are all below 2.5 under various conditions, indicating an “excellent” rating. A comparison of the three car bodies shows that the middle car showed the best performance in both vertical and lateral stability, while the head and tail cars had poorer running smoothness, especially the head cars, in particular, which need extra attention. The reason for this could be attributed to the middle car’s constrained vibrations due to the hook force from the head and tail cars. Increasing the train speeds or crosswind speeds leads to worse running smoothness.
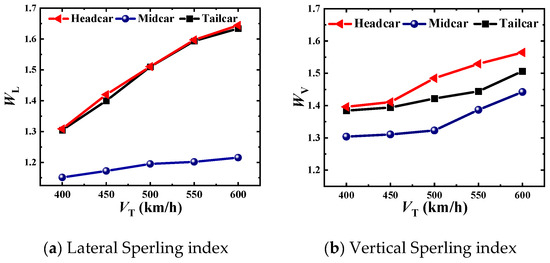
Figure 6.
Lateral and vertical Sperling indexes of the HTS maglev train at different train speeds under crosswind load with a wind speed of 17.1 m/s (VT, train speed).
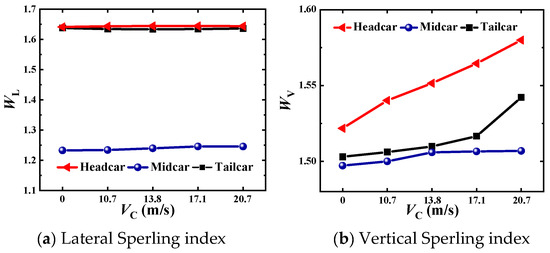
Figure 7.
Lateral and vertical Sperling indexes for the HTS maglev train operation at 600 km/h under crosswind load at different wind speeds (VC, crosswind speed).
Then we focused on the operation of HTS maglev trains at ultra-high speeds (600 km/h). Figure 7 shows the lateral and vertical Sperling index for the HTS train operation 600 km/h under a crosswind load at different wind speeds (0, 10.7, 13.8, 17.1, and 20.7 m/s). Figure 7a,b shows the lateral and vertical Sperling index values and variation trends, respectively. Under ultra-high speed (600 km/h) operation conditions, its Sperling index shows the same rule: the middle car body’s performance is the best, but the head and tail cars’ performance are poorer. Based on Figure 6 and Figure 7, a comparison of the lateral and vertical Sperling indexes shows that increasing the train speed has a greater impact on the lateral stability, while increasing the crosswind speed has a greater effect on the vertical stability. As the train speed increased from 400 km/h to 600 km/h, the head car’s lateral Sperling index increased by 25%, emphasizing the significant impact of high-speed train operation on the car body stability. Nevertheless, under ultra-high speed (600 km/h) operation, the increase in the crosswind speed had a maximum effect of only 3.8% on the trains’ vertical Sperling index, indicating the adequate running smoothness of the HTS maglev train under a crosswind load.
The power spectral density (PSD) function is a widely used method for describing random vibrations. It utilizes the squared values of the spectral density to depict the frequency domain characteristics of the random vibration signals. The PSD can provide information about the energy distribution of the vibration signal in different frequency domains. So, to better analyze the effects of the train speed and crosswind load wind speed on train vibration acceleration, we extracted the PSD of the acceleration under various operating conditions, as shown in Figure 8, Figure 9 and Figure 10. Figure 8 and Figure 9, respectively, show and compare the vertical and lateral vibration acceleration power spectral densities of HTS maglev trains operating at different speeds (400, 450, 500, and 550 km/h) under a crosswind velocity of 17.1 m/s.
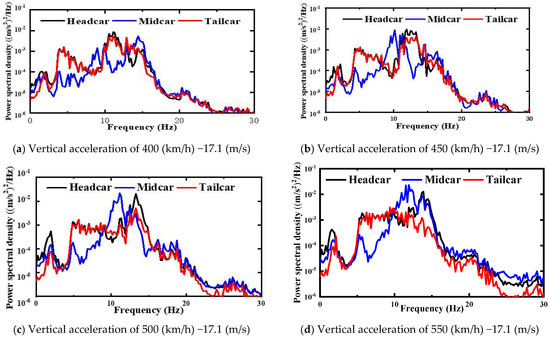
Figure 8.
Vertical acceleration power spectral density of the train body under different working conditions.
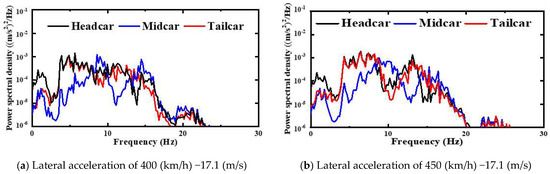
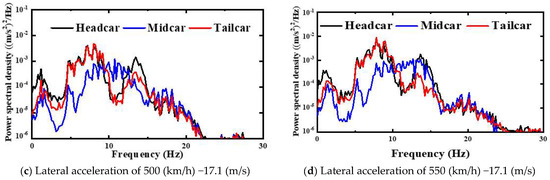
Figure 9.
Lateral vibration acceleration power spectral density of the train body under different working conditions.
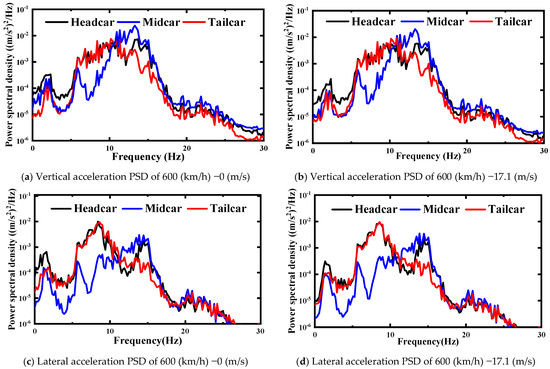
Figure 10.
Vertical and lateral vibration acceleration power spectral density of the train bodies at 600 km/h under different crosswind speeds.
Observing Figure 8, it can be seen that the mid-car body exhibits a significant dominant frequency vibration at 10 Hz, while the vibrations of the head and rear cars at this frequency have relatively lower energy amplitudes. In the vibration situation between 0 and 5 Hz and after 15 Hz, the curves of the three car bodies exhibit similar patterns. The low-frequency vibration of 0–5 Hz shows a distinct peak, and the curve gradually decreases and becomes flat after exceeding 15 Hz, indicating lower energy and more randomness in high-frequency vibrations vertically. In the range of 5–15 Hz, the vibration situation of the mid-car body is noticeably different: when the acceleration PSD of the head and tail cars reaches a peak, the curve of the middle car body is often concave downward. This suggests that within this frequency range, the vibration of the middle car body is influenced by the vibrations of the front and rear cars, potentially affected by other factors leading to vibration attenuation or interference. The three sections of the train body are interconnected through predetermined coupler forces. Therefore, there is an interaction between the three train bodies during operation. Additionally, the head and tail cars have partially streamlined bodies, resulting in different aerodynamic loads compared to the intermediate cars. As a result, the three train bodies exhibit distinct vibration responses.
Observing Figure 9, it is evident that in vibrations below 10 Hz, the mid-car exhibits a similar trend to the head and tail cars, but with significantly smaller values than the head car. This indicates that the low-frequency lateral vibration patterns of the three car bodies are consistent, but the mid-car has weaker vibration energy. However, in the frequency range of 10–15 Hz, the middle car body exhibits an opposite trend compared to the front and rear cars. Additionally, when the frequency exceeds 20 Hz, the vibration energy becomes extremely weak. As the train speed increases, there is an increase in the maximum value of the curve and the high-frequency vibration response. Considering and analyzing Figure 8 and Figure 9 together. The power spectral density of the acceleration of the mid-car is significantly lower than that of the head car and tail car both vertically and laterally. By comparing Figure 8 and Figure 9, we can find that with the increasing train speed, the lateral and vertical responses in various frequency ranges are enhanced, but the vertical response is significantly larger than the lateral response at higher frequencies. The lateral response is primarily concentrated below 20 Hz, while the vertical response also exhibits a noticeable response in the 20–30 Hz frequency range.
Figure 10 presents the power spectral density of acceleration for the train running at a speed of 600 km/h under different wind speeds. It can be observed that at ultra-high speeds (600 km/h), there is a significant increase in the high-frequency response of acceleration in both lateral and vertical directions. By observing Figure 10a,b, it can be noted that among the three curves, the maximum value belongs to the mid-car body and occurs at around 13 Hz. This frequency is higher compared to the observations in Figure 8. By comparing Figure 10c,d, it can be observed that the peak value of the lateral vibration response curve of the mid-car body is significantly smaller compared to the vertical response. Additionally, the response at higher frequencies (above 20 Hz) is noticeably smaller. Comparing Figure 10a–d, it can be concluded that the influence of an increased crosswind load on the lateral and vertical vibration responses of the car body is relatively weak.
The variation of the maximum vibration acceleration with wind speed (Table 2) reveals that as the wind speed increases, the maximum acceleration value also increases. This is because the applied aerodynamic load increases with the crosswind speed, which corresponds to an increasing external input load on the vibration system, thus amplifying the vibration energy. However, from Figure 9, it can be observed that the influence of the crosswind load on the frequency domain distribution of the vehicle’s vibration is relatively small. This is because the applied aerodynamic load is steady, and further research can be conducted to investigate the effects of unsteady aerodynamic loads.
4. Conclusions
This paper offers an analysis and evaluation of the riding comfort of the HTS maglev train (considering the aerodynamic loads under steady-state crosswinds) using the maximum acceleration limits and the Sperling index. By examining the power spectral density of the vibration acceleration during train operations under different conditions, the study investigates the effects of increasing the operating speed and crosswind speed on the train’s dynamic characteristics. The following conclusions were derived from the analysis:
- (1)
- The HTS maglev train meets the maximum acceleration limits at operating speeds of 400, 450, 500, and 550 km/h under a crosswind speed of 17.1 m/s. However, at a speed of 600 km/h, the maximum acceleration limit of the head car exceeds the standard, indicating a need for special attention to the riding comfort of the head car.
- (2)
- Under various operating conditions, the Sperling index of HTS maglev trains consistently rates as “excellent”, and the mid-car exhibits optimal running smoothness.
- (3)
- Based on the analysis of the lateral and vertical acceleration power spectral density of the three carriages, in various operating conditions, the vertical vibrations exhibit a wider frequency range and larger response values, and the vibration response patterns of the middle carriage often differ from those of the head and tail cars.
- (4)
- Increasing the operating speed of the train will significantly increase the power spectral density of the vibration acceleration of the train body, particularly in its high-frequency response, both vertically and laterally. However, the impact of increasing the crosswind speed on the train’s vibration is not significant.
According to the analysis and conclusions of this study, it is evident that under steady-state crosswind conditions, the vibration frequency and amplitude of the HTS maglev train’s three bodies increase as the train speed rises, with the head car showing poorer performance. Therefore, in addition to the train’s suspension system, consisting of the primary suspension and secondary suspension (air springs) to isolate the vibrations, it is recommended to incorporate additional vibration-damping measures such as electromagnetic dampers. Moreover, improving the riding comfort of the head car can also be achieved by adjusting the damping and stiffness design parameters of its secondary suspension. Overall, the HTS maglev train maintains good riding comfort operating at extra speeds, even under steady crosswind loads. However, special attention should be given to the lateral and vertical riding comfort of the head car.
Author Contributions
Conceptualization, Z.L. and X.W.; Data curation, Z.L. and X.W.; Formal analysis, Z.L.; Funding acquisition, Z.D. and P.L.; Investigation, Z.L.; Methodology, Z.L. and X.W.; Project administration, Z.D. and P.L.; Resources, X.W. and J.W.; Software, Z.L. and Y.D.; Supervision, Z.D.; Visualization, Z.L.; Writing—original draft, Z.L.; Writing—review and editing, Z.L. All authors have read and agreed to the published version of the manuscript.
Funding
This research was funded by the S&T Program of Hebei (215676145H), and the Open Project of State Key Laboratory of Mechanical Behavior and System Safety of Traffic Engineering Structures (KF2022-13).
Institutional Review Board Statement
Not applicable.
Informed Consent Statement
Not applicable.
Data Availability Statement
Data are contained within the article.
Conflicts of Interest
The authors declare no conflict of interest.
References
- TB 10630-2019; Technical Standard for Maglev Railway (Trial). National Railway Administration; China Railway Publishing House: Beijing, China, 2019.
- Hellman, F.; Gyorgy, E.M. Levitation of a magnet over a flat type II superconductor. Appl. Phys. 1988, 63, 447–450. [Google Scholar] [CrossRef]
- Sawada, K. Outlook of the superconducting Maglev. Proc. IEEE 2009, 97, 1881–1885. [Google Scholar] [CrossRef]
- Stephan, R.M.; de Andrade, R. Superconducting light rail vehicle a transportation solution for highly populated cities. IEEE Veh. Technol. 2012, 7, 122–127. [Google Scholar] [CrossRef]
- Werfel, F.N. Large-scale HTS bulks for magnetic application. Phys. C 2013, 484, 6–11. [Google Scholar] [CrossRef]
- Deng, Z.; Li, J.; Zhang, W.; Gou, Y.; Ren, Y.; Zheng, J. High Temperature Superconducting Magnetic Levitation Vehicles: Dynamic Characteristics While Running on a Ring Test Line. IEEE Veh. Technol. Mag. 2017, 12, 95–102. [Google Scholar] [CrossRef]
- Wang, L.; Deng, Z.; Wang, H.; Li, H.; Li, K.; Ma, S. Dynamic Responses of HTS Maglev System under Track Random Irregularity. IEEE Trans. Appl. Supercond. 2020, 30, 3602007. [Google Scholar] [CrossRef]
- Werfel, F.; Floegel-Delor, U.; Rothfeld, R.; Riedel, T.; Koenig, R. Experiments of superconducting Maglev ground transportation. IEEE Trans. Appl. Supercond. 2016, 26, 3602105. [Google Scholar] [CrossRef]
- Motta, E.; Dias, D.; Sotelo, G.; Stephan, R. Dynamic tests of an optimized linear superconducting levitation system. IEEE Trans. Appl. Supercond. 2013, 23, 3600504. [Google Scholar] [CrossRef]
- Deng, Z.; Wang, L.; Li, H.; Li, J.; Wang, H.; Yu, J. Dynamic studies of the HTS Maglev transit system. IEEE Trans. Appl. Supercond. 2021, 31, 6600703. [Google Scholar] [CrossRef]
- Wang, H.; Deng, Z.; Ma, S.; Sun, R.; Li, H.; Li, J. Dynamic simulation of the HTS maglev vehicle-bridge coupled system based on levitation force experiment. IEEE Trans. Appl. Supercond. 2019, 29, 3601606. [Google Scholar] [CrossRef]
- Rezvani, A.; Mohebbi, M. Numerical calculations of aerodynamic performance for ATM train at crosswind conditions. Wind Struct. 2014, 18, 529–548. [Google Scholar] [CrossRef]
- Schetz, J. Aerodynamics of high-speed trains. Annu. Rev. Fluid Mech. 2001, 33, 371–414. [Google Scholar] [CrossRef]
- Coleman, S.; Baker, C. High-sided road vehicles in crosswinds. J. Wind Eng. Ind. Aerodyn. 1990, 36, 1383–1392. [Google Scholar] [CrossRef]
- Baker, C.J. The simulation of unsteady aerodynamic cross wind forces on trains. J. Wind Eng. Ind. Aerodyn. 2009, 98, 88–99. [Google Scholar] [CrossRef]
- Baker, C.; Hemida, H.; Iwnicki, S. Integration of crosswind forces into train dynamic modeling. Proc. Inst. Mech. Eng. Part F J. Rail Rapid Transit 2011, 225, 154–164. [Google Scholar] [CrossRef]
- Liu, D.; Liang, X.; Zhou, W. Contributions of bogie aerodynamic loads to the crosswind safety of a high-speed train. J. Wind Eng. Ind. Aerodyn. 2022, 28, 105082. [Google Scholar] [CrossRef]
- Yao, Z.; Zhang, N.; Li, X.; Liu, Z. Simulation on Unsteady Crosswind Forces of a Moving Train in a Three-Dimensional Stochastic Wind Field. Appl. Sci. 2022, 12, 12183. [Google Scholar] [CrossRef]
- Baker, C.; Jones, J.; Lopez-Calleja, F. Measurements of the crosswind forces on trains. J. Wind Eng. Ind. Aerodyn. 2004, 92, 547–563. [Google Scholar] [CrossRef]
- Gallagher, M.; Morden, J.; Baker, C. Trains in crosswind—Comparison of full-scale on-train measurements, physical model tests, and CFD calculations. Wind Eng. Ind. Aerodyn. 2018, 175, 428–444. [Google Scholar] [CrossRef]
- Hashmi, S.; Hemida, H.; Soper, D. Wind tunnel testing on a train model subjected to crosswinds with different windbreak walls. J. Wind Eng. Ind. Aerodyn. 2019, 195, 104013. [Google Scholar] [CrossRef]
- He, X. Experimental study on aerodynamic characteristics of a high-speed train on viaducts in turbulent crosswinds. Cent. South Univ. 2020, 27, 2465–2478. [Google Scholar] [CrossRef]
- Hemida, H.; Baker, C. Large-eddy simulation of the flow around a freight wagon subjected to a crosswind. Comput. Fluids 2010, 39, 1933–1956. [Google Scholar] [CrossRef]
- Li, T.; Qin, D.; Zhang, J. Effect of RANS Turbulence Model on Aerodynamic Behavior of Trains in Crosswind. Chin. J. Mech. Eng. 2019, 32, 5–12. [Google Scholar] [CrossRef]
- Han, J.; Kim, K. Characteristics of vibration in magnetically levitated trains subjected to crosswind. Proc. Inst. Mech. Eng. Part F J. Rail Rapid Transit 2018, 232, 1347–1359. [Google Scholar] [CrossRef]
- Liang, X.; Shen, X. Lateral aerodynamic performances of maglev train when two trains meet with wind blowing. J. Cent. South Univ. 2007, 38, 751–757. [Google Scholar]
- Wang, X.; Hu, X.; Wang, J. Safety analysis of high temperature superconducting maglev train considering the aerodynamic loads under crosswinds. Proc. Inst. Mech. Eng. Part C J. Mech. Eng. Sci. 2023, 10, 2279–2290. [Google Scholar] [CrossRef]
- Kou, L.; Deng, Z.; Li, H.; Wang, L.; Rao, Y.; Ke, Z. A Two-Dimension Force Model between High-Temperature Superconducting Bulk YBaCuO and Halbach-Type Permanent Magnet Guideway. IEEE Trans. Appl. Supercond. 2021, 31, 3602208. [Google Scholar] [CrossRef]
- CJJ/T 310-2021; Standard for the Design of High-Speed Maglev Traffic. Ministry of Housing and Urban-Rural Development (MOHURD): Beijing, China, 2021.
- Li, T. Approaches and Dynamic Performances of High Speed Train Fluid-Structure. Ph.D. Thesis, Southwest Jiaotong University, Chengdu, China, 2012. [Google Scholar]
- GBT5599-2019; Specification for Dynamic Performance Assessment and Testing Verification of Rolling Stock. Chinese Standard: Beijing, China, 2019.
Disclaimer/Publisher’s Note: The statements, opinions and data contained in all publications are solely those of the individual author(s) and contributor(s) and not of MDPI and/or the editor(s). MDPI and/or the editor(s) disclaim responsibility for any injury to people or property resulting from any ideas, methods, instructions or products referred to in the content. |
© 2023 by the authors. Licensee MDPI, Basel, Switzerland. This article is an open access article distributed under the terms and conditions of the Creative Commons Attribution (CC BY) license (https://creativecommons.org/licenses/by/4.0/).