Review

A Review of Research on the Impact Mechanisms of Green Development in the Transportation Industry

School of Economics and Management, Beijing Jiaotong University, Beijing 100091, China
*
Author to whom correspondence should be addressed.
Sustainability 2023, 15(23), 16531; https://doi.org/10.3390/su152316531
Submission received: 12 September 2023 / Revised: 26 November 2023 / Accepted: 29 November 2023 / Published: 4 December 2023

Abstract

:
Green development in the transportation industry is a new type of development. As the huge energy consumption and carbon emissions generated by the transportation industry have caused many environmental problems, the healthy and environmentally friendly mode of industrial development has received more and more attention. However, the quantification of green development in the transportation industry varies in terms of boundaries, scope, and methods. Due to digital empowerment, the degree of influence and direction of the factors affecting the green development are not fixed. The prediction of future development prospects is relatively single-minded, lacking a comprehensive simulation scenario setting from multiple perspectives. This paper systematically reviews the research progress of green development of the transportation industry from three aspects: development performance assessment, influence mechanism analysis, and development path exploration. After a critical analysis, this study concludes that (1) a clear methodology is needed to assess the direct and indirect non-desired output results of the transportation industry; (2) considering the endogenization of the level of technology, the influence of the interaction between the influencing factors, etc., on the degree and direction of the role of the factors, a more scientific econometric model should be established for in-depth discussion; (3) resident travel options are an important factor affecting environmental issues in transportation. Carbon emission projections and analyses of emission reduction scenarios should integrate the multiple possibilities of residential preferences and policy incentives. The findings of this paper provide valuable references to the energy saving and emission reduction goals of the transportation industry, and the coordinated development of the industry and the economy.

1. Introduction

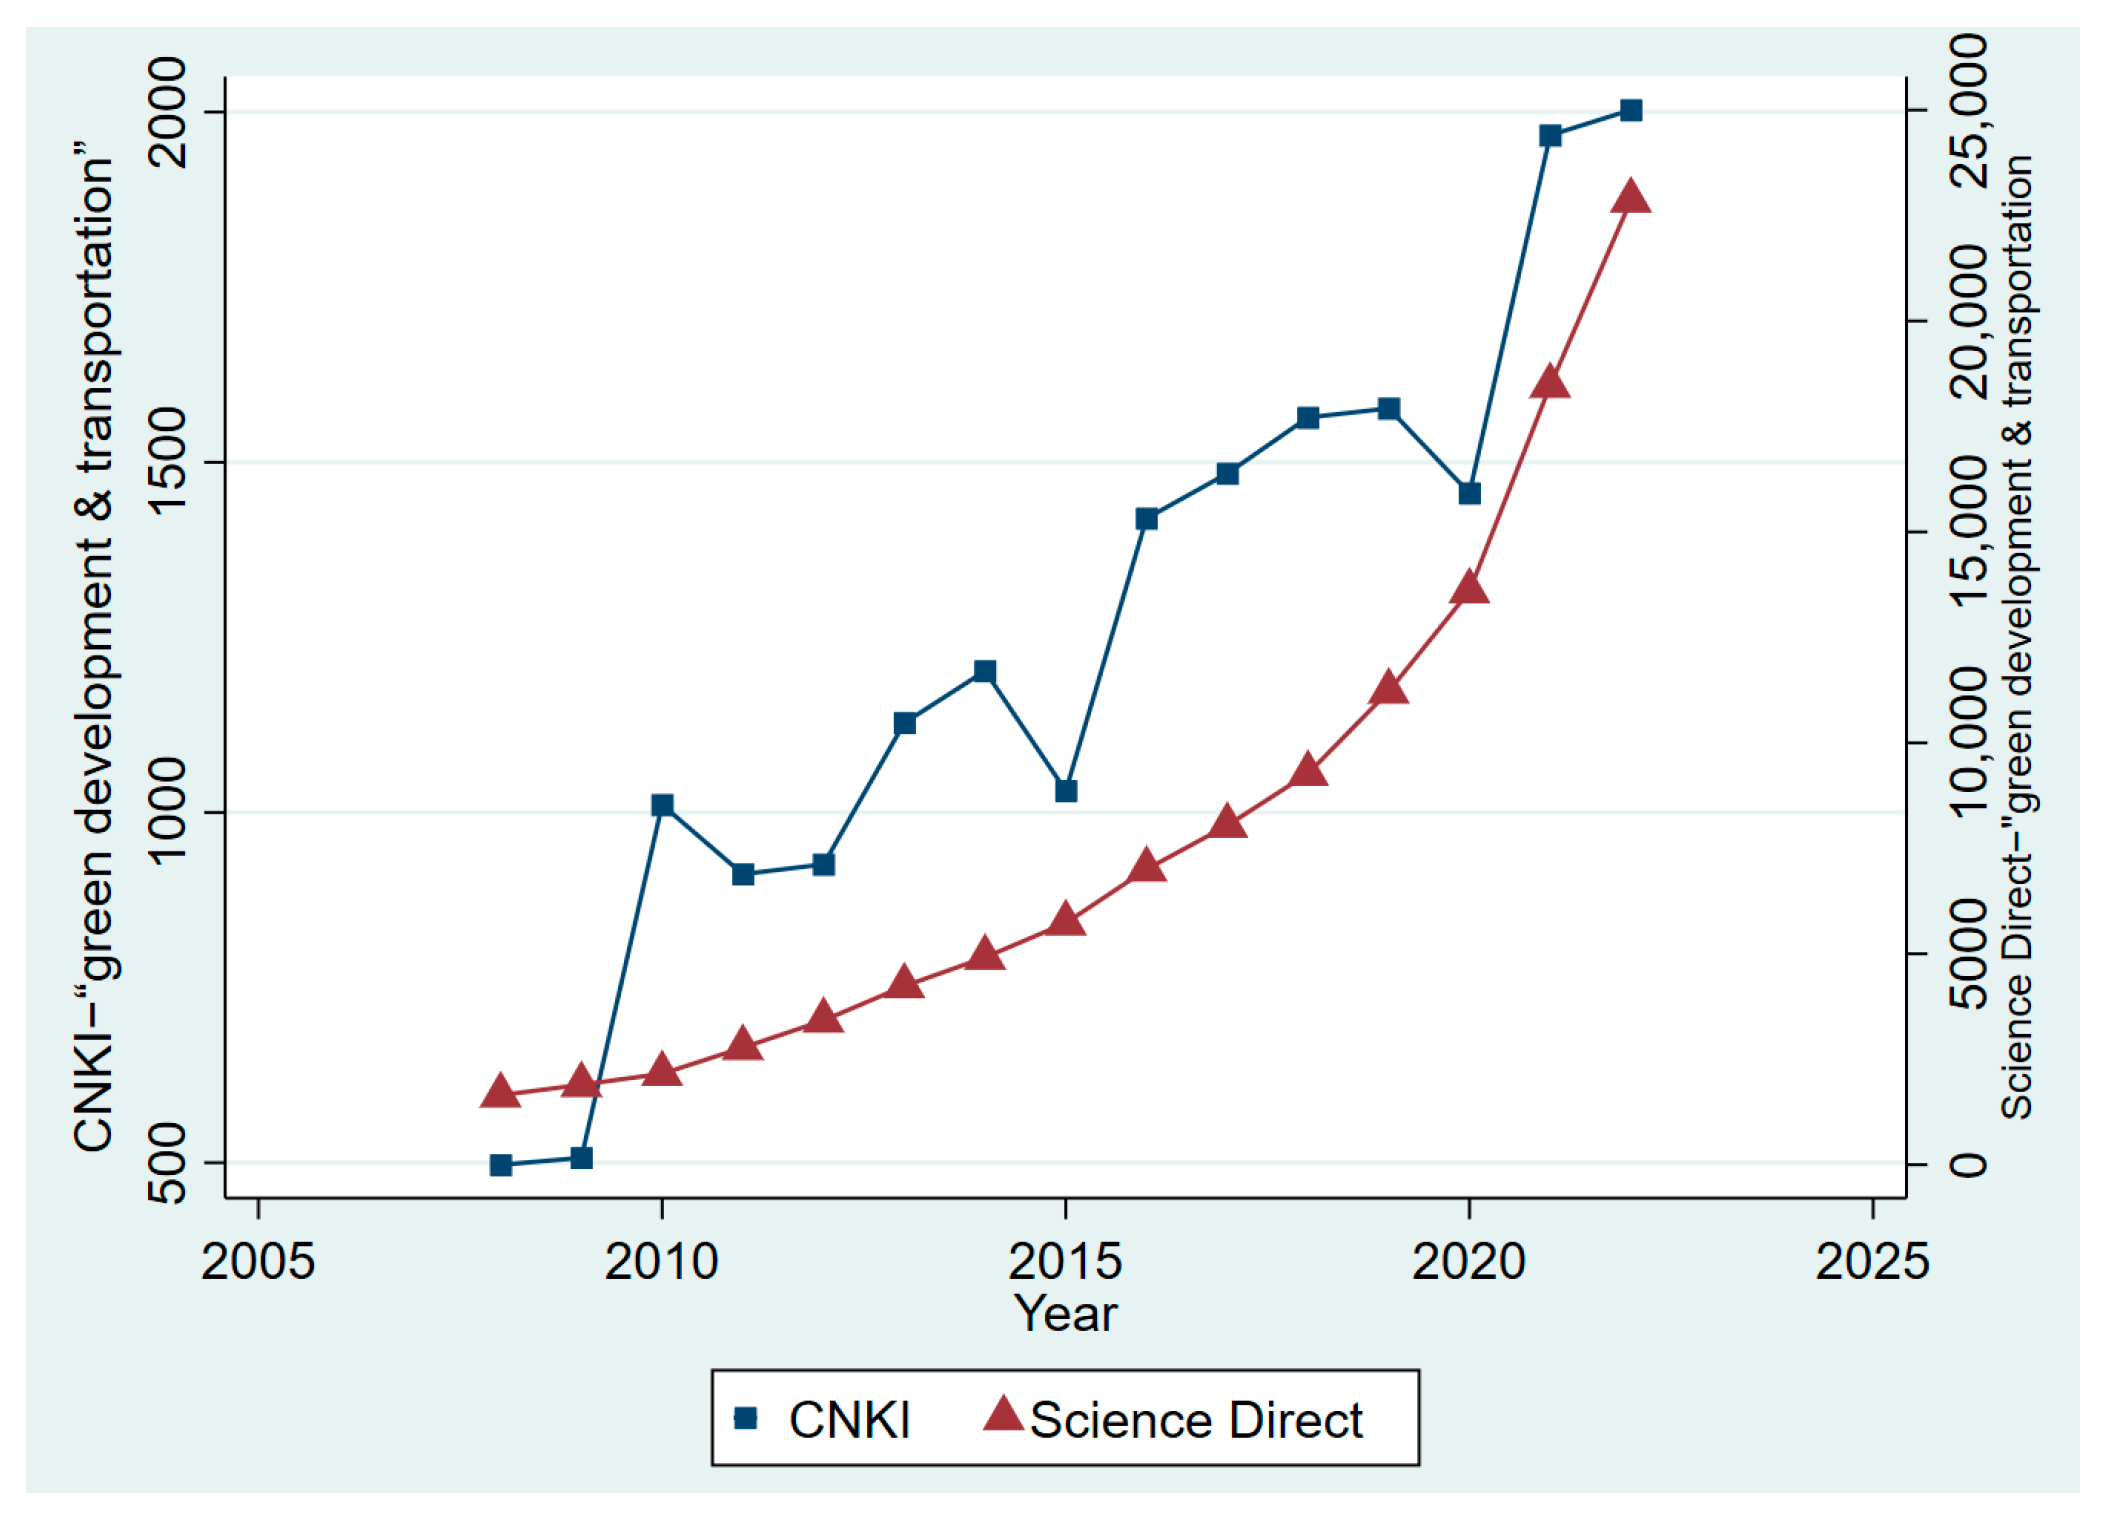
In the current scenario, where transportation predominantly contributes to extreme pollution, energy-consuming nations are continuously striving to find ways to ensure environmental sustainability. The transportation sector, a critical link between a nation’s production and consumption, is also one of the primary sources of energy consumption and carbon emissions. Since 2017, the transportation sector has emerged as the world’s second-largest contributor. Despite a decrease in residents’ travel needs due to the significant global public health event in 2020, energy consumption in the transportation field still accounted for about 26% of the total in 2022 [1], and carbon emissions amounted to approximately 21% (as shown in Figure 1) [2]. Projections by the IEA suggest that, by 2030, the share of CO2 emissions from all sectors might rise to 50%, and, by 2050, it is expected to reach 80% [1]. Experiences from developed countries indicate that only with the transportation sector’s synchronous development with the economy can the overall advantages and comprehensive benefits of the transportation system be fully realized, elevating the level of transportation development to new heights [3]. Simultaneously, the ‘Green Economy Blue Book’ points out that ‘green development’ represents a more resource-efficient, cleaner, and recoverable state of development, an active interaction between ‘economy-nature-society’ [4], and a state of balance between resources, environment, and economic development [5]. With the rapid growth in emerging industries, such as ride-hailing services, shared bicycles, and online freight platforms, low-carbon production and lifestyles in the transportation sector are gradually taking shape. Additionally, virtual reality technology has also been substantiated as a mitigating factor for the downturn in the tourism industry during the COVID-19 pandemic by altering consumer patterns [6]. Furthermore, it facilitates addressing the challenges of sustainable development in urban transportation [7]. This impact persists into the post-pandemic era, indicating a paradigm shift in the transportation sector. The concept of green development has permeated various dimensions of the transportation sector, redirecting its developmental trajectory. The sector is increasingly prioritizing quality and efficiency of development over mere speed and scale. A search in CNKI and Science Direct using relevant keywords reveals a significant increasing trend in research on green development in the transportation field across various countries (as shown in Figure 2), yet there is still vast room for research.
The global transportation industry continues to face immense pressure to reduce emissions, particularly those of energy consumption and carbon emissions. Figure 3 shows the variations in CO2 emissions from the transportation sectors of 18 typical economies [1,8,9,10]. Represented by the United States, France, Germany, Portugal, and the United Kingdom, the CO2 emissions from the transportation sectors of many countries occupy a relatively large share of their total energy consumption carbon emissions, especially in the United States, where it accounts for 33% of national carbon emissions. Meanwhile, for many EU countries in the middle to late stages of industrialization, with relatively stable transportation service development, the transportation sector has become the only sector with continuous growth in carbon emissions. Therefore, the development of this global high-energy-consuming industry—the transportation sector—should adapt to various urbanization needs and simultaneously reduce its negative impact on the environment to achieve ecological sustainability [11]. Global research has progressively confirmed the correlation between transportation and green development, with an increasing number of studies emphasizing the construction of more comprehensive and integrated approaches to understand the significance of achieving green development in the transportation sector.
In addressing the issue of green development in the transportation sector, research can be categorized into three pivotal aspects: ‘What’, ‘Why’, and ‘How’. Firstly, the quantification of green development indicators in the transportation sector has shifted from merely focusing on production, organizational, and service efficiencies to a more comprehensive measurement of green efficiency [12,13]. This primarily emphasizes energy consumption as an input indicator and direct carbon emissions as an undesirable output indicator. However, the carbon transfer between the transportation sector and other sectors, despite its role as a vital connector across regions and industries, is often overlooked. A contemplative approach is needed to scientifically measure the green development of transportation. Secondly, existing research has explored the key factors influencing the green development process of the transportation sector from multiple dimensions, including scale effect, structural effect, technological effect, and external policies [14,15]. However, the analysis of the correlation between technological innovation pace, market acceptance, energy consumption, and carbon emissions levels is not thorough and is influenced by the variability of short-term and long-term factors. Additionally, as the influence of resident preferences on urban transportation greening deepens, discussions of subjective factors should not be neglected. Lastly, to enhance green efficiency in the transportation sector and reinforce the importance of factors positively impacting energy conservation and emission reduction targets, the potential for carbon emission reduction in the transportation sector has garnered widespread attention among scholars globally [16]. Although various scenario simulations are increasingly refined, discussions from a full lifecycle perspective remain insufficient, and potential analyses based solely on carbon emissions lack persuasiveness.
This study aims to review the current state of research on green development in the transportation sector and to deeply explore the relationship between transportation systems and the economic–social–environmental systems. Utilizing research content, such as efficiency measurements, factor identification, and emission reduction pathway analysis, this study explores the operational and developmental potential of national or regional transportation systems. Simultaneously, it reveals the gaps and contradictions in existing research, providing direction for stakeholders seeking sustainable development pathways in the transportation industry and supporting the development decisions of governments and managers.
The remainder of this paper is organized as follows. Section 2 analyzes the efficiency indicators and quantification methods of green development in the transportation industry. Section 3 discusses the factors affecting the green development of the transportation industry and the mechanisms of action. Section 4 predicts the carbon emission reduction pathways of the transportation sector under different scenarios. Finally, we draw conclusions in Section 5.

2. Research on the Efficiency of Green Development of the Transportation Industry

2.1. The Connotation and Measurement Index of Green Development Efficiency

In the realm of transportation, a global standard to gauge the sector’s green development has yet to be established. However, the foundational framework typically emphasizes the measurement of efficiency values. Contemporary research has shifted focus from production, organizational, and service efficiencies towards a green efficiency paradigm. In the early stages of research, the transportation sector’s economic viability was primarily assessed, with industrial output or turnover serving as the sole output metric for evaluating transportation efficiency [17,18]. Metrics, such as per unit freight turnover [19], carbon emission conversion per unit turnover [20], and carbon emission intensity [21], were employed to quantify carbon emission efficiency, thus, reflecting the production or organizational efficiency within the transportation sector under environmental impacts.
In recent years, the limitations of single-metric approaches, which assess efficiency from a solitary perspective, have become evident. These approaches fail to capture the multidimensional nature of economic green development efficiency. Consequently, there is a growing interest in harmonizing environmental and economic benefits to comprehensively reflect the actual production processes in transportation. Adopting a total factor perspective, a more intricate system for evaluating green efficiency in the transportation sector has been developed. This system incorporates capital stock, labor, and energy consumption as input metrics, with transport turnover and the added value of the transportation sector as desired output indicators, and carbon dioxide, nitrogen oxides, and sulfur dioxide as undesired output indicators [22,23,24,25]. Superseding traditional single metrics or unilaterally emphasized production function indicators, green total factor productivity and environmental efficiency indicators, which reflect the coordinated development relationship between the industry and environment, have emerged as the primary tools for quantifying the green development performance in the transportation sector. Table 1 elucidates the definitions and quantification methods of various total factor production efficiencies.

2.2. Methods for Measuring Green Development Efficiency

2.2.1. Static Analysis Methodology

The essence of green efficiency lies in the consideration of pollution emissions and energy consumption within the efficiency of production technology. As a form of relative efficiency analysis, the measurement of green efficiency necessitates the construction of a production frontier; hence, stochastic frontier analysis (SFA) and data envelopment analysis (DEA) are commonly employed assessment methods. The SFA model, which predetermines the form of the production function, is specifically applied to the production processes of enterprises. It serves as an efficient means to eliminate the impact of managerial efficiency in measuring the efficiency of various indicators. However, it is susceptible to structural biases due to the potential misspecification of the production function [26,28,30]. The DEA model, capable of better fitting multi-output production activities that include undesired outputs and circumventing the rigid assumptions of model specification and the normal distribution of stochastic error terms inherent in SFA, finds more extensive application in efficiency evaluation from a static perspective [29]. Utilizing linear programming and convex analysis to establish the production frontier boundary, the DEA model projects different decision-making units (DMUs) onto this boundary. The relative efficiency among DMUs is evaluated based on their deviation from this frontier, where DMUs on the boundary are considered technically efficient ( e f f i c i e n c y = 1 ), while those below it are deemed technically inefficient ( e f f i c i e n c y < 1 ).
Moreover, a fundamental requirement of the traditional DEA model is the minimization of inputs for a corresponding maximization of outputs, making it unsuitable to incorporate environmental pollution variables. Hence, numerous methodologies have been proposed to integrate environmental pollution variables into the productivity analysis framework. For instance, multi-stage DEA models [27,31], SBM-DEA models [32,33,34], super-SBM models [35,36], and network DEA models [37,38] consider the impacts of random errors and relaxation of factors. By distinguishing environmental factors, random errors, and internal management variables, these extended models enhance the accuracy of measuring green development efficiency in industries, such as manufacturing and transportation. However, DEA models do not account for temporal factors and efficiency changes over time, which may lead to incompleteness in evaluation results under certain circumstances.

2.2.2. Dynamic Analysis Methodology

The DEA model is limited in its ability to reflect the trend of productivity changes and often requires a long series of empirical data to deduce the dynamic characteristics of efficiency. Thus, the Malmquist index based on directional distance functions [39,40,41], and its extended analytical methods, such as the meta-frontier Malmquist index analysis [42,43], have been developed to overcome the lack of dynamic perspective in efficiency evaluation inherent in the DEA model. These methods are pivotal in assessing the environmental performance of the transportation sector from a dynamic angle. Additionally, the actual production technology efficiency in the industry encompasses a wide array of variables, many of which are beyond subjective control. Research has introduced external environmental variables, such as technological advancement, environmental regulations, and asset structure, continuously refining the green development evaluation indicators for the transportation industry [44,45,46]. By synthesizing indicator selections and quantification methods from the domestic and international literature, the selection and quantification methods for input, desired output, and undesired output indicators have gained widespread recognition. Detailed selections and quantification methods for these indicators are presented in Table 2.
Table 2. Input–output index selection and quantification.
TypeVariablesQuantization Method
InputCapital stockThe investment of fixed assets in transportation, warehousing, and postal services shall be converted into 2002 comparable prices according to the price index (unit: RMB 100 million).
Labor forceNumber of employees in the transportation industry (unit: 10,000).
Energy consumptionConsumption of electricity, heat, gasoline, natural gas, and raw coal converted into standard coal (unit: 10,000 tons of standard coal).
Implied energyMeasured according to a non-competitive input–output model (unit: 10,000 tons of standard coal).
Expected outputGross industrial productTransport, storage, and postal products are converted into 2002 comparable prices using the deflator (unit: 100 million yuan).
Passenger/freight turnoverTotal passenger turnover (unit: 10,000 people/km).
Total turnover of goods (unit: 10,000 ton-km).
Social development indexAccording to the social dimension index system (as shown in Table 3), P i = l = 1 m ω l R i l , ( ω l is the weights of indicators l , and R i l is the standardized value of the l index in region i after polar fingering).
Undesirable outputCarbon dioxide emissionAccording to the IPCC (2006), C t = 44 12 × i E t i × L C V i × C F t i × O i .
Implicit carbonMeasured by a non-competitive input–output model (unit: 1 m tons).
External environmentTechnological progressR&D expenditure (unit: 100 million yuan).
Environmental regulationRatio of industrial added value to total energy consumption (unit: yuan/ton).
Endowment structureRatio of capital stock to labor force (unit: ten thousand yuan/person).
Note: In the carbon emission accounting formula, C t refers to the total carbon emission in year t, 44/12 is the molecular weight of carbon in carbon dioxide, E t i represents the consumption of energy i in year t, L C V i represents the thermal equivalent of energy i, C F t i represents the carbon emission factor of energy i, and O i represents the carbon oxidation factor of energy i.
Table 3. Social dimension index system.
Target LayerCriterion LayerIndicator Layer
Social development indexLiving standardGDP per capita
Town Engel coefficient
Rural Engel coefficient
Urbanization levelDisposable income of urban residents
Built-up area
Proportion of non-agricultural population in total population
Transport levelFreight turnover
Passenger turnover
Traffic accident volume
Scientific and educational levelNumber of universities and research institutions
The proportion of expenditure on science and education institutions in the government budget
Number of patents granted

2.2.3. Spatial Analysis Methodology

With the progressively widespread application of spatial econometric methods, the spatial spillover effects of carbon emissions, a crucial indicator of industrial development efficiency, have garnered extensive attention. Utilizing spatial autocorrelation analysis to construct spatial panel models, it has been observed that technological externalities and production process dependencies in industrial development significantly influence carbon emissions due to the characteristics of neighboring regions, exhibiting notable spatial correlations [47,48]. In the case of the transportation sector, a vital inter-regional connector, its spatial dependency is even more pronounced. Numerous studies have confirmed the spatial clustering characteristics and regional disparities in carbon emissions from the transportation sector, with economically advanced regions being more affected [49,50,51]. Furthermore, to explore the structural characteristics of total carbon emissions after integrating spatial correlation effects, as well as to delve deeper into the spatial patterns and evolution of carbon emissions across different industries and sectors [52], social network analysis has begun to be applied in studying the spatial correlation networks of carbon emissions. Many scholars have employed this methodology to construct networks concerning specific areas, such as aviation [53,54], urban public transportation [55,56], industry-wide mobility [57], and regional carbon emission networks [58,59], to simulate and analyze the spatial evolution of carbon emissions.

3. Research on the Mechanisms of Green Development in the Transportation Industry

3.1. Analysis of Factors Affecting the Green Development of the Transportation Industry

3.1.1. Explanation of Influencing Factors

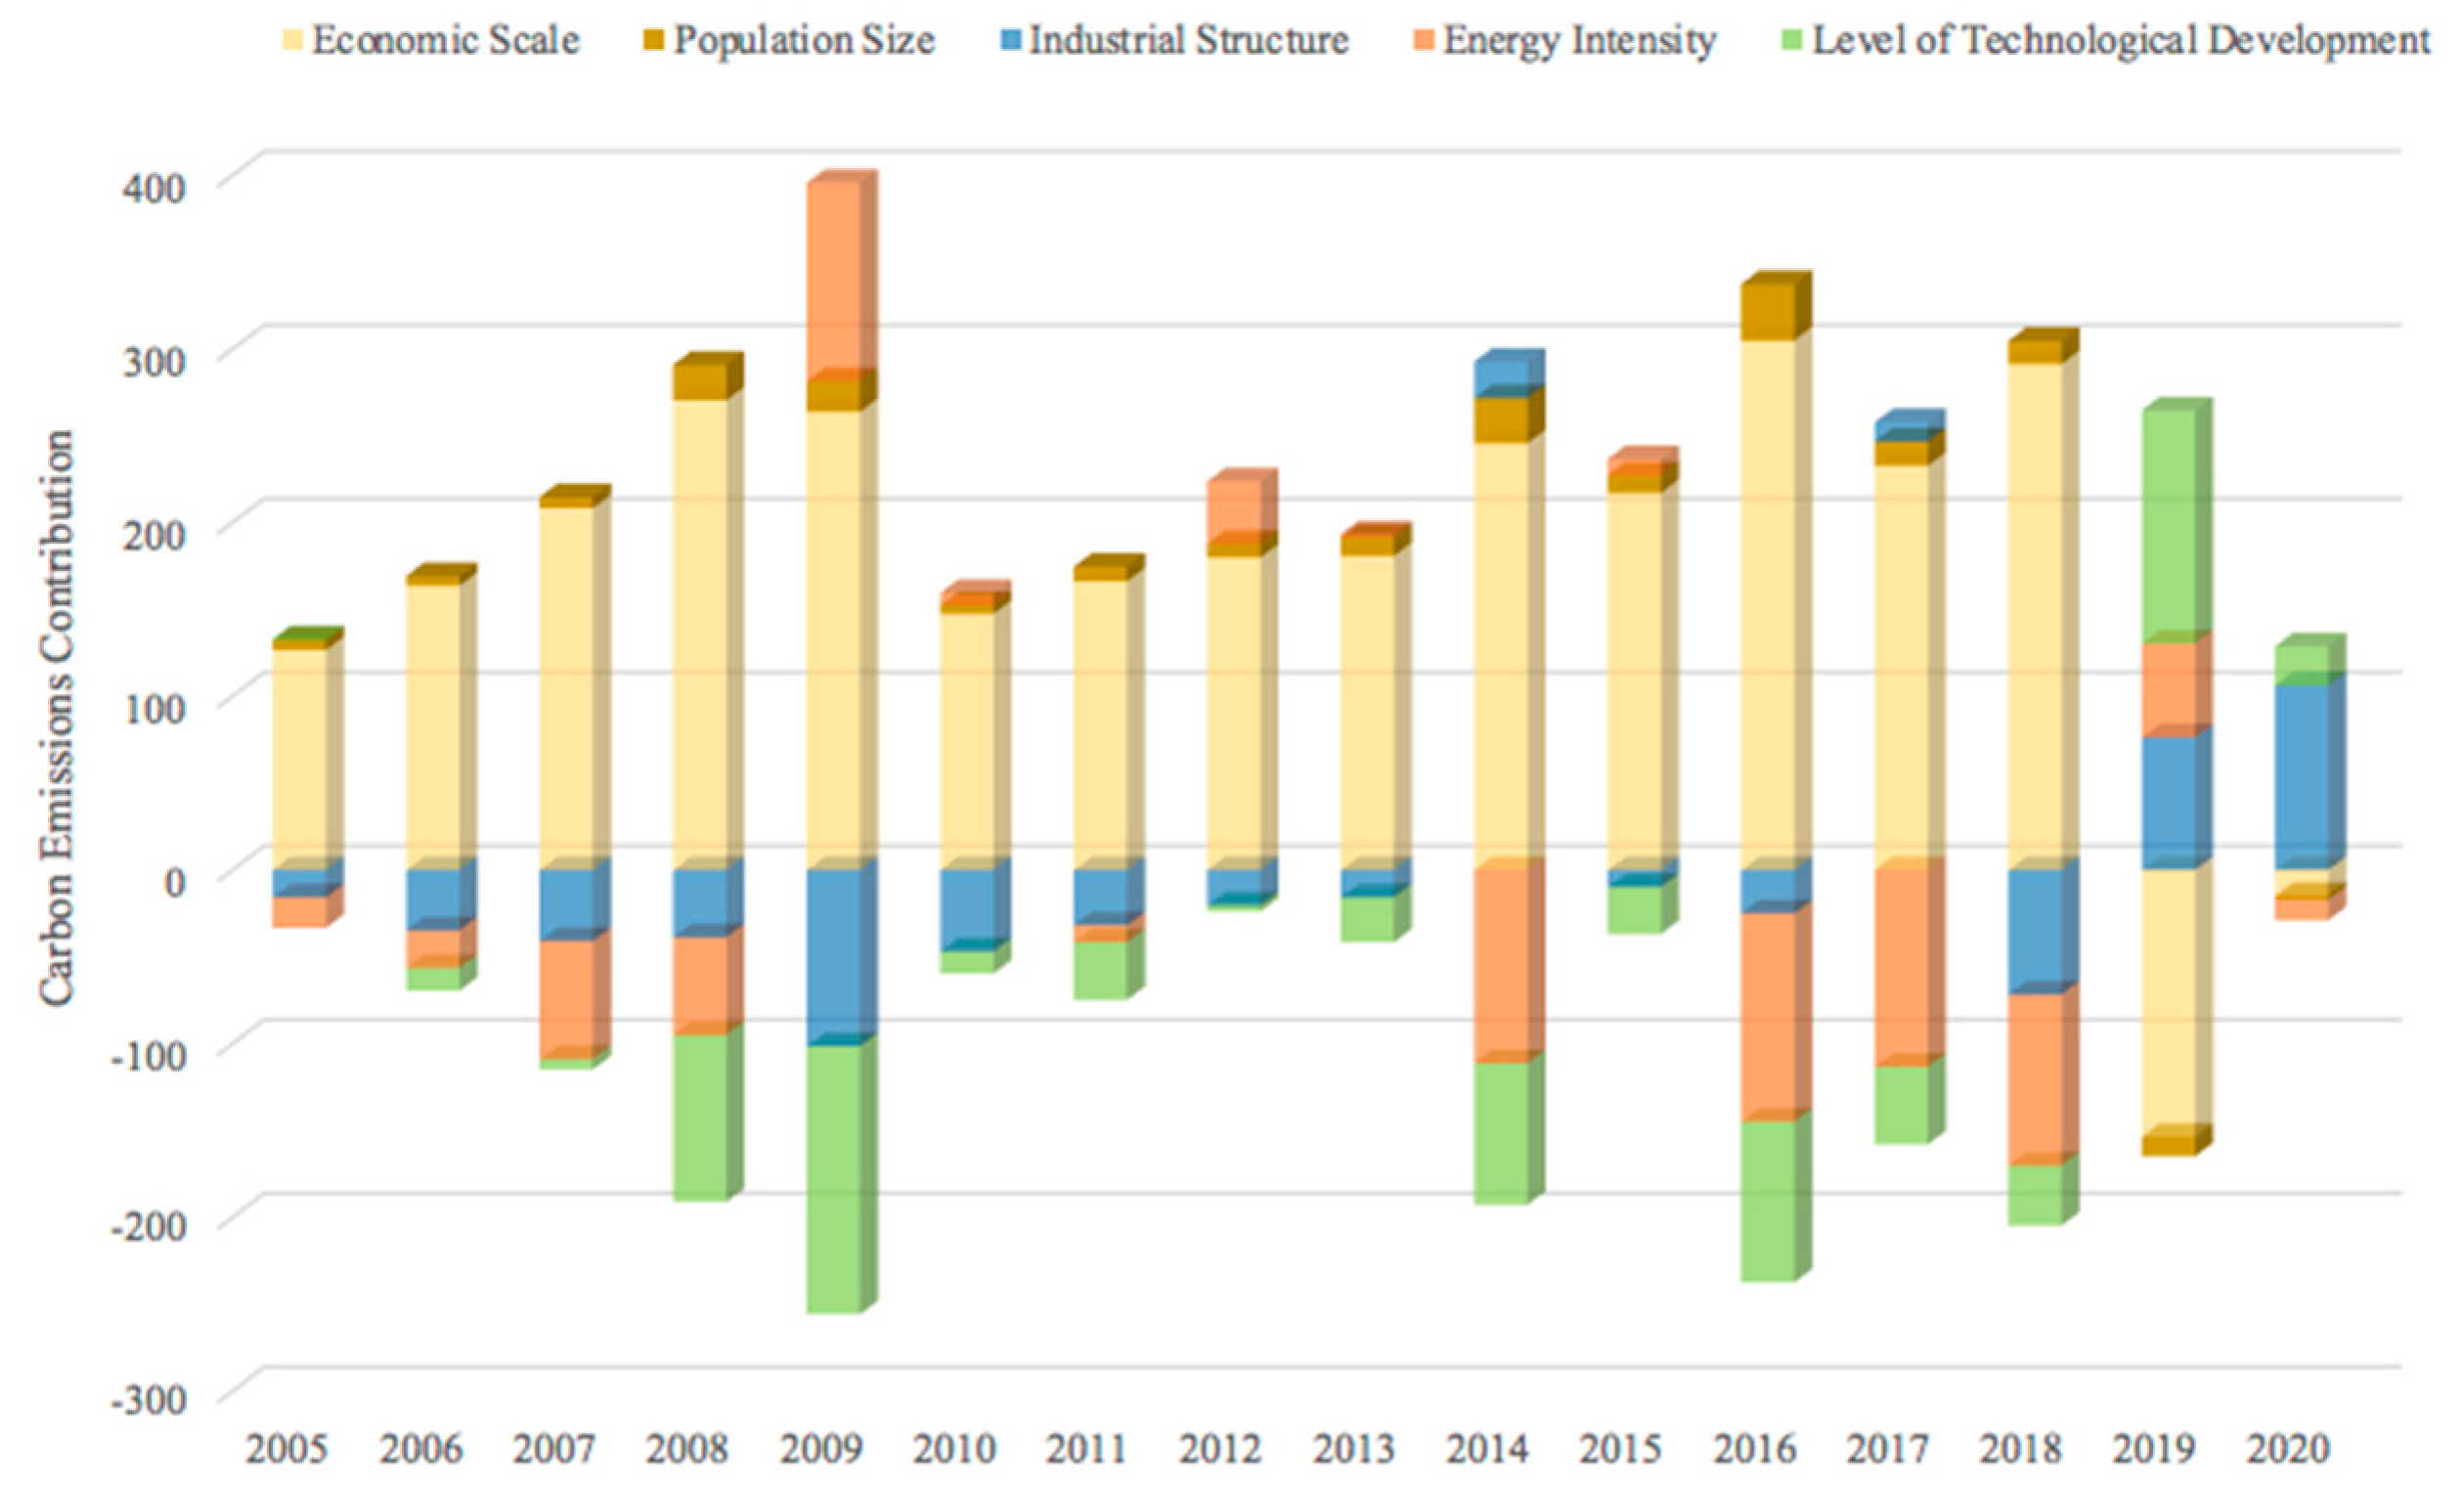
Identifying key factors influencing green efficiency in the transportation sector is critical for formulating development strategies that yield both environmental and economic benefits. Although the focus varies among countries, commonly, factors influencing industrial green development are screened from three aspects: industrial scale, structure, and technological innovation [58,59,60,61,62,63]. Taking China’s 30 regions as an example, Figure 4, influenced by regional heterogeneity, reveals significant differences in undesired outputs, specifically carbon emissions, across different regions. Simultaneously, using transportation data from 2005 to 2020, the impact proportion of each factor on the total effect was analyzed. Figure 5 indicates that the scale effect plays the most pronounced role in promoting carbon emissions, while structural and technological effects tend to suppress emissions, with the impact of industrial structure being more significant. Explanations for these various influencing factors are provided in the following text.
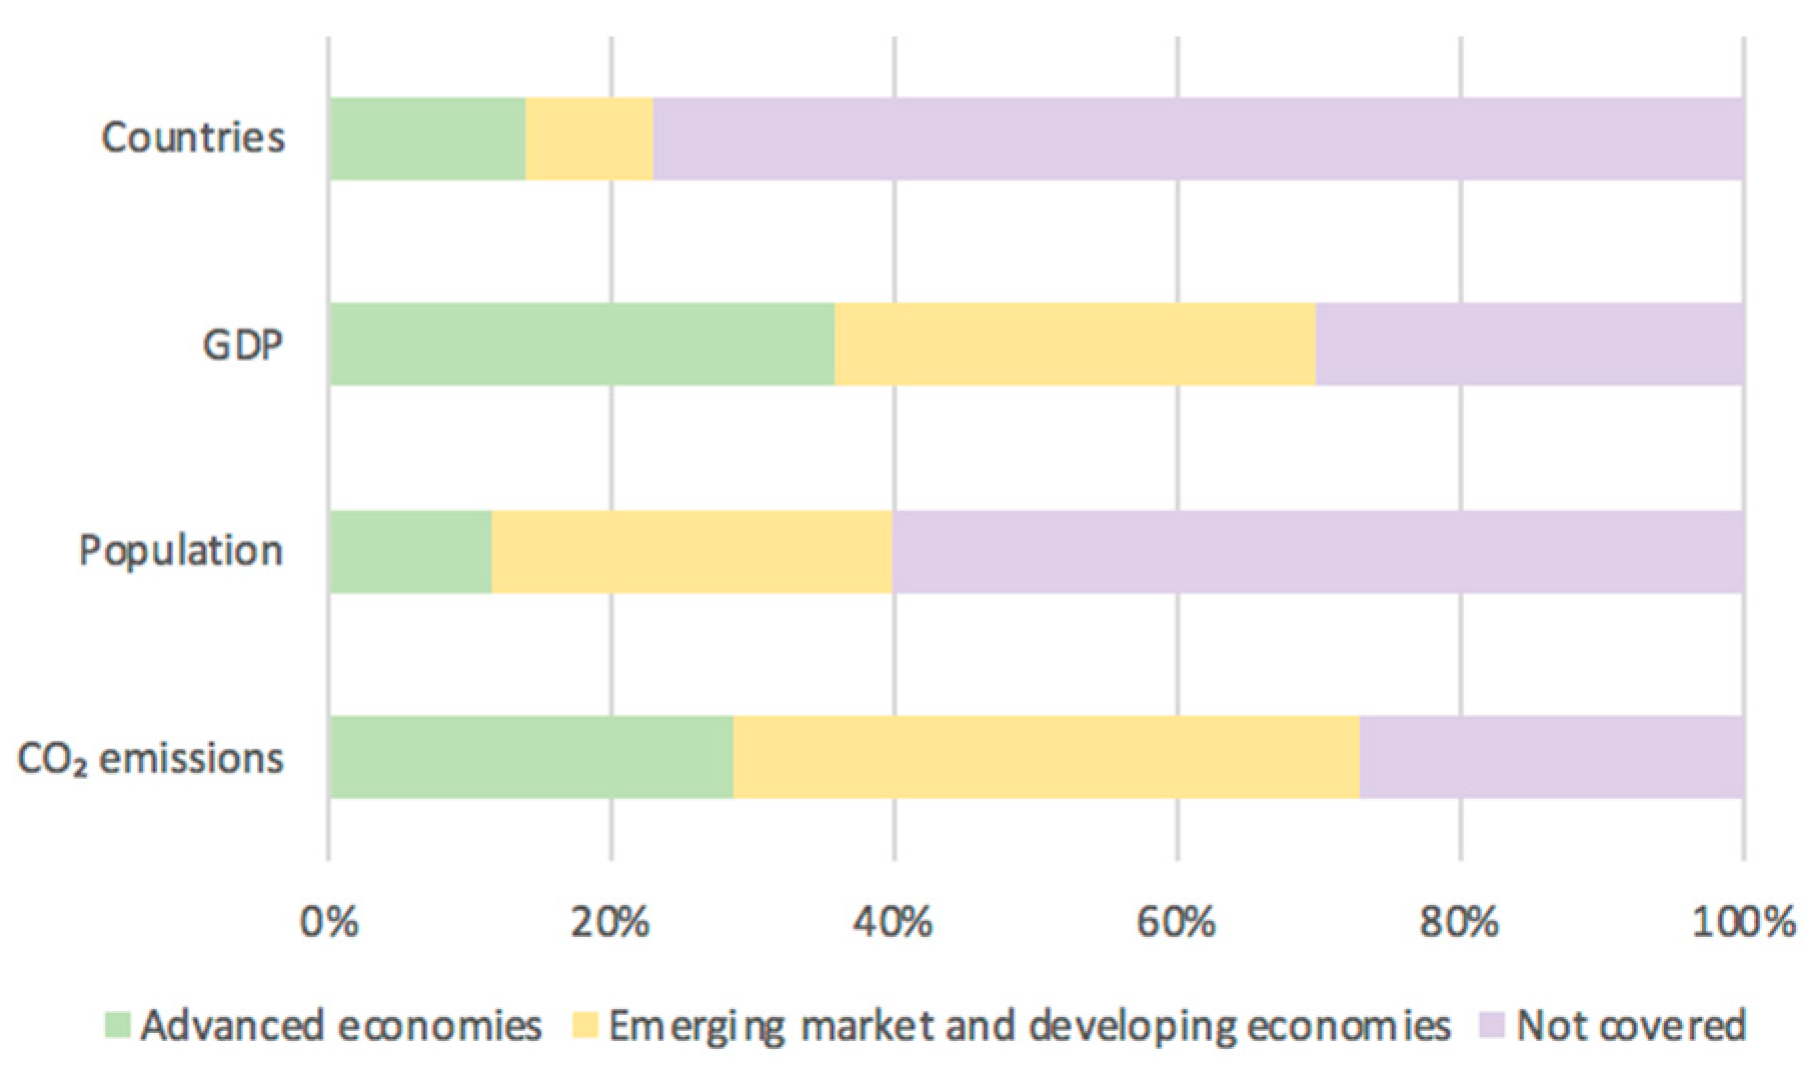
For most developing countries and some developed nations, scale effects trigger expansions in population size, per capita GDP, transportation infrastructure scale, and economic scale. Consequently, energy consumption and carbon emissions increase with expanding scale, hindering the green development of the sector to some extent [64,65,66,67,68,69,70,71]. Specifically, in the past 30 years, the transportation sector in developed countries has generally had higher total and per capita carbon emissions compared to developing countries. Hence, nations can be categorized into ‘advanced economies’, ‘emerging markets and developing countries’, and ‘others’. Figure 6 displays typical indicators affecting the scale effect of these three categories and their shares of carbon emissions, revealing a direct correlation between larger GDP and population size and higher carbon emissions [1]. However, due to the difficulty in rapidly adjusting indicators, like economic development level and population size, the restraining effect of scale expansion on energy conservation and emission reduction in the transportation sector remains significant.
Moreover, optimizing transportation intensity and service structures related to industrial development also serves as an effective means to curb energy consumption and carbon emissions [72,73,74,75]. Road transportation, which accounts for approximately three-quarters of the total carbon emissions from the transportation sector, is key to achieving the sector’s zero-carbon goal [76,77]. Figure 7 reveals that road transport, including passenger and freight, contributed 77% to the global transportation sector’s carbon emissions in 2021, with the remainder emanating from the aviation, maritime, and rail sectors. According to data from the International Energy Agency shown in Figure 8, road transportation indeed generates significantly higher CO2 emissions compared to other modes of transport [1]. Therefore, identifying the optimal transport mix and clarifying the optimal transport modal split will be key to curbing energy consumption and emissions.
In terms of industrial technological innovation, increased R&D investment, reallocation of intangible innovative factors (such as human and knowledge capital), and promotion of new energy technologies are crucial tools for enhancing energy use efficiency [78,79,80]. However, the presence of the energy rebound effect obscures the relationship between technological progress-induced energy efficiency changes and overall carbon emissions and green development in the industry. Hence, accurately measuring the energy rebound effect is vital for enhancing the effectiveness of energy consumption reduction in the transportation sector. In recent years, rebound effect research has received significant attention in high-energy-consuming industries, particularly transportation, to avoid the insufficient motivation and contribution of technological innovations and the ineffectiveness of energy-saving and emission-reduction policies [81,82,83,84].
Finally, external regulatory policies, such as the implementation of new environmental laws and the introduction of carbon emission trading markets, are also crucial in aiding the transportation sector in achieving coordinated economic and environmental development. In the short term, environmental regulation increases costs for pollution-intensive industries, squeezing the space for productive investment and technological innovation. High-pollution enterprises are forced to relocate or exit the market, leading to a ‘pollution haven’ effect due to lower costs, ultimately impacting industrial development outcomes. Meanwhile, existing technological levels and production demands remain unchanged [61,85]. In the long run, based on the ‘Porter Hypothesis’, environmental regulations will compel industries to engage in technological innovation through adjustment and improvement of production strategies. By incentivizing investment in technological innovation, directing more resources into developing green technologies and production equipment, and forming innovation compensation mechanisms to offset or even surpass the ‘compliance costs’ brought by environmental regulations, a win–win situation for industrial development, energy conservation, and emission reduction can be achieved [86]. Therefore, it is important to note that external policies may have a lag effect on the impact of green development in the transportation sector. Table 4 systematically summarizes the factors affecting green development in the transportation industry and the related literature sources.

3.1.2. Factor Decomposition Methodology

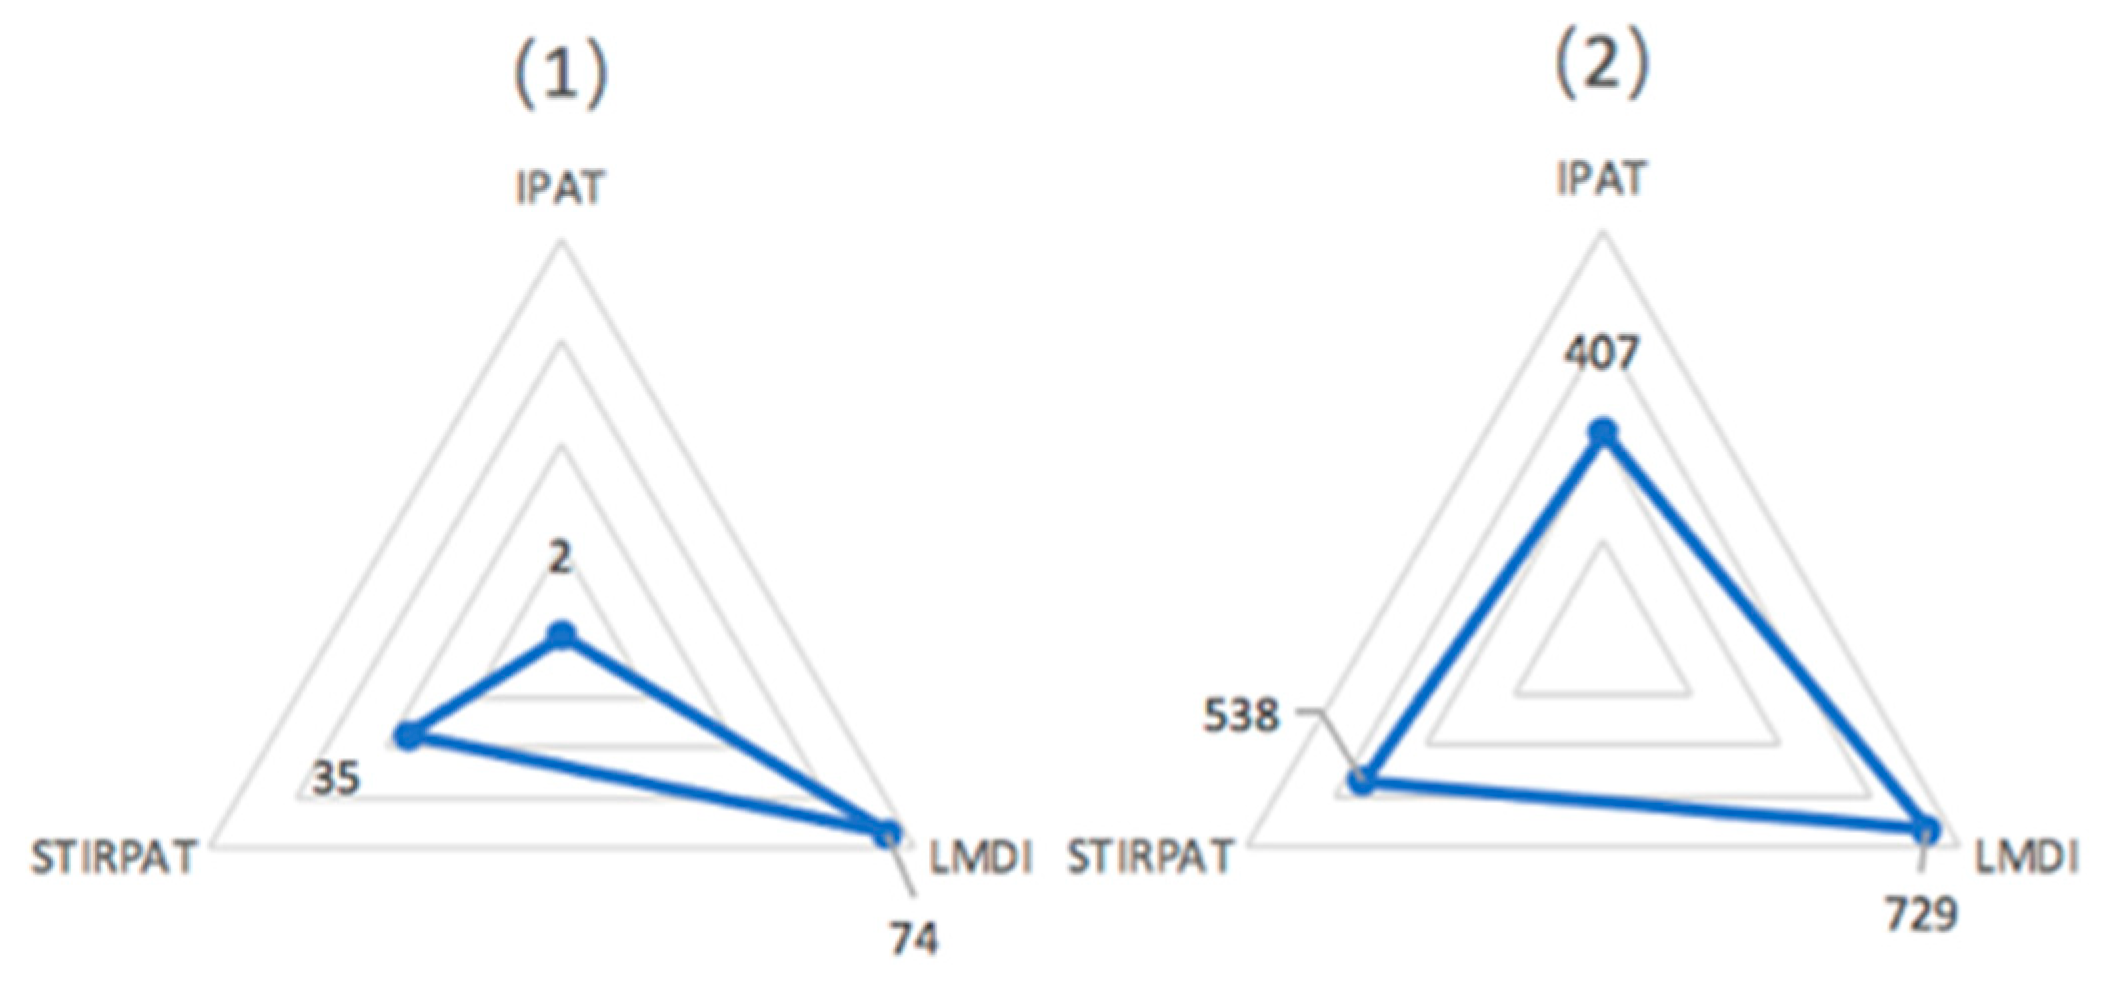
Identifying and quantifying the various factors influencing the green development of the transportation sector is crucial for prioritizing development strategies. Factor decomposition methods have been widely acknowledged by scholars globally. Initially, the IPAT model demonstrated that population, affluence, and technology are the three primary factors affecting environmental conditions and industrial development [99]. The stochastic environmental impact assessment model (STIRPAT) strictly constrains the measurement of the degree of influence of various factors, such as population, level of economic development, energy efficiency, transportation structure, and level of urbanization, on the carbon emissions of the transportation industry in different environmental contexts [92,100,101,102,103,104]. It overcomes the limitation of the IPAT model, which relies on the equal proportional influence of variables, because it is easier to obtain quantitative relationships between variables. However, this method still suffers from a lack of flexibility. Additionally, the structural decomposition analysis (SDA) method based on the input–output model [89] and the production theoretical decomposition analysis (PDA) method [91] are frequently used to discuss the impacts of industrial scale, structure, and technology effects on carbon emissions. Nevertheless, these methods fall short in precisely measuring structural factors, like economic structural effects and energy consumption, potentially leading to conclusions contrary to actual situations. In such cases, the index decomposition analysis (IDA) method based on time series data is widely used. Furthermore, the logarithmic mean divisia index (LMDI) decomposition method, known for its simple decomposition form, independence from the decomposition factors, and zero residual in decomposition results, effectively addresses the zero-value problem and has become one of the preferred choices in resource and environmental research [87,93,97]. The frequency of three types of factor decomposition models used in green development research in the transportation sector, as found on China National Knowledge Infrastructure (CNKI) and Science Direct, is illustrated in Figure 9. However, in using factor decomposition methods to identify key factors and measure their impact, the autocorrelation among factors and regional spatial autocorrelation are often overlooked. Future research should focus on enhancing the application of spatial econometric models and constructing hybrid models to improve analytical accuracy. This will assist different regions in the transportation industry to better formulate energy-saving and emission-reduction policies.

3.2. Analysis of the Impact Pathways for Green Development in the Transportation Industry

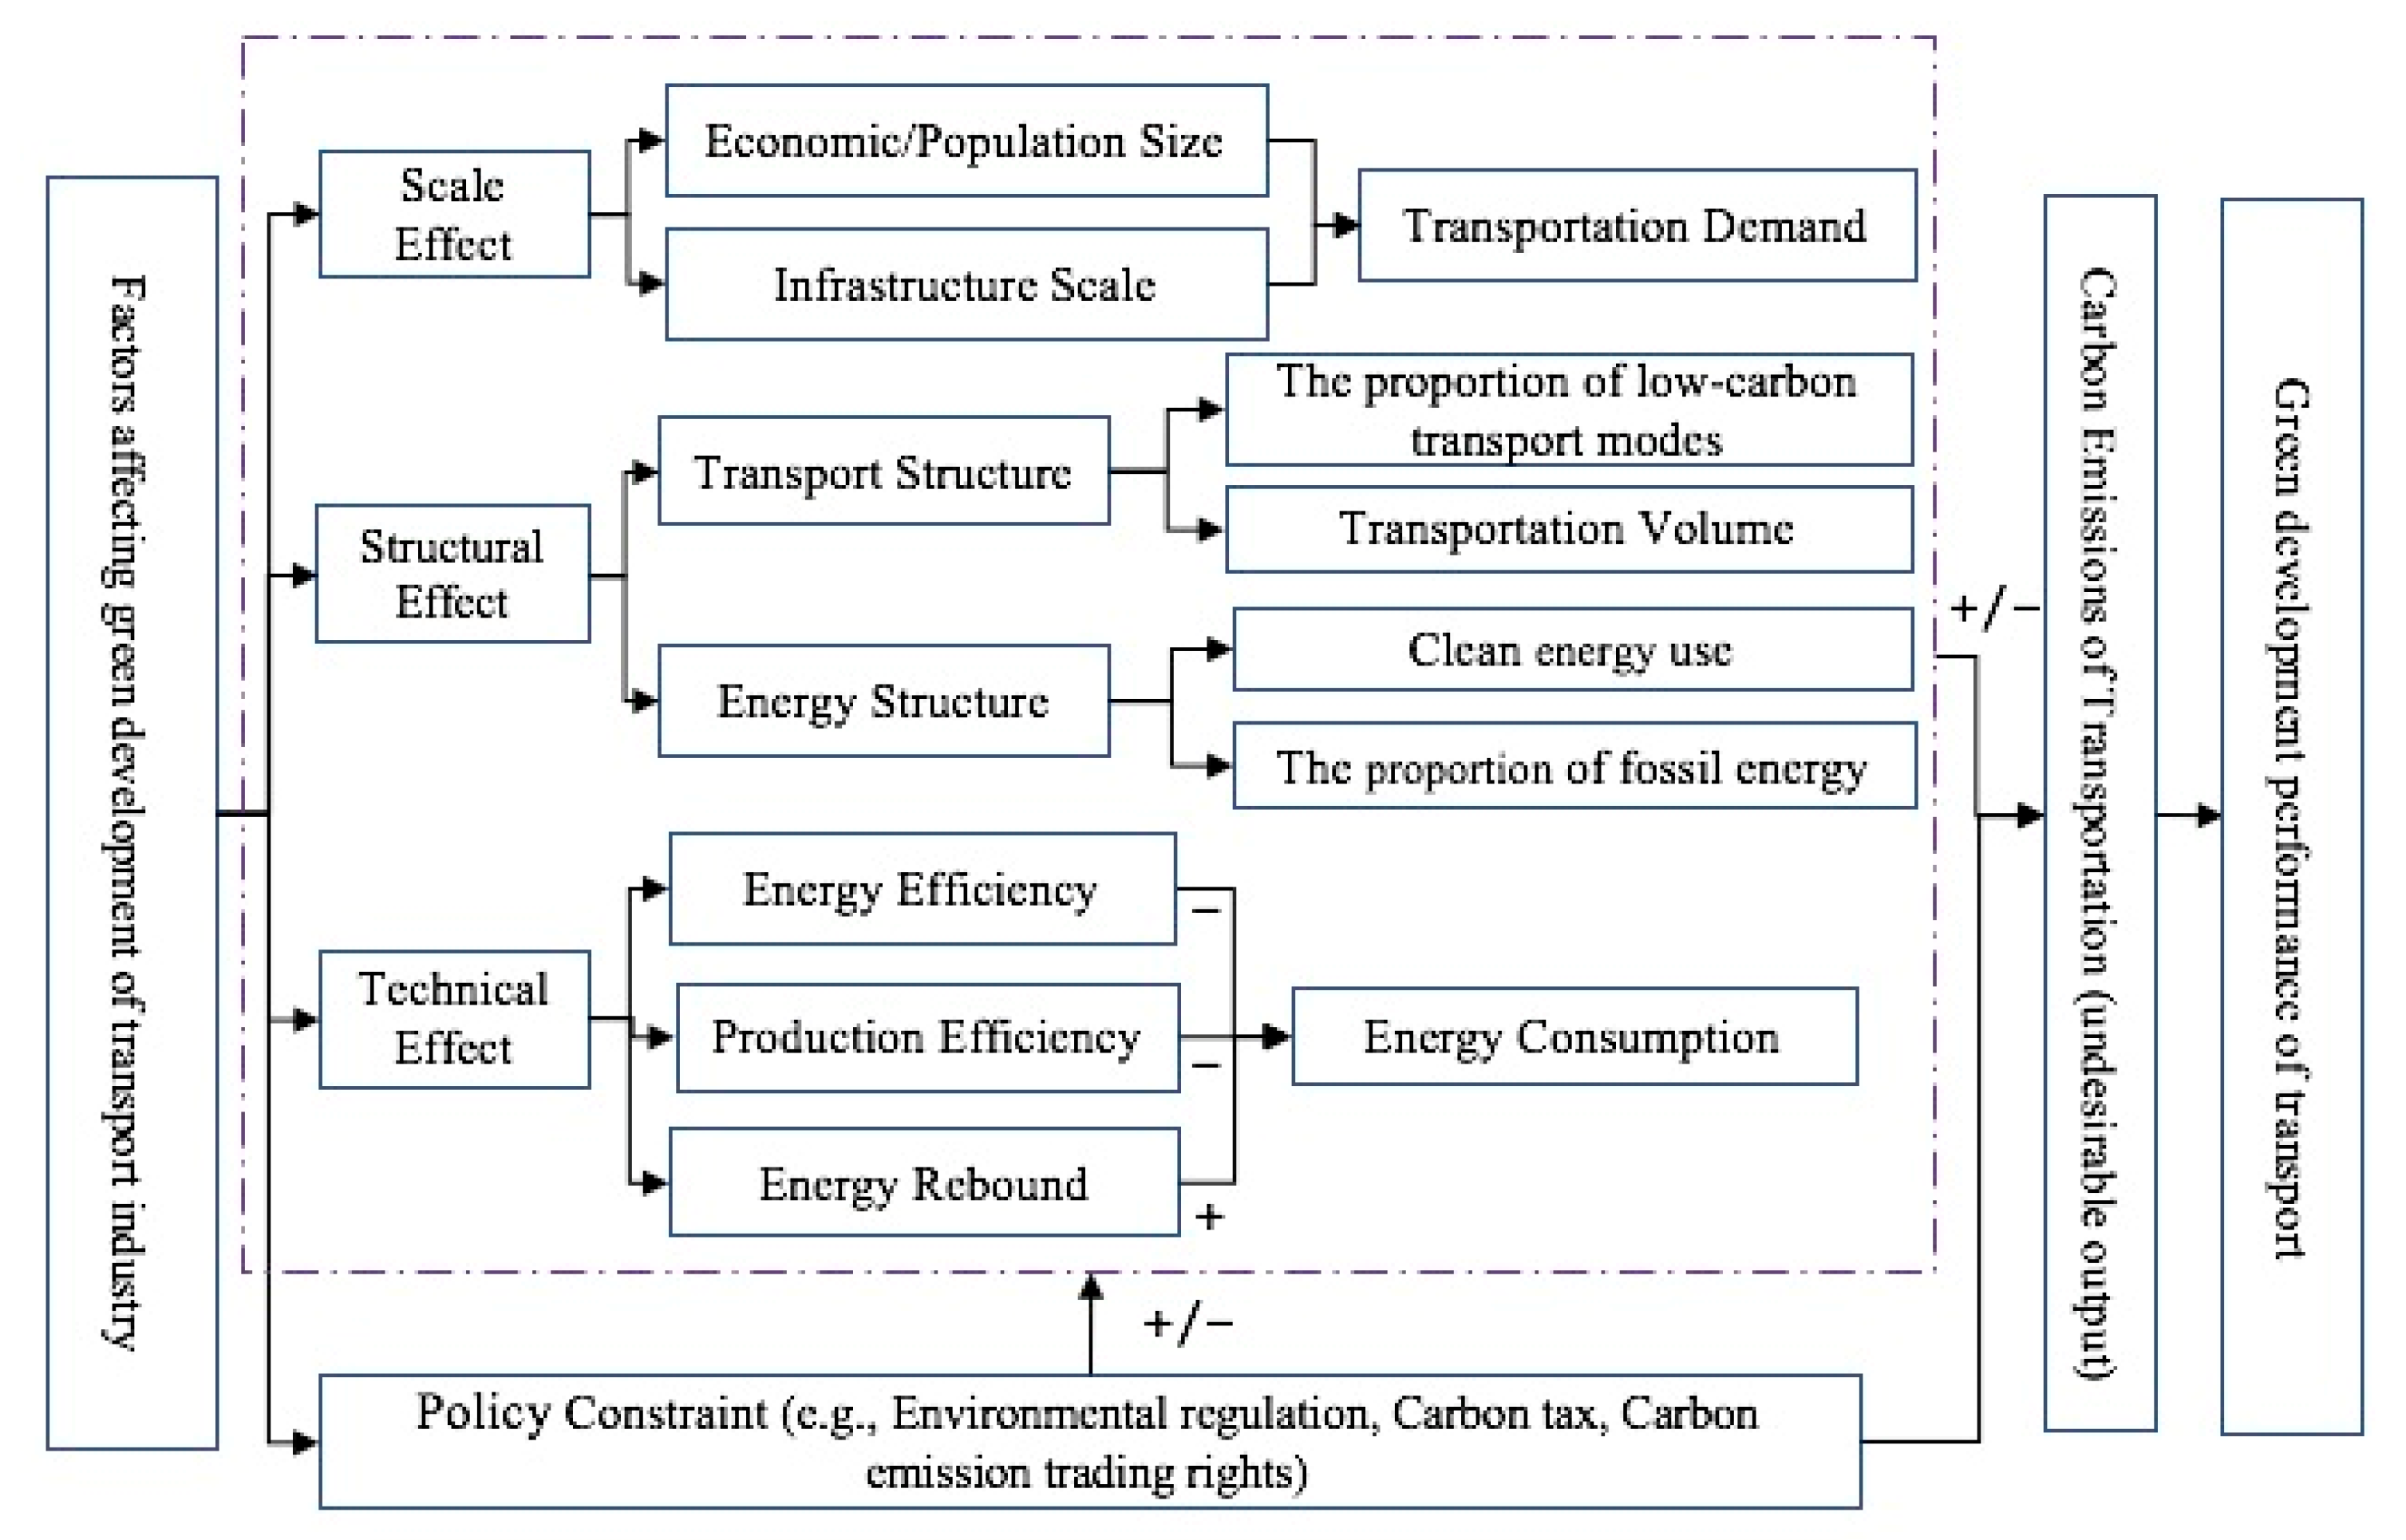
In the context of exploring the mechanisms influencing green development in the transportation sector, Figure 10 presents a delineated pathway of impact, offering a reference for future developmental trajectories across different regions. Specifically, the scale effect encompasses economic, population, and industrial dimensions. Rapid economic growth and urban population increases lead to surging transportation demand and an expanding transportation market, consequently elevating pollutant emissions and manifesting adverse environmental impacts [78,105]. However, the expansion in investment scale in the transportation sector also provides ample financial support for urban infrastructure construction. Developments in charging and refueling facilities and projects, like ‘oil-to-electricity and oil-to-gas’ conversions for loading machinery and transportation equipment [88,106], reduce cross-regional factor mobility costs, enhancing industrial economic output efficiency and clean energy utilization of machinery. Effective allocation of transportation infrastructure may also exhibit a positive influence on energy conservation and emission reduction [107,108].
Structural effects are primarily manifested in the impacts of transportation and energy structures. As a critical input indicator in assessing green efficiency in the transportation sector, the proportion of fossil fuels in energy consumption alters the sector’s energy structure [102]. An increased proportion of high-carbon-emitting sources, like coal, gasoline, and diesel, diminishes carbon emission efficiency [98,109]. Thus, the vigorous promotion of green travel concepts, along with the proliferation of clean energy and public transportation modes, has increased the proportion of low-carbon travel, subsequently enhancing the sector’s green efficiency [110,111]. Moreover, the development of the transportation sector promotes effective resource redistribution, reducing the proportion of ‘high pollution, high emission’ industries in primary and secondary sectors. However, improvements in the service quality of the transportation sector may transfer high energy consumption and pollution characteristics to the sector, potentially exerting adverse impacts on its green development [108,112]. Therefore, as the proportion of service industries, like transportation, increases, the expansion of manufacturing economies indirectly drives up demand in the transportation sector. Structural optimization also faces the risk of stimulating industrial scale, thereby promoting energy consumption and carbon emissions.
Furthermore, research indicates that technological advancements in the transportation sector are key to reducing or even curbing pollutant emissions and lowering energy consumption [113,114,115]. Relying solely on repetitive labor without more profound technological innovations keeps the high productivity of resources in flux. Intensifying R&D investments and fostering technological innovations in the transportation sector, along with accelerating the effective transformation of technological achievements, will enhance resource utilization efficiency and drive future green growth in the sector [116,117]. Firstly, in recent years, transportation intelligence, encompassing vehicle electrification, networked roads, and shared routes, has directly impacted industry production and energy utilization efficiencies [118,119]. Simultaneously, enhanced technological innovation capabilities indirectly stimulate industrial carbon emissions and efficiency through economic growth and industrial structure optimization [95,120]. Also, as a common indicator of technological level, energy intensity is a crucial factor restricting the growth of carbon dioxide emissions. The introduction of clean production technologies and improvements in energy utilization techniques can indirectly enhance energy utilization efficiency through scientific planning of energy input quantities and effective energy input ratios, thereby further advancing the low-carbon industrial development process [121,122]. Additionally, the ongoing technological revolution led by the digital economy accelerates the deep integration of transportation and industry, with digital transportation offering effective pathways to promote green industrial transformation [94,123]. However, as industrial digital transformation is still in its nascent stages, related research is not extensive and merits further discussion.
On the other hand, while technological progress can promote the synergistic development of carbon emission reduction and economic growth, improving energy efficiency [124], it may also lead to the ‘Jevons Paradox: Energy Rebound Effect’ [96,125]. The rebound effect implies that the anticipated energy-saving effects from improved energy efficiency are offset by increased energy demands, diminishing the effectiveness of environmental policies [126,127]. Studies confirm the impact mechanism of the energy rebound effect on industrial development and the variability of different paths of energy rebound effects through internalizing energy efficiency and simulating the impact of different types of energy efficiency improvements on energy consumption [128,129,130,131]. High-energy-consuming sectors, like the steel [132], construction [133], and transportation [126] industries, are significantly affected by the energy rebound effect. Moreover, in some countries, like Denmark [134], Norway [135], the United Kingdom [136], and China [129], the energy rebound effect in the transportation sector typically encompasses long-term and short-term effects. In quantifying the energy rebound effect, academia attempts to define the energy-saving effect of improved energy efficiency as the elasticity of energy consumption to energy efficiency, with the value of the energy rebound effect being the elasticity of energy consumption to energy efficiency plus one. Due to the complexity of measuring energy efficiency, the elasticity of energy consumption to energy prices and the elasticity of energy services to energy prices have also been used for quantitative analysis of the energy rebound effect, rather than the elasticity of energy consumption to energy efficiency [81,83,137]. However, most studies have not emphasized the impact of the endogeneity of technological progress on results. Indeed, introducing biased technological progress parameters into the production function will enhance the scientific validity and effectiveness of measuring the energy rebound effect.
Finally, the importance of external constraints cannot be overlooked. Although research on the environmental regulation and green industrial development has not yet formed a unified framework, studies recognize that environmental regulation exhibits both inhibitory effects on green development efficiency [90] and positive influences on ecological environment and high-quality industrial development [138]. As it is affected by policy lag effects, the impact of environmental regulation on the green development of industries, like manufacturing and high-pollution sectors, may shift from hindrance to promotion [139]. Among them, the impacts of command-and-control, market incentive, and public participation forms of environmental regulation on industrial green growth vary. The direct impacts of market incentive and voluntary agreement types of environmental regulation on industrial green total factor productivity are, respectively, inverted U-shaped and U-shaped relationships. In contrast, command-and-control environmental regulation has not directly affected green total factor productivity [140,141]. Regionally, high-level areas primarily adopt the method of selling emission rights while raising emission fee standards for industrial green development, whereas low-level areas emphasize accelerating the transition from command-and-control to market-incentive environmental regulation to enhance the effect of external policy constraints [142].

4. Research on the Prospect of Green Development of the Transportation Industry

4.1. Research on the Impact of External Policy Constraints

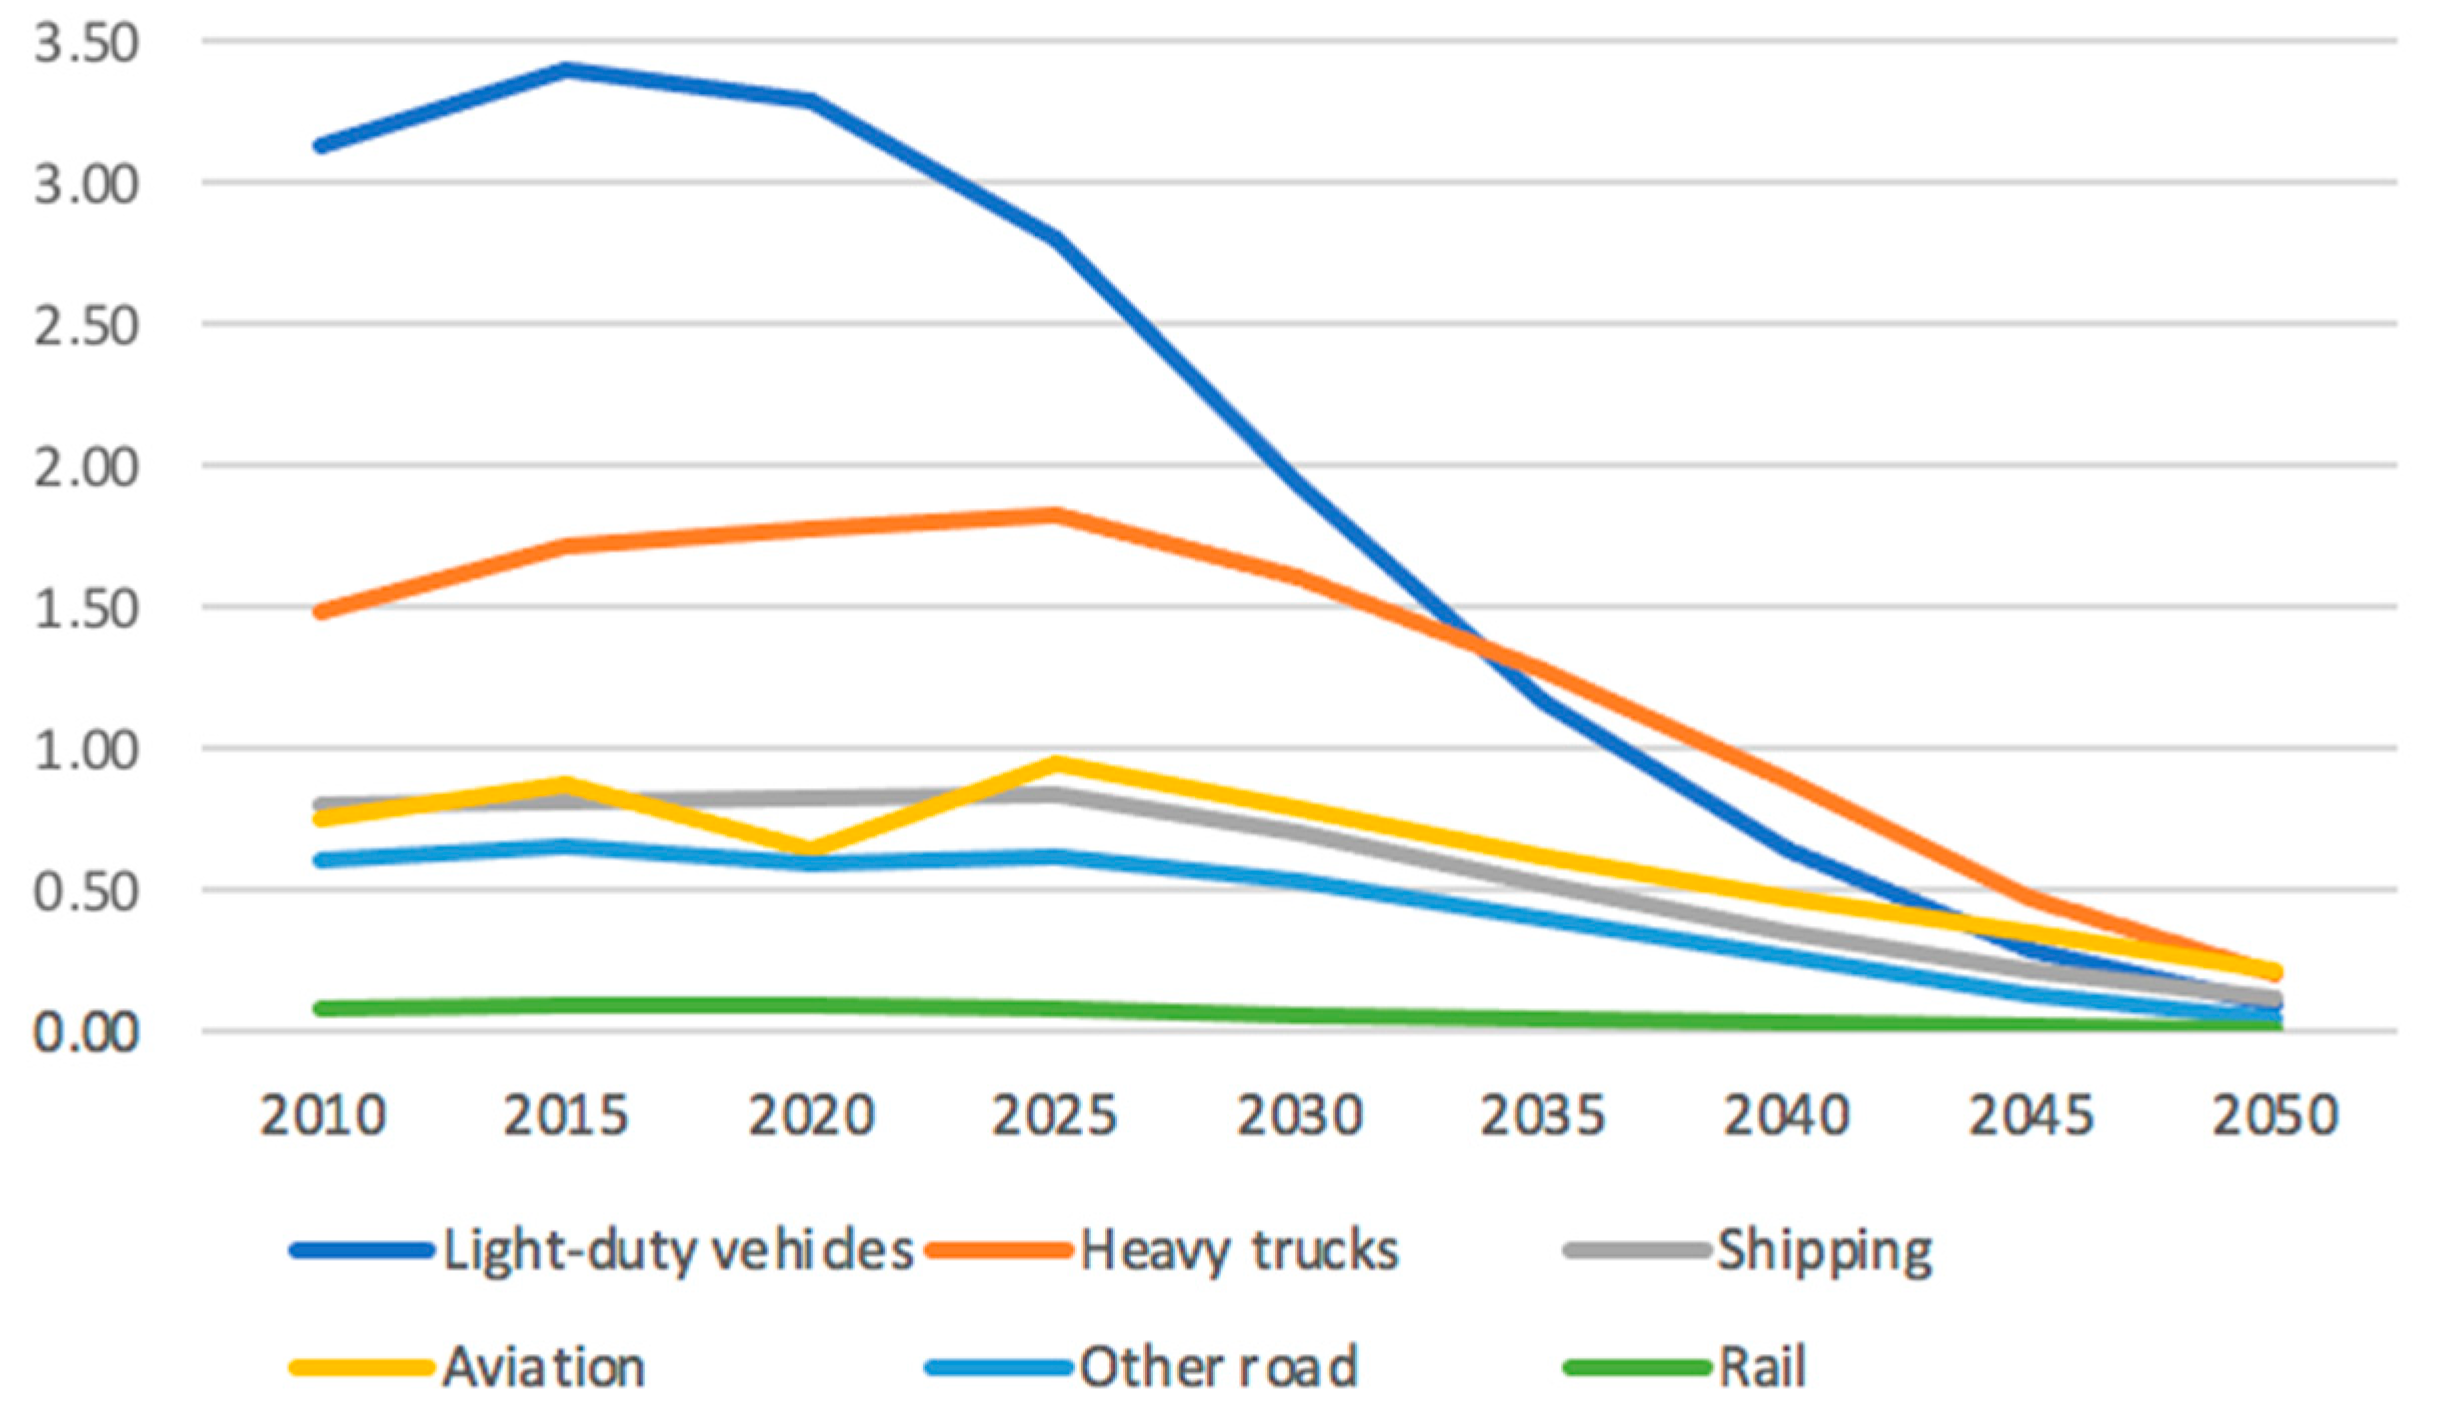
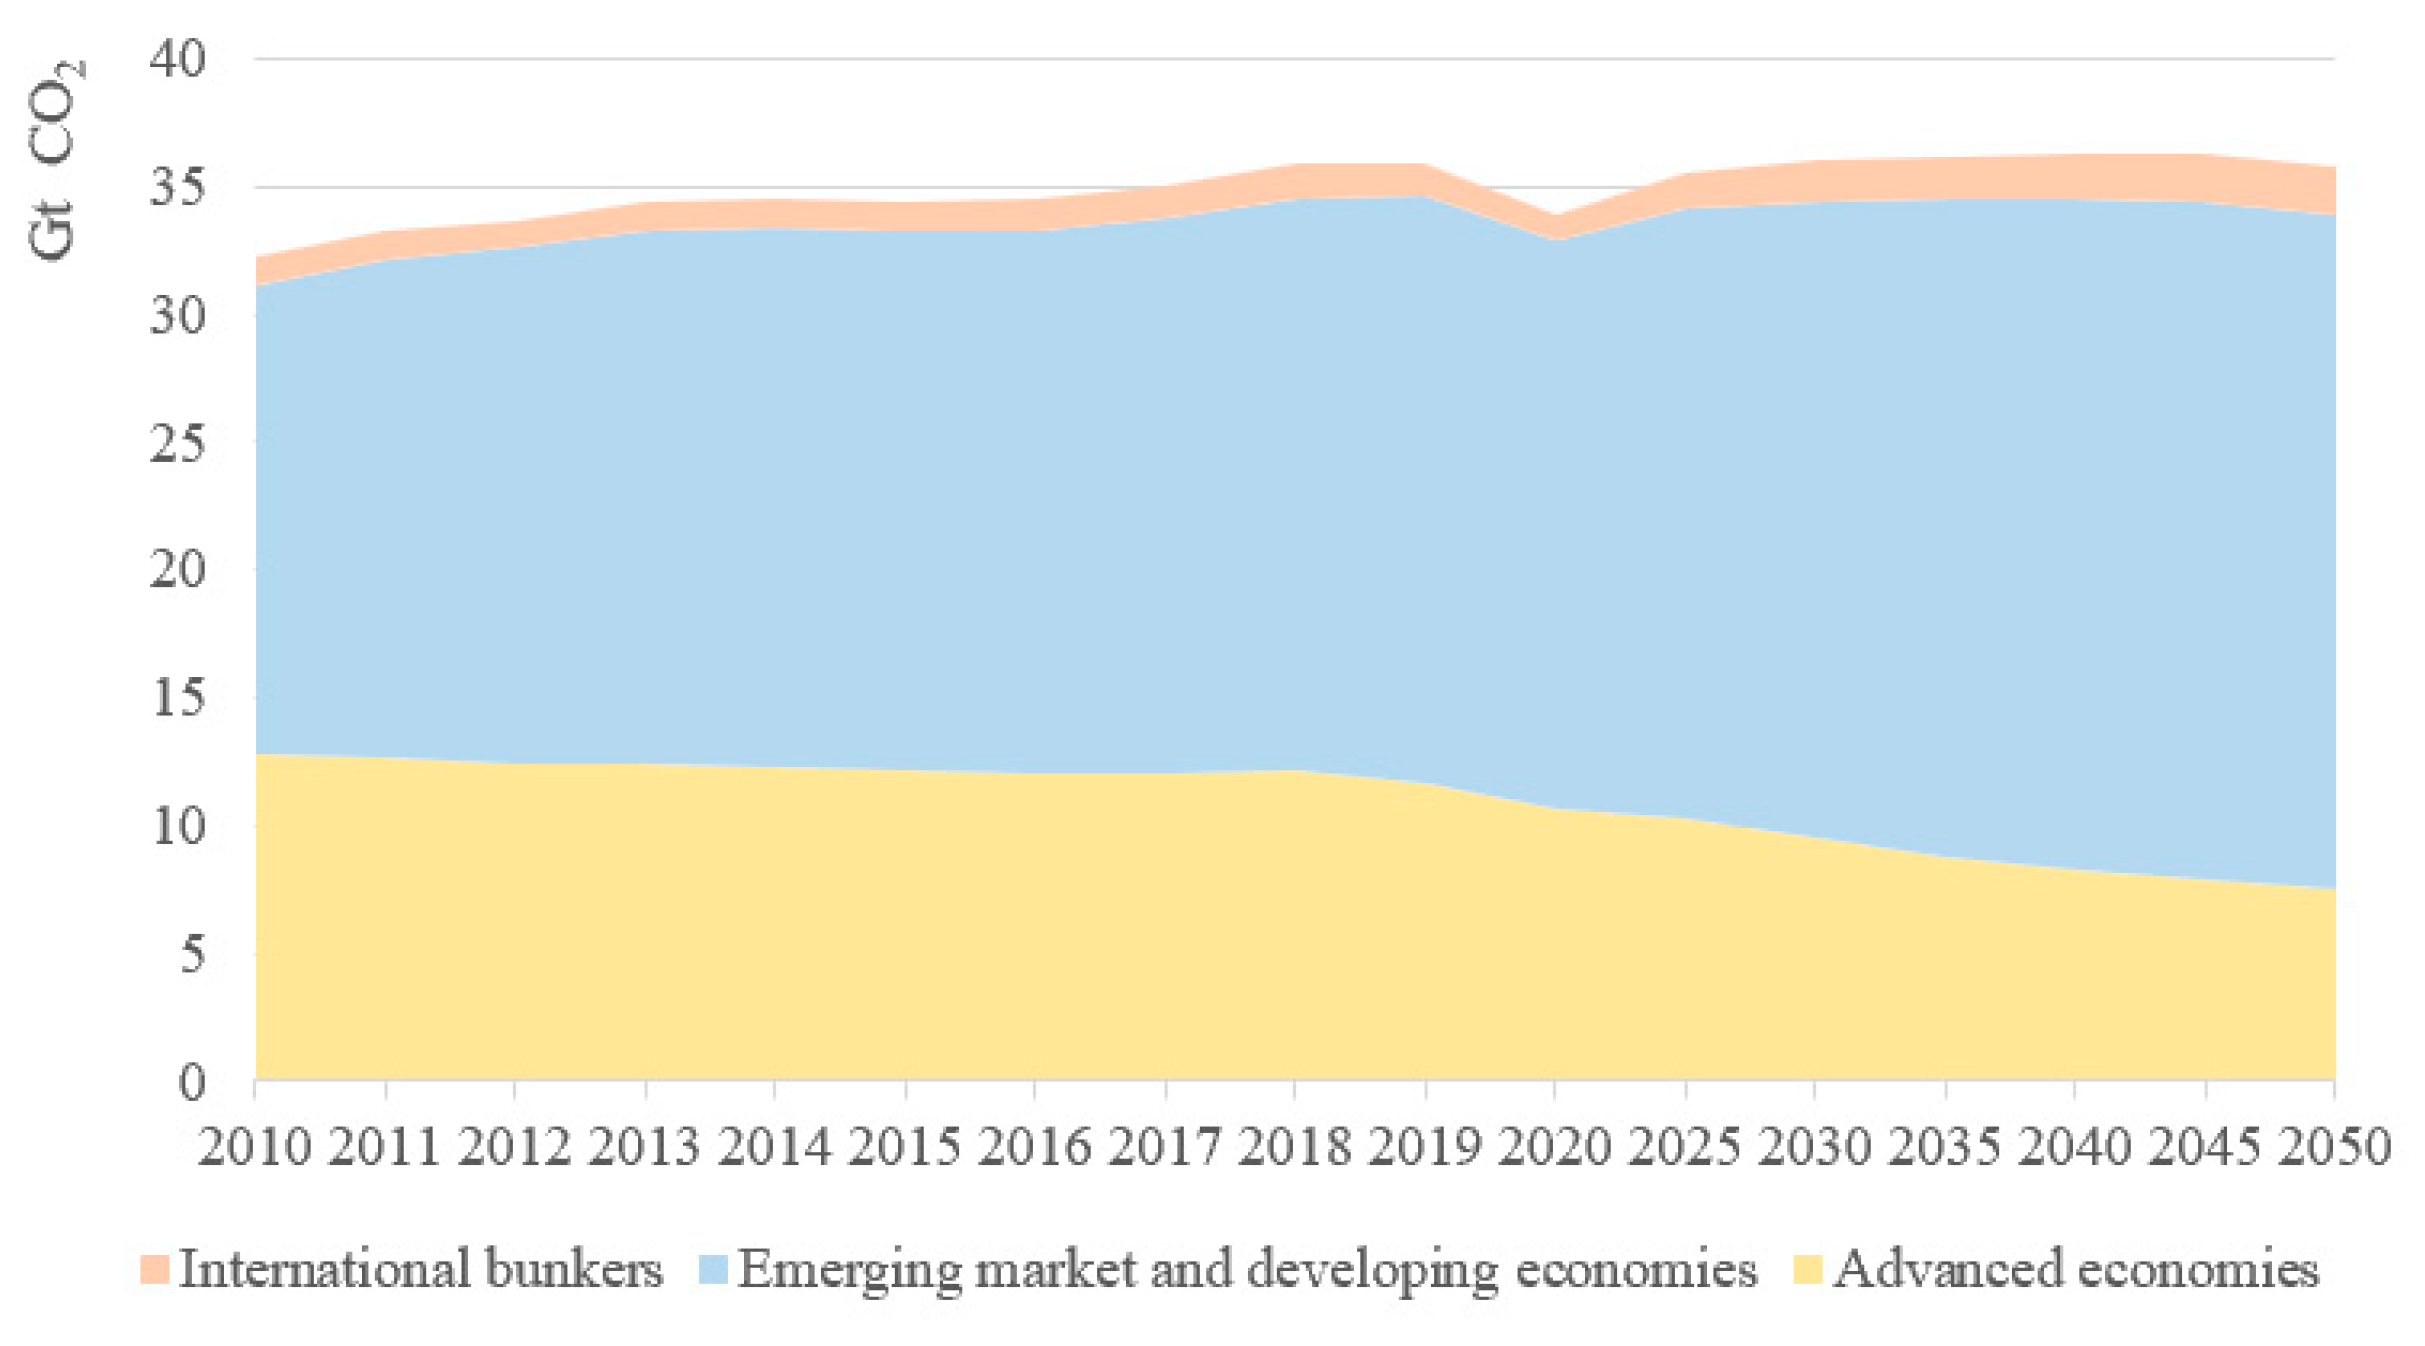
With rapid economic development and continual advancements in technology, the transportation sector is urgently required to decarbonize to fulfill the net-zero commitments within the economic sphere. According to the International Energy Agency (IEA), global urban passenger transport carbon emissions are projected to grow at an average annual rate of 1.7%, with developing and transitional economies expected to reach 3.4% and 2.2%, respectively, by 2030 [1]. Figure 11 displays the carbon emission projections for the transportation sector across different types of countries, indicating that both technologically advanced and developing countries are indeed facing significant carbon reduction challenges in the long term [143].
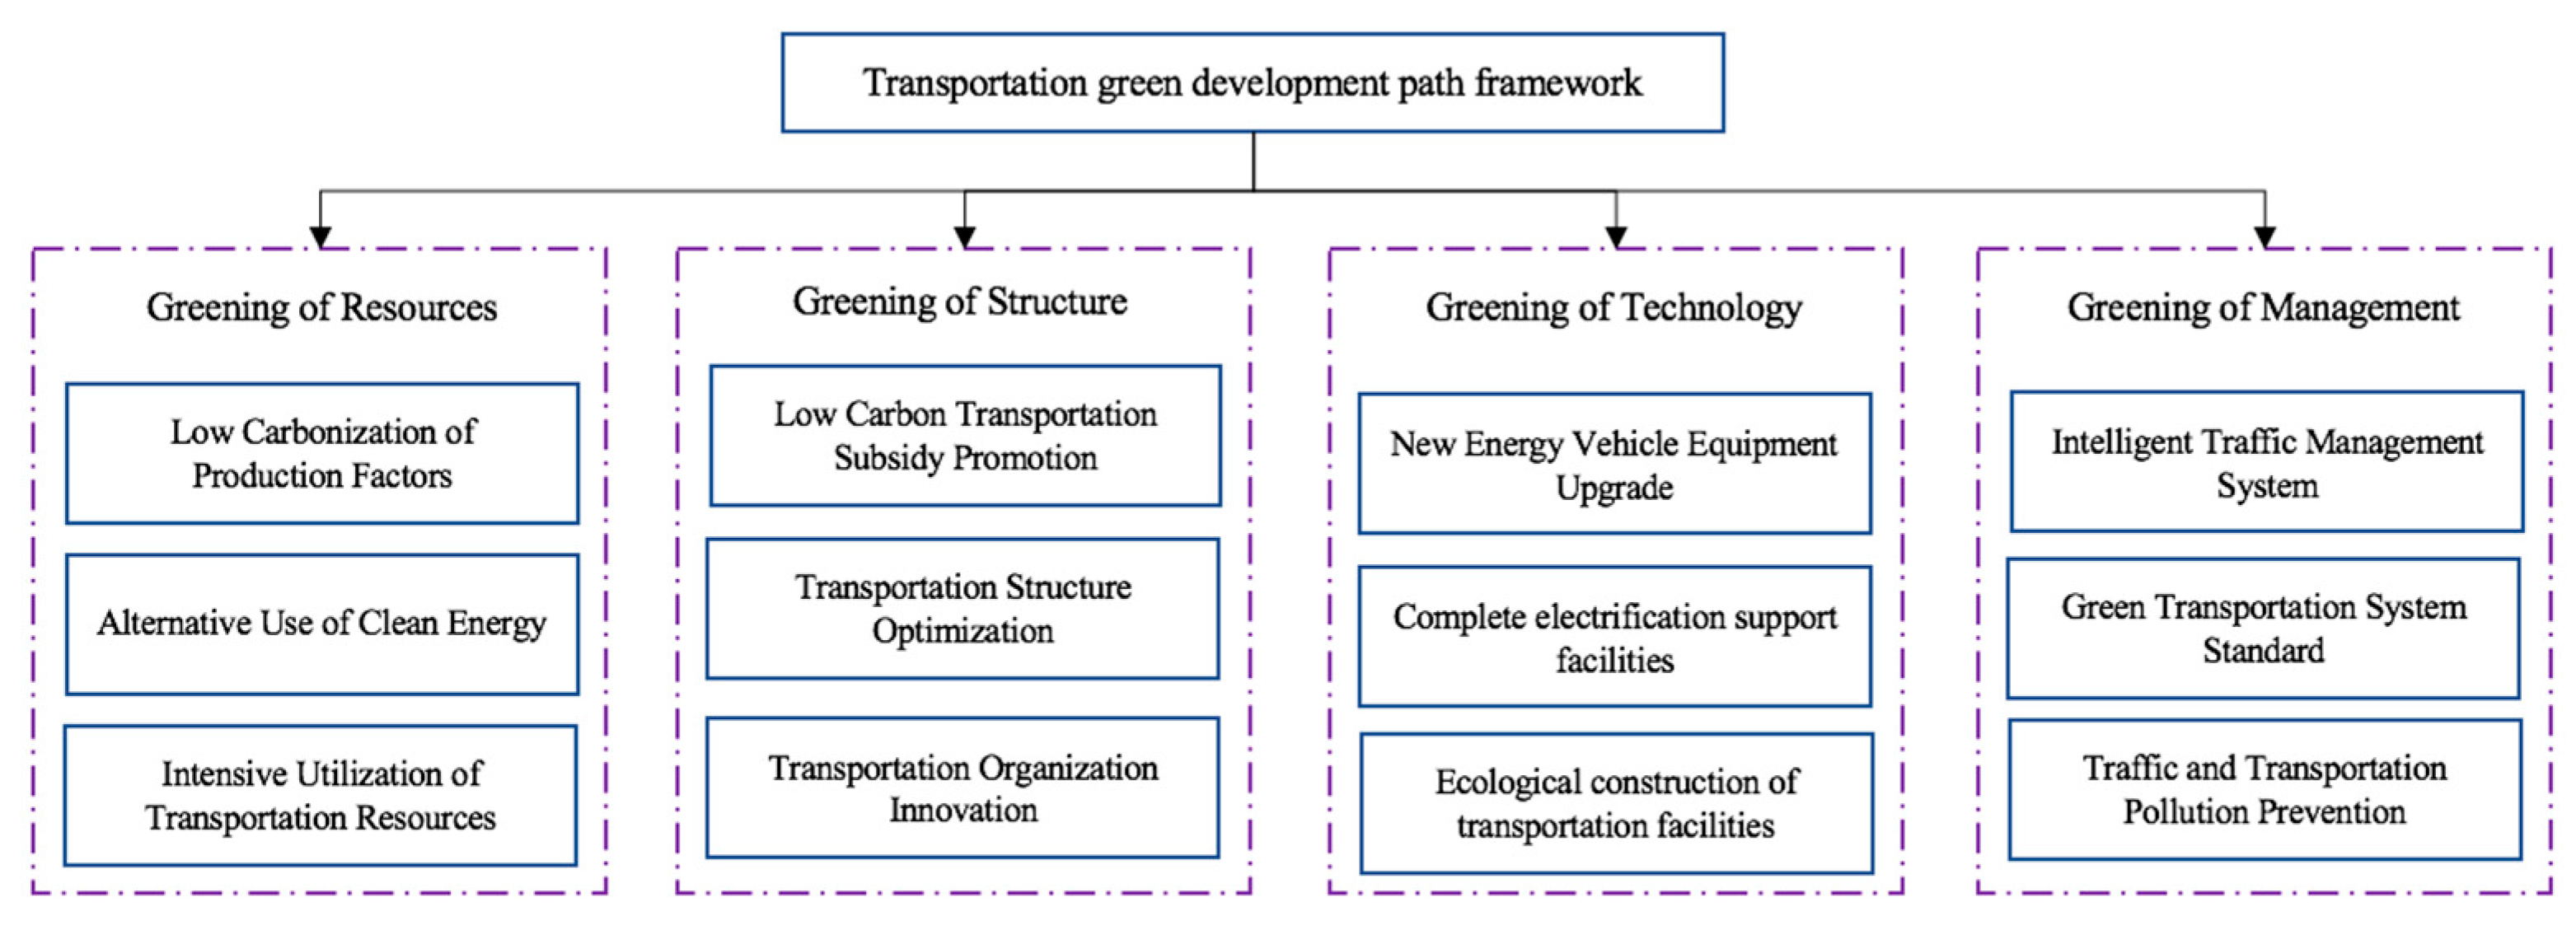
Given the variations in resource, environmental, and economic development characteristics of cities, countries worldwide may pursue diverse development modes, such as the ‘low-carbon society’ comprehensive goal model, the internal pull mode of low-carbon industries, the ‘point-to-area’ demonstration development model, and the ‘low-carbon supporting industry’ development model [144,145]. Hence, to achieve more accurate and scientific pollution emission predictions, research initially emphasizes the importance of external policies and management measures in countries and regions. Considering the high energy consumption and high emissions characteristic of the transportation sector, related studies often explore decarbonization from four perspectives—energy decarbonization, production decarbonization, consumption decarbonization, and emission decarbonization (as illustrated in Figure 12)—discussing how to coordinate industrial development with environmental protection to the maximum extent through external policy constraints.
Studies have found that formulating green, low-carbon transportation plans, while taking into account aspects, such as transportation subsidies [146,147], energy consumption control [148,149], and sustainability perspectives [150], plays a crucial role in promoting new energy vehicles, optimizing transportation structures, and advocating for green travel modes. Research based on behavioral economic principles (such as loss aversion effects) analyzed the dual impacts of public transport and taxi fare adjustments [151], environmental taxes, carbon taxes [152], and consumption tax collection based on vehicle types and emission standards [153] on travel. These studies avoided the dual inflection point effects, weak emission reduction effects, and rebound effects of early single congestion charging policies on pollutant reduction. By constructing clear vehicle travel decision algorithms, we explored the differences in emission reduction among different collaborative strategies. Moreover, green transportation schemes led by public transportation, supported by vehicle electrification, and complemented by walking, cycling, shared transportation, and other slow traffic are being implemented in various countries. Therefore, reducing urban transportation energy consumption relies not only on ordinary vehicle traffic restrictions and lottery policies [154], but also on scientifically reducing industrial energy consumption, supplemented by the implementation of various subsidy policies, and urban shared transportation schemes are increasingly playing a positive role [155,156]. Finally, governments are continuously promoting transportation energy-saving and emission-reduction technologies [157], as well as low-carbon travel concepts, such as new energy vehicles [158,159]. By curbing rapid and significant increases in transportation energy consumption and carbon dioxide emissions, these efforts aim to enhance the environmental benefits of the transportation industry and promote its coordinated development with environmental protection. Some typical countries, such as China, the United States, Germany, and the United Kingdom, still persist in enhancing their economic growth by utilizing non-renewable energy resources based on fossil fuels. The pace at which these economies are moving towards greener or cleaner energy production is far greater than that of other global energy users. Therefore, this study focuses on analyzing the impact of these countries’ policies on the green development of the transportation sector. Table 5 reveals specific policy measures taken by regions with a high share of transportation sector emissions, led by the United States, to achieve green development goals in transportation.

4.2. Prediction Methodology

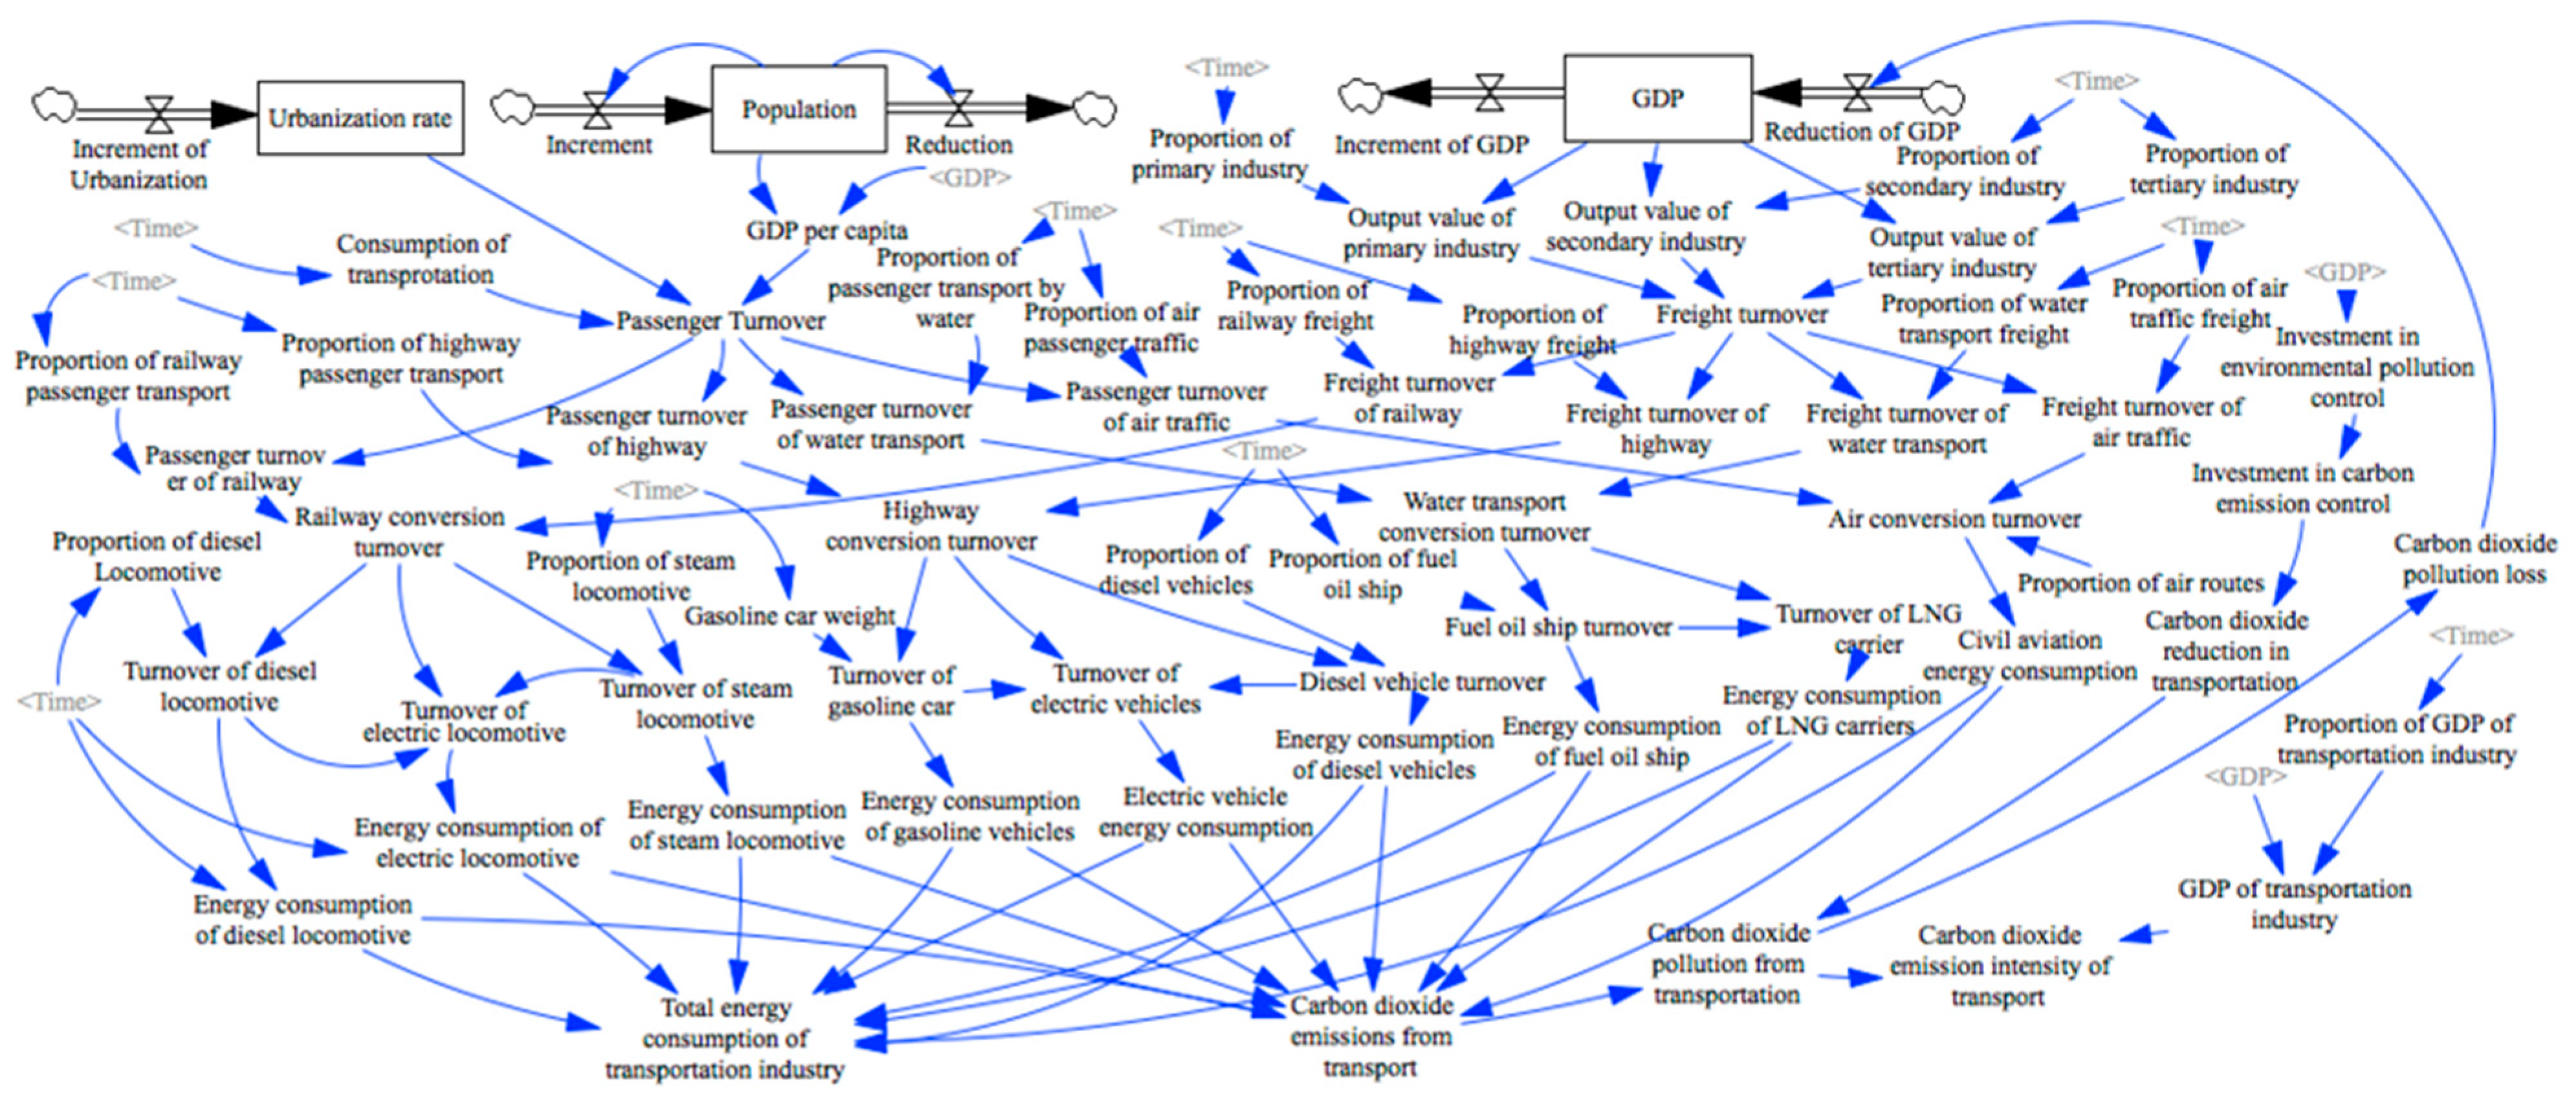
For the design and implementation of green development in urban transportation, understanding and analyzing the interactions among a range of dynamic factors that shape transportation patterns, behaviors, and impacts is crucial. System dynamics models (SD) facilitate in-depth studies of the complex system composed of transportation, socio-economic, energy, and environmental components and simulate predictions of the effectiveness of green development strategies implemented in the transportation sector [160,161,162]. SD models are composed of stocks, flows, and auxiliary variables and are used to analyze complex dynamic feedback systems. They graphically express the interactions among various factors in the transportation carbon emission system through stock-flow diagrams [163,164,165]. Owing to their proficiency in handling nonlinear, high-order, multivariate, multi-feedback, and cyclical system issues, system dynamics methods are widely applied in studies on energy conservation and carbon emissions, including in socio-economics, primary, secondary, and tertiary industries, housing, transportation, waste management, and electricity [166,167]. The transportation industry carbon emission system is a complex system with dynamic changes, typically divided into economic, energy, and environmental subsystems, or road, rail, and waterway subsystems. Consolidating past research, Figure 13 and Figure 14, respectively, represent the causal loop diagram and system flow diagram of the complex transportation–emission system, revealing the paths of energy consumption and pollution emissions in the transportation sector. Variables in the system can be categorized based on their attributes and significance into auxiliary, rate, and level variables. Auxiliary variables represent relationships between main variables, such as energy consumption in the transportation industry and environmental regulatory policies. Rate variables refer to the inputs and outputs of level variables, indicating changes in level variables over time, such as the share of the tertiary industry and the GDP growth rate. On the other hand, state variables represent significant stock variables, like GDP, average annual population, and carbon emissions. Ultimately, governments can simulate energy-saving and emission-reduction pathways in the transportation sector and predict pollution emission outcomes under current scenarios by combining local environmental protection and green industrial development policies, utilizing parameter setting results [168,169,170].
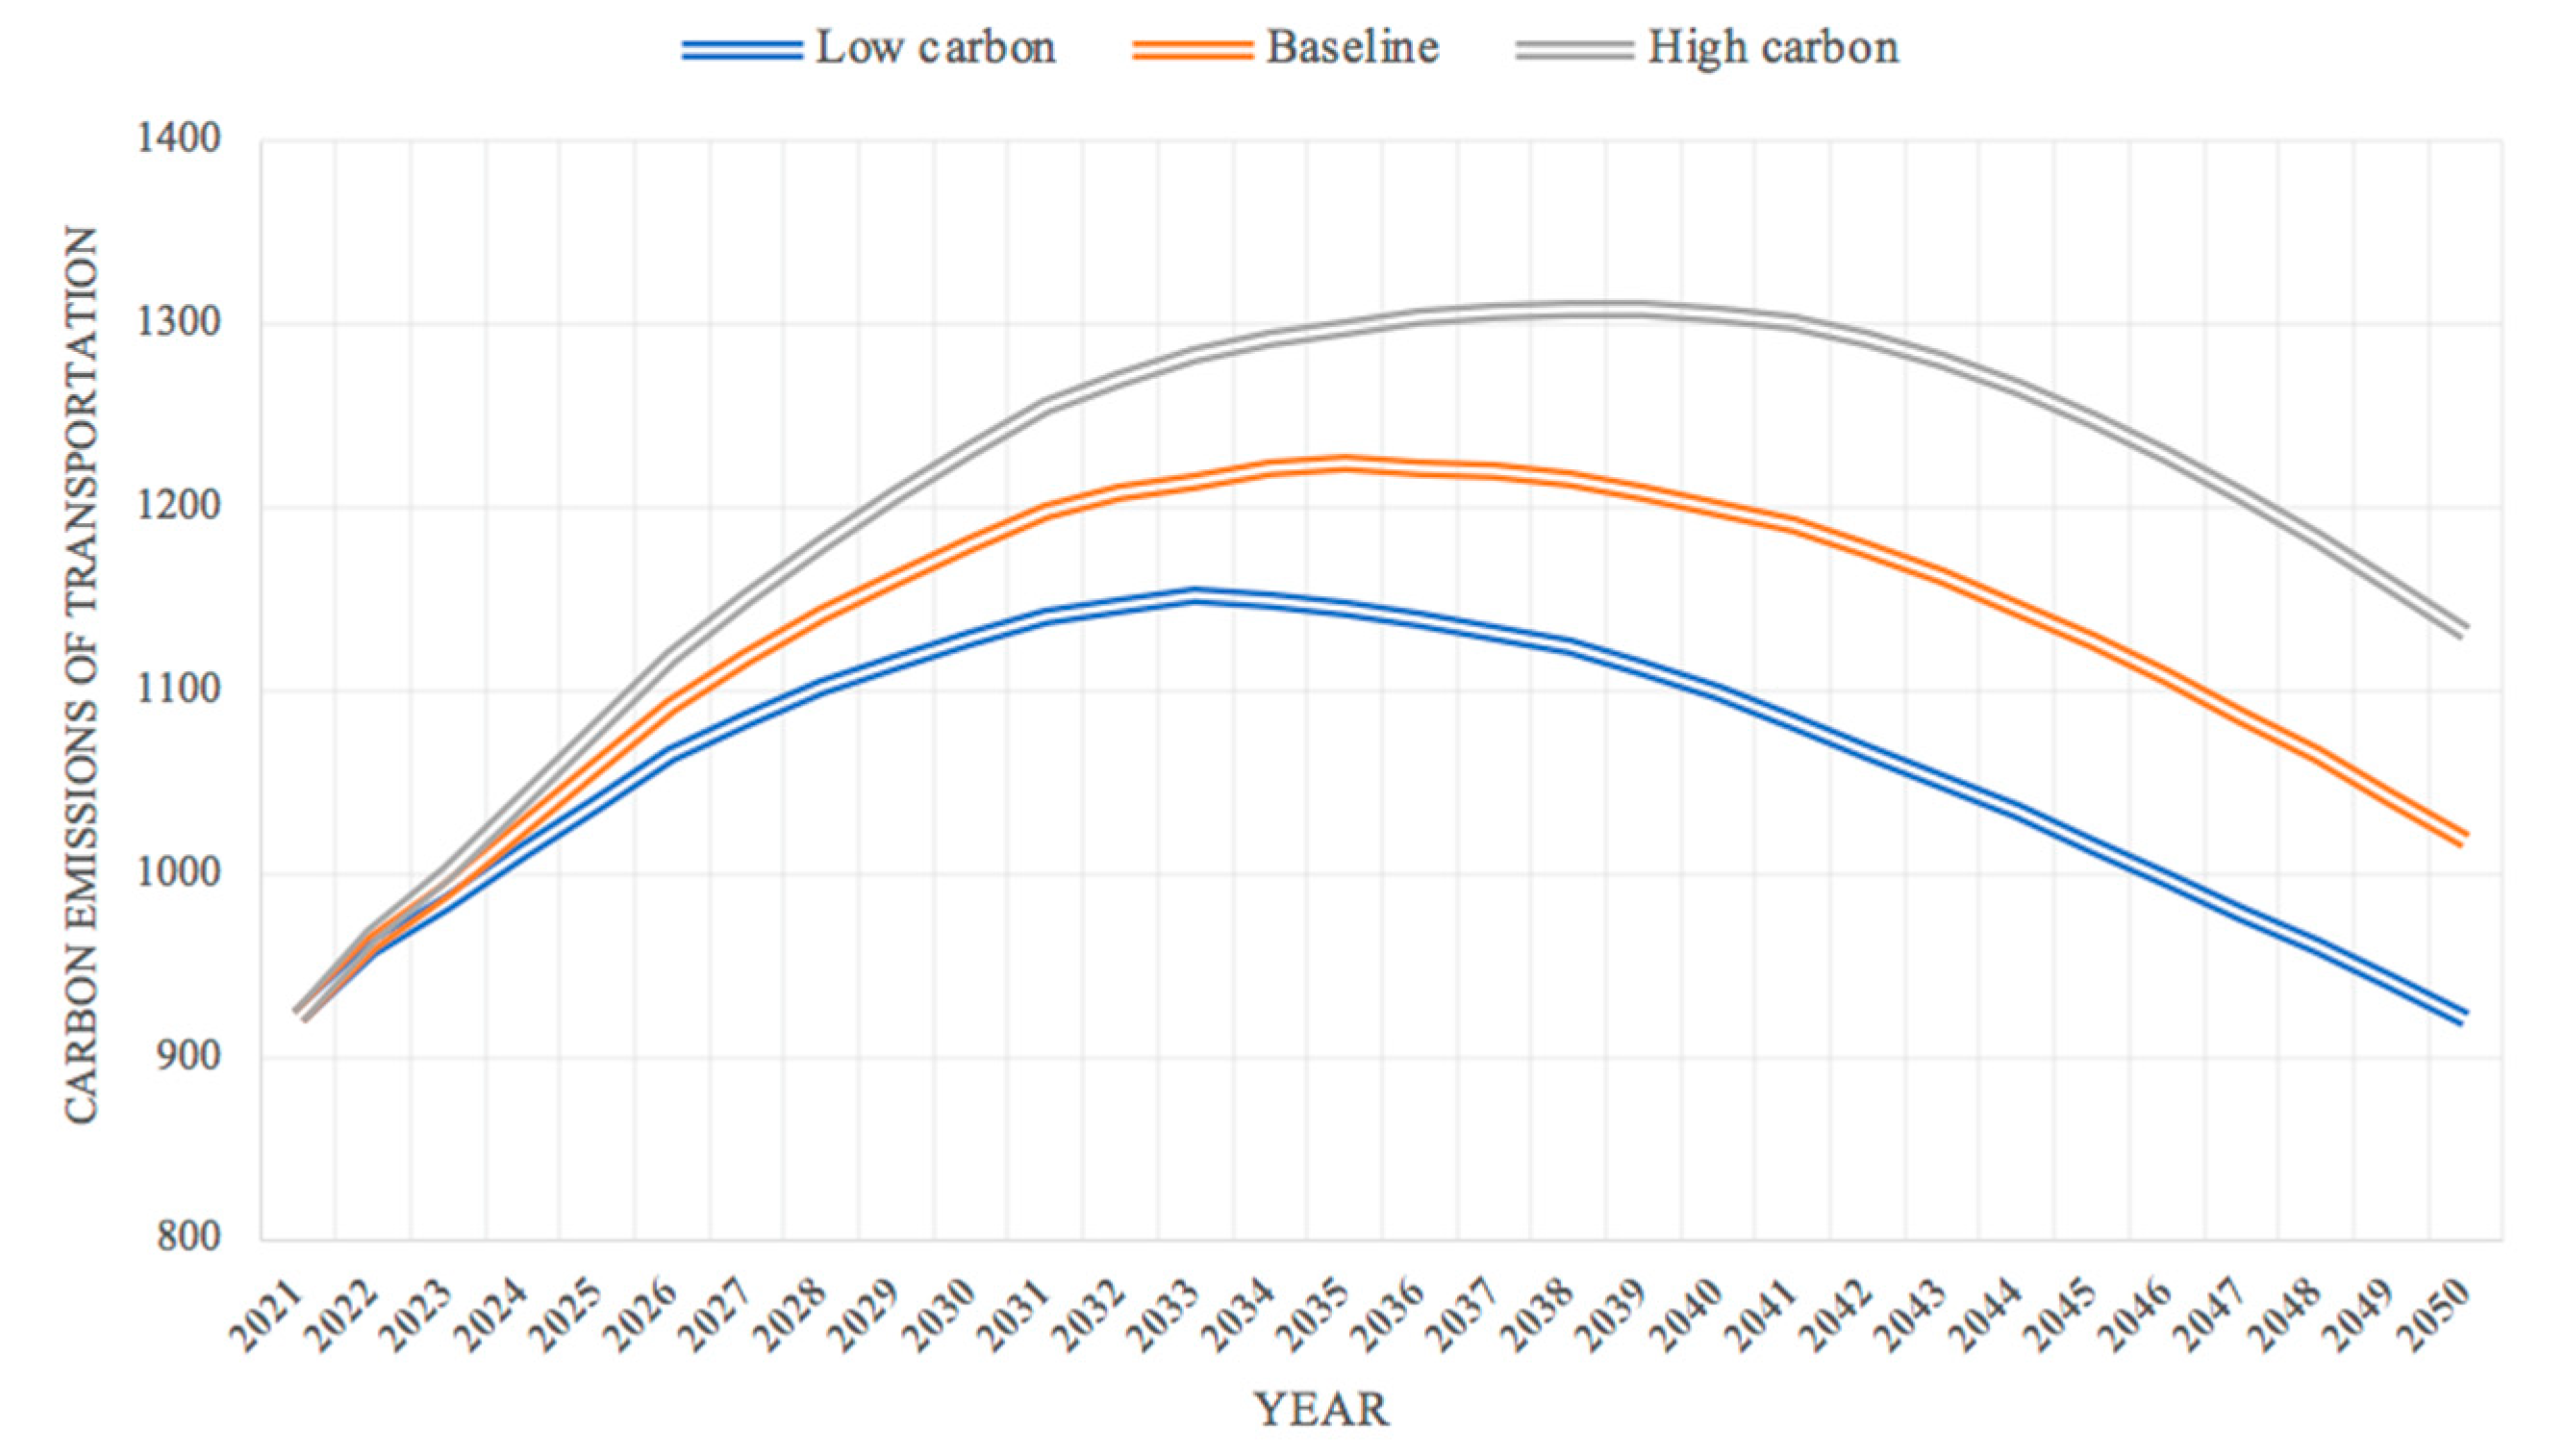
The long-range energy alternatives planning system (LEAP) models energy supply, utilization, and conversion technologies by modeling specific technical and economic parameters. Given its capability to quantitatively analyze the dynamic impacts of energy policies on the environment and forecast long-term energy demands and pollution emissions, LEAP is widely applied across various scales, from national to regional and industrial levels, particularly in certain sectors, like industry [171,172], transportation [173,174], and commerce [175]. Focusing on energy and carbon emissions, research primarily concentrates on future emission reduction potentials and pathways towards low-carbon transformation, emphasizing the significant impact of enhancing energy efficiency and changing energy structures on regional green development. Although the LEAP model effectively simulates energy consumption situations and their environmental impacts, it falls short of fully capturing the potential socio-economic benefits. The notable impacts of cross-industry energy transfer and emerging energy transformations on traditional development models, especially in developing countries, require further investigation [176]. Based on the scale, structural, technological effects, and external constraint policies impacting the green development of the transportation sector, this study, drawing on a review of the relevant literature, proposes three scenarios (baseline, low-carbon, and high-carbon), as shown in Table 6. The low-carbon scenario includes sub-scenarios, like structural optimization, technological progress, environmental policy constraints, and coordinated economic–environmental development. Given that industrial investment scale, energy intensity, energy structure, intensity of technological investments, and environmental regulation indicators play varying roles in different scenarios, predictions of carbon emissions and policy implementation outcomes inevitably differ. Building on the research by Yang et al. (2021) [177] and IEA data, Figure 15 illustrates the carbon emission outcomes predicted using the LEAP model under different scenarios. In the low-carbon scenario for the transportation sector, the growth and peak of carbon emissions are consistently lower than other scenarios, more in line with energy conservation and emission reduction policy requirements. Therefore, for high-pollution industries, like transportation, optimizing industrial structures, enhancing technological innovation levels, and formulating reasonable environmental regulatory policies are key to promoting coordinated development between industry and the environment and achieving a green development path [178,179,180].

5. Conclusions

Excessive emissions and excessive energy consumption have heightened global awareness of the necessity to strengthen green development in multiple countries. Green development in the transportation sector aims to reduce operational energy consumption in industrial development and to control associated carbon emissions. Within the burgeoning actions for green industrial development, the transportation sector has become a primary target for improvement. Although some countries, led by China, still have a significant impact on the environment through their transportation sector, this sector has been able to identify crucial factors influencing its green development through the use of reasonable environmental performance measurement methods. Utilizing scenario analysis and other simulation methods, it explores future paths for energy conservation and emission reduction.
With the development of the transportation sector, the environmental impacts of issues, such as the carbon emissions and energy consumption of vehicles, are becoming increasingly evident. Researchers, governments, and stakeholders have shown a growing interest in understanding the mechanisms that influence the greening of the transportation sector. This study reviews the current state of research on green development in the transportation sector from three perspectives: development performance assessment, analysis of influencing factors, and exploration of development pathways. This systematic review provides a comprehensive framework for understanding sustainability issues in the transportation sector, offering robust support for government and managerial decision-making. Simultaneously, by revealing the gaps and contradictions in existing research, this paper provides clear guidance for the direction and focus of subsequent studies, further deepening and refining knowledge in this field. Specifically, the conclusions of this study include the following aspects.
Firstly, this study presents the widely recognized input–output analysis framework in the transportation sector, focusing on the estimation methods for unintended outputs, like carbon emissions, and energy–environmental efficiency. However, there is a lack of internationally accepted methodologies for calculating transportation carbon emissions specific to different urban road design plans, modes of transport, and transportation vehicles. Environmental benefit assessments in the transportation industry predominantly measure direct energy consumption and carbon emissions during the developmental process, overlooking indirect energy consumption and pollutant emissions that could arise from inter-industrial interactions within national economic development. For example, these might include carbon emissions embedded in intermediate products and services consumed by the industry and inter-industry carbon transfer. Hence, the total carbon emissions and efficiency measurement results are not sufficiently accurate, which directly impacts the setting of carbon intensity targets. Moreover, in the evaluation of green development effects in the transportation sector, the literature based on static analyses at the national level or dynamic analyses combining provincial and municipal geographical locations is not entirely reliable. Considering spatial correlations, the geographical spatial dependency characteristics of green development should be incorporated into the research framework.
Secondly, in the realm of researching factors influencing the green development of the transportation sector, a systematic compilation has been conducted encompassing the aspects of influencing factors, the extent of that influence, and the pathways of impact. However, due to the influence of the energy rebound effect and environmental regulations, the development directions of industrial energy consumption, pollutant emissions, and environmental benefits are not fixed. With the increasing prominence of technological levels as the core driver of the industry’s green transformation and the growing demand of residents for the intelligence and greening of the transportation sector, research should intensify the analysis of the impact of technological innovation levels and resident preferences on advancing the greening process of the transportation sector in the future.
Thirdly, as the internal structure of the transportation energy consumption and carbon emission systems is dissected, it is necessary to explore the degree of influence of various factors and to simulate the improvement path of energy saving and emission reduction. The optimization of industrial structure, technological innovation, and economic scale have become more significant in the green development of the transportation industry. However, the most efficient means of reducing carbon emissions remains uncertain. Low-carbon travel options for residents can rapidly reduce carbon dioxide emissions at extremely low or even negative costs. Whether accelerating the development of intelligent transportation through source planning or leveraging technological advancements to empower the transformation of transportation energy structures, carbon reduction activities in the transportation sector largely depend on residents’ decisions for green travel. Coordinating consumer preferences with new technology applications, implementing green development concepts and requirements in the transportation industry, enhancing the quality and efficiency of transportation development, and optimizing the development layout of the transportation industry should be further explored.
Finally, by establishing scenarios that align with the developmental needs of the transportation sector, past research has achieved simulation analyses of the internal structure of the transportation energy consumption and emission system under the influence of transportation management policies and environmental constraints. Low-carbon scenarios, which incorporate conditions, such as structural optimization, technological innovation, and policy constraints, have indeed resulted in lower carbon emissions and the earlier achievement of a carbon peak. However, from a life-cycle perspective, the lifetime mileage of each transportation system is seldom incorporated into scenario analysis studies, leaving a knowledge gap in scenario simulations for sustainable development plans for different vehicle types. Current scenario settings based on baseline, high-carbon, and low-carbon are still somewhat rudimentary. More specific parameter settings should be considered to formulate more scientifically-based emission reduction pathway enhancement schemes for the transportation sector based on effective policy combinations. Additionally, scenario analyses mainly rely on predictions of energy consumption or carbon emissions. Comparing environmental performance or green total factor productivity across different scenario models could provide more valuable information for the future pursuit of the intelligent and sustainable development of the transportation sector.

Author Contributions

Conceptualization, Y.M. and X.L.; methodology, Y.M.; formal analysis, Y.M. and X.L.; investigation, Y.M. and X.L.; data curation, Y.M.; writing—original draft preparation, Y.M.; writing—review and editing, X.L.; visualization, Y.M.; supervision, X.L.; project administration, X.L.; funding acquisition, X.L. All authors have read and agreed to the published version of the manuscript.

Funding

This research was funded by the National Natural Science Foundation of China (51778047).

Institutional Review Board Statement

Not applicable.

Informed Consent Statement

Informed consent was obtained from all subjects involved in the study.

Data Availability Statement

The data presented in this study are available on request from the corresponding author.

Acknowledgments

We thank the editor and all anonymous referees for their comments. Additionally, we are grateful to our research group members for their valuable comments. Despite assistance from many sources, any remaining errors in the paper are the responsibility of the authors.

Conflicts of Interest

The authors declare no conflict of interest. The funders had no role in the design of the study; in the collection, analyses, or interpretation of data; in the writing of the manuscript, or in the decision to publish the results.

References

  1. International Energy Agency. Net Zero by 2050; IEA: Paris, France, 2021. [Google Scholar]
  2. International Energy Agency. IEA World Energy Outlook 2023; IEA: Paris, France, 2023. [Google Scholar]
  3. Milan, J. Integrated transport systems in the European Union: An overview of some recent developments. Transp. Rev. 2001, 21, 469–497. [Google Scholar]
  4. Hu, A.; Zhou, S. Green development: Function definition, mechanism analysis, and development strategy. China Popul. Resour. Environ. 2014, 24, 14–20. [Google Scholar]
  5. Meng, W.; Shao, F. Measurement of green economic growth efficiency in China by provinces and regions. Stat. Decis. 2020, 36, 105–109. [Google Scholar]
  6. Sousa, N.; Jorge, F.; Teixeira, M.S.; Losada, N.; Melo, M.; Bessa, M. An Exploratory Study about the Effect of COVID-19 on the Intention to Adopt Virtual Reality in the Tourism Sector. Sustainability 2023, 15, 8725. [Google Scholar] [CrossRef]
  7. Jorge, F.; Sousa, N.; Losada, N.; Teixeira, M.; Alén, E.; Melo, M.; Bessa, M. Can Virtual Reality be used to create memorable tourist experiences to influence the future intentions of wine tourists? J. Tour. Develop. 2023, 43, 67–76. [Google Scholar]
  8. Saboori, B.; Sapri, M.; Baba, M. Economic growth, energy consumption and CO2 emissions in OECD (Organization for Economic Co-operation and Development)’s transport sector: A fully modified bi-directional relationship approach. Energy 2014, 66, 150–161. [Google Scholar] [CrossRef]
  9. Shahbaz, M.; Khraief, N.; Jemaa, M.M.B. On the causal nexus of road transport CO2 emissions and macroeconomic variables in Tunisia: Evidence from combined cointegration tests. Renew. Sustain. Energy Rev. 2015, 51, 89–100. [Google Scholar] [CrossRef]
  10. Rehman, F.U.; Islam, M.M.; Miao, Q. Environmental sustainability via green transportation: A case of the top 10 energy transition nations. Transp. Policy 2023, 137, 32–44. [Google Scholar] [CrossRef]
  11. Ahmed, Z.; Zafar, M.W.; Ali, S. Linking urbanization, human capital, and the ecological footprint in G7 countries: An empirical analysis. Sustain. Cities Soc. 2020, 55, 102064. [Google Scholar] [CrossRef]
  12. Zhou, G.; Chung, W.; Zhang, X. A study of carbon dioxide emissions performance of China’s transport sector. Energy 2013, 50, 302–314. [Google Scholar] [CrossRef]
  13. Li, B.; Li, Y.; Zhou, H.; Ren, Y. Study on inter-provincial environmental total factor productivity and spatial spillover effects in China. Stat. Decis. 2021, 37, 10–14. [Google Scholar]
  14. Chiodi, A.; Gargiulo, M.; Rogan, F.; Deane, J.; Lavigne, D.; Rout, U.K.; Gallachóir, B.P. Modelling the impacts of challenging 2050 European climate mitigation targets on Ireland’s energy system. Energy Policy 2013, 53, 169–189. [Google Scholar] [CrossRef]
  15. Emodi, N.V.; Emodi, C.C.; Murthy, G.P.; Emodi, A.S. Energy policy for low carbon development in Nigeria: A LEAP model application. Renew. Sust. Energ. Rev. 2017, 68, 247–261. [Google Scholar] [CrossRef]
  16. Nieves, J.A.; Aristizábal, A.J.; Dyner, I.; Báez, O.; Ospina, D.H. Energy demand and greenhouse gas emissions analysis in Colombia: A LEAP model application. Energy 2019, 169, 380–397. [Google Scholar] [CrossRef]
  17. Burritt, R.; Schaltegger, S. Eco-efficiency in corporate budgeting. Environ. Manag. Health 2001, 12, 158–174. [Google Scholar] [CrossRef]
  18. Wu, D.; Mao, H.; Zhang, S.; Huang, J. Evaluation of urban land use efficiency in China. J. Geogr. 2011, 66, 1111–1121. [Google Scholar]
  19. Sun, H.; Zhang, C.; Zhou, R. Evaluation of carbon emission efficiency in western China based on stochastic frontier model. J. Ind. Technol. Econ. 2013, 12, 71–77. [Google Scholar]
  20. Lu, J.; Fu, H.; Wang, X. Study on the factors influencing the carbon emission efficiency of regional transportation industry. J. Transp. Syst. Eng. Inf. 2016, 16, 25–30. [Google Scholar]
  21. Lan, Z.; Zhang, H. Study on inter-provincial differences of carbon emission efficiency in China’s transportation industry. Logist. Technol. 2014, 33, 132–135. [Google Scholar]
  22. Yu, Y.; Li, Y.; Bao, L.; Li, W. Analysis of the Trajectory of Carbon Emission Shift of Road Cargo Transportation in China. Ecol. Econ. 2016, 32, 117–121. [Google Scholar]
  23. Yuan, C.; Zhang, S.; Jiao, P.; Wu, D. Study on the spatial and temporal variation of total factor carbon emission efficiency and influencing factors of provincial transportation in China. Resour. Sci. 2017, 39, 687–697. [Google Scholar]
  24. Hu, J.; Xu, S. Environmental efficiency and environmental total factor productivity measurement in China’s industrial sector. Stat. Decis. 2022, 38, 65–70. [Google Scholar]
  25. Alizadeh, S.; Vali, F.; Vatani, Z.; Avami, A. Sustainable analysis of Waste-to-Energy systems in cities by eco-efficiency assessment using DEA approach: A case study of Iran’s municipalities. Sustain. Cities Soc. 2023, 98, 104825. [Google Scholar] [CrossRef]
  26. Risto, H.; Rajeev, K.G. Global CO2 efficiency: Country-wise estimates using a stochastic cost frontier. Energy Policy 2012, 45, 762–770. [Google Scholar]
  27. Chen, X.; Yi, G.; Liu, X. A study on regional carbon emission efficiency in China based on three-stage SBM-DEA model. Oper. Res. Manag. 2017, 26, 115–122. [Google Scholar]
  28. Park, Y.S.; Lim, S.H.; Egilmez, G.; Szmerekovsky, J. Environmental efficiency assessment of US transport sector: A slack-based data envelopment analysis approach. Transp. Res. Part D Transp. Environ. 2018, 61, 152e64. [Google Scholar] [CrossRef]
  29. Tang, J.; Hu, P. Research on energy and environmental efficiency of transportation industry based on parallel DEA model. J. Wanxi Coll. 2019, 35, 109–115. [Google Scholar]
  30. Stefaniec, A.; Hosseini, K.; Xie, J.H.; Li, Y.J. Sustainability assessment of inland transportation in China: A triple bottom line-based network DEA approach. Transp. Res. Transp. Environ. 2020, 80, 102258. [Google Scholar] [CrossRef]
  31. Zhu, Q.; Wang, M.; Zhou, F.; Xu, R. Research on carbon emission accounting of transportation industry and its influencing factors under the integration of Beijing, Tianjin and Hebei. J. CUT (Soc. Sci. Ed.) 2019, 33, 23–31. [Google Scholar]
  32. Zhou, W.; Nie, M. A study of regional differences in industrial carbon emission efficiency in China: An empirical analysis based on nonparametric frontier. J. Quant. Technol. Econ. 2012, 9, 58–70. [Google Scholar]
  33. Qu, C.; Li, L.; Cheng, Z. Carbon emission efficiency and its influencing factors in China’s manufacturing industry. Sci. Technol. Manag. Res. 2017, 37, 60–68. [Google Scholar]
  34. Guo, B.; Lin, K. Research on the evaluation of carbon emission efficiency in the Yangtze River Delta region based on non-expected output SBM model. J. Ind. Technol. Econ. 2017, 36, 107–115. [Google Scholar]
  35. Lu, X.; Ma, X.; Xiong, S. Analysis of environmental efficiency of transportation industry in eastern China. Mod. Manag. 2017, 3, 88–91. [Google Scholar]
  36. Zhou, Y.; Hong, X. Measurement of total factor carbon emission efficiency and dynamic driving mechanism of China’s transportation industry. J. Bus. Econ. 2018, 5, 62–74. [Google Scholar]
  37. Fare, R.; Grosskopf, S. Network DEA. Socio-Econ. Plan. Sci. 2000, 34, 35–49. [Google Scholar] [CrossRef]
  38. Lu, T.; Wang, Y.; Ma, M. Network DEA-based efficiency evaluation of two-sector parallel systems with shared inputs and (non) desired outputs-A case study of China’s road transportation industry. J. Syst. Sci. Math. 2017, 37, 1976–1987. [Google Scholar]
  39. Zhang, B.; Liu, Q.; Wang, H. Dynamic measurement of energy use efficiency in China’s transportation industry-an empirical analysis based on improved DEA model with output indicators. J. Ind. Technol. Econ. 2014, 33, 15–25. [Google Scholar]
  40. Zhang, N.; Zhou, P.; Kung, C. Total-factor carbon emission performance of the Chinese transportation industry: A bootstrapped non-radial Malmquist index analysis. Renew. Sustain. Energy Rev. 2015, 41, 584–593. [Google Scholar] [CrossRef]
  41. Wang, N.; Chen, J.; Yao, S.; Chang, Y.-C. A meta-frontier DEA approach to efficiency comparison of carbon reduction technologies on project level. Renew. Sustain. Energy Rev. 2018, 82, 1381–1391. [Google Scholar] [CrossRef]
  42. Abdallah, K.B.; Belloumi, M.; De Wolf, D. International comparisons of energy and environmental efficiency in the road transport sector. Energy 2015, 93, 2087–2101. [Google Scholar] [CrossRef]
  43. Yao, X.; Guo, C.; Shao, S.; Jiang, Z. Total-factor CO2, emission performance of China’s provincial industrial sector: A meta- frontier non- radial Malmquist index approach. Appl. Energy 2016, 184, 1142–1153. [Google Scholar] [CrossRef]
  44. Ananda, J.; Hampf, B. Measuring environmentally sensitive productivity growth: An application to the urban water sector. Ecol. Econ. 2015, 116, 211–219. [Google Scholar] [CrossRef]
  45. Ozkara, Y.; Atak, M. Regional total-factor energy efficiency and electricity saving potential of manufacturing industry in Turkey. Energy 2015, 93, 495–510. [Google Scholar] [CrossRef]
  46. Eguchi, S.; Takayabu, H.; Lin, C. Sources of inefficient power generation by coal-fired thermal power plants in China: A metafrontier DEA decomposition approach. Renew. Sustain. Energy Rev. 2021, 138, 110562. [Google Scholar] [CrossRef]
  47. Kang, Y.; Zhao, T.; Yang, Y. Environmental Kuznets Curve for CO2 Emissions in China: A Spatial Panel Data Approach. Ecol. Indic. 2016, 63, 231–239. [Google Scholar] [CrossRef]
  48. Rios, V.; Gianmoena, L. Convergence in CO2 Emissions: A Spatial Economic Analysis with Cross-Country Interactions. Energ. Econ. 2018, 75, 222–238. [Google Scholar] [CrossRef]
  49. Li, W.; Sun, W. Characteristics of spatial and temporal distribution of carbon emissions in provincial transportation industry. Syst. Eng. 2016, 34, 34–42. [Google Scholar]
  50. Li, X.; Yu, B. Peaking CO2 emissions for China’s urban passenger transport sector. Energy Policy 2019, 133, 110913. [Google Scholar] [CrossRef]
  51. Zhang, A.; Zhang, Y. Is it time for an integrated aviation market in Northeast Asia? An airline performance perspective. Transp. Policy 2021, 10, 161–169. [Google Scholar] [CrossRef]
  52. Wang, S.; Liu, X. China’s City-Level Energy-Related CO2 Emissions: Spatiotemporal Patterns and Driving Forces. Appl. Energy 2017, 200, 204–214. [Google Scholar] [CrossRef]
  53. Wang, J.; Mo, H.H. A study on the complexity of the evolutionary process of Chinese aviation network. J. Transp. Syst. Eng. Inf. 2014, 14, 75–84. [Google Scholar]
  54. Wen, L.; Song, Q. Simulation study on carbon emission of China’s freight system under the target of carbon peaking. Sci. Total Environ. 2022, 812, 152600. [Google Scholar] [CrossRef] [PubMed]
  55. You, W.; Lv, Z. Spillover Effects of Economic Globalization on CO2 Emissions: A Spatial Panel Approach. Energy Econ. 2018, 73, 248–257. [Google Scholar] [CrossRef]
  56. Zhang, L. A review of China’s road traffic carbon emissions. J. Clean. Prod. 2019, 207, 569–581. [Google Scholar] [CrossRef]
  57. Zheng, Y. Estimating carbon emissions in urban functional zones using multi-source data: A case study in Beijing. Build. Environ. 2022, 212, 108804. [Google Scholar] [CrossRef]
  58. Wang, S.; Li, C.; Yang, L. Decoupling Effect and Forecasting of Economic Growth and Energy Structure Under the Peak Constraint of Carbon Emissions in China. Environ. Sci. Pollut. Res. 2018, 25, 25255–25268. [Google Scholar] [CrossRef] [PubMed]
  59. Tong, L.; Wang, Y. Research on the spatial network structure characteristics and influencing factors of provincial carbon emissions-based on the perspective of industrial transfer. Econ. Issue 2020, 42, 18–24. [Google Scholar]
  60. Tsai, M.; Chang, S. Taiwan’s 2050 low carbon development roadmap: An evaluation with the MARKAL model. Renew. Sustain. Energy Rev. 2015, 49, 178–191. [Google Scholar] [CrossRef]
  61. Fan, F.; Lei, Y. Factor analysis of energy-related carbon emissions: A case study of Beijing. J. Clean. Prod. 2017, 163, S277–S283. [Google Scholar] [CrossRef]
  62. Zhu, B.; Su, B.; Li, Y. Input-output and structural decomposition analysis of India’s carbon emissions and intensity, 2007/08–2013/14. Appl Energy 2018, 230, 1545–1556. [Google Scholar] [CrossRef]
  63. Liu, J.; Li, M.; Ding, Y. Econometric analysis of the impact of the urban population size on carbon dioxide (CO2) emissions in China. Environ. Dev. Sustain. 2021, 23, 18186–18203. [Google Scholar] [CrossRef]
  64. Azlina, A.A.; Law, S.H.; Mustapha, N.H.N. Dynamic Linkages among Transport Energy Consumption, Income and CO2 Emission in Malaysia. Energy Policy 2014, 73, 598–606. [Google Scholar] [CrossRef]
  65. Xie, R.; Fang, J.; Liu, C. The Effects of Transportation Infrastructure on Urban Carbon Emissions. Appl. Energy 2017, 196, 199–207. [Google Scholar] [CrossRef]
  66. Zhu, X.; Li, R. An Analysis of Decoupling and Influencing Factors of Carbon Emissions from the Transportation Sector in the Beijing-Tianjin-Hebei Area, China. Sustainability 2017, 9, 722. [Google Scholar] [CrossRef]
  67. Vincent, W.; Jerram, L. The potential for bus rapid transit to reduce transportation-related CO2 emissions. J. Public Transp. 2018, 9, 219–237. [Google Scholar] [CrossRef]
  68. Kim, S. Decomposition Analysis of Greenhouse Gas Emissions in Korea’s Transportation Sector. Sustainability 2019, 11, 1986. [Google Scholar] [CrossRef]
  69. Lin, B.; Tan, R. Economic agglomeration and green economic efficiency in China. Econ. Res. 2019, 54, 119–132. [Google Scholar]
  70. Su, X.; Li, Y.; Fang, K.; Long, Y. Does China’s direct investment in “Belt and Road Initiative” countries decrease their carbon dioxide emissions? J. Clean. Prod. 2022, 339, 130543. [Google Scholar] [CrossRef]
  71. Wang, S.; Kuai, L. Carbon emission drivers and peak pathways in China’s transportation industry. Resour. Sci. 2022, 44, 2415–2427. [Google Scholar]
  72. Fan, F.; Lei, Y. Decomposition analysis of energy-related carbon emissions from the transportation sector in Beijing. Transp. Res. Part D Transp. Environ. 2016, 42, 135–145. [Google Scholar] [CrossRef]
  73. Houda, A.; Mounir, B. Decomposing the influencing factors of energy consumption in Tunisian transportation sector using the LMDI method. Transp. Policy 2016, 52, 64–71. [Google Scholar]
  74. Wang, S.; Liu, X.; Zhou, C.; Hu, J.; Ou, J. Examining the Impacts of Socioeconomic Factors, Urban Form, and Transportation Networks on CO2 Emissions in China’s Megacities. Appl. Energy 2017, 185, 189–200. [Google Scholar] [CrossRef]
  75. Xu, B.; Lin, B. Investigating the Differences in CO2 Emissions in the Transport Sector across Chinese Provinces: Evidence from a Quantile Regression Model. J. Clean. Prod. 2017, 175, 109–122. [Google Scholar] [CrossRef]
  76. Zhang, C.; Su, B.; Zhou, K.; Yang, S. Decomposition analysis of China’s CO2 emissions (2000–2016) and scenario analysis of its carbon intensity targets in 2020 and 2030. Sci. Total Environ. 2019, 668, 432–442. [Google Scholar] [CrossRef]
  77. Chen, P. Assessing carbon dioxide emissions of high-speed rail: The case of Beijing-Shanghai corridor. Transp. Res. Part D Transp. Environ. 2021, 97, 102949. [Google Scholar] [CrossRef]
  78. Lin, B.; Du, Z. A study on energy consumption of urban vehicles and public transportation efficiency in China. Econ. Res. 2018, 53, 142–156. [Google Scholar]
  79. Liu, B.; Shi, J.; Wang, H.; Su, X.; Zhou, P. Driving factors of carbon emissions in China: A joint decomposition approach based on meta-frontier. Appl. Energy 2019, 256, 113986. [Google Scholar] [CrossRef]
  80. Cui, H.; Wang, H.; Zhao, Q. Research on the dynamic evolution characteristics and drivers of green total factor productivity in Chinese industry. Stat. Decis. 2021, 37, 117–120. [Google Scholar]
  81. Steren, A.; Rubin, O.D.; Rosenzweig, S. Assessing the rebound effect using a natural experiment setting: Evidence from the private transportation sector in Israel. Energy Policy 2016, 93, 41–49. [Google Scholar] [CrossRef]
  82. Huang, H. Study on the energy rebound effect in China’s transportation industry. J. Transport Syst. Eng. Inf. 2017, 17, 27–31+39. [Google Scholar]
  83. Yang, L.; Li, Z. Technology advance and the carbon dioxide emission in China–Empirical research based on the rebound effect. Energy Policy 2017, 101, 150–161. [Google Scholar] [CrossRef]
  84. Liu, C.; Zhu, Y.; Qin, C. Energy environmental efficiency and energy rebound effect of road transportation-a study based on spatial spillover effect. Technoeconomic 2019, 38, 114–128. [Google Scholar]
  85. Hering, L.; Poncetand, S. Environmental policy and exports: Evidence from Chinese cities. J. Environ. Econ. Manag. 2014, 68, 296–318. [Google Scholar] [CrossRef]
  86. Hao, L.; Li, S.; Li, S. Environmental regulation, dynamic industrial agglomeration and regional productivity growth. China Soft Sci. 2021, 10, 32–42. [Google Scholar]
  87. Cansino, J.M.; Sánchez-Braza, A.; Rodríguez-Aríevalo, M.L. Driving forces of Spain’s CO2 emissions: A LMDI decomposition approach. Renew. Sustain. Energy Rev. 2015, 48, 749–759. [Google Scholar] [CrossRef]
  88. Wang, Y.; Li, R. A review and outlook on carbon peaking and carbon neutral transportation research in urban agglomerations. Transp. Res. 2021, 7, 2–9. [Google Scholar]
  89. Chong, C. The driving factors of energy-related CO2 emission growth in Malaysia: The LMDI decomposition method based on energy allocation analysis. Renew. Sustain. Energy Rev. 2019, 115, 109356.1–109356.19. [Google Scholar] [CrossRef]
  90. Guo, R.; Yuan, Y. Different types of environmental regulations and heterogeneous influence on energy efficiency in the industrial sector: Evidence from Chinese provincial data. Energy Policy 2020, 145, 111747. [Google Scholar] [CrossRef]
  91. Palmer, K.; Paul, A.; Keyes, A. Changing baselines, shifting margins: How predicted impacts of pricing carbon in the electricity sector have evolved over time. Energy Econ. 2018, 73, 371–379. [Google Scholar] [CrossRef]
  92. Zhang, G.; Su, Z. Decomposition of influencing factors and scenario prediction of transportation carbon emissions in the Yellow River Basin. Manag. Rev. 2020, 32, 283–294. [Google Scholar]
  93. Plá, M.L.; Casasús, T.; Liern, V.; Pérez, J.C. On the importance of perspective and flexibility for efficiency measurement: Effects on the ranking of decision-making units. J. Oper. Res. Soc. 2017, 69, 1640–1652. [Google Scholar]
  94. Wang, B.; Sun, Y.; Wang, Z. Agglomeration effect of CO2 emissions and emissions reduction effect of technology: A spatial econometric perspective based on China’s province-level data. J. Clean. Prod. 2018, 204, 96–106. [Google Scholar] [CrossRef]
  95. Cheng, Y.; Yao, X. Carbon intensity reduction assessment of renewable energy technology innovation in China: A panel data model with cross-section dependence and slope heterogeneity. Renew. Sustain. Energy Rev. 2021, 135, 110157. [Google Scholar] [CrossRef]
  96. Moshiri, S.; Aliyev, K. Rebound effect of efficiency improvement in passenger cars on gasoline consumption in Canada. Ecol. Econ. 2017, 131, 330–341. [Google Scholar] [CrossRef]
  97. Liu, J.; Li, S.; Ji, Q. Regional differences and driving factors analysis of carbon emission intensity from transport sector in China. Energy 2021, 224, 120178. [Google Scholar] [CrossRef]
  98. Li, R.; Han, X.; Wang, Q. Do technical differences lead to a widening gap in China’s regional carbon emissions efficiency? Evidence from a combination of LMDI and PDA approach. Renew. Sustain. Energy Rev. 2023, 182, 113361. [Google Scholar] [CrossRef]
  99. Ehrlich, P.R.; Ehrlich, A.H. Population, Resources, Environment: Issues in Human Ecology; Freeman: San Francisco, CA, USA, 1970. [Google Scholar]
  100. Zhang, C.; Nian, J. Panel estimation for transport sector CO2 emissions and its affecting factors: A regional analysis in China. Energy Policy 2013, 63, 918–926. [Google Scholar] [CrossRef]
  101. Xu, B.; Lin, B. Carbon dioxide emissions reduction in China’s transport sector: A dynamic VAR (vector auto regression) approach. Energy 2015, 83, 486–495. [Google Scholar] [CrossRef]
  102. Hu, Z.; He, J.; Wang, Y. Analysis and insights of Japanese household carbon emission factors based on IPAT-LMDI extended model. Resour. Sci. 2018, 40, 1831–1842. [Google Scholar]
  103. Fang, K.; Tang, Y.; Zhang, Q.; Song, J.; Wen, Q.; Sun, H.; Ji, C.; Xu, A. Will China peak its energy-related carbon emissions by 2030? Lessons from 30 Chinese provinces. Appl. Energy 2019, 255, 113852. [Google Scholar] [CrossRef]
  104. Yan, S.; Chen, L. Analysis of factors influencing transportation carbon emissions: Taking Xi’an city as an example. Stat. Decis. 2020, 36, 62–66. [Google Scholar]
  105. Lu, S.; Jiang, H.; Liu, Y. Regional differences in CO2 emissions of transportation industry and influencing factors. J. Transp. Syst. Eng. Inf. 2017, 17, 32–39. [Google Scholar]
  106. Wang, S.; Gao, S.; Huang, Y.; Shi, C. Spatial and temporal evolution pattern and prediction of carbon emission performance of Chinese cities based on super-efficient SBM model. J. Geogr. 2020, 75, 1316–1330. [Google Scholar]
  107. Wei, J.; Xia, W.; Guo, X.; Marinova, D. Urban transportation in Chinese cities: An efficiency assessment. Transp. Res. Part D Transp. Environ. 2013, 23, 20–24. [Google Scholar] [CrossRef]
  108. Lu, S.; Jiang, H.; Yao, L. Regional disparities and influencing factors of Average CO2 Emissions from transportation industry in Yangtze River Economic Belt. Transp. Res. Part D Transp. Environ. 2017, 57, 112–123. [Google Scholar] [CrossRef]
  109. Xu, B.; Lin, B. Reducing carbon dioxide emissions in China’s manufacturing industry: A dynamic vector autoregression approach. J. Clean. Prod. 2016, 131, 594–606. [Google Scholar] [CrossRef]
  110. Liu, Y.; Wang, Y.; Lian, Y.; Han, S. Factors and scenario analysis of transport carbon dioxide emissions in rapidly developing cities. Transp. Res. Part D Transp. Environ. 2020, 80, 102252. [Google Scholar]
  111. Yang, S.; Zhang, Y.; Geng, C. Analysis of transportation carbon emission changes in the Yangtze River economic zone based on LMDI and Thiel index. China Environ. Sci. 2022, 42, 1–23. [Google Scholar]
  112. Pan, W.; Liu, T.; Wang, F. Study on the factors influencing CO2 emissions of regional industries in China: A perspective of different economic growth stages. Stat. Res. 2017, 34, 30–44. [Google Scholar]
  113. Ahoura, Z.; Shima, H.; Nicole, F. High-tech Business Location, Transportation Accessibility, and Implications for Sustainability: Evaluating the Differences Between High-tech Specializations Using Empirical Evidence from U.S. Booming Regions. Sustain. Cities Soc. 2019, 50, 101648. [Google Scholar]
  114. Cakar, N.D.; Gedikli, A.; Erdogan, S.; Yıldırım, D.C. A comparative analysis of the relationship between innovation and transport sector carbon emissions in developed and developing Mediterranean countries. Environ. Sci. Pollut. Control 2021, 28, 45693–45713. [Google Scholar] [CrossRef]
  115. Alatas, S. Do Environmental Technologies Help to Reduce Transport Sector CO2 Emissions? Evidence from the EU15 Countries. Res. Transp. Econ. 2021, 91, 101047. [Google Scholar] [CrossRef]
  116. Zhao, X.; Hu, H.; Yuan, H.; Chu, X. How does adoption of electric vehicles reduce carbon emissions? Evidence from China. Heliyon 2023, 9, e20296. [Google Scholar] [CrossRef]
  117. Awan, A.; Alnour, M.; Jahanger, A.; Onwe, J.C. Do technological innovation and urbanization mitigate carbon dioxide emissions from the transport sector? Technol. Soc. 2022, 71, 102128. [Google Scholar] [CrossRef]
  118. Yang, L.; Zhu, J.; Jia, Z. Influencing factors and current challenges in achieving carbon emission reduction in China-based on the perspective of technological progress. Econ. Res. 2019, 54, 118–132. [Google Scholar]
  119. Shao, S.; Fan, M.; Yang, L. Economic restructuring, green technological progress, and low-carbon transformational development in China-an empirical examination based on the perspective of overall technological frontier and spatial spillover effects. Manag. World 2022, 38, 46–69+4–10. [Google Scholar]
  120. Xin, D.; Ahmad, M.; Lei, H.; Khattak, S.I. Do innovation in environmental-related technologies asymmetrically affect carbon dioxide emissions in the United States? Technol. Soc. 2021, 67, 101761. [Google Scholar] [CrossRef]
  121. Liu, H.; Zhang, Y.; Zhu, Q.; Chu, J. Environmental efficiency of land transportation in China: A parallel slack-based measure for regional and temporal analysis. J. Clean. Prod. 2016, 142, 867–876. [Google Scholar] [CrossRef]
  122. Ren, M.; Huang, Y.; Fu, S.; Chang, X. Study on carbon emission efficiency of transportation industry in national central cities. Ecol. Sci. 2022, 41, 169–178. [Google Scholar]
  123. Ardito, L.; Petruzzelli, A.M.; Ghisetti, C. The impact of public research on the technological development of industry in the green energy field. Technol. Forecast. Soc. Chang. 2019, 144, 25–35. [Google Scholar] [CrossRef]
  124. Greening, L.A.; Greene, D.L.; Difiglio, C. Energy efficiency and consumption-The rebound effect- A survey. Energy Policy 2000, 28, 389–401. [Google Scholar] [CrossRef]
  125. Sorrell, S.; Dimitropoulos, J. The Rebound Effect: Microeconomic Definitions, Limitations and Extensions. Ecol. Econ. 2008, 65, 636–649. [Google Scholar] [CrossRef]
  126. Berkhout, P.; Muskens, J.C.; Velthuijsen, J.W. Defining the rebound effect. Energy Policy 2000, 28, 425–432. [Google Scholar] [CrossRef]
  127. Modarres, A. Commuting and energy consumption: Toward an equitable transportation policy. J. Transp. Geogr. 2013, 33, 240–249. [Google Scholar] [CrossRef]
  128. Frondel, M.; Ritter, N.; Vance, C. Heterogeneity in the rebound effect: Further evidence for Germany. Energy Econ. 2012, 34, 461–467. [Google Scholar] [CrossRef]
  129. Shao, S.; Yang, L.; Huang, T. A theoretical model of energy rebound effect and China’s experience. Econ. Res. 2013, 48, 96–109. [Google Scholar]
  130. Li, C.; Shang, Q.; Yang, L. Research on energy rebound effect in Tianjin based on total factor energy efficiency. Sci. Technol. Manag. Res. 2014, 34, 221–225. [Google Scholar]
  131. Broberg, T.; Berg, C.; Samakovlis, E. The economy-wide rebound effect from improved energy efficiency in Swedish industries-A general equilibrium analysis. Energy Policy 2015, 83, 26–37. [Google Scholar] [CrossRef]
  132. Ai, M.; Li, C. Research on energy consumption in China’s steel industry from the perspective of elemental substitution and rebound effect. Soft Sci. 2017, 31, 6–10. [Google Scholar]
  133. Fenner, A.E.; Kibert, C.J.; Woo, J.; Morque, S.; Razkenari, M.; Hakim, H.; Lu, X. The carbon footprint of buildings: A review of methodologies and applications. Renew. Sustain. Energy Rev. 2018, 94, 1142–1152. [Google Scholar] [CrossRef]
  134. Borger, B.; Mulalic, I. The determinants of fuel use in the trucking industry—Volume, fleet characteristics and the rebound effect. Transp. Policy 2012, 24, 284–295. [Google Scholar] [CrossRef]
  135. Odeck, J.; Johansen, K. Elasticities of fuel and traffic demand and the direct rebound effects: An econometric estimation in the case of Norway. Transport Res. A-Policy Pract. 2016, 83, 1–13. [Google Scholar] [CrossRef]
  136. Stapleton, L.; Sorrell, S.; Schwanen, T. Estimating direct rebound effects for personal automotive travel in Great Britain. Energy Econ. 2016, 54, 313–325. [Google Scholar] [CrossRef]
  137. Wang, Z.; Lu, M. An empirical study of direct rebound effect for road freight transport in China. Appl. Energy 2014, 133, 274–281. [Google Scholar] [CrossRef]
  138. He, A.; An, M. Local government competition, environmental regulation, and green development efficiency. China Popul. Resour. Environ. 2019, 29, 21–30. [Google Scholar]
  139. Sun, X.; Zhang, R.; Wang, G.; Guo, J.; Liu, Z. Factor decomposition, reduction potential, and rebound effect of energy consumption related PM2.5 in China. J. Clean. Prod. 2021, 322, 129088. [Google Scholar] [CrossRef]
  140. Cai, W.; Zhou, X. The dual effect of environmental regulation on green total factor productivity in China. Economist 2017, 27–35. [Google Scholar] [CrossRef]
  141. Liu, H.; Xiang, C.; Zheng, S. How “the Porter Hypothesis” holds: Evidence from China. Comp. Econ. Soc. Syst. 2018, 1, 54–62. [Google Scholar]
  142. Zhang, J.; Cai, N.; Yang, C. The impact of environmental regulation on China’s industrial green index. China Popul. Resour. Environ. 2015, 25, 24–31. [Google Scholar]
  143. Li, J.; Liu, H.Y. Research on the Development of Low Carbon of Urban Transportation: Taking Tianjin as an Example. Ecol. Econ. 2014, 30, 154–156. [Google Scholar]
  144. Baeumler, N.; Haszprunar, G.; Ruthensteiner, B. Development of the excretory system in a polyplacophoran mollusks: Stages in metanephridia system development. Front. Zool. 2012, 9, 23. [Google Scholar] [CrossRef] [PubMed]
  145. Yang, Y.; Hu, J.; Deng, Y.; Zhang, Y.; Yang, D. High performance lithium-sulfur batteries by facilely coating a conductive carbon nanotube or graphene layer. China Chem. Lett. 2018, 29, 1777–1780. [Google Scholar] [CrossRef]
  146. Zhang, X.; Zhang, Q.; Sun, T.; Zou, Y.; Chen, H. Evaluation of urban public transport priority performance based on the improved TOPSIS method: A case study of Wuhan. Sustain. Cities Soc. 2018, 43, 357–365. [Google Scholar] [CrossRef]
  147. Haitao, H.; Yang, K.; Liang, H.; Menendez, M.; Guler, S.I. Providing public transport priority in the perimeter of urban networks: A bimodal strategy. Transp. Res. Part C Emerg. Technol. 2019, 107, 171–192. [Google Scholar] [CrossRef]
  148. Pooja, S.; Chani, P.S.; Parida, M. Sustainable transport strategies: An approach towards low carbon cities. J. Environ. Res. Dev. 2013, 7, 1450–1458. [Google Scholar]
  149. Chatziioannou, I.; Alvarez-Icaza, L.; Bakogiannis, E.; Kyriakidis, C.; Chias-Becerril, L. A Structural Analysis for the Categorization of the Negative Externalities of Transport and the Hierarchical Organization of Sustainable Mobility’s Strategies. Sustainability 2020, 12, 6011. [Google Scholar] [CrossRef]
  150. Tian, Y.; Song, W.; Liu, M. An assessment of how environmental policy affects urban innovation: Evidence from China’s low-carbon pilot cities program. Econ. Anal. Policy 2021, 71, 41–56. [Google Scholar] [CrossRef]
  151. Parry, I.W.H.; Small, K. Should urban transit subsidies be reduced? Am. Econ. Rev. 2009, 99, 700–724. [Google Scholar] [CrossRef]
  152. Mao, X.; Zeng, A.; Xing, Y.; Gao, Y.; Feng, H. From concept to action: A review of research on synergistic benefits and synergistic control of greenhouse gas and local pollutant reduction. Clim. Chang. Res. 2021, 17, 255–267. [Google Scholar]
  153. Chen, Z.; Li, B.; Jia, S. Dynamic evaluation of environmental-economic performance of vehicle emission reduction policy from the perspective of the loss aversion effect. Sustain. Cities Soc. 2022, 85, 104080. [Google Scholar] [CrossRef]
  154. Zheng, Y.; Moody, J.; Wang, S.; Zhao, J. Measuring policy leakage of Beijing’s car ownership restriction. Transp. Res. Part A Policy Pract. 2021, 148, 223–236. [Google Scholar] [CrossRef]
  155. Luna, T.F.; Uriona-Maldonado, M.; Silva, M.E.; Vaz, C.R. The influence of e-carsharing schemes on electric vehicle adoption and carbon emissions: An emerging economy study. Transp. Res. Part D Transp. Environ. 2020, 79, 102226. [Google Scholar] [CrossRef]
  156. Kong, D.; Xia, Q.; Xue, Y.; Zhao, X. Effects of multi policies on electric vehicle diffusion under subsidy policy abolishment in China: A multi-actor perspective. Appl. Energy 2020, 266, 114887. [Google Scholar] [CrossRef]
  157. Kaltenhuser, B.; Werdich, K.; Dandl, F.; Bogenberger, K. Market development of autonomous driving in Germany. Transp. Res. Part A Policy Pract. 2020, 132, 882–910. [Google Scholar] [CrossRef]
  158. Zhao, J. Incentive mechanisms and ways to achieve carbon emission reduction in mega-cities transportation. Ecol. Econ. 2021, 37, 34–39. [Google Scholar]
  159. Yang, X.; Lin, W.; Gong, R.; Zhu, M.; Springer, C. Transport decarbonization in big cities: An integrated environmental co-benefit analysis of vehicles purchases quota-limit and new energy vehicles promotion policy in Beijing. Sustain. Cities Soc. 2021, 71, 102976. [Google Scholar] [CrossRef]
  160. Osorio, C.; Nanduri, K. Urban transportation emissions mitigation: Coupling high-resolution vehicular emissions and traffic models for traffic signal optimization. Transp. Res. Part B Methodol. 2015, 81, 520–538. [Google Scholar] [CrossRef]
  161. Gupta, M.; Bandyopadhyay, K.R.; Singh, S.K. Measuring effectiveness of carbon tax on Indian road passenger transport: A system dynamics approach. Energy Econ. 2019, 81, 341–354. [Google Scholar] [CrossRef]
  162. İrfan, B.; Islam, S.B.; Muammer, K. Impact assessment of supply-side and demand-side policies on energy consumption and CO2 emissions from urban passenger transportation: The case of Istanbul. J. Clean. Prod. 2019, 219, 391–410. [Google Scholar]
  163. Chai, Q.; Xu, H. A study on the pathway of achieving China’s peak carbon emission target based on IAMC model. China Popul. Resour. Environ. 2015, 25, 37–46. [Google Scholar]
  164. Wen, L.; Bai, L. System dynamics modeling and policy simulation for urban traffic: A case study in Beijing. Environ. Model. Assess. 2017, 22, 363–378. [Google Scholar] [CrossRef]
  165. Arioli, M.; Fulton, L.; Lah, O. Transportation strategies for a 1.5 °C world: A comparison of four countries. Transp. Res. Part D Transp. Environ. 2020, 87, 102526. [Google Scholar] [CrossRef]
  166. Du, L.; Li, X.; Zhao, H.; Ma, W.; Jiang, P. System dynamic modeling of urban carbon emissions based on the regional National Economy and Social Development Plan: A case study of Shanghai city. J. Clean. Prod. 2017, 172, 1501–1513. [Google Scholar] [CrossRef]
  167. Li, D.; Huang, G.; Zhu, S.; Chen, L.; Wang, J. How to peak carbon emissions of provincial construction industry? Scenario analysis of Jiangsu Province. Renew. Sustain. Energy Rev. 2021, 144, 110953. [Google Scholar] [CrossRef]
  168. Liu, X.; Ou, J.; Chen, Y.; Wang, S.; Li, X.; Jiao, L.; Liu, Y. Scenario simulation of urban energy-related CO2 emissions by coupling the socioeconomic factors and spatial structures. Appl. Energy 2019, 238, 1163–1178. [Google Scholar] [CrossRef]
  169. Benvenutti, L.M.; Uriona, M.M.; Campos, L. The impact of CO2 mitigation policies on light vehicle fleet in Brazil. Energy Policy 2019, 126, 370–379. [Google Scholar] [CrossRef]
  170. Xu, Y.; Tian, S.; Wang, Q.; Zhang, Y.; Yuan, X.; Ma, Q.; Ma, H.; Liu, C. Optimization path design for urban travel system based on CO2-congestion-satisfaction multi-objective synergy: Case study in Suzhou, China. Sustain. Cities Soc. 2022, 81, 103863. [Google Scholar] [CrossRef]
  171. Ates, S.A. Energy efficiency and CO2 mitigation potential of the Turkish iron and steel industry using the LEAP (long-range energy alternatives planning) system. Energy 2015, 90, 417–428. [Google Scholar] [CrossRef]
  172. Talaei, A.; Ahiduzzaman, M.; Kumar, A. Assessment of long-term energy efficiency improvement and greenhouse gas emissions mitigation potentials in the chemical sector. Energy 2018, 153, 231–247. [Google Scholar] [CrossRef]
  173. Hong, S.; Chung, Y.; Kim, J.; Chun, D. Analysis on the level of contribution to the national greenhouse gas reduction target in Korean transportation sector using LEAP model. Renew. Sustain. Energy Rev. 2016, 60, 549–559. [Google Scholar] [CrossRef]
  174. Mirjat, N.H.; Uqaili, M.A.; Harijan, K.; Das Walasai, G.; Mondal, M.A.H.; Sahin, H. Long-term electricity demand forecast and supply side scenarios for Pakistan (2015–2050): A LEAP model application for policy analysis. Energy 2018, 165, 512–526. [Google Scholar] [CrossRef]
  175. Subramanyam, V.; Ahiduzzaman, M.; Kumar, A. Greenhouse gas emissions mitigation potential in the commercial and institutional sector. Energy Build. 2017, 140, 295–304. [Google Scholar] [CrossRef]
  176. Wesseh, P.K., Jr.; Lin, B. Output and substitution elasticities of energy and implications for renewable energy expansion in the ECOWAS region. Energy Policy 2016, 89, 125–137. [Google Scholar] [CrossRef]
  177. Yang, D.; Liu, D.; Huang, A.; Lin, J.; Xu, L. Critical transformation pathways and socio-environmental benefits of energy substitution using a LEAP scenario modeling. Renew. Sustain. Energy Rev. 2021, 135, 110116. [Google Scholar] [CrossRef]
  178. Zhang, X.; Chen, Y.; Jiang, P.; Liu, L.; Xu, X.; Xu, Y. Sectoral peak CO2 emission measurements and a long-term alternative CO2 mitigation roadmap: A case study of Yunnan, China. J. Clean. Prod. 2020, 247, 119171. [Google Scholar] [CrossRef]
  179. Hu, X.; Bao, J.; An, S.; Tang, P. A study on emission reduction strategies of urban transportation under the carbon peak. J. Transp. Syst. Eng. Inf. 2021, 21, 244–256. [Google Scholar]
  180. Pang, K.; Zhang, Q.; Ma, C.; Zhu, L.; Chen, H.; Kong, X.; Pan, F.; Yang, H. Simulation of road traffic greenhouse gas and pollutant co-reduction scenarios in Lanzhou City based on LEAP model. Environ. Sci. 2022, 43, 3386–3395. [Google Scholar]
Figure 1. Global CO2 emissions and projections by sector.
Sustainability 15 16531 g001
Figure 2. Number of papers published in journals with relevant keywords from 2008 to 2022.
Sustainability 15 16531 g002
Figure 3. The proportion of CO2 emissions from different industries in typical economies.
Sustainability 15 16531 g003
Figure 4. Partial annual CO2 emission of the transportation industry in 31 regions of China.
Sustainability 15 16531 g004
Figure 5. Contribution of carbon emissions from different factors (2005–2020).
Sustainability 15 16531 g005
Figure 6. Proportion of relevant indicators in different types of countries.
Sustainability 15 16531 g006
Figure 7. Share of carbon emission from four common modes of transportation worldwide.
Sustainability 15 16531 g007
Figure 8. Global CO2 transport emission by mode.
Sustainability 15 16531 g008
Figure 9. Frequency of various research methods in CNKI (1) and Science Direct (2).
Sustainability 15 16531 g009
Figure 10. Impact mechanisms of factors affecting green development of transport industry.
Sustainability 15 16531 g010
Figure 11. Energy-related and industrial process CO2 emission by region.
Sustainability 15 16531 g011
Figure 12. Framework of the transportation green development path.
Sustainability 15 16531 g012
Figure 13. Causal loop diagram of the transportation carbon emission system.
Sustainability 15 16531 g013
Figure 14. Stock-flow diagram of the transportation carbon emission system.
Sustainability 15 16531 g014
Figure 15. Forecast of traffic carbon emission trends under different scenarios.
Sustainability 15 16531 g015
Table 1. Evaluation index selection and quantitative methods.
VariablesExplanationQuantization MethodReferences
Carbon emission efficiencyIt is pointed out that all factors affecting carbon emission and transport turnover are factors affecting the measurement results of carbon emission efficiency.The influence of technology and industrial structure is determined by the ratio method and the split method.e.g., [19,20,21,26,27]
Green total factor productivityConsidering the economic benefit and environmental impact of the development of the transport industry, the input, expected output, and undesirable output (CO2) indicators are used to achieve a more scientific measurement.1. Parameter estimation: eliminating the SFA measurement method of management inefficiency.
2. Static estimation: DEA model which can effectively avoid model errors; SBM and super-SBM models for solving factor relaxation problems.
3. Dynamic estimation: Malmquist index analysis method; Malmquist–Luenberger index analysis; MFMI analysis method.
e.g., [22,23,24]
Environmental efficiencyIn order to increase the accuracy of the negative externality impact analysis in the development of the transportation industry, we expand the selection range of undesirable output indicators (e.g., SO2).e.g., [17,25,28,29]
Table 4. Research on influencing factors of green development of transport industry.
TypeVariablesRelevant Research
Scale effectPopulation sizee.g., [58,63,64,71]
GDP per capitae.g., [65,74,87,88]
Passenger/freight turnovere.g., [68,89,90]
Structural effectPrivate car ownershipe.g., [60,61,71,91]
Sharing rate of public transporte.g., [84,92,93,94]
Energy consumption structuree.g., [66,73,77,95]
Technical effectEnergy intensitye.g., [78,80,96]
Emission factore.g., [75,76,77,79]
Energy rebound effecte.g., [81,82,83,84]
External constraintEnvironmental governance/protection policye.g., [85,86,97,98]
Table 5. Typical national measures to promote green development in the transportation industry.
ObjectivesFormulate a Strategic Plan for Green and Low-Carbon TransportationPromote New Energy and Clean Energy VehiclesOptimize Transportation StructureAdvocate Green Travel
Country
USA“The Transportation Security Act”, “Clean Air Act”, “Multimodal Transportation Act”, etc.Introducing “The Energy Policy Act” provided a $3400 tax credit for new hybrid light-duty vehiclesEstablishing multimodal transportation development policiesCharging high parking fees
EU“The Directive on the Establishment of General Guidelines for Multimodal Transport between EU Member States”, “The Sustainable and Intelligent Transport Strategy”, etc.Making full use of digital technologies to make travel and mobility smarter, more efficient, and more environmentally friendlyLaunch of “the Marco Polo program”, with financial subsidies and tax breaksIncrease in fuel tax rates
Germany“The National Bicycle Transportation Plan”, “The Urban Transportation Finance Act”, “The Structural Strengthening Act”, etc.Raising vehicle emission standards; allowing new energy vehicles to use bus lanesImplementing an innovative combination of classic overhead lines and train-driven energy alternatives; redefining electrification ratesEstablishing restrictive policies for car use
UK“Decarbonizing Transport, A Better, Greener Britain”, “The Green Industrial Revolution”, etc.Increasing the cost of car ownership and use; improving electric vehicle infrastructure; charging for excess emissionsGreater investment in green transport, such as bicycle riding and eco-busesDesignating congestion charging areas and levy vehicle taxes
China“The 14th Five-Year Plan for Green Transportation”, “The Green Transportation Standard System”, etc.Adopting a time regression mechanism and increase government subsidies for new energy vehicles, such as subsidies and free parkingImproving the operational efficiency and service level of public transportation, such as buses, subway, and light railAdopting some traffic restriction policies; charging congestion fees; environmental protection publicity and education training
Table 6. Scenario setting for the development of transportation industry.
Scenario HypothesisScale EffectStructural EffectTechnical EffectPolicy Constraint
Proportion of Industrial Investment ScaleEnergy IntensityEnergy StructureScience and Technology Investment IntensityEnvironmental Regulation
BaselineMediumMediumMediumMediumMedium
Low carbonStructural optimizationHighMediumMediumMediumMedium
Technological progressMediumMediumMediumHighMedium
Environmental policy constraintMediumLowLowMediumHigh
Coordinated development of economy and environmentHighLowLowHighHigh
High carbonHighHighHighHighHigh
Disclaimer/Publisher’s Note: The statements, opinions and data contained in all publications are solely those of the individual author(s) and contributor(s) and not of MDPI and/or the editor(s). MDPI and/or the editor(s) disclaim responsibility for any injury to people or property resulting from any ideas, methods, instructions or products referred to in the content.