Article

Study on Microclimate and Thermal Comfort in Small Urban Green Spaces in Tokyo, Japan—A Case Study of Chuo Ward

1
Graduate School of Horticulture, Chiba University, Matsudo 271-8510, Japan
2
School of Landscape Architecture, Beijing Forestry University, Beijing 100083, China
*
Author to whom correspondence should be addressed.
Sustainability 2023, 15(24), 16555; https://doi.org/10.3390/su152416555
Submission received: 29 October 2023 / Revised: 28 November 2023 / Accepted: 4 December 2023 / Published: 5 December 2023

Abstract

:
Small urban green spaces are abundant in densely populated urban areas, but little is known about their impact on the urban heat island effect and thermal comfort. Therefore, this study selected as research sites four small urban green spaces in a typical high-density built-up area, Chuo Ward in Tokyo, Japan. The ENVI-met software 5.1.1 simulation method was used to analyze these sites’ microclimate and thermal comfort conditions. The following are the results: (1) Small urban green spaces significantly reduce urban air temperatures, particularly during hot weather, with temperature reductions ranging from 2.40 °C to 2.67 °C, consistently lower than the highest temperatures in Tokyo’s Chuo Ward, mainly between 1:00 and 2:00 p.m. (2) Thermal comfort analysis indicates that small urban green spaces can significantly improve urban thermal comfort during the day, particularly around noon, by reducing one or two thermal comfort levels compared to typical urban street blocks. However, these differences gradually diminish throughout the evening and night, and thermal comfort inside and outside green spaces becomes more uniform. (3) Green space size is not the only factor influencing thermal comfort; the layout of plants within the green space and the layout of the surrounding buildings also have an impact. Despite their small size, even small green spaces can significantly enhance comfort. This study highlights the need to promote urban sustainability through the extensive integration of small green spaces in dense urban environments. Small green spaces can serve as a high-frequency, low-cost solution for environmental sustainability by addressing the increasingly severe urban heat island effect as well as environmental challenges that in the urbanization process.

1. Introduction

There has been a significant global trend toward increasing urbanization over the past few decades. The rate of urbanization is accelerating due to industrialization and economic development [1]. It is anticipated that by 2030, 60% of the global population will reside in cities, and by 2050, this proportion will increase to 70% [2,3]. As urbanization increases, cities’ sustainable development faces numerous new challenges, the urban heat island (UHI) effect being one of the most prominent.
The UHI effect occurs when urban temperatures are significantly higher than suburban and rural temperatures [4]. This effect causes urban areas to have higher temperatures than their immediate surroundings. Urbanization and human activities are closely related to UHI effect formation [4,5]. During urbanization, a significant amount of vegetation is cleared, and the land is covered with concrete, asphalt, and buildings, dramatically changing land cover types. It makes cities more prone to absorbing and storing solar radiation heat [6,7]. Additionally, high-density urban development creates artificial canyon effects that restrict airflow and heat dissipation, trapping heat within cities [8]. Extreme heat can also intensify the UHI effect [9].
The UHI effect has numerous detrimental effects on urban life and the natural environment. The heat discomfort of urban residents is exacerbated by high temperatures and unfavorable humidity levels, which harms their living comfort and health [10,11]. Alongside this, urban energy consumption intensifies, adversely affecting air quality [12].
Numerous studies on urban thermal comfort and microclimates have been conducted in response to the effects of the UHI effect and to enhance urban sustainability. Microclimate refers to the climatic variations between different areas or small-scale regions within a city, including temperature, humidity, wind speed, and sunlight. Various factors, including building morphology, street layout, greenery, and water features, influence microclimates in urban environments [13]. Regarding building morphology, Gukhwa Jang et al. [14] investigated the impact of varying building heights on microclimates using a high-density riverside residential area in Seoul, South Korea as an example. They found that restricting building height could have a negative effect on microclimates, whereas a stepped building height design did not influence thermal comfort. Regarding spatial layout, Yuanyuan Li et al. [15] surveyed typical residential area layouts in Beijing and employed simulation software to study their influence on thermal environments. Among the various residential area types in Beijing, their findings indicated that enclosed residential layouts were the most optimal. Taking a broader perspective at the neighborhood level, Haifang Tang et al. [16] explored the impact of different green space layout patterns on central China’s microclimates. Their research revealed that different green space layout modes had distinct advantages and disadvantages under varying seasons and circumstances. Concerning plant greening, Huizhe Liu et al. [17] studied the impact of tree morphology and planting density on outdoor thermal comfort in Singapore’s tropical residential areas. They observed that umbrella-shaped and cuboidal tree forms had the most pronounced effect on outdoor thermal comfort and that there was a positive correlation between tree planting density and thermal comfort. Yingnan Li et al. [18] related vegetation cover to building height and found that the benefits of trees for human thermal comfort were more evident in relatively low-rise residential communities. In contrast, trees had difficulty alleviating heat discomfort in high-rise residential areas. Regarding water bodies, Xuefan Zhou et al. [19] examined the influence of a large-scale urban water network on urban microclimates and air quality using Wuhan City as an example. According to their findings, central urban water bodies significantly increased the nighttime wind speed in the city center. In high-temperature conditions, urban inland water bodies impeded air pollutants’ dispersion and mitigated the UHI effect.
Previous studies have focused on specific landscape elements such as plant morphology, water bodies, and building types, typically abstracting and refining the study objects related to landscape elements before further investigation [20]. In this process, there is a risk of oversimplification in physical space refinement and scenario construction, which can lead to idealized models and consequently affect the accuracy of simulation results [21,22,23]. Future research should seek to improve spatial analysis precision. Additionally, previous research perspectives have focused primarily on the city scale, extending to the neighborhood and concentrated residential area scales, with limited investigation into microclimates in smaller-scale urban spaces.
Tokyo is a highly developed, densely populated, and urbanized city, making the UHI effect particularly pronounced [24]. Green spaces are crucial for the city, and despite the presence of large parks and squares in Tokyo, such as Ueno Park, Shinjuku Gyoen, Yoyogi Park, Meiji Shrine Outer Gardens, the Imperial Palace, and its surrounding green areas, the available green space and projected future availability are limited due to the land scarcity in this highly urbanized area [24,25,26]. Therefore, Tokyo has planned many small parks and green spaces, commonly known as pocket parks or mini-parks, which are typically situated between buildings, along streets, or in communities. These small green spaces provide urban residents with valuable outdoor space [27]. Numerous studies have been conducted on the microclimates of developed Asian cities such as Beijing and Shanghai in China, Singapore, and Seoul. However, research on the microclimate of Tokyo, a highly developed urban area, is not comprehensive, and there is a significant knowledge gap regarding how these numerous small green spaces affect the city’s microclimate. Additionally, Japan is an island nation, and the climate of the Tokyo metropolitan area differs from that of other Asian cities. Consequently, the urban microclimate characteristics in this region are also unique [28]. Therefore, studies on the urban microclimate in this area hold particular significance. Investigating the microclimates of Tokyo’s existing small green spaces will supplement existing research and aid in understanding the impact of microclimate changes in Tokyo on addressing the UHI effect and improving urban comfort. This provides an important reference for future urban planning and green space design, contributing to the advancement of urban sustainability.
Therefore, this study selects typical small green spaces in Tokyo and conducts a more granular microclimate analysis. Using ENVI-met microclimate simulation software to generate microclimate distribution maps, this study focuses on extreme summer weather conditions. Concurrently, onsite measurements of meteorological parameters within the parks are conducted to validate the accuracy of the simulation results. Based on reliable simulation results, further analysis is used to quantify the impact of small green spaces on urban thermal comfort. This study’s results contribute to an understanding of the spatial distribution and variation of microclimates in typical small green spaces in Tokyo, as well as the effectiveness of these spaces in mitigating the UHI effect, thereby potentially enhancing urban comfort and sustainability in addressing global warming and climate change in the future.

2. Materials and Methods
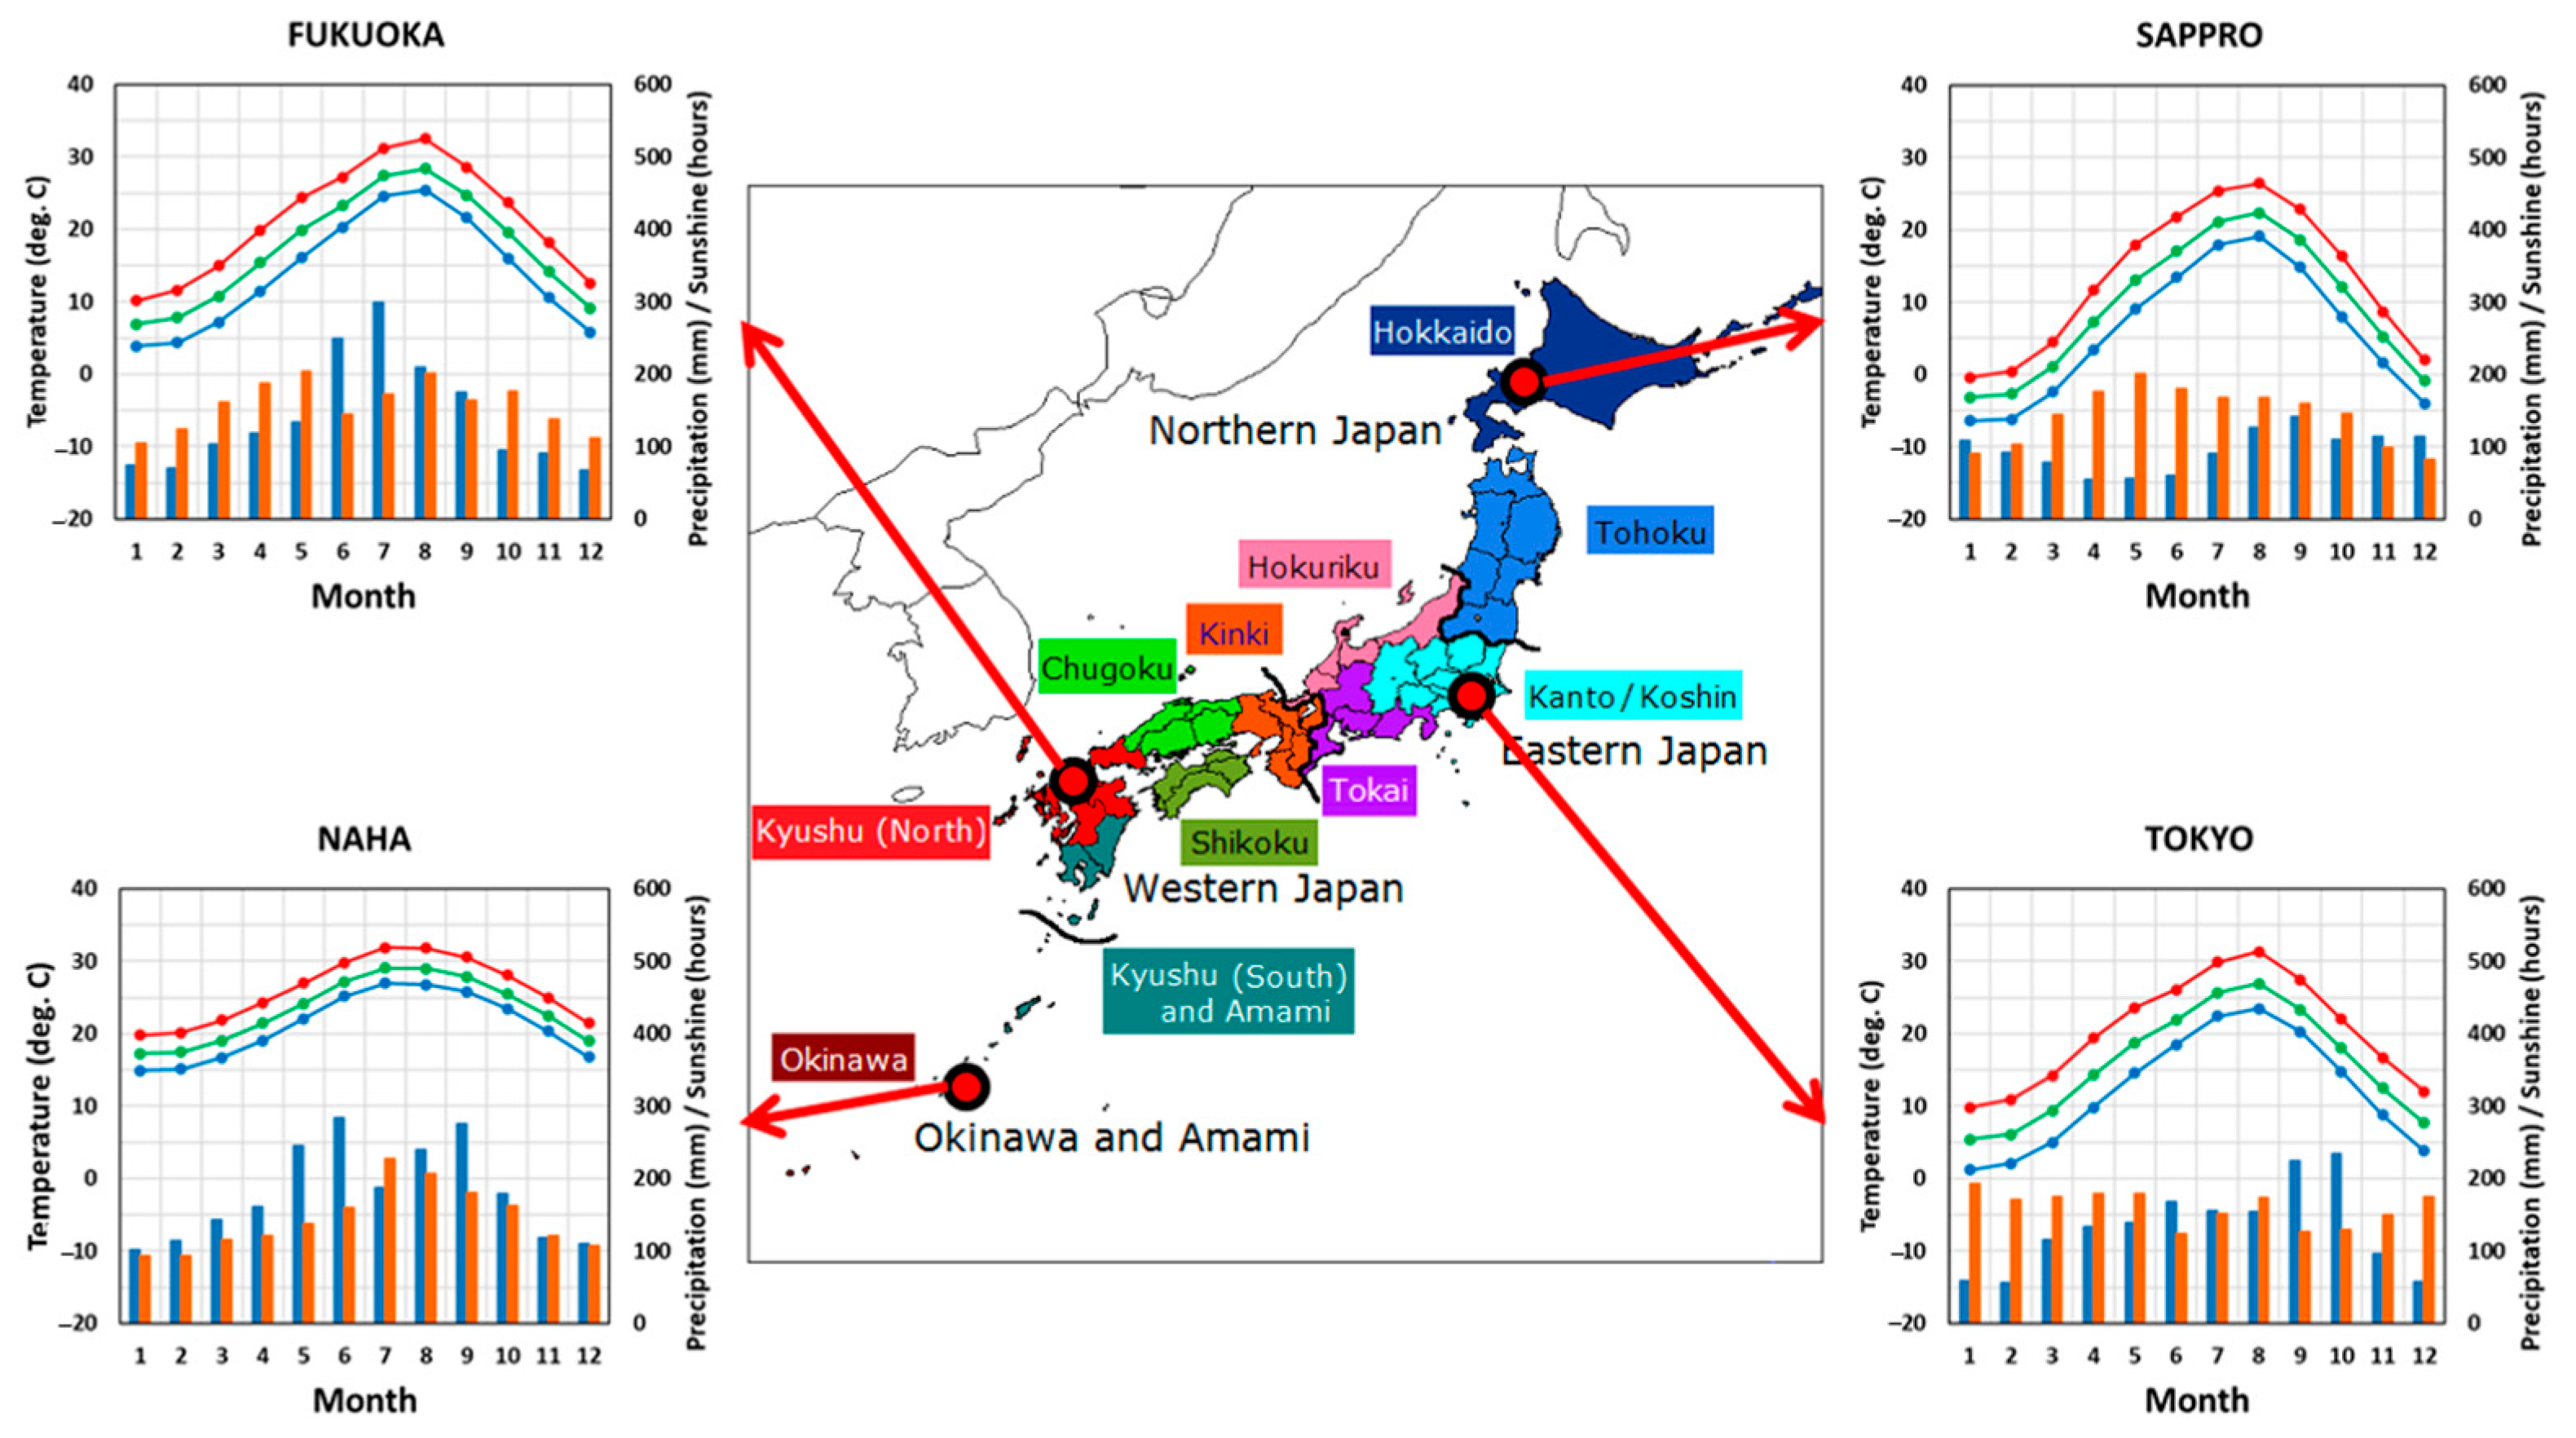
2.1. Study Site

Tokyo is the capital of Japan and is located in the Kanto region. It is one of the most important cities of the world in Asia. As of April 2022, Tokyo has a highly concentrated population of 13.99 million people, and the Greater Tokyo Area, also known as the capital region, has a population of approximately 38 million, making it the most populous metropolitan area in the world [29]. The climate of Tokyo and the Kanto region is predominantly maritime and subtropical monsoon. According to data from the Japan Meteorological Agency, Japan’s early summer rainy season, known as “Baiu”, typically occurs from late June to mid-July. This rainy season is created when warm tropical maritime air masses collide with cooler polar maritime air masses. In the latter half of summer, from mid-July to August, the North Pacific high-pressure system extends northwestward. It encircles Japan, leading to hot, sunny weather with temperatures occasionally exceeding 35 °C (Figure 1). Research indicates that in Tokyo, the capital of Japan, the average temperature has increased by 3 °C compared to the previous century. This temperature increase due to the UHI effect is significantly greater than the estimated 0.74 °C temperature increase due to global warming [30,31].
The Chuo Ward (35°40′14″ N 139°46′19″ E) is at the center of Tokyo’s 23 wards. It has an area of 3.94 square miles, making it the second-smallest of Tokyo’s 23 special wards after Taito Ward. Despite its small size, this ward has a substantial population, with 169,471 residents and a population density of 43,013 people per square mile (1 June 2020). This district is the geographic center of Tokyo’s 23 wards and the epicenter of Japan’s economy, information technology, and commerce, among other things. In the 1950s, as Japan’s economy expanded rapidly, the central district’s commercial functions developed rapidly, forming a highly concentrated central business district (CBD) [32]. It has a thriving commercial sector, dense high-rise buildings, and predominantly collective housing complexes such as high-rise apartments and residential complexes, with relatively fewer detached low-rise residences or low-rise rental apartments. Except for the relatively large Hama-rikyu Gardens, most urban green spaces in this region are small and dispersed.
Globally, urban green spaces measuring approximately 1 hectare or less are typically called pocket parks or mini-parks [33]. Therefore, this ward’s small green spaces with an area of less than 1 hectare were divided into four size categories: 0.1 hectares, 0.3 hectares, 0.6 hectares, and 10,000 m2. The research concentrated on objects with areas as close as possible to the size category criteria to ensure the representativeness and universality of the selected objects’ microclimates. Objects containing large, distinctive structures, as well as those located near large bodies of water or in external conditions such as ventilation corridors, were also excluded. Under these criteria, four small green spaces in the central district were selected for this study: “Fukutoku Garden” (FT-01, appr. 1000 m2), “Teppozu Park” (TPZ-02, appr. 2964 m2), “Kakigaracho Park” (KGC-03, appr. 6324 m2), and “Akatsuki Park” (AKTK-04, appr. 11,174 m2). Figure 2 depicts the locations and detailed information for each of these objects.

2.2. Research Methods

The entire research procedure (Figure 3) consists of four main components: measurement spots and meteorological data collection, ENVI-met simulation, validation of simulation results, and environmental thermal comfort assessment. The following sections elaborate on each component’s specific contents.

2.2.1. Measurement Spots and Meteorological Data Collection

Within the four study sites, measurement spots were installed (Figure 2). The smaller FT-01 and TPZ-02 each had one measurement spot, while the larger KGC-03 and AKTK-04 each had two. We recorded experimental data every hour from 9:00 a.m. to 8:00 p.m. on 29 July 2023, including temperature, relative humidity, and wind speed. Data were re-corded thrice to ensure accuracy. The handheld weather station Kestrel 5500 was used to collect meteorological data in real time, as it is widely used and renowned for its reliability [13,16]. Before each observation, the equipment was calibrated, and the observation height above the ground was maintained at 1.5 m. During observations, instruments were shielded from direct sunlight. These actual measurement data were used to validate ENVI-met simulation results.

2.2.2. ENVI-Met Simulation

In this study, ENVI-met 5.1.1 was used for microclimate simulation. ENVI-met is a high-resolution 3D modeling microclimate simulation software with a resolution range of 0.5 to 10 m that enables a precise simulation of complex microclimate processes. It has the ability to simulate the main interactions of the atmosphere based on physical laws, such as fluid dynamics and thermodynamics. It provides detailed insights into the impact of environmental factors on urban climate and is widely used for microclimate assessments of buildings or outdoor spaces in various global regions [34,35,36,37]. The Spaces module was utilized to create three-dimensional models of the target areas. Due to variations in horizontal and vertical scales across the four study sites, the initial grid counts and resolutions differed slightly. All vertical grids were adjusted so the simulated space exceeded twice the height of the building models. In order to ensure simulation stability, five nesting grids were added horizontally from each boundary of the existing model space. Additionally, to minimize the impact of grid-jagged edges on simulation results during modeling and ensure alignment with real-world geographic coordinates, each model’s orientation was adjusted with respect to the north direction as the reference. Table 1 displays the grid configuration parameters for the four models.
This study’s modeling components include terrain, soil and substrate, buildings, walls, and vegetation. In order to improve the microclimate simulation’s accuracy and realism, the surrounding blocks and buildings near the small green spaces were also modeled. Building and land use GIS data were sourced from the Tokyo Metropolitan Government Urban Development Bureau (https://www.toshiseibi.metro.tokyo.lg.jp/ accessed on 10 June 2023) and validated and corrected using Google 3D maps and field surveys (Figure 4). A building group or a block is expanded as the simulation boundary range centered on a small green space, which is often used for microclimate in small green space or block-scale green space [1,16,22,27].
Both the Albero module and the DB Manager module from ENVI-met were used for the vegetation component. Grass and shrubs were modeled using DB Manager’s Simple Plants feature. For tree modeling, the Albero module for 3D plant modeling was employed. This is because trees have a more complex structure compared to grass and shrubs, and the Albero module can construct more accurate tree models, making the experimental results more reliable. This module’s existing plant model library contained materials distinct from those in the study area. Therefore, plant models were reconstructed based on observations made onsite. Tree height, crown width, foliage shortwave albedo, and foliage shortwave transmittance were modified (Table 2). The leaf model, the fundamental unit of tree composition, had a leaf area density (LAD) ranging from 0.7 to 2 m2/m3.
Regarding the initial meteorological parameter settings, each of the four study sites is located in the Chuo Ward of Tokyo; consequently, the initial meteorological data are the same for all four sites. Chuo Ward is the location of the meteorological data, which were obtained from the Japan Ministry of Land, Infrastructure, Transport, and Tourism (https://www.jma.go.jp/jma/index.html accessed on 4 August 2023). The simulation ran from 8:00 a.m. to 8:00 p.m. on 29 July 2023, representing a typical hot and sunny summer day. The simulation duration was 12 h to guarantee stability (Table 3).

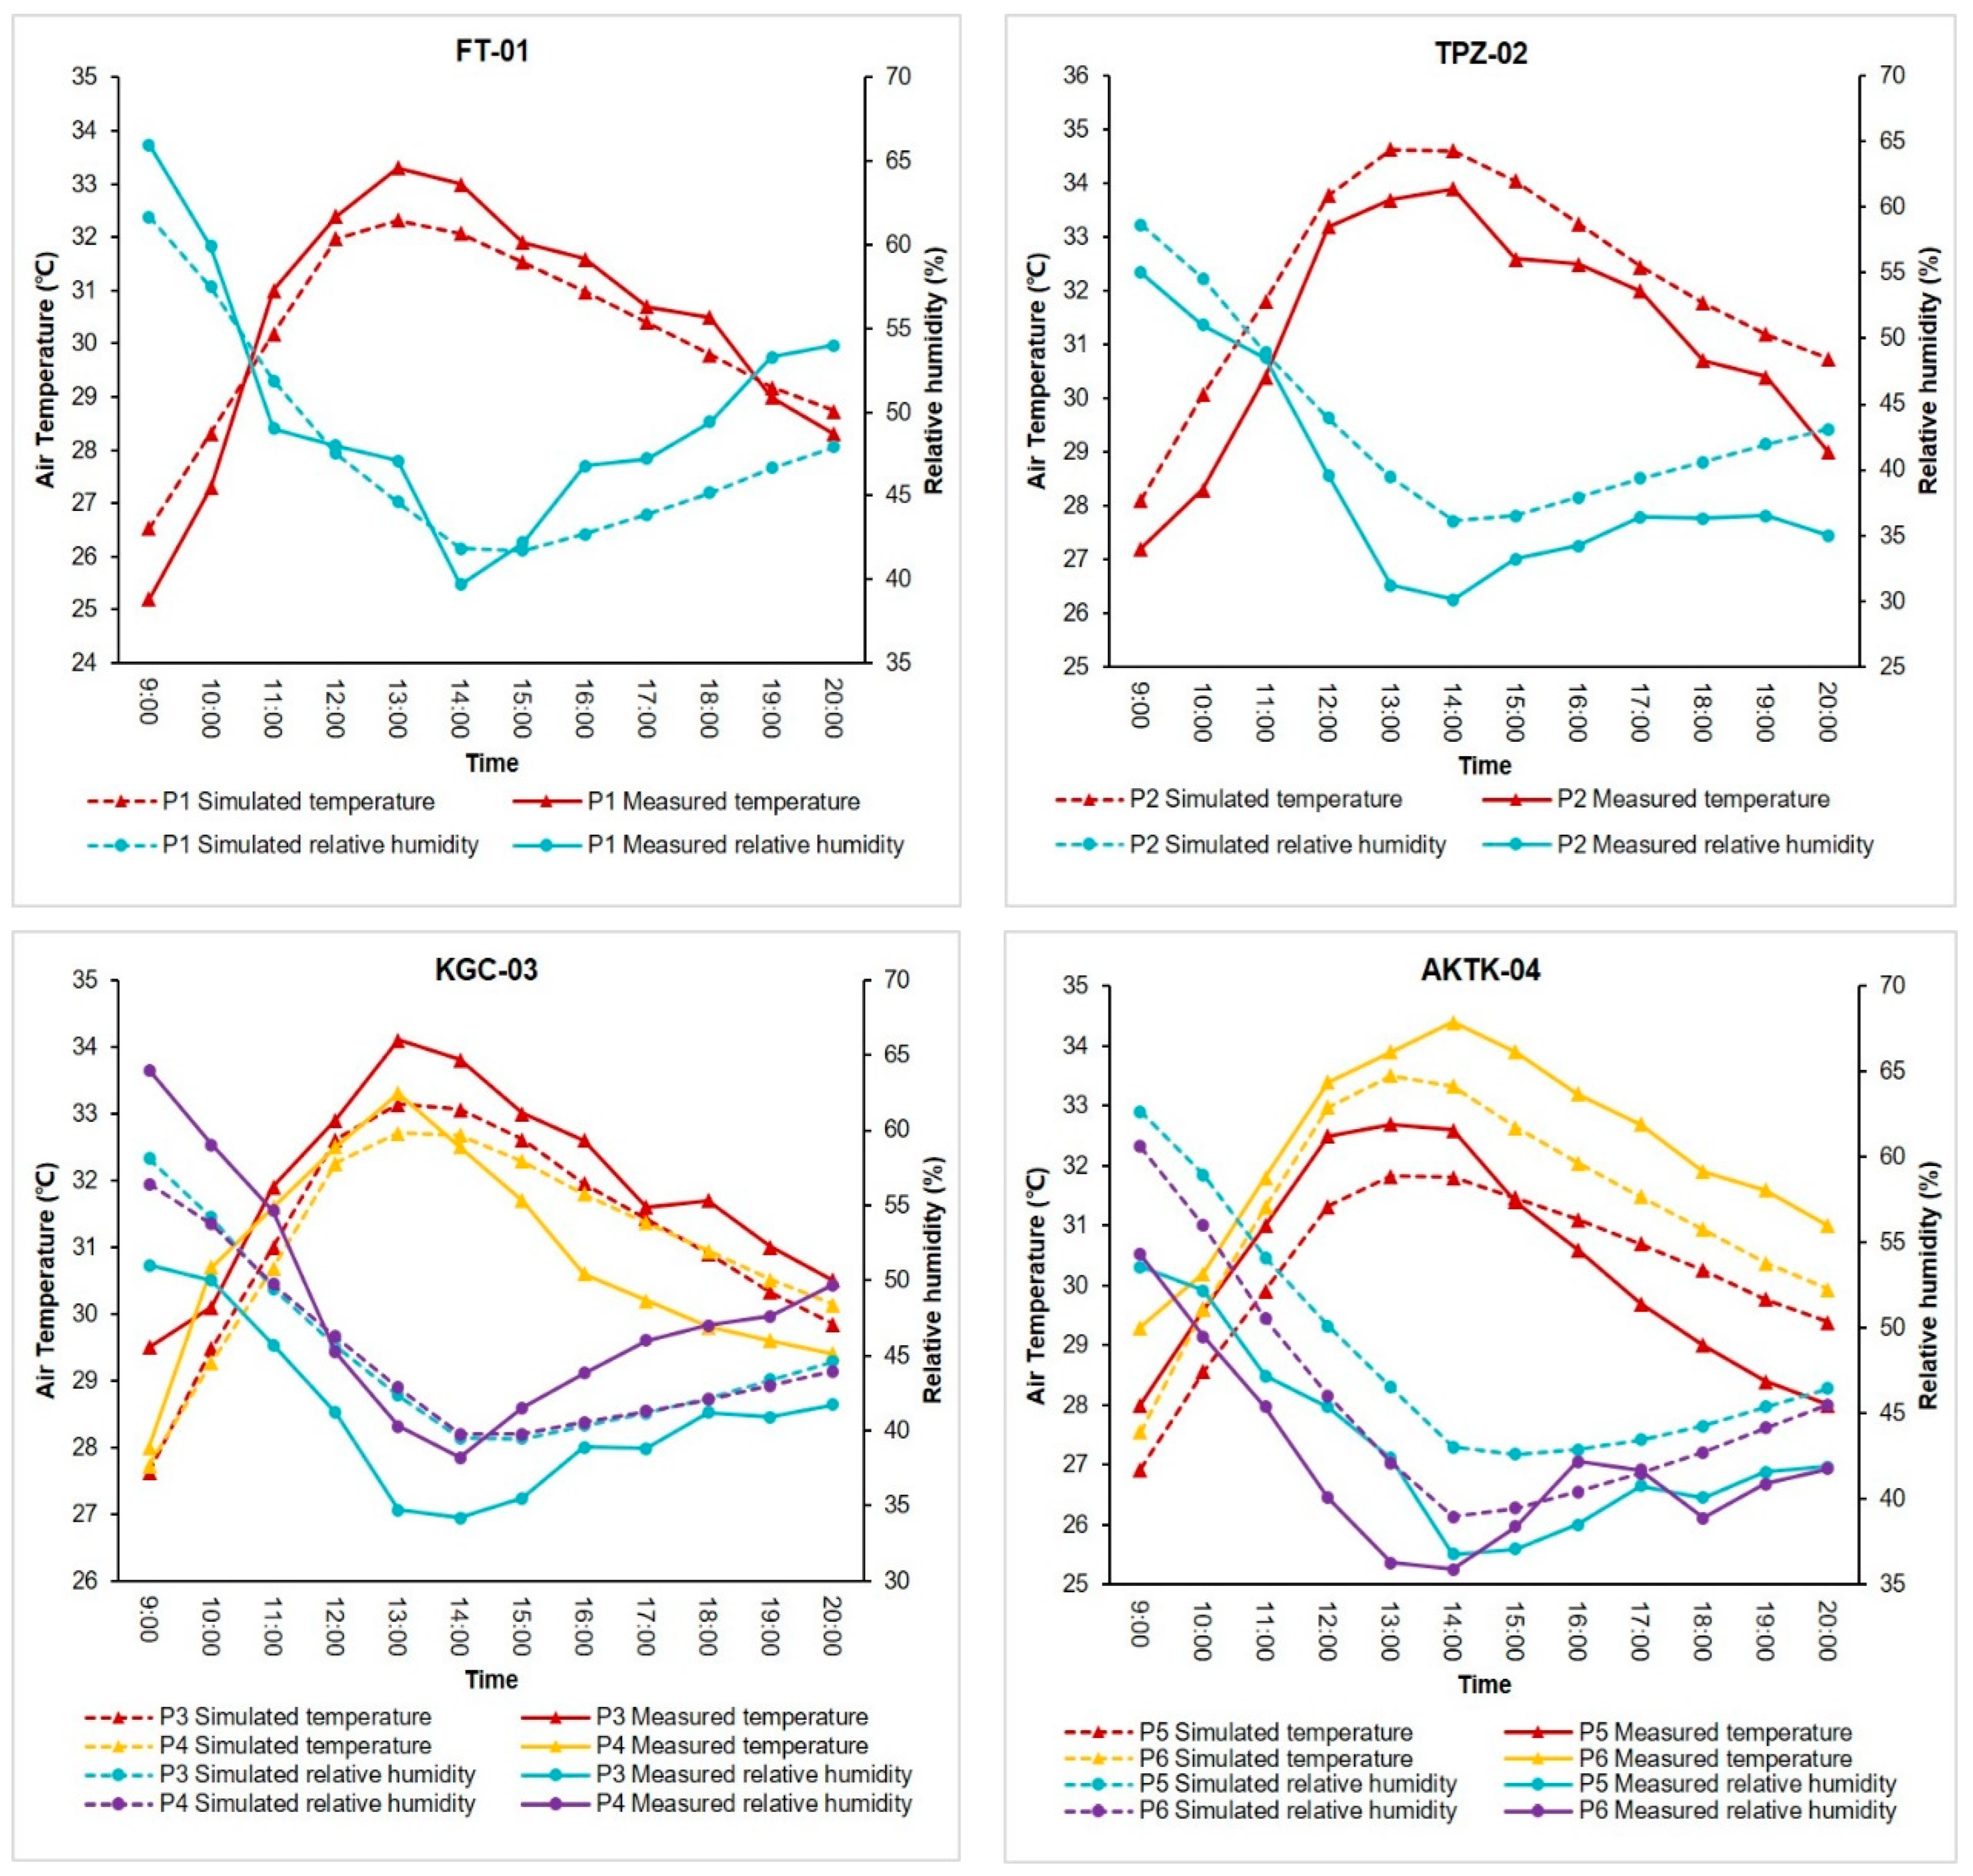
2.2.3. Validation of Simulation

The reliability of ENVI-met simulations was verified by comparing temperature and relative humidity data collected onsite with the corresponding simulation data at specific locations. In this study, the differences between measured and simulated values were represented by root mean square error (RMSE) and mean absolute error (MAE). An absolute error is the absolute difference between the predicted and actual values. It measures the average magnitude of errors across a set of predictions without considering their direction. RMSE is a frequently used measure of the difference between the values predicted by a model and the actual values observed in the modeled environment. These individual differences are also called residuals, and RMSE aggregates them into a single measure of predictive power. It measures how much error there is between two datasets. The lower the RMSE value, the more reliable the simulation. According to Willmott, both MAE and RMSE have limitations because they do not reflect the relative magnitude of average errors [38]. Therefore, this study also employed the agreement index “d”, proposed by Willmott, to evaluate the simulation’s reliability. The “d” value is a standard measure of model error magnitude, representing the ratio of mean square error to potential error. It varies between 0 and 1, with 1 indicating a perfect match and 0 indicating no match. Therefore, as “d” approaches 1, it signifies a more reliable simulation.
M A E = i = 1 N P i O i N
R M S E = i = 1 N O i P i 2 N
d = 1 i = 1 N P i O i 2 i = 1 N P i + O i 2   , ( 0 d 1 )
P i = P i O ¯ ,   O i = O i O ¯
P i represents the simulated value for the ith experiment, O i is the observed (measured) value for the ith experiment, O ¯ denotes the average of the observed data, and N represents the number of observations.

2.2.4. Environmental Thermal Comfort Assessment

Thermal comfort refers to the subjective sensation of outdoor temperature [39]. Under normal indoor conditions, people typically perceive comfort when their body’s heat load is in equilibrium with their core and skin temperatures [40]. The indices used to measure thermal comfort are numerous, such as standard effective temperature (SET), physiological equivalent temperature (PET), and the comfort index (CI) proposed by the Beijing Meteorological Bureau.
In this study, PET was employed as the thermal comfort indicator. It is the typical indoor air temperature at which the heat balance of the human body matches that of complex outdoor conditions, ensuring identical core and skin temperatures [40]. This metric considers fundamental meteorological conditions (temperature, relative humidity, and wind speed), metabolic rate, clothing insulation, and outdoor longwave and shortwave radiation [41]. PET is widely used for assessing thermal comfort in outdoor environments [42,43].
PET values can be categorized to determine the physiological stress levels and thermal perception corresponding to those values [44]. When PET values are within the comfort range, individuals experience a sensation of comfort, and physiological stress is minimized. PET values above the comfort range indicate an increase in the body’s heat budget, increasing thermal stress and discomfort as PET rises. When PET values fall below the comfort range, heat is lost to the environment, resulting in cold stress and discomfort [14,45].
The differentiation in PET levels varies depending on the climatic characteristics of different regions, and corresponding thermal comfort perceptions apply to different temperature ranges [46,47,48]. In this study, the BIO-met plugin in ENVI-met was used to calculate PET values for each study site, and the spatial distribution of thermal comfort was obtained to analyze its distribution characteristics. The thermal comfort model was based on a typical male of 35 years of age, 1.75 m (5.74 feet) in height, 75 kg (165.35 pounds) in weight, and a total body metabolism of 86.21 W/m2. Based on previous research, outdoor thermal comfort in the Kanto region of Japan is divided into nine levels (Table 4), and the same classification standards were adopted in this study [49].

3. Results

3.1. Model Validation Results

The measured meteorological data at various spots were simultaneously compared to the model’s simulations, location, and height. Error calculations were performed for temperature and humidity, which were selected as two validation indicators. Figure 5 depicts the results of comparing measured and simulated data, while Table 5 details the simulation’s reliability. The RMSE values for temperature at all measurement spots range from 0.83 to 1.13, whereas the MAE values range from 0.73 to 1.05. The RMSE values for relative humidity at various spots range from 3.77 to 5.52, while the MAE values range from 3.29 to 5.26. It indicates that the discrepancy between the simulated results and the actual values is small, demonstrating a good fit of the model. In general, the index of agreement (d value) for temperature (0.88–0.96) is greater than the corresponding d values for humidity (0.81–0.92), indicating that temperature simulations are more accurate than humidity simulations.
Furthermore, regardless of temperature or humidity, the larger simulated areas have generally lower d values than the smaller simulated areas, indicating that the smaller simulated areas are a better fit for reality. This may be due to larger simulated regions having more modeling elements and significant differences from the actual environment. Although there are differences between the simulation and measurement results, their consistency is relatively high (d > 0.8), well above 0.6, and the error is within an acceptable range compared to previous studies [18,50]. Therefore, ENVI-met can reasonably and accurately predict the research area’s microclimate and thermal comfort conditions.

3.2. Air Temperature Analysis

To provide a more intuitive representation of the microclimate conditions of these small green spaces during hot weather, an initial statistical analysis of air temperatures for each study site model was conducted before the thermal comfort assessment (Figure 6). During the analysis, the built-up urban block areas within the study scope were temporarily disregarded, and observation was limited to the interior of the small green spaces.
The line graphs in the figure depict the calculated average air temperatures at various time intervals for all recording grids within the study’s green spaces. For the FT-01 site, the average temperature (FT-01 avg) ranged from 27.4 to 33.3 °C, while TPZ-02 avg ranged from 28.1 to 34.5 °C. KGC-03 avg exhibited a range from 27.6 to 33.1 °C, and AKTA-04 avg ranged from 27.19 to 33.0 °C. The maximum average temperatures for each site occurred between 1:00 and 2:00 p.m., and they were all below the daily peak temperature in Tokyo’s central area (35.7 °C). At the peak temperature moment, FT-01, TPZ-02, KGC-03, and AKTA-04 experienced temperature reductions of 2.40 °C, 1.17 °C, 2.57 °C, and 2.67 °C, respectively. Furthermore, the bar charts depict the highest and lowest temperatures recorded across all recording grids at various time intervals. FT-01 had a maximum temperature (FT-01maxT) of 34.39 °C, TPZ-02maxT was 34.96 °C, KGC-03maxT reached 34.27 °C, and AKTA-04maxT was 34.92 °C. Compared to the daily peak temperature, these temperatures exhibited cooling effects of 1.31 °C, 0.74 °C, 1.43 °C, and 0.78 °C, respectively.
This demonstrates that these small green spaces reduce average and extreme urban air temperatures. Second, under average temperature conditions, the cooling effect is more pronounced than under extreme temperature conditions. Hence, the cooling effect is quite significant when observing these small parks as points within the city from a macro perspective. However, when these small green spaces are viewed as areas, the temperature difference between their internal peak temperatures and the city’s highest temperature is relatively small, and the cooling effect is not as significant compared to the average temperature conditions. In addition, the temperature patterns at all study sites are nearly identical, with rapid warming in the morning, reaching its peak between 1 and 2 PM, and a slowing of cooling in the afternoon.
In addition, the four study sites vary in size, with FT-01, KGC-03, and AKTA-04 increasing in size in that order. Regarding the final average temperature, the cooling effect of FT-01, KGC-03, and AKTA-04, while increasing in order, is numerically very close. However, TPZ-02 has a significantly weaker cooling effect than the other three sites, including FT-01, which is almost three times smaller in area. This finding may be due to the TPZ-02 site’s distinct spatial layout, which features a central open area surrounded by vegetation. This leads to rapid heating in the center of the green space due to prolonged exposure to solar radiation, and the cooling effect of vegetation is diminished due to the plants’ dispersed distribution. Thus, a larger green space does not necessarily result in a greater cooling effect at the scale of small green spaces (one hectare or less). The spatial arrangement of vegetation and surrounding buildings significantly affects the site’s microclimate, and even small areas can achieve a stronger cooling effect with a better layout.

3.3. Thermal Comfort Assessment

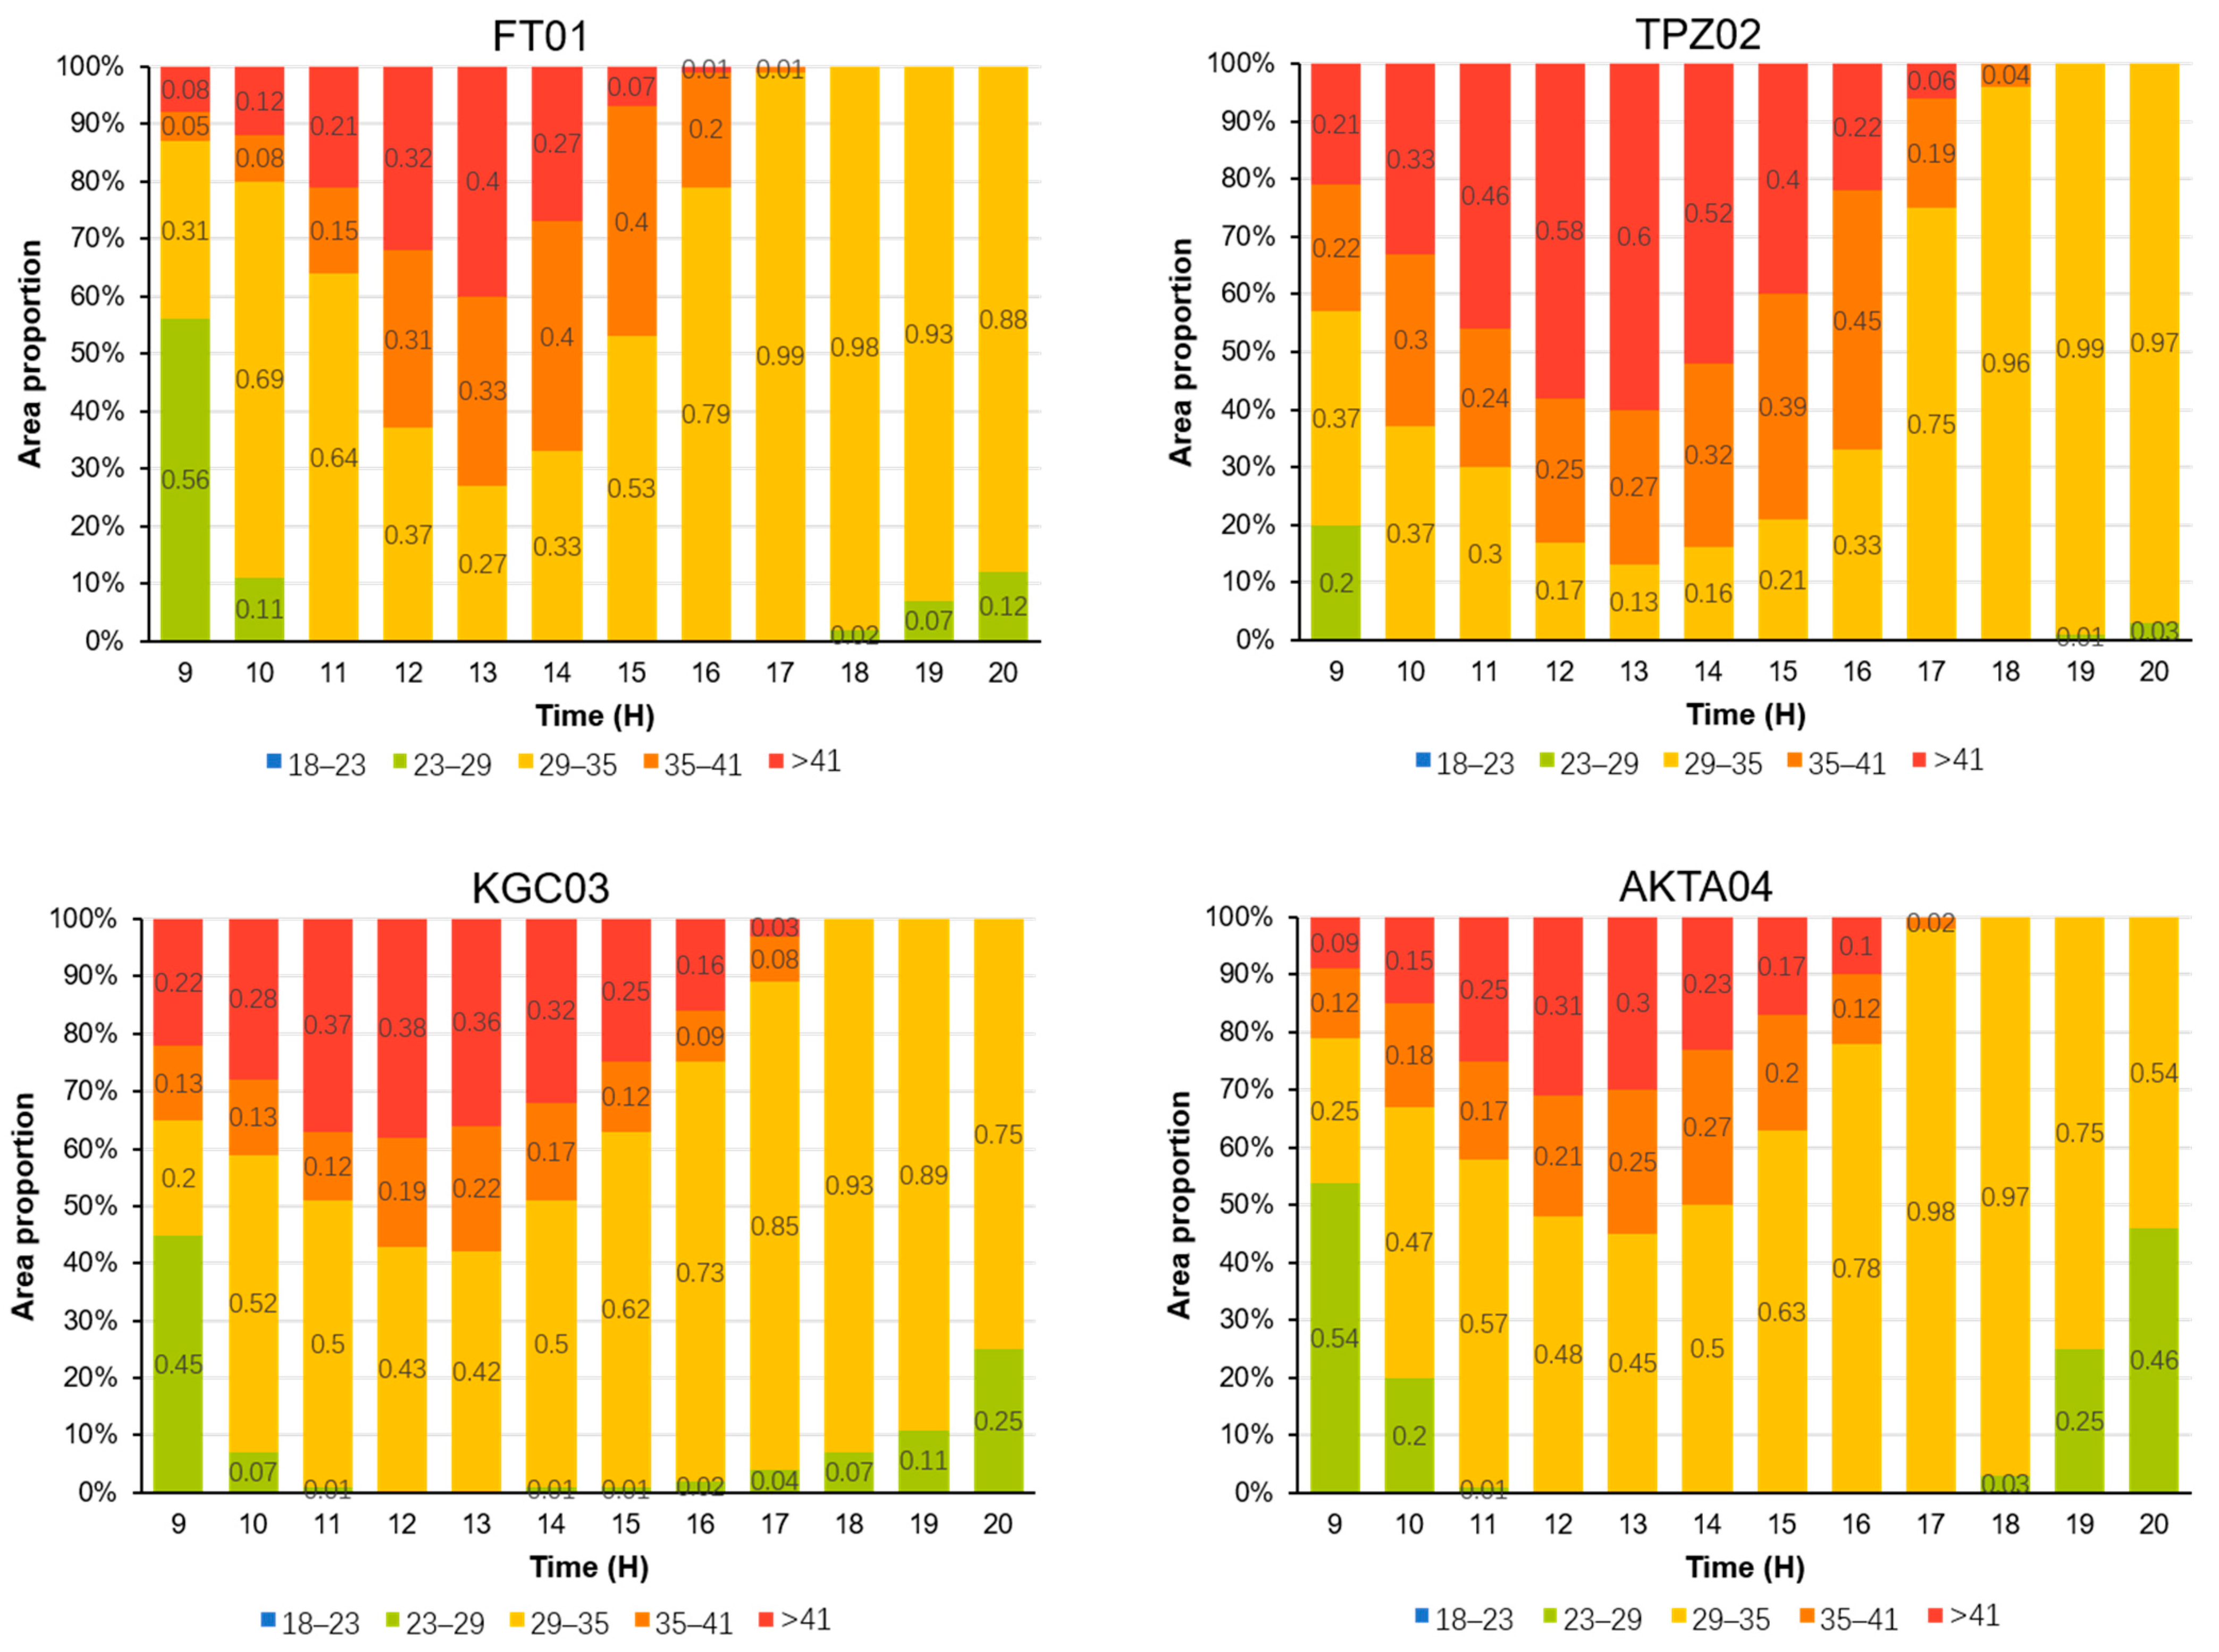
3.3.1. Thermal Comfort Assessment within the Green Spaces

Using the BIO-met plugin in ENVI-met, a physiological equivalent temperature (PET) thermal comfort simulation was conducted to analyze the characteristics and variations of thermal comfort in green spaces. Simulation data were subjected to statistical analysis to perform a comprehensive analysis. The environmental data from the urban blocks surrounding the green spaces were excluded, and only the data from the green spaces themselves were retained. Figure 7 depicts the percentage distribution of thermal comfort levels (as defined in Section 2 for Tokyo’s thermal comfort levels) at each hourly time point. Different colors in the diagram correspond to different thermal comfort levels.
During the experimental period, none of the four urban small green spaces reached the “comfortable” temperature range (18–23 °C). The level closest to “comfortable” was “slightly warm (23–29 °C)”, which occurred only in the early morning and evening over a relatively small area. Prior to 2:00 p.m., “hot” and “extremely hot” levels were prevalent in all four locations, whereas after 4:00 p.m., the majority of locations in each location dropped to the “warm” level. At approximately 1:00 p.m., widespread discomfort was observed at each location.
In addition to the standard patterns observed at each site, variations were among them. Initially, larger sites, such as KGC03 and AKTK04, demonstrated greater thermal comfort during the hottest afternoon. At 1:00 p.m., the coverage area of “hot” and “extremely hot” conditions was approximately 50–60%, with the remainder falling into the “warm” category. During the same period, smaller sites like FT01 and TPZ02 exhibited less thermal comfort. At 1:00 p.m., both locations had over 70% coverage of “hot” and “extremely hot” conditions, with TPZ02 reaching 87%.
This indicates that, at the scale of small green spaces, the size of the green space still affects thermal comfort, particularly during periods of low thermal comfort, such as midday. In this case, larger sites have more space to accommodate more trees and vegetation, allowing for the formation of larger clusters of vegetation, which can improve thermal comfort. In addition, we observed that TPZ02, which has a larger area and more vegetation than FT01, performed worse in terms of thermal comfort. Before 4:00 p.m., a sizeable portion of TPZ02 was in “hot” and higher levels. This suggests that the size of the green space is not the only determinant of thermal comfort; the spatial arrangement of vegetation within the site and the arrangement of buildings in the surrounding urban blocks also influence the thermal comfort of the site.

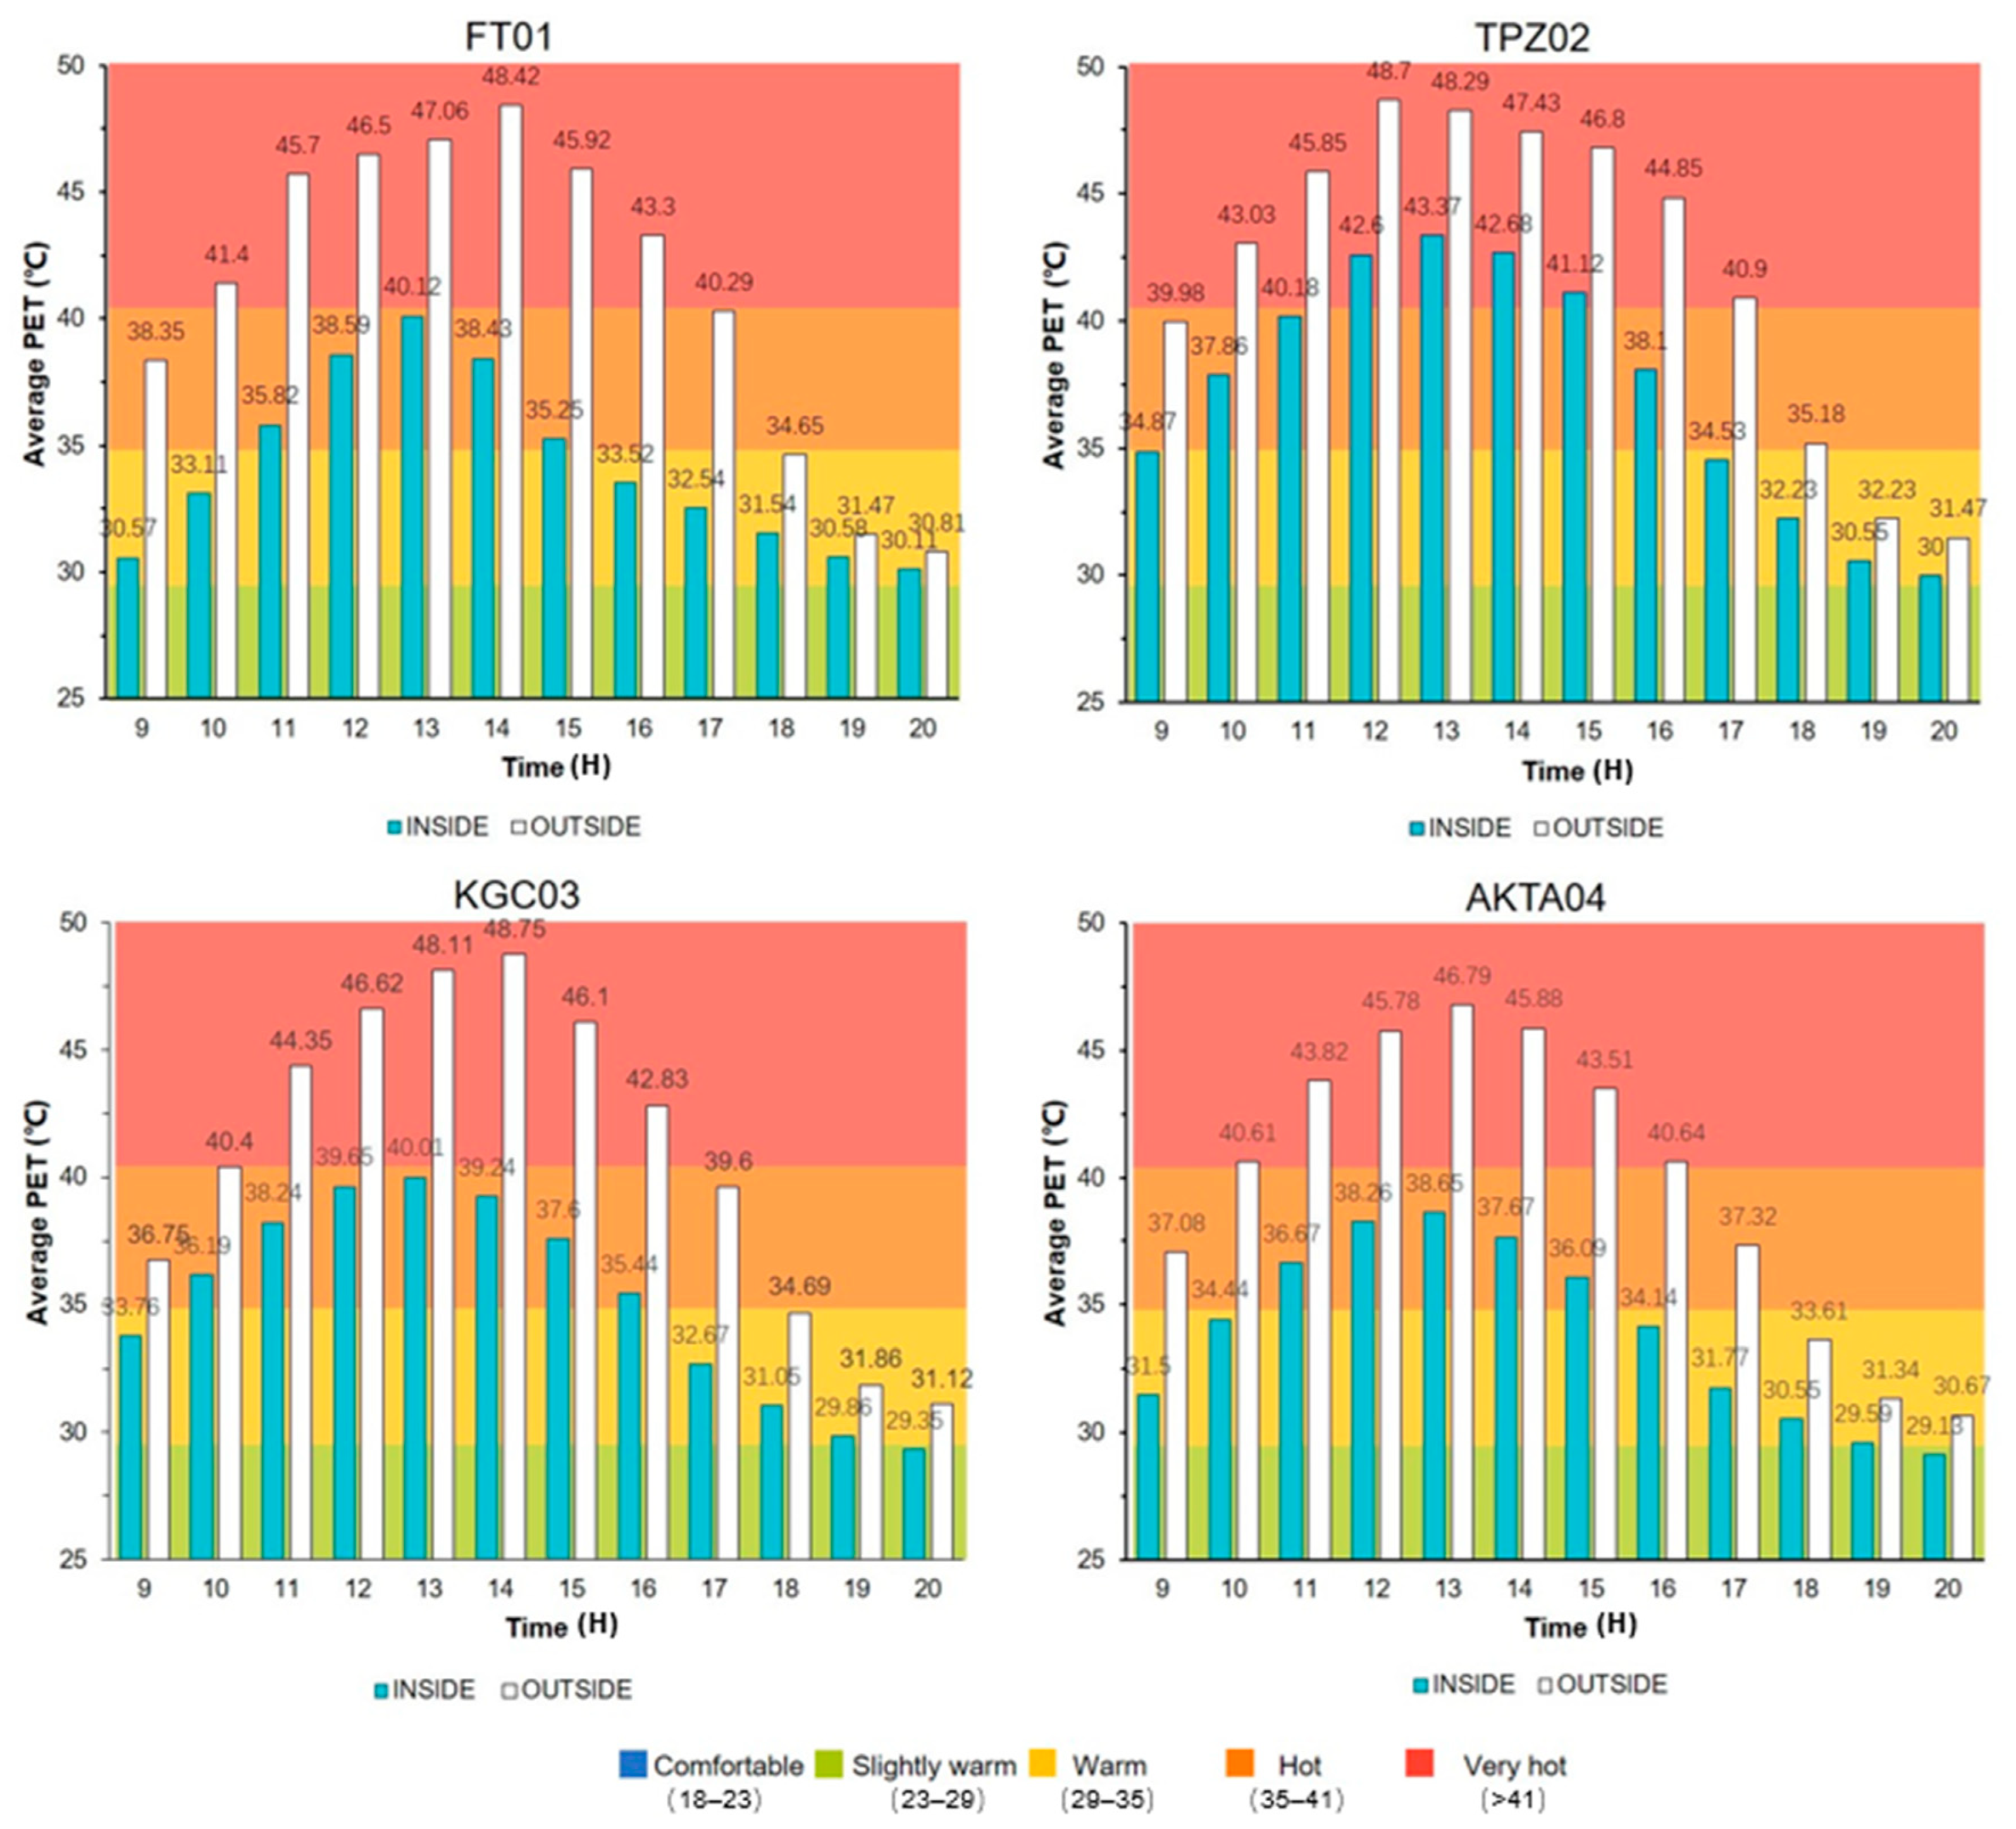
3.3.2. Thermal Comfort Analysis between Green Spaces and the Surrounding Urban Blocks

To compare the impact of small green spaces on urban thermal comfort, we conducted a statistical analysis of the average hourly PET values inside and outside green areas (Figure 8). It provides a clear view of the thermal comfort levels associated with each average PET value at different times and the daily variation in average PET. During the day (until 6:00 p.m.), there is a significant difference between the average PET inside and outside green spaces. Small green spaces can reduce thermal comfort by one degree compared to urban block spaces. FT01, in particular, can frequently reduce it by two levels, with the most significant difference occurring between 1:00 and 2:00 p.m., when it reaches its highest point between 11:00 a.m. and 3:00 p.m. Thus, small green spaces significantly improve urban thermal comfort during the day, particularly midday. However, as the afternoon progresses into the evening, the difference in thermal comfort between the interior and exterior of the green spaces gradually diminishes and approaches parity. This indicates that the thermal comfort improvement provided by green spaces is less pronounced in the late afternoon and evening. Figure 9 depicts the distribution of PET values within and outside green spaces during midday and evening, illustrating this contrast.
Moreover, in contrast to the results for average air temperature discussed in Section 3.2, where the average air temperature within small green spaces rapidly increases in the morning and peaks, with the temperature drop slowing down significantly in the afternoon and maintaining relatively high values, the thermal comfort peaks in the afternoon and then rapidly decreases, stabilizing at lower levels in the evening and night (Figure 8). Such can be attributed to the decrease in solar radiation after sunset, which results in a more pronounced decrease in thermal comfort.
In a horizontal comparison of the four locations, smaller locations had higher PET values than larger ones. The difference in PET values between interior and exterior spaces does not necessarily favor the larger sites. At 2:00 p.m., the smallest site, FT01, had an average internal PET value of 38.43 °C, 9.99 °C lower than the external urban block’s value of 48.42 °C. The corresponding values for the other sites were 4.75 °C for TPZ02, 9.51 °C for KGC, and 8.21 °C for AKTA. It suggests that even smaller green spaces can significantly improve the thermal comfort of urban areas.

4. Discussion

Expanding land for large-scale green development in urban areas, mainly densely populated regions, has proven challenging [51,52]. Due to their adaptability and cost-effectiveness, small green spaces have become popular in urban areas, allowing for widespread implementation [53,54]. Existing small green spaces are also more conducive to future upgrades and renovations. This study highlights the significance of small green spaces in improving microclimates and urban comfort. It also suggests several directions for future research into microclimates in small green spaces.
First, it is evident that, on a smaller scale, the green space area influences thermal comfort regulation, but this effect is not dominant. Instead, the spatial configuration of small green spaces, particularly the arrangement of vegetation, can substantially affect microclimates and thermal comfort. The relationship between the spatial arrangement of green spaces and microclimates requires additional study, as it will aid in designing and constructing small green spaces to improve urban comfort.
Second, the effectiveness of these small green spaces in enhancing urban thermal comfort in high-density urban areas can also be influenced by nearby buildings. Several factors contribute to this effect, including the orientation of building clusters, height, and density. These factors indirectly affect green spaces by, among other things, casting shadows, modifying sunlight radiation, and altering wind patterns. For instance, the wind speed distribution at 2:00 p.m. in Figure 10 of this study demonstrates that nearby buildings affect wind speeds in small green spaces. As discussed in Section 3.3, wind speeds in green spaces are typically lower than on city streets, but thermal comfort is typically higher than on city streets. This raises questions regarding the applicability of previous research findings to urban spaces on a small scale, which requires further investigation [14,55,56]. Additional research into the causes of thermal comfort effects in small urban green spaces will aid in designing more site-specific solutions.
In addition, since these small green spaces distributed in high-density construction area are frequently used, it is significant to understand people’s use evaluation of these small green spaces. Considering the factors such as user behavior and preference, the comprehensive consideration of quantitative simulation research and research on people’s use evaluation will provide more valuable information for urban high-density construction area planners.

5. Conclusions

Small urban green spaces are abundant in densely populated urban areas, but little is known about their impact on urban heat island effects and thermal comfort. As a result, the subject of this study was a typical small green space in the densely populated Chuo Ward of Tokyo. Using the ENVI-met software 5.1.1, the microclimates and thermal comfort conditions of the study site were simulated. Simultaneously, meteorological data were collected at sampling locations within the site to verify the simulation results’ reliability. The main conclusions are as follows:
(1) Small urban green spaces effectively reduce urban air temperatures, particularly between 1:00 and 2:00 p.m., when they can reduce temperatures by 2.40 °C to 2.67 °C. Additionally, these spaces consistently maintain temperatures lower than the highest temperature recorded in the Chuo Ward of Tokyo on the same day. The effect of green spaces on average temperatures is significantly more pronounced than its effect on extreme temperatures. From a macro perspective, these small urban green spaces have a significant cooling effect on the city.
(2) Thermal comfort analysis revealed that small urban green spaces significantly improve thermal comfort, especially during the day and around noon. They can decrease thermal comfort by one or two levels relative to typical urban block areas. However, this difference diminishes in the evening, and the thermal comfort levels inside and outside the green spaces become more comparable.
(3) Despite variations in the size of small urban green spaces, the size of these spaces is not the only factor that affects thermal comfort. Within these green spaces, the spatial arrangement of vegetation and the surrounding building layout significantly impact thermal comfort. Therefore, even small green spaces can have a significant impact on enhancing comfort.
In summary, this study highlights the significance of small urban green spaces in enhancing urban microclimates and thermal comfort, providing valuable insights and recommendations for urban planning and quality of life. At the same time, the role of these spaces in advancing urban sustainability is underscored, thus emphasizing how they help mitigate environmental challenges such as the urban heat island effect and climate change. This study also identifies areas for future research, such as factors that influence microclimates and thermal comfort in small urban green spaces, particularly in the spatial layouts of these spaces. This research directly contributes to enhancing the construction or renovation of small green spaces to enhance environmental sustainability and urban climate comfort.
However, there are also some limitations in this study. Firstly, since daytime is the most active time for human activities, this study focused on the thermal comfort and microclimate of small green spaces during daytime (9:00 a.m.–8:00 p.m.) yet lacks the situation simulation during the night. In the future, the study on improving all-weather simulation will help to provide a more comprehensive perspective; secondly, the conclusion of this study is based on Tokyo, which has strong applicability to cities with similar urban construction mode and climate conditions, yet it is not generally applicable to all cities. Finally, this study focuses on the improvement degree of small green space to microclimate and thermal comfort in the green space itself and its surrounding blocks. The deficiency in this study on the influence causes, influence radius, and influence attenuation of small green space on microclimate and comfort will be the key research directions in the future.

Author Contributions

Conceptualization, F.S.; methodology, F.S.; software, F.S.; validation, F.S., R.Y., S.L., D.S., K.L. and J.C.; formal analysis, F.S.; investigation, X.L. and F.S.; resources, J.M.; data curation, X.L. and F.S.; writing—original draft preparation, F.S.; writing—review and editing, F.S.; visualization, F.S.; supervision, J.Z. All authors have read and agreed to the published version of the manuscript.

Funding

This research received no external funding.

Data Availability Statement

The datasets generated during and/or analyzed during the current study are available from the corresponding author upon reasonable request.

Conflicts of Interest

The authors declare no conflict of interest.

References

  1. Zhang, J.; Li, Z.; Wei, Y.; Hu, D. The Impact of the Building Morphology on Microclimate and Thermal Comfort—A Case Study in Beijing. Build. Environ. 2022, 223, 109469. [Google Scholar] [CrossRef]
  2. United Nations. The World’s Cities in 2016; Statistical Papers—United Nations (Ser. A), Population and Vital Statistics Report; UN: New York, NY, USA, 2016; ISBN 978-92-1-362000-7. Available online: https://digitallibrary.un.org/record/1634928 (accessed on 10 June 2023).
  3. Sumari, N.S.; Cobbinah, P.B.; Ujoh, F.; Xu, G. On the Absurdity of Rapid Urbanization: Spatio-Temporal Analysis of Land-Use Changes in Morogoro, Tanzania. Cities 2020, 107, 102876. [Google Scholar] [CrossRef]
  4. Oke, T.R. The Energetic Basis of the Urban Heat Island. Q. J. R. Meteorol. Soc. 1982, 108, 1–24. [Google Scholar] [CrossRef]
  5. Arnfield, A.J. Two Decades of Urban Climate Research: A Review of Turbulence, Exchanges of Energy and Water, and the Urban Heat Island. Int. J. Climatol. 2003, 23, 1–26. [Google Scholar] [CrossRef]
  6. Zhou, W.; Yu, W.; Wu, T. An Alternative Method of Developing Landscape Strategies for Urban Cooling: A Threshold-Based Perspective. Landsc. Urban Plan. 2022, 225, 104449. [Google Scholar] [CrossRef]
  7. Yu, Z.; Guo, X.; Zeng, Y.; Koga, M.; Vejre, H. Variations in Land Surface Temperature and Cooling Efficiency of Green Space in Rapid Urbanization: The Case of Fuzhou City, China. Urban For. Urban Green. 2018, 29, 113–121. [Google Scholar] [CrossRef]
  8. Bonamente, E.; Rossi, F.; Coccia, V.; Pisello, A.L.; Nicolini, A.; Castellani, B.; Cotana, F.; Filipponi, M.; Morini, E.; Santamouris, M. An Energy-Balanced Analytic Model for Urban Heat Canyons: Comparison with Experimental Data. Adv. Build. Energy Res. 2013, 7, 222–234. [Google Scholar] [CrossRef]
  9. Wang, Y.; Zacharias, J. Landscape Modification for Ambient Environmental Improvement in Central Business Districts—A Case from Beijing. Urban For. Urban Green. 2015, 14, 8–18. [Google Scholar] [CrossRef]
  10. Wong, L.P.; Alias, H.; Aghamohammadi, N.; Aghazadeh, S.; Nik Sulaiman, N.M. Urban Heat Island Experience, Control Measures and Health Impact: A Survey among Working Community in the City of Kuala Lumpur. Sustain. Cities Soc. 2017, 35, 660–668. [Google Scholar] [CrossRef]
  11. Zeng, W.; Lao, X.; Rutherford, S.; Xu, Y.; Xu, X.; Lin, H.; Liu, T.; Luo, Y.; Xiao, J.; Hu, M.; et al. The Effect of Heat Waves on Mortality and Effect Modifiers in Four Communities of Guangdong Province, China. Sci. Total Environ. 2014, 482–483, 214–221. [Google Scholar] [CrossRef]
  12. Sarrat, C.; Lemonsu, A.; Masson, V.; Guedalia, D. Impact of Urban Heat Island on Regional Atmospheric Pollution. Atmos. Environ. 2006, 40, 1743–1758. [Google Scholar] [CrossRef]
  13. Lai, Y.; Ning, Q.; Ge, X.; Fan, S. Thermal Regulation of Coastal Urban Forest Based on ENVI-Met Model—A Case Study in Qinhuangdao, China. Sustainability 2022, 14, 7337. [Google Scholar] [CrossRef]
  14. Jang, G.; Kim, S.; Lee, J.S. Planning Scenarios and Microclimatic Effects: The Case of High-Density Riverside Residential Districts in Seoul, South Korea. Build. Environ. 2022, 223, 109517. [Google Scholar] [CrossRef]
  15. Li, Y.; Chen, Q.; Cheng, Q.; Li, K.; Cao, B.; Huang, Y. Evaluating the Influence of Different Layouts of Residential Buildings on the Urban Thermal Environment. Sustainability 2022, 14, 10227. [Google Scholar] [CrossRef]
  16. Tang, H.; Liu, J.; Zheng, B. Study on the Green Space Patterns and Microclimate Simulation in Typical Urban Blocks in Central China. Sustainability 2022, 14, 15391. [Google Scholar] [CrossRef]
  17. Liu, H.; Lim, J.Y.; Wint Hnin Thet, B.; Lai, P.-Y.; Koh, W.S. Evaluating the Impact of Tree Morphologies and Planting Densities on Outdoor Thermal Comfort in Tropical Residential Precincts in Singapore. Build. Environ. 2022, 221, 109268. [Google Scholar] [CrossRef]
  18. Li, Y.; Lin, D.; Zhang, Y.; Song, Z.; Sha, X.; Zhou, S.; Chen, C.; Yu, Z. Quantifying Tree Canopy Coverage Threshold of Typical Residential Quarters Considering Human Thermal Comfort and Heat Dynamics under Extreme Heat. Build. Environ. 2023, 233, 110100. [Google Scholar] [CrossRef]
  19. Zhou, X.; Zhang, S.; Zhu, D. Impact of Urban Water Networks on Microclimate and PM2.5 Distribution in Downtown Areas: A Case Study of Wuhan. Build. Environ. 2021, 203, 108073. [Google Scholar] [CrossRef]
  20. Zölch, T.; Rahman, M.A.; Pfleiderer, E.; Wagner, G.; Pauleit, S. Designing Public Squares with Green Infrastructure to Optimize Human Thermal Comfort. Build. Environ. 2019, 149, 640–654. [Google Scholar] [CrossRef]
  21. Boeri, A.; Longo, D.; Fabbri, K.; Roversi, R.; Boulanger, S. The Relation between Outdoor Microclimate and People Flow in Historic City Context the Case Study of Bologna within the ROCK Project. Sustainability 2023, 15, 7527. [Google Scholar] [CrossRef]
  22. Zhao, Q.; Sailor, D.J.; Wentz, E.A. Impact of Tree Locations and Arrangements on Outdoor Microclimates and Human Thermal Comfort in an Urban Residential Environment. Urban For. Urban Green. 2018, 32, 81–91. [Google Scholar] [CrossRef]
  23. Sodoudi, S.; Zhang, H.; Chi, X.; Müller, F.; Li, H. The Influence of Spatial Configuration of Green Areas on Microclimate and Thermal Comfort. Urban For. Urban Green. 2018, 34, 85–96. [Google Scholar] [CrossRef]
  24. Yamazaki, T.; Iida, A.; Hino, K.; Murayama, A.; Hiroi, U.; Terada, T.; Koizumi, H.; Yokohari, M. Use of Urban Green Spaces in the Context of Lifestyle Changes during the COVID-19 Pandemic in Tokyo. Sustainability 2021, 13, 9817. [Google Scholar] [CrossRef]
  25. Cybriwsky, R. Changing Patterns of Urban Public Space: Observations and Assessments from the Tokyo and New York Metropolitan Areas. Cities 1999, 16, 223–231. [Google Scholar] [CrossRef]
  26. Takahashi, K. Greenspace Depletion in Tokyo, Japan. Ph.D. Thesis, Ohio University, Athens, OH, USA, 2008. [Google Scholar]
  27. Rosso, F.; Pioppi, B.; Pisello, A.L. Pocket Parks for Human-Centered Urban Climate Change Resilience: Microclimate Field Tests and Multi-Domain Comfort Analysis through Portable Sensing Techniques and Citizens’ Science. Energy Build. 2022, 260, 111918. [Google Scholar] [CrossRef]
  28. Matsumoto, J.; Fujibe, F.; Takahashi, H. Urban Climate in the Tokyo Metropolitan Area in Japan. J. Environ. Sci. 2017, 59, 54–62. [Google Scholar] [CrossRef]
  29. Forstall, R.L.; Greene, R.P.; Pick, J.B. Which Are the Largest? Why Lists of Major Urban Areas Vary So Greatly. Tijdschr. Voor Econ. Soc. Geogr. 2009, 100, 277–297. [Google Scholar] [CrossRef]
  30. IPCC—Intergovernmental Panel on Climate Change. Available online: https://scholar.google.co.jp/scholar?q=30.+IPCC%E2%80%94Intergovernmental+Panel+on+Climate+Change&hl=zh-CN&as_sdt=0&as_vis=1&oi=scholart (accessed on 16 June 2023).
  31. Ihara, T.; Genchi, Y.; Sato, T.; Yamaguchi, K.; Endo, Y. City-Block-Scale Sensitivity of Electricity Consumption to Air Temperature and Air Humidity in Business Districts of Tokyo, Japan. Energy 2008, 33, 1634–1645. [Google Scholar] [CrossRef]
  32. Li, W.; Zhu, J. The Formation of a Polycentric City Structure—A Case Study of Tokyo. Beijing Urban Plan. Constr. 2003, 6, 23–25. [Google Scholar]
  33. Zhang, H.; Han, M. Pocket Parks in English and Chinese Literature: A Review. Urban For. Urban Green. 2021, 61, 127080. [Google Scholar] [CrossRef]
  34. Choi, G.Y.; Kim, H.S.; Kim, H.; Lee, J.S. How Do Paving and Planting Strategies Affect Microclimate Conditions and Thermal Comfort in Apartment Complexes? Int. J. Clim. Chang. Strateg. Manag. 2021, 13, 97–119. [Google Scholar] [CrossRef]
  35. Liu, Z.; Zheng, S.; Zhao, L. Evaluation of the ENVI-Met Vegetation Model of Four Common Tree Species in a Subtropical Hot-Humid Area. Atmosphere 2018, 9, 198. [Google Scholar] [CrossRef]
  36. Berardi, U.; Jandaghian, Z.; Graham, J. Effects of Greenery Enhancements for the Resilience to Heat Waves: A Comparison of Analysis Performed through Mesoscale (WRF) and Microscale (Envi-Met) Modeling. Sci. Total Environ. 2020, 747, 141300. [Google Scholar] [CrossRef]
  37. Haddad, S.; Paolini, R.; Ulpiani, G.; Synnefa, A.; Hatvani-Kovacs, G.; Garshasbi, S.; Fox, J.; Vasilakopoulou, K.; Nield, L.; Santamouris, M. Holistic Approach to Assess Co-Benefits of Local Climate Mitigation in a Hot Humid Region of Australia. Sci. Rep. 2020, 10, 14216. [Google Scholar] [CrossRef] [PubMed]
  38. Willmott, C.J. Some Comments on the Evaluation of Model Performance. Bull. Am. Meteorol. Soc. 1982, 63, 1309–1313. [Google Scholar] [CrossRef]
  39. Liu, C.; Ouyang, J.; Yan, J.; Tang, L. Landsenses Ecology: A New Idea for Watershed Ecology Restoration. Int. J. Environ. Res. Public Health 2023, 20, 3610. [Google Scholar] [CrossRef]
  40. Höppe, P. The Physiological Equivalent Temperature—A Universal Index for the Biometeorological Assessment of the Thermal Environment. Int. J. Biometeorol. 1999, 43, 71–75. [Google Scholar] [CrossRef]
  41. Biqaraz, B.; Fayaz, R.; Haghighaat Naeeni, G. A Comparison of Outdoor Thermal Comfort in Historical and Contemporary Urban Fabrics of Lar City. Urban Clim. 2019, 27, 212–226. [Google Scholar] [CrossRef]
  42. Kumar, P.; Sharma, A. Study on Importance, Procedure, and Scope of Outdoor Thermal Comfort—A Review. Sustain. Cities Soc. 2020, 61, 102297. [Google Scholar] [CrossRef]
  43. Johansson, E.; Thorsson, S.; Emmanuel, R.; Krüger, E. Instruments and Methods in Outdoor Thermal Comfort Studies—The Need for Standardization. Urban Clim. 2014, 10, 346–366. [Google Scholar] [CrossRef]
  44. Matzarakis, A.; Mayer, H. Another Kind of Environmental Stress: Thermal Stress. WHO Collaborating Centre for Air Quality Management and Air Pollution Control. Newsletters 1996, 18, 7–10. [Google Scholar]
  45. Nastos, P.T.; Matzarakis, A. The Effect of Air Temperature and Human Thermal Indices on Mortality in Athens, Greece. Theor. Appl. Clim. 2012, 108, 591–599. [Google Scholar] [CrossRef]
  46. Johansson, E.; Yahia, M.W.; Arroyo, I.; Bengs, C. Outdoor Thermal Comfort in Public Space in Warm-Humid Guayaquil, Ecuador. Int. J. Biometeorol. 2018, 62, 387–399. [Google Scholar] [CrossRef] [PubMed]
  47. Yan, T.; Jin, Y.; Jin, H. Combined Effects of the Visual-Thermal Environment on the Subjective Evaluation of Urban Pedestrian Streets in Severely Cold Regions of China. Build. Environ. 2023, 228, 109895. [Google Scholar] [CrossRef]
  48. Lai, D.; Guo, D.; Hou, Y.; Lin, C.; Chen, Q. Studies of Outdoor Thermal Comfort in Northern China. Build. Environ. 2014, 77, 110–118. [Google Scholar] [CrossRef]
  49. Honjo, T. Thermal Comfort in Outdoor Environment. Glob. Environ. Res. 2009, 13, 43–47. [Google Scholar]
  50. Tsoka, S.; Tsikaloudaki, A.; Theodosiou, T. Analyzing the ENVI-Met Microclimate Model’s Performance and Assessing Cool Materials and Urban Vegetation Applications—A Review. Sustain. Cities Soc. 2018, 43, 55–76. [Google Scholar] [CrossRef]
  51. Lu, J.; Li, Q.; Zeng, L.; Chen, J.; Liu, G.; Li, Y.; Li, W.; Huang, K. A Micro-Climatic Study on Cooling Effect of an Urban Park in a Hot and Humid Climate. Sustain. Cities Soc. 2017, 32, 513–522. [Google Scholar] [CrossRef]
  52. Shashua-Bar, L.; Pearlmutter, D.; Erell, E. The Cooling Efficiency of Urban Landscape Strategies in a Hot Dry Climate. Landsc. Urban Plan. 2009, 92, 179–186. [Google Scholar] [CrossRef]
  53. Abdi, B.; Hami, A.; Zarehaghi, D. Impact of Small-Scale Tree Planting Patterns on Outdoor Cooling and Thermal Comfort. Sustain. Cities Soc. 2020, 56, 102085. [Google Scholar] [CrossRef]
  54. Grilo, F.; Pinho, P.; Aleixo, C.; Catita, C.; Silva, P.; Lopes, N.; Freitas, C.; Santos-Reis, M.; McPhearson, T.; Branquinho, C. Using Green to Cool the Grey: Modelling the Cooling Effect of Green Spaces with a High Spatial Resolution. Sci. Total Environ. 2020, 724, 138182. [Google Scholar] [CrossRef] [PubMed]
  55. Lau, K.K.-L.; Chung, S.C.; Ren, C. Outdoor Thermal Comfort in Different Urban Settings of Sub-Tropical High-Density Cities: An Approach of Adopting Local Climate Zone (LCZ) Classification. Build. Environ. 2019, 154, 227–238. [Google Scholar] [CrossRef]
  56. Hsieh, C.-M.; Jan, F.-C.; Zhang, L. A Simplified Assessment of How Tree Allocation, Wind Environment, and Shading Affect Human Comfort. Urban For. Urban Green. 2016, 18, 126–137. [Google Scholar] [CrossRef]
Figure 1. Seasonal variation in meteorological elements in Sapporo, Tokyo, Fukuoka, and Naha. The green, red, and blue lines indicate monthly averages of daily mean, maximum, and minimum temperatures, respectively. The blue and brown bars show monthly precipitation amounts and monthly sunshine durations, respectively (https://www.data.jma.go.jp/gmd/cpd/longfcst/en/tourist.html accessed on 20 July 2023).
Sustainability 15 16555 g001
Figure 2. Location and details of the research sites.
Sustainability 15 16555 g002
Figure 3. Research process.
Sustainability 15 16555 g003
Figure 4. ENVI-met simulation 3D model.
Sustainability 15 16555 g004
Figure 5. Comparison of measured and simulated data.
Sustainability 15 16555 g005
Figure 6. Average air temperature and extreme air temperature variations for each site.
Sustainability 15 16555 g006
Figure 7. Hourly percentage distribution of thermal comfort levels for each site.
Sustainability 15 16555 g007
Figure 8. The hourly average PET values and the corresponding thermal comfort levels for indoor and outdoor green spaces.
Sustainability 15 16555 g008
Figure 9. The spatial distribution of PET values inside and outside the various sites during midday and evening.
Sustainability 15 16555 g009
Figure 10. The wind speed distribution at 2:00 p.m. for each site.
Sustainability 15 16555 g010
Table 1. Grid parameters.
Object CodeHorizontal Scale (Grids)Vertical Scale
(Grids)
Resolution (m)Deflection Angle (°)
FT-01100 × 100801.5−25
TPZ-02100 × 1006020
KGC-03125 × 100602−25
AKTK-04125 × 125602−35
Table 2. Plant parameters.
Plant IDHeight (m)Crown Width (m)Foliage Shortwave AlbedoFoliage Shortwave TransmittancePlant Type
010001430.18 0.3Tree
010002650.18 0.3Tree
0100031050.20.3Tree
0100041290.20.3Tree
01000518120.180.3Tree
0100062460.180.3Tree
0200011/0.180.3Shrub
0200022/0.180.3Shrub
0300010.2/0.20.3Grassland
Table 3. Initial meteorological parameters.
Parameter NameParameter Value
Starting time29 July 2023 8:00 a.m.
Simulation duration12 h
Maximum air temperature35.7 °C
Minimum air temperature25.8 °C
Average wind speed3.7 m/s
Maximum relative humidity65%
Minimum relative humidity48%
Dominant wind directionSouth wind
Roughness length0.01
Cloud cover0
Table 4. Thermal comfort PET classification.
PET (°C)Thermal PerceptionGrade of Physiological Stress
<4Very coldExtreme cold stress
4–8ColdStrong cold stress
8–13CoolModerate cold stress
13–18Slightly coolSlight cold stress
18–23ComfortableNo thermal stress
23–29Slightly warmSlight heat stress
29–35WarmModerate heat stress
35–41HotStrong heat stress
>41Very hotExtreme heat stress
Table 5. Reliability calculation results.
Measurement
Spots
Air Temperature (°C)Relative Humidity (%)
RMSEMAEdRMSEMAEd
FT-01P10.83 0.730.96 3.77 3.29 0.92
TPZ-02P21.13 1.05 0.93 4.964.50 0.89
KGC-03P30.84 0.73 0.92 4.34 3.86 0.86
P40.88 0.78 0.90 4.41 3.99 0.88
AKTK-04P51.04 0.97 0.88 5.52 5.26 0.81
P61.04 0.97 0.90 4.39 3.89 0.87
Disclaimer/Publisher’s Note: The statements, opinions and data contained in all publications are solely those of the individual author(s) and contributor(s) and not of MDPI and/or the editor(s). MDPI and/or the editor(s) disclaim responsibility for any injury to people or property resulting from any ideas, methods, instructions or products referred to in the content.

