Article

Impacts of Strong El Niño–Southern Oscillation Events on Wintertime Northern Hemisphere Storm Tracks in Two Pacific Decadal Oscillation Phases during 1950–2010

1
China Meteorological Administration Key Laboratory for Climate Prediction Studies, School of Atmospheric Sciences, Nanjing University, Nanjing 210023, China
2
Jiangsu Environmental Monitoring Center, Nanjing 210019, China
3
School of Marine and Atmospheric Sciences, Stony Brook University, Stony Brook, NY 11794, USA
*
Author to whom correspondence should be addressed.
Sustainability 2023, 15(24), 16565; https://doi.org/10.3390/su152416565
Submission received: 21 October 2023 / Revised: 2 December 2023 / Accepted: 3 December 2023 / Published: 5 December 2023
(This article belongs to the Section Air, Climate Change and Sustainability)

Abstract

:
Northern Hemisphere storm track activities (NHSTs) not only influence the weather and climate along their paths, but they also play a crucial role in climate systems by systematically transporting heat, momentum, and moisture. Distinguish from previous studies focusing on atmospheric circulation anomalies, this study provides further evidence of wintertime NHSTs variation under the influence of strong El Niño–Southern Oscillation (ENSO) events and Pacific Decadal Oscillation (PDO) variation with ERA-20C reanalysis data, from two mathematical aspects of linear superposition and nonlinear modulation. While ENSO warm/cold events lead the entire NHSTs to a general south/north shift, the ENSO impact in two PDO phases exhibits a remarkable difference with the PDO phase. The Pacific storm track (PST) anomalies largely strengthen equatorward and downstream when both ENSO and PDO are in phase, but its anomalies tend to be weakened when ENSO and PDO are out of phase. Generally, the opposite situation occurs with Atlantic storm track (AST) anomalies, which display a strengthening dipole pattern when ENSO and PDO are out of phase. Apparently, the result is roughly a linear superposition of ENSO and PDO-only impacts. Nevertheless, further analyses indicate that the nonlinear modulation of PDO on the ENSO impact on NHSTs exists. With respect to the PST, it exhibits approximately parallel bands of south-north dipole anomalies when ENSO is in the PDO positive phase, but only the south branch remains when ENSO is in the PDO negative phase. Generally, a similar situation occurs to AST anomalies over the Atlantic Ocean. The modulation may be mainly associated with the atmospheric mean flow anomalies and the midlatitude sea surface temperature anomalies to ENSO in different PDO phases. To some extent, the results may be beneficial for understanding the variation of extreme weather events brought by NHSTs.

1. Introduction

One of the most significant features in the midlatitude atmosphere is the active synoptic-scale transient eddies. Since they usually migrate in terms of their preferred path, the regions where they frequently pass through are called “storm tracks”. The geographical distributions can be represented by bandpass-filtered transient eddy statistics [1]. In the Northern Hemisphere, two peaks are featured for the geographical distribution, one extending from the western North Pacific across the Pacific, becoming weaker over the west coast of North America, and the other extending from North America across the Atlantic, becoming weaker over Europe while extending toward central Asia, respectively, marking the Pacific and Atlantic storm tracks [2]. From a synoptic perspective, storm tracks are regions over which extratropical cyclones/anticyclones are prevalent, and they are responsible for most of the severe and hazardous weather in the midlatitude, including extreme precipitation, high winds, and coastal storm surge events. Investigations have demonstrated that the midlatitude weather/climate is dominated by the location and intensity of storm track activities. For example, California winter precipitation is highly correlated to a metric of extratropical storm track activities over the Eastern Pacific [3]. The Pacific storm track extends much farther downstream associated with El Niño-Southern Oscillation (ENSO), and the downstream extension brings more active landfalling cyclones to California, resulting in flooding, extreme cold, and beach erosion. The Atlantic storm track activities extending northeastward over the Norwegian Sea may bring high-impact weather, such as heavy precipitation to northwestern Europe and generally mild weather for most areas during a positive phase of the North Atlantic Oscillation (NAO), while during a negative phase, more southern storm track activities may bring high precipitation to southern Europe [4,5]. The occurrence of extreme weather events caused by storm activities may aggravate the current risk of the food security and water reserves associated with global warming and pose more of a threat to human sustainable development.
Storm track activities not only influence the weather and climate along their paths, but they also play an essential role in climate systems by systematically transporting heat, momentum, and moisture to maintain atmospheric general circulation. From a climate dynamics perspective, storm track activity is an important participant in atmospheric eddy–mean flow interactions. Midlatitude transient eddy forcing is recognized as having a crucial role in the generation and maintenance of atmospheric circulation anomalies. In the companion study [6], the dynamical role of atmospheric transient eddy feedbacks to teleconnection patterns is investigated. It is recognized that transient eddy anomalies over the Northeastern Pacific are energetic, and eddy feedbacks largely enhance and favor the strengthened Pacific–North American (PNA) pattern when ENSO occurs in the Pacific Decadal Oscillation (PDO) positive phase, while transient eddy anomalies largely contribute to the West Pacific (WP) pattern over the Northwestern Pacific when ENSO occurs in the PDO negative phase. On the other hand, the mean flow offers strong baroclinic conversion of the available potential energy to transient eddies, which coincides with the rapid growth in transient variance in the downstream direction [2].
In addition, storm track activity is also a crucial participant in North Pacific air–sea interaction. Observational and experimental evidence demonstrates that heat supply anchored by the subarctic frontal zone acts to maintain surface baroclinicity and sustain atmospheric midlatitude storms [7]. The enhanced subtropical frontal zone strengthens the meridional temperature gradient and induces more active transient eddies with the acceleration of westerly jet [8]. Storm track activities are deeply involved in the nonlinear dynamical process of North Pacific air–sea interactions and atmospheric eddy–mean flow interactions.
Factors affecting midlatitude atmospheric circulation may influence storm track activities, including tropical/extratropical sea surface temperature anomalies [9], topographic effects [10], and anthropogenic climate change [11]. Previous studies have addressed the interannual relationship between sea surface temperature anomalies (SSTAs) and midlatitude storm track activities [6,12,13,14,15]. Since the Tropical Ocean-Global Atmosphere (TOGA) trial was carried out in the 1990s, modern methods can be used to monitor ocean conditions; for example, ocean buoys, satellites, and vessels provide valuable ocean data for research. The most notable relationship is strongly linked to ENSO events. ENSO events exhibit great influence on the interannual variability of storm track activities. Through changes in the strength of Hadley circulation, ENSO triggers a cascade of extratropical atmospheric teleconnections associated with westerly jet [16], such as PNA patterns [17] and Pacific-East Asian patterns [18], and these can be explained by forced Rossby wave trains. Closely related to the mean flow changes, storm tracks during El Niño years shift equatorward and downstream, while La Niña events mark generally opposite shifts.
However, the Pacific SSTA manifests not only interannual variability but also decadal-to-interdecadal variability. The PDO has been more and more recognized after a major climate regime shift around the end of the 1970s [19]. PDO usually refers to a spatial SSTA structure in the Pacific Ocean that bears some resemblance to the anomalous pattern associated with ENSO. The PDO emphasizes the variation associated with extra-tropical Pacific SSTAs, while the ENSO stresses the influence associated with tropical Pacific SSTAs. The atmospheric circulation undergoes a significant shift during the PDO positive/negative phase, and the PDO is well correlated with the interdecadal variability of Pacific storm track activities through the associated mean flow anomalies [2]. The PDO’s influence on the impact of the ENSO on atmospheric circulation and the regional climate has been investigated in previous studies, in which the combined impact on atmospheric teleconnection is emphasized [20,21]. The ENSO’s signals tend to be stronger and more stable in the preferred phases of the PDO but vary with different regions. However, little attention has been paid to the response of storm track activities to ENSO events in two PDO phases, which may directly influence the weather and climate along the path and are deeply involved in midlatitude complex nonlinear dynamical processes. This triggers us to explore Northern Hemisphere storm track activity (NHST) variation under the combined influence of the ENSO and PDO. To some extent, the results may be beneficial for understanding the variation of midlatitude severe weather brought on by NHSTs and have practical implications for regional climate prediction and early warning, in order to mitigate the impact of storm disasters.
In this work, we attempt to mathematically highlight linear superposition and nonlinear modulation and provide useful information for understanding possible nonlinear modulation physically. Usually, the relationship may be distinguished for different seasons. Given that transient eddies are more active in cool seasons, ENSO’s impact on wintertime NHSTs in two PDO phases is explored. With respect to the asymmetry of El Niño’s impact and La Niña’s impact, different combinations of the ENSO and PDO phases will be considered. Moreover, two aspects are considered to mathematically contribute to the different combinations: linear superposition and nonlinear modulation. Data and analysis methods are described in Section 2. In Section 3, the linear superposition and nonlinear modulation of the PDO on ENSO impact is explored. Conclusions and discussion are presented in Section 4 and Section 5, respectively.

2. Data and Methods

2.1. Data

The atmospheric and sea surface temperature data in this work are taken from the ERA-20C reanalysis dataset, which is archived at the European Centre for Medium-Range Weather Forecasts (ECMWF) and has been widely used in previous studies [22]. The synoptic quality of the reanalysis data is improved with the availability of observations. Since the Pacific and Atlantic transient eddy activities after 1950 agree with those derived from independent rawinsonde observation, the reanalysis data for the period of 1950–2010 are used here.
The strong ENSO events are selected according to the definition of the Climate Prediction Center (CPC) at NCEP/NOAA. It is defined as a threshold of ±0.8 °C for the Oceanic Niño Index (ONI) [3-month running mean of ERSST.v5 SSTA in the Niño 3.4 region], based on centered 30-year base periods updated every 5 years in order to remove a warming trend in the Nino 3.4 region. It is met for a minimum of 5 consecutive overlapping seasons, including DJF (December-January-February), which can confirm whether features consistent with a coupled ocean–atmosphere phenomenon accompanied these periods (more information can be found at the Web site https://origin.cpc.ncep.noaa.gov/products/analysis_monitoring/ensostuff/ONI_v5.php, accessed on 10 October 2022).
The PDO index is adopted from the Joint Institute for the Study of the Atmosphere and Ocean (http://research.jisao.washington.edu/pdo/PDO.latest.txt, accessed on 10 October 2022). It is defined as the leading principal component of monthly SSTAs in the North Pacific basin (typically poleward of 20° N) [19,23]. The monthly mean global average SSTAs are removed to separate PDO-related variability from any global warming signal, and a 10-year low-pass butter filter is performed to the PDO index to highlight its interdecadal variability.
Following those definitions, 23 strong ENSO events for 1950–2010 are selected and classified by PDO phases (Table 1). Monthly composites (DJF, 69 months) of variables according to different combinations of ENSO and PDO are investigated, and all variables are detrended to remove global warming signals.

2.2. Methods

The approach to diagnosing storm tracks is to use bandpass-filtered eddy variance/covariance. Since Blackmon [1] first introduced the bandpass-filtered variance of 500 hPa geopotential height, many other eddy variance/covariance quantities have also been used to represent storm track activities. High-pass-filtered variance/covariance statistics, filtered using a 24 h difference filter, are introduced by Wallace et al. [24]. In this work, we employ 250 hPa meridional velocity variance (VV250hpa). It is computed as follows:
V V 250 h p a = [ v t + 24   h v ( t ) ] 2 ¯
where v is the meridional velocity at 250 hPa, and the overbar indicates the time average over winter. The 24 h difference filtering has half power point at period of 1.2 and 6 days; thus, it is similar to the band-pass filtering for the synoptic time scale. The interannual variation of storm track statics based on this filter behaves very similarly to those computed using broader bandpass filters.
To understand the propagation of stationary wave disturbances under different combinations of ENSO and PDO, a wave activity flux is evaluated according to Takaya and Nakamura [25].
W x , y = p cos 2 U U a 2 cos 2 ψ λ 2 ψ 2 ψ λ 2 + V a 2 cos ψ λ ψ ψ 2 ψ λ U a 2 cos ψ λ ψ ψ 2 ψ λ + V a 2 ψ 2 ψ 2 ψ 2
where p = pressure/1000 hPa, ψ is the geostrophic stream function, a is the earth’s radius, and ( , λ ) are the latitude and longitude. Small-amplitude perturbations are on the winter mean flow U = ( U ,   V , 0)T. That is, u = U + u , v = V + v ,   ψ = ψ + ψ , where the perturbations are denoted by primes. Identifying the wave propagation is important for understanding the dynamics behind various atmospheric anomalies. The wave activity flux is a useful diagnostic tool for illustrating a “snapshot” of a propagating packet of stationary or migratory quasi-geostrophic wave disturbances and thereby for inferring where the packet is emitted and absorbed, as verified in several applications.

3. Results

3.1. Different Combinations of ENSO and PDO and Their Impacts on Storm Tracks

In previous studies [2,12], how the Pacific storm track (PST) changes in response to ENSO-only events has been discussed. Here, the same diagnostic tools and storm track metrics are used to study the combined impact for ease of comparison. Figure 1 shows Northern Hemisphere storm tracks climatology (contour) and anomalies under strong ENSO events (shading). From the climatology, a maxima center extends from the Far East across the Pacific, toward North America, i.e., the PST, and a second maxima center extends from North America across the Atlantic toward Northern Europe, i.e., the Atlantic storm track (AST). Compared to the climatology, the PST positive anomalies present on the equatorward and downstream side of the climatology of the PST, suggesting the PST is shifting equatorward and downstream in El Niño events (shading, Figure 1a), while La Niña events mark generally opposite shifts (shading, Figure 1b). Given the approximate symmetry between El Niño and La Niña events’ influences on storm tracks, the difference is shown to highlight the linear component of the ENSO response (Figure 1c, Figure 1a minus Figure 1b). It reflects the shift of the NHSTs equatorward or poleward under ENSO’s influence.
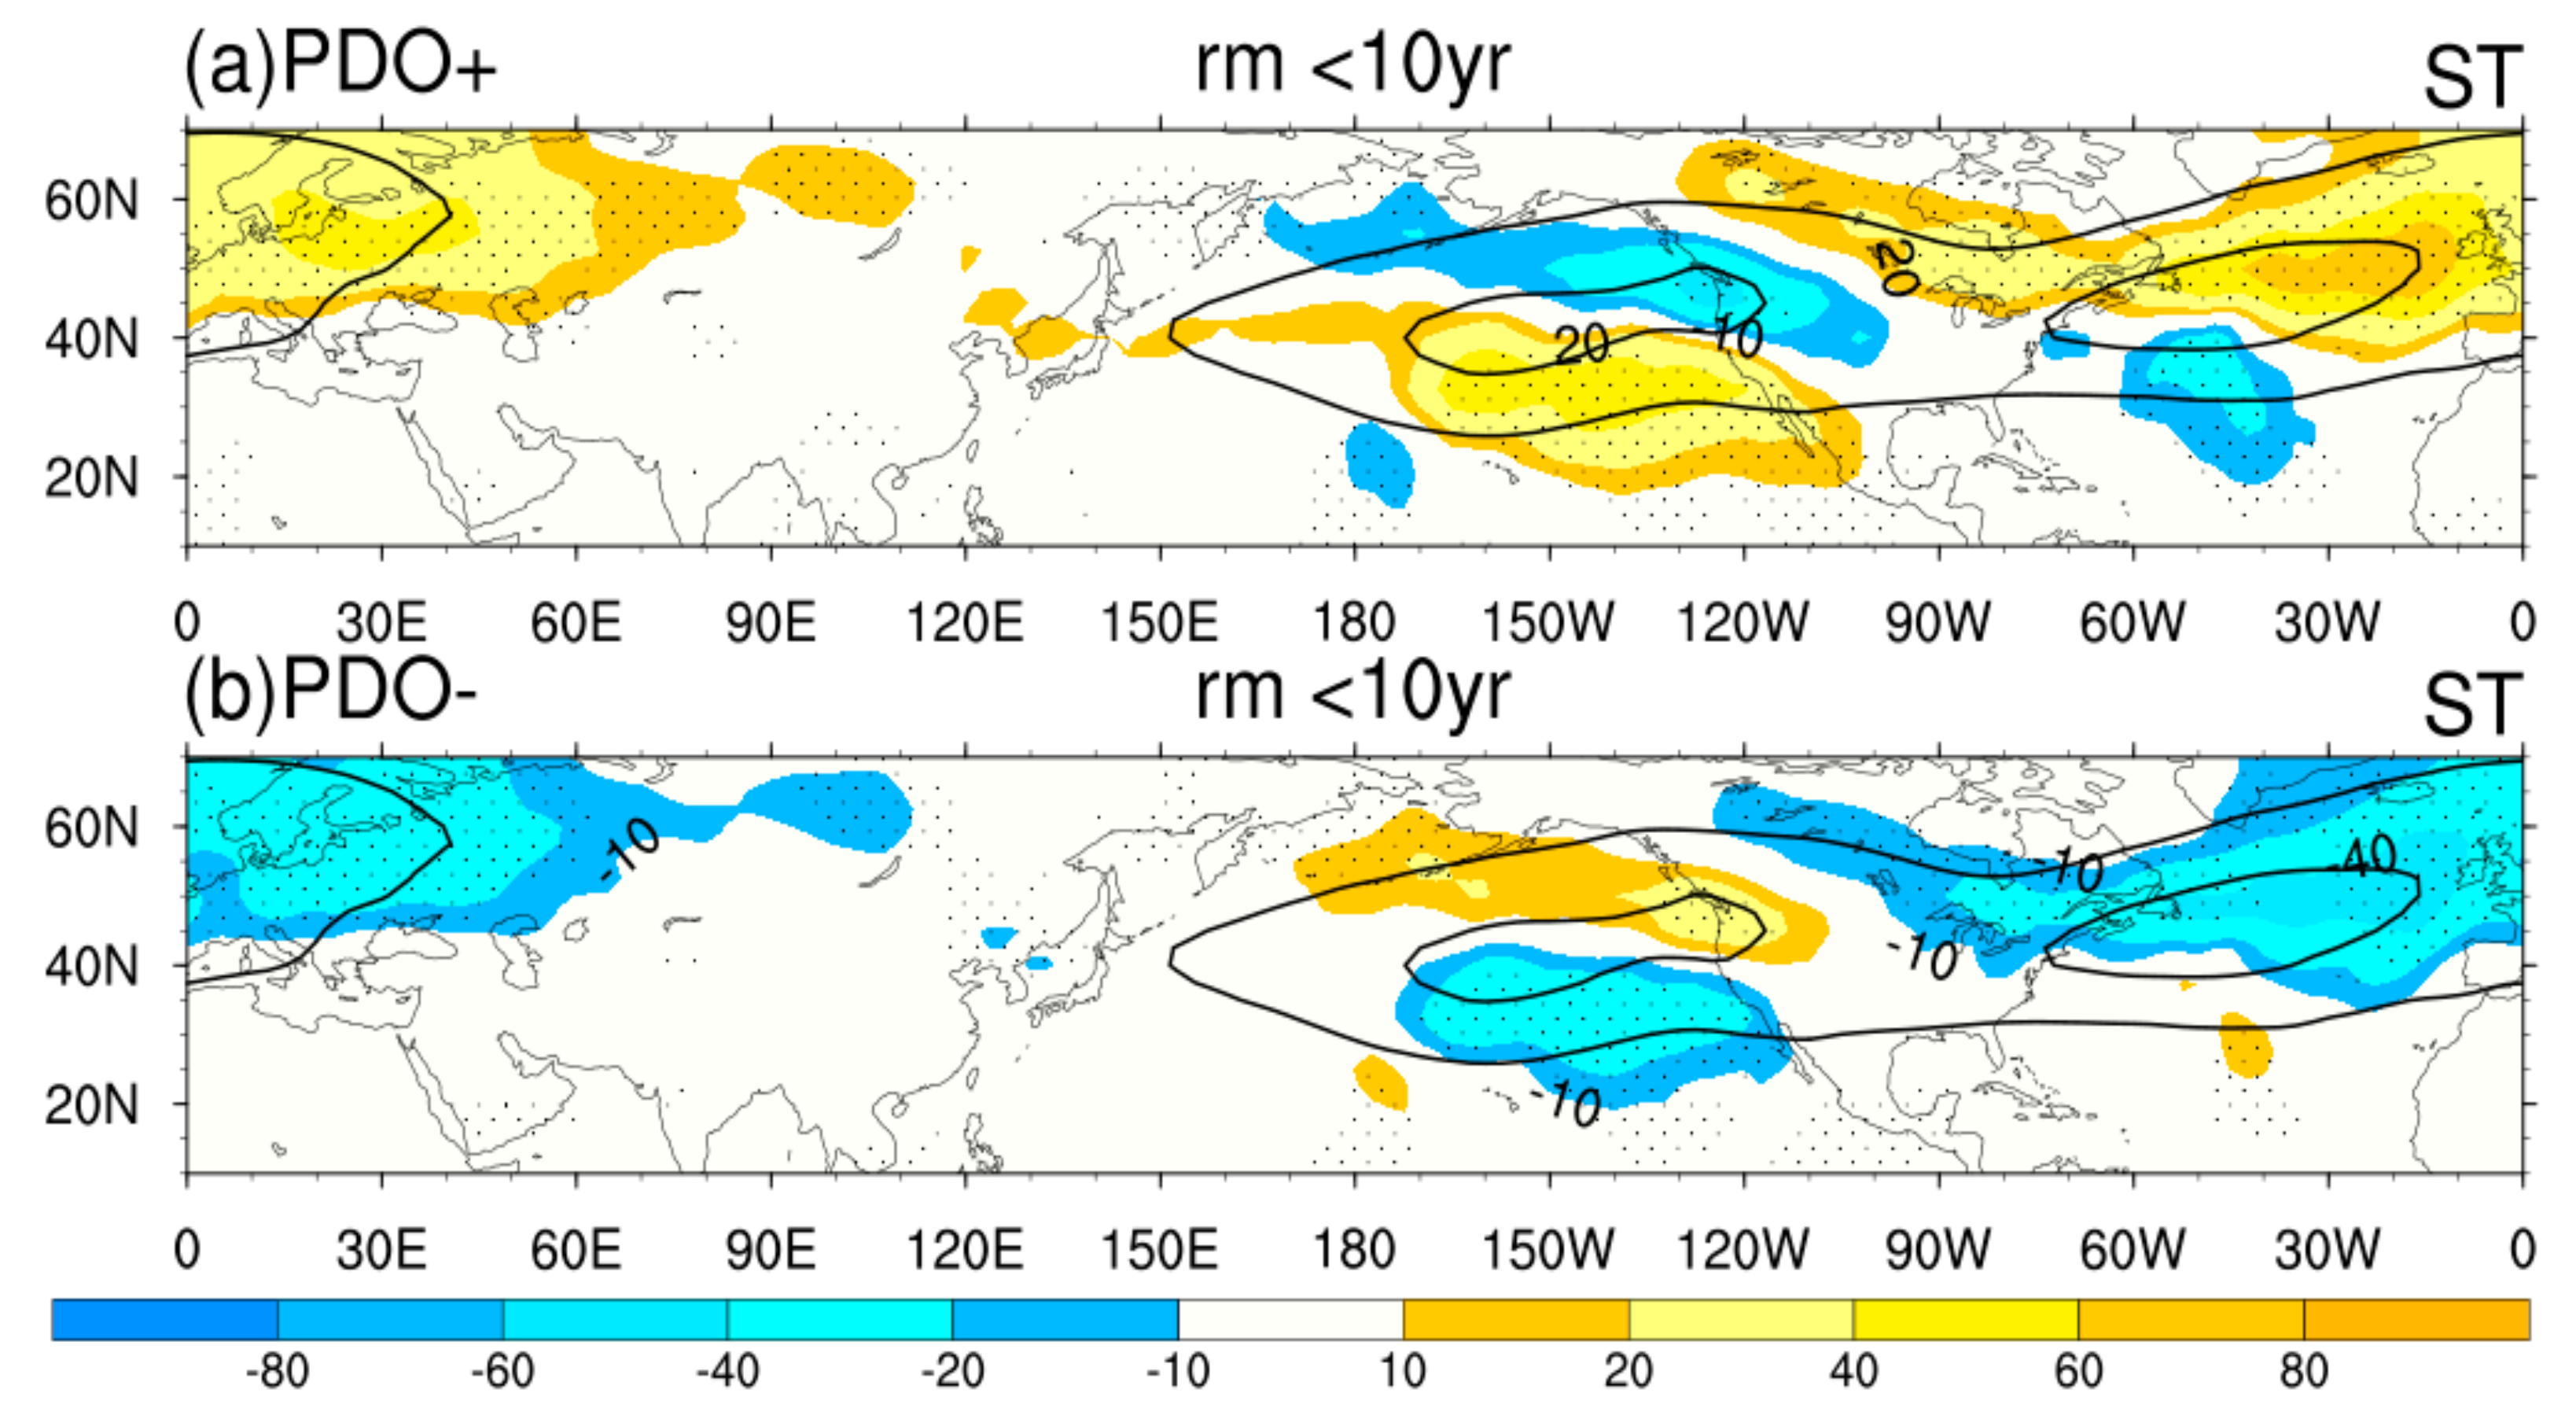
The NHSTs response to PDO-only positive and negative phases through low-pass filtering is demonstrated in Figure 2. Note that, unlike the response to ENSO-only, the anomaly’s amplitude seems relatively weak, and the NHST anomalies display non-uniformly equatorward/poleward under PDO influence. Respectively, the PST positive anomalies present on the equatorward side of the climatology of the PST, but the AST positive anomalies expand poleward and extend into Europe in the PDO positive phase. An approximately opposite pattern performs in the PDO negative phase.
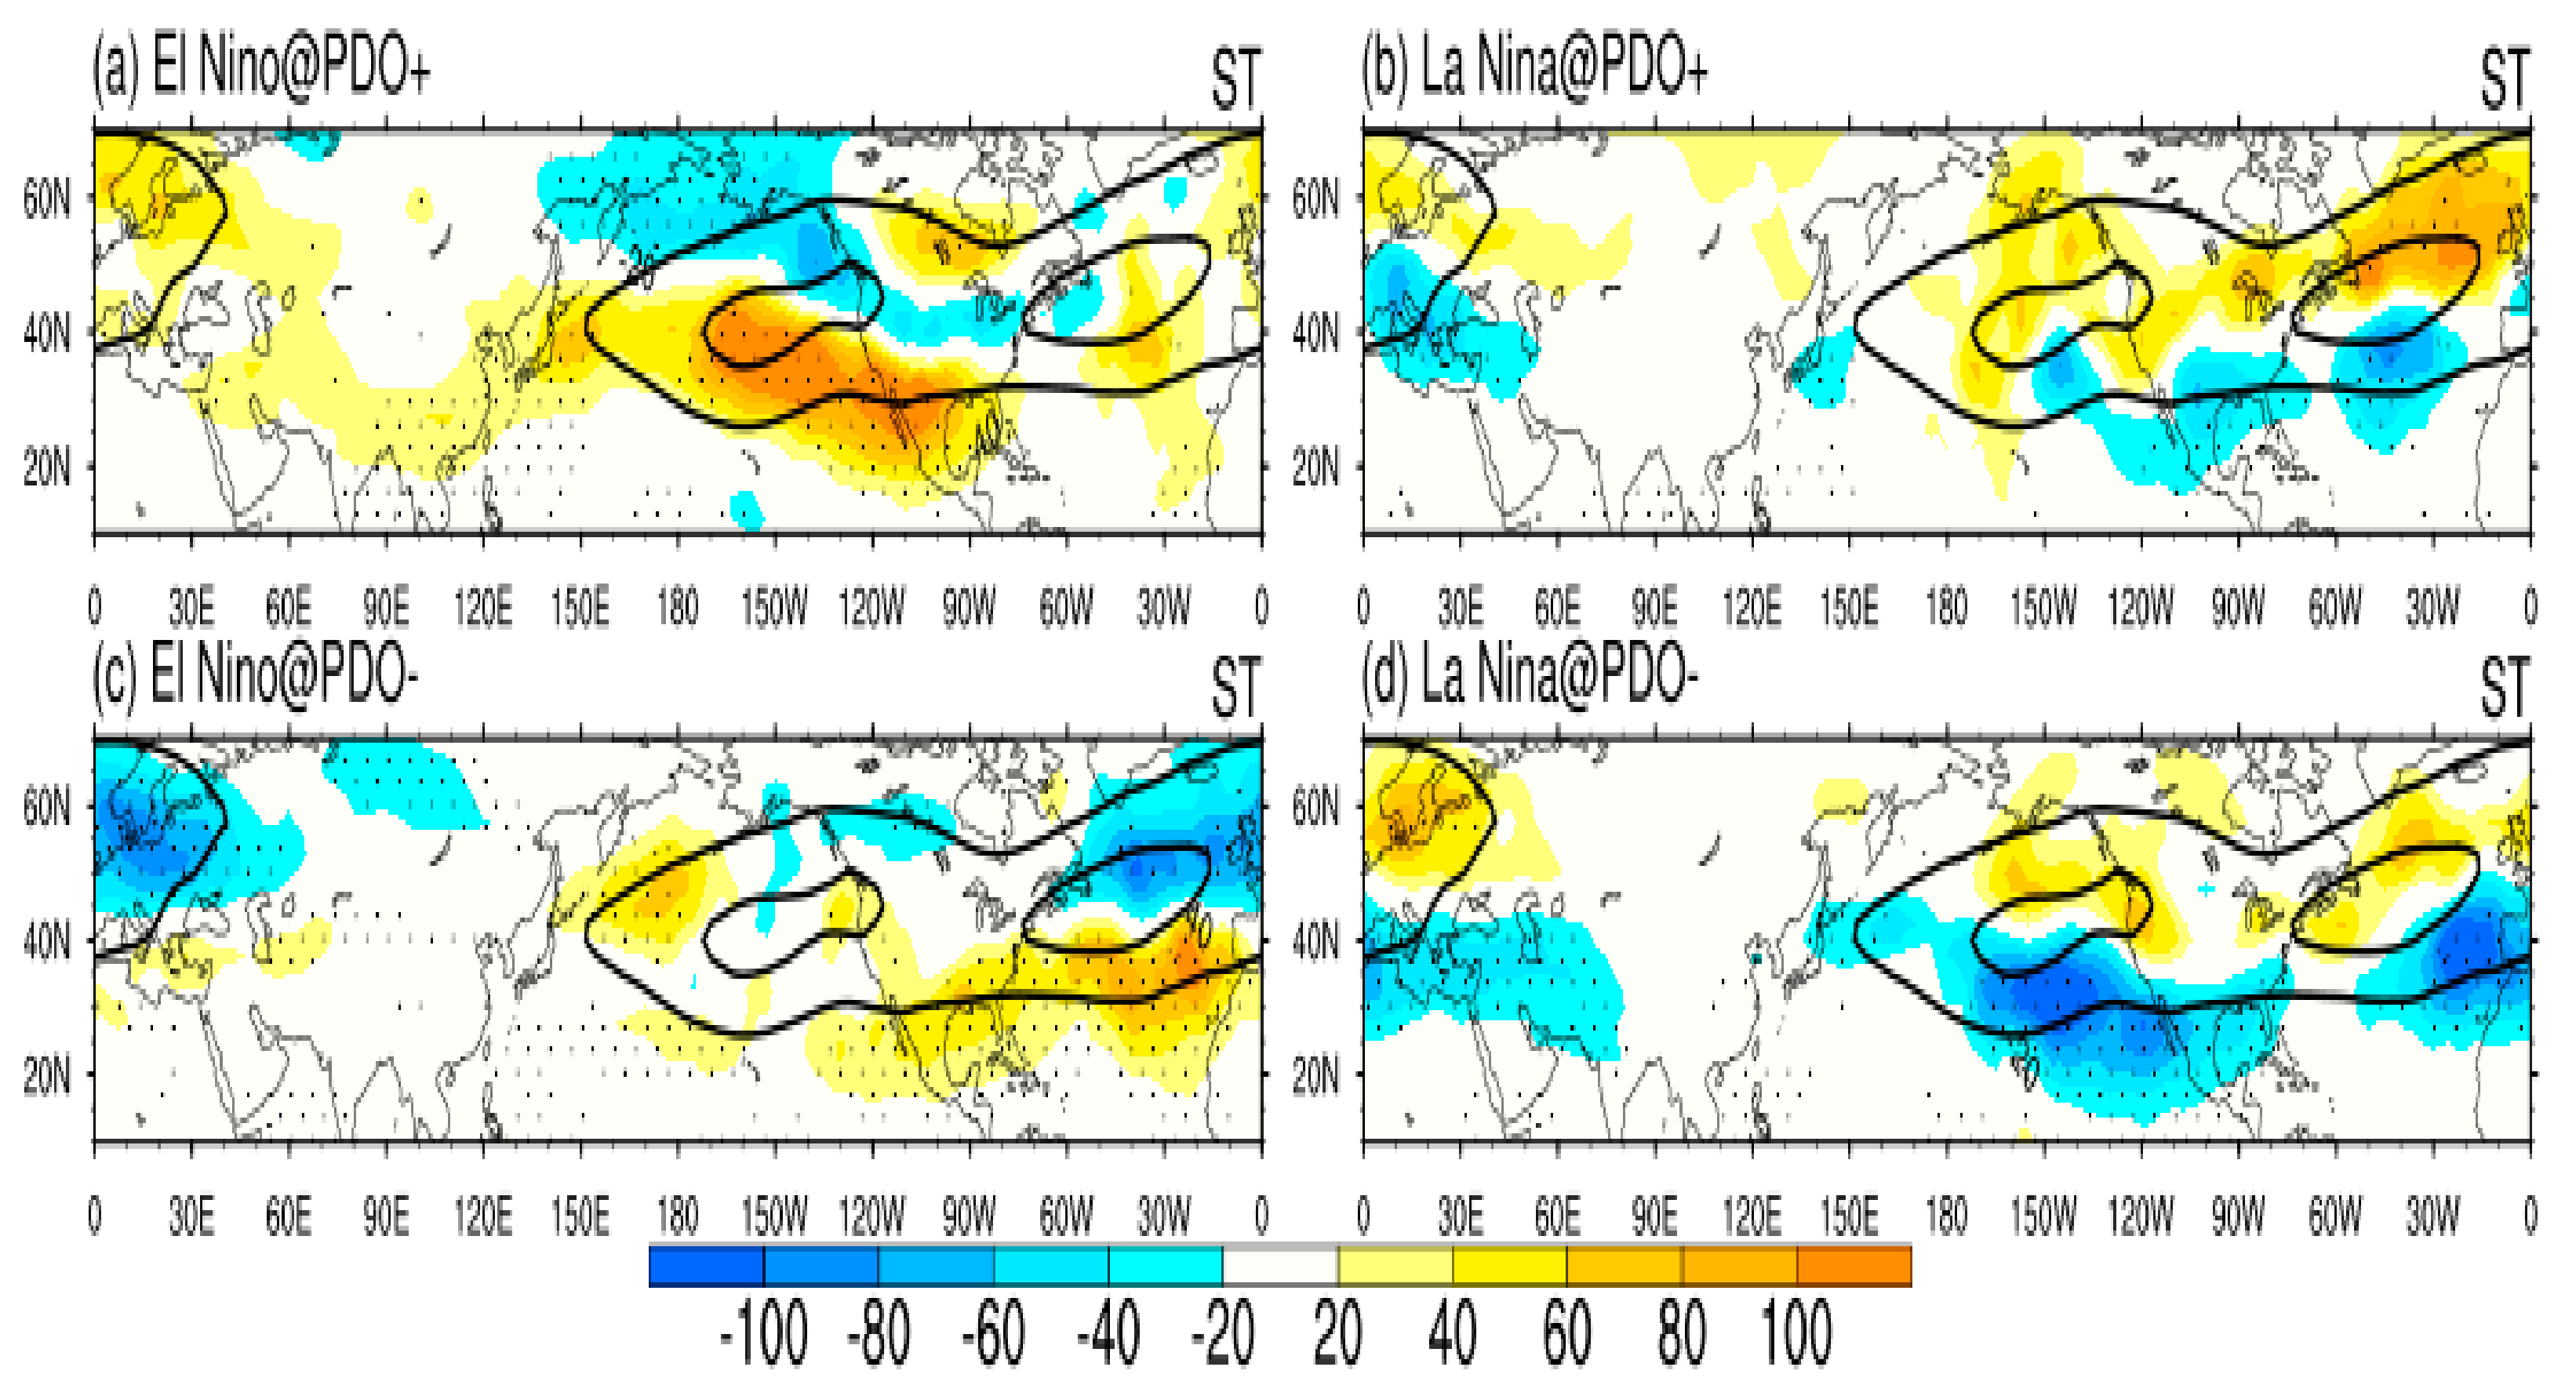
Based on the classification of ENSO and PDO in Table 1, a different combination of the influence of ENSO and PDO is presented in Figure 3. The left two figures are for El Niño events in the PDO positive/negative phase, respectively (Figure 3a,c). The right two figures are for La Niña events in the PDO positive/negative phase, respectively (Figure 3b,d). For El Niño’s impact (Figure 3a,c), largely PST positive anomalies are present on the equatorward and downstream side of the climatology of the PST and the negative band to the north side in the PDO positive phase. However, a part of the positive anomalies performs poleward and is confined upstream over the north side of the PST climatological entrance, and a part shifts equatorward and downstream in the PDO negative phase. To the AST, El Niño induces widely south-north dipole anomalies in the PDO negative phase, but only positive anomalies remain and perform relatively narrow in the PDO positive phase. For La Niña’s impact (Figure 3b,d), largely PST negative anomalies are present on the equatorward and downstream side of the climatology of the PST in the PDO negative phase (Figure 3d), but the negative anomalies sharply decrease in the PDO positive phase (Figure 3b). To the AST, La Niña induces north-positive and south-negative dipole anomalies in the PDO positive phase, but only south-negative anomalies are widely significant in the PDO negative phase. Comparing the four combinations, the PST anomalies largely strengthen equatorward and downstream when both ENSO and PDO are in phase (Figure 3a, or Figure 3d), but the anomalies tend to be weakened when ENSO and PDO are out of phase (Figure 3c, or Figure 3b). With respect to the AST anomalies, the results seem roughly opposite; i.e., dipole anomalies are relatively distinct when ENSO and PDO are out of phase. That suggests the relationship between ENSO and storm track activities is not stationary, and it can be influenced by a decadal variation of the PDO.
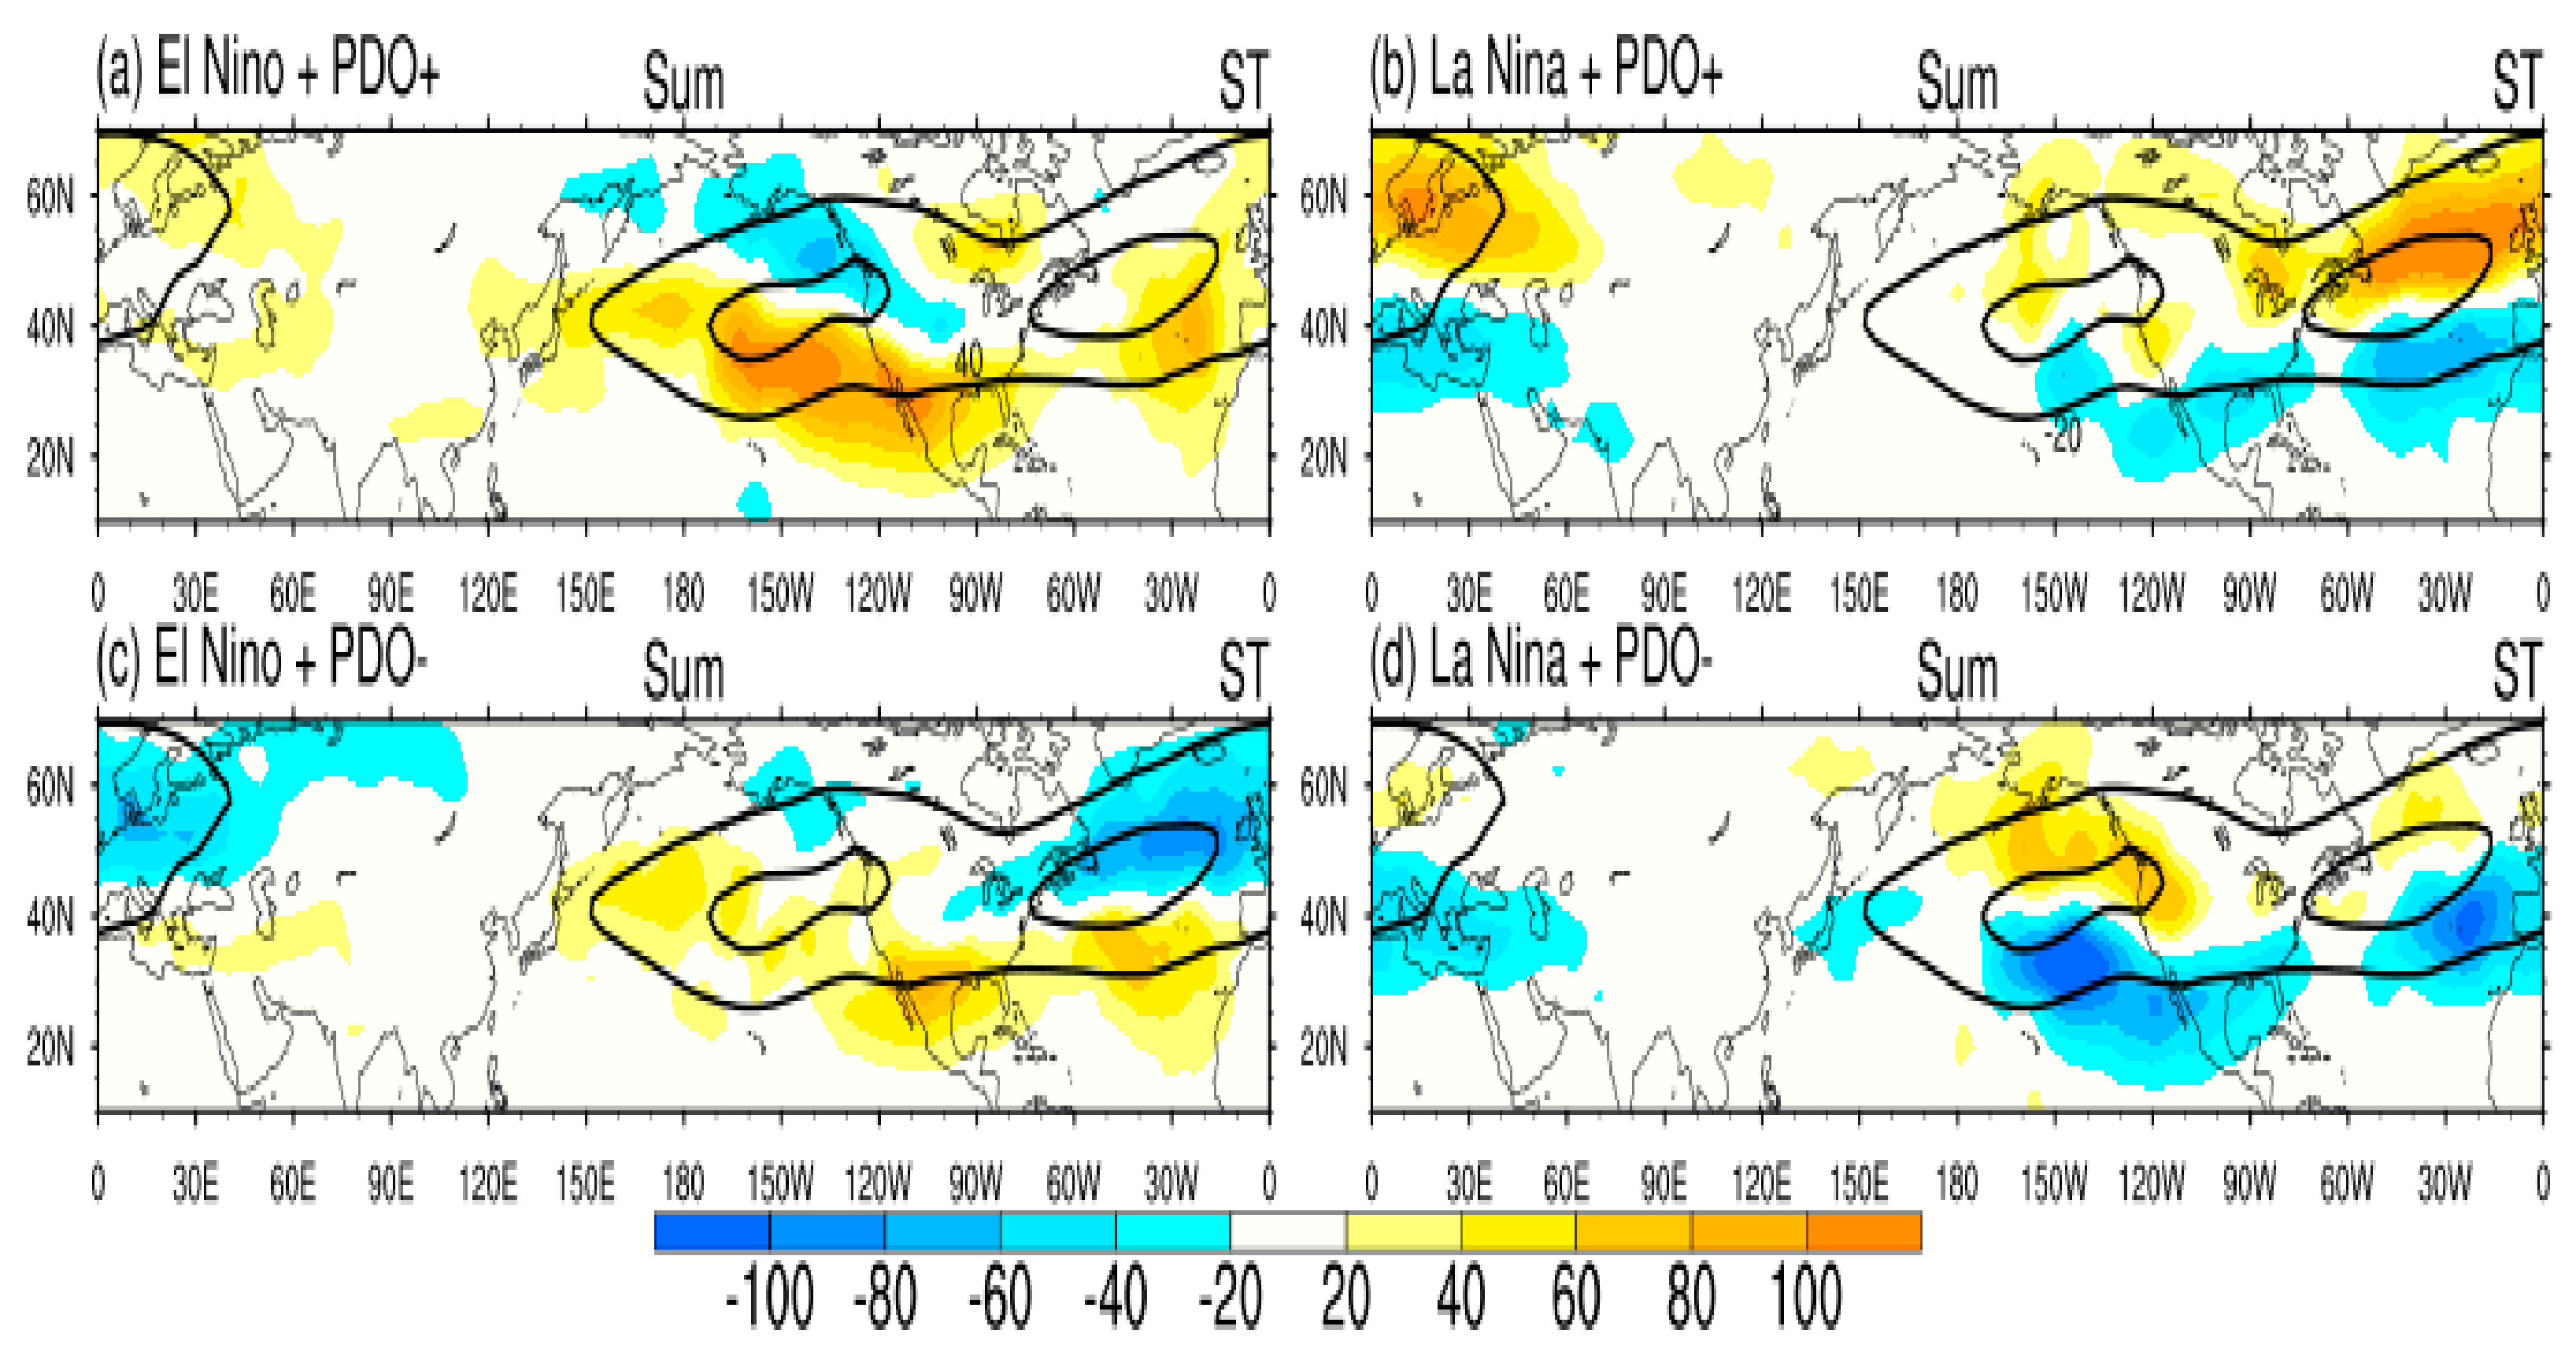
Note that the above different combination of the influence of ENSO and PDO on NHSTs is challenged by an interesting question; that is, whether the combined impact is simply a linear superposition of the ENSO-only, PDO-only impact? To answer this question, the linear superposition of NHST anomalies influenced by ENSO-only and PDO-only is illustrated in Figure 4 (that is, the sum of Figure 1 and Figure 2). The pattern of the sum demonstrates general characteristics of NHST anomalies when ENSO and PDO are in or out of phase. It is shown that PST positive/negative anomalies intensify and shift downstream when ENSO and PDO are in phase (Figure 4a,d). When ENSO and PDO are out of phase, the PST anomalies seem to decrease (Figure 4b,c). With respect to AST anomalies, the north-south dipole anomalies seem strengthening when ENSO and PDO are out of phase.
Comparing Figure 4 with Figure 3, the anomalous patterns for the sum of the ENSO-only and PDO-only impact in Figure 4 is quite similar to that of the different combination of ENSO and PDO’s influences in Figure 3. Apparently, the El Niño/La Niña impact on NHSTs in the PDO positive/negative phase is roughly a linear superposition of the ENSO-only, PDO-only impact. Nevertheless, Figure 3 and Figure 4 are not identical, over both the Pacific and Atlantic. The differences between these two figures may suggest nonlinear behavior between El Niño/La Niña under PDO’s influence.

3.2. Nonlinear Modulation of PDO on ENSO’s Impact

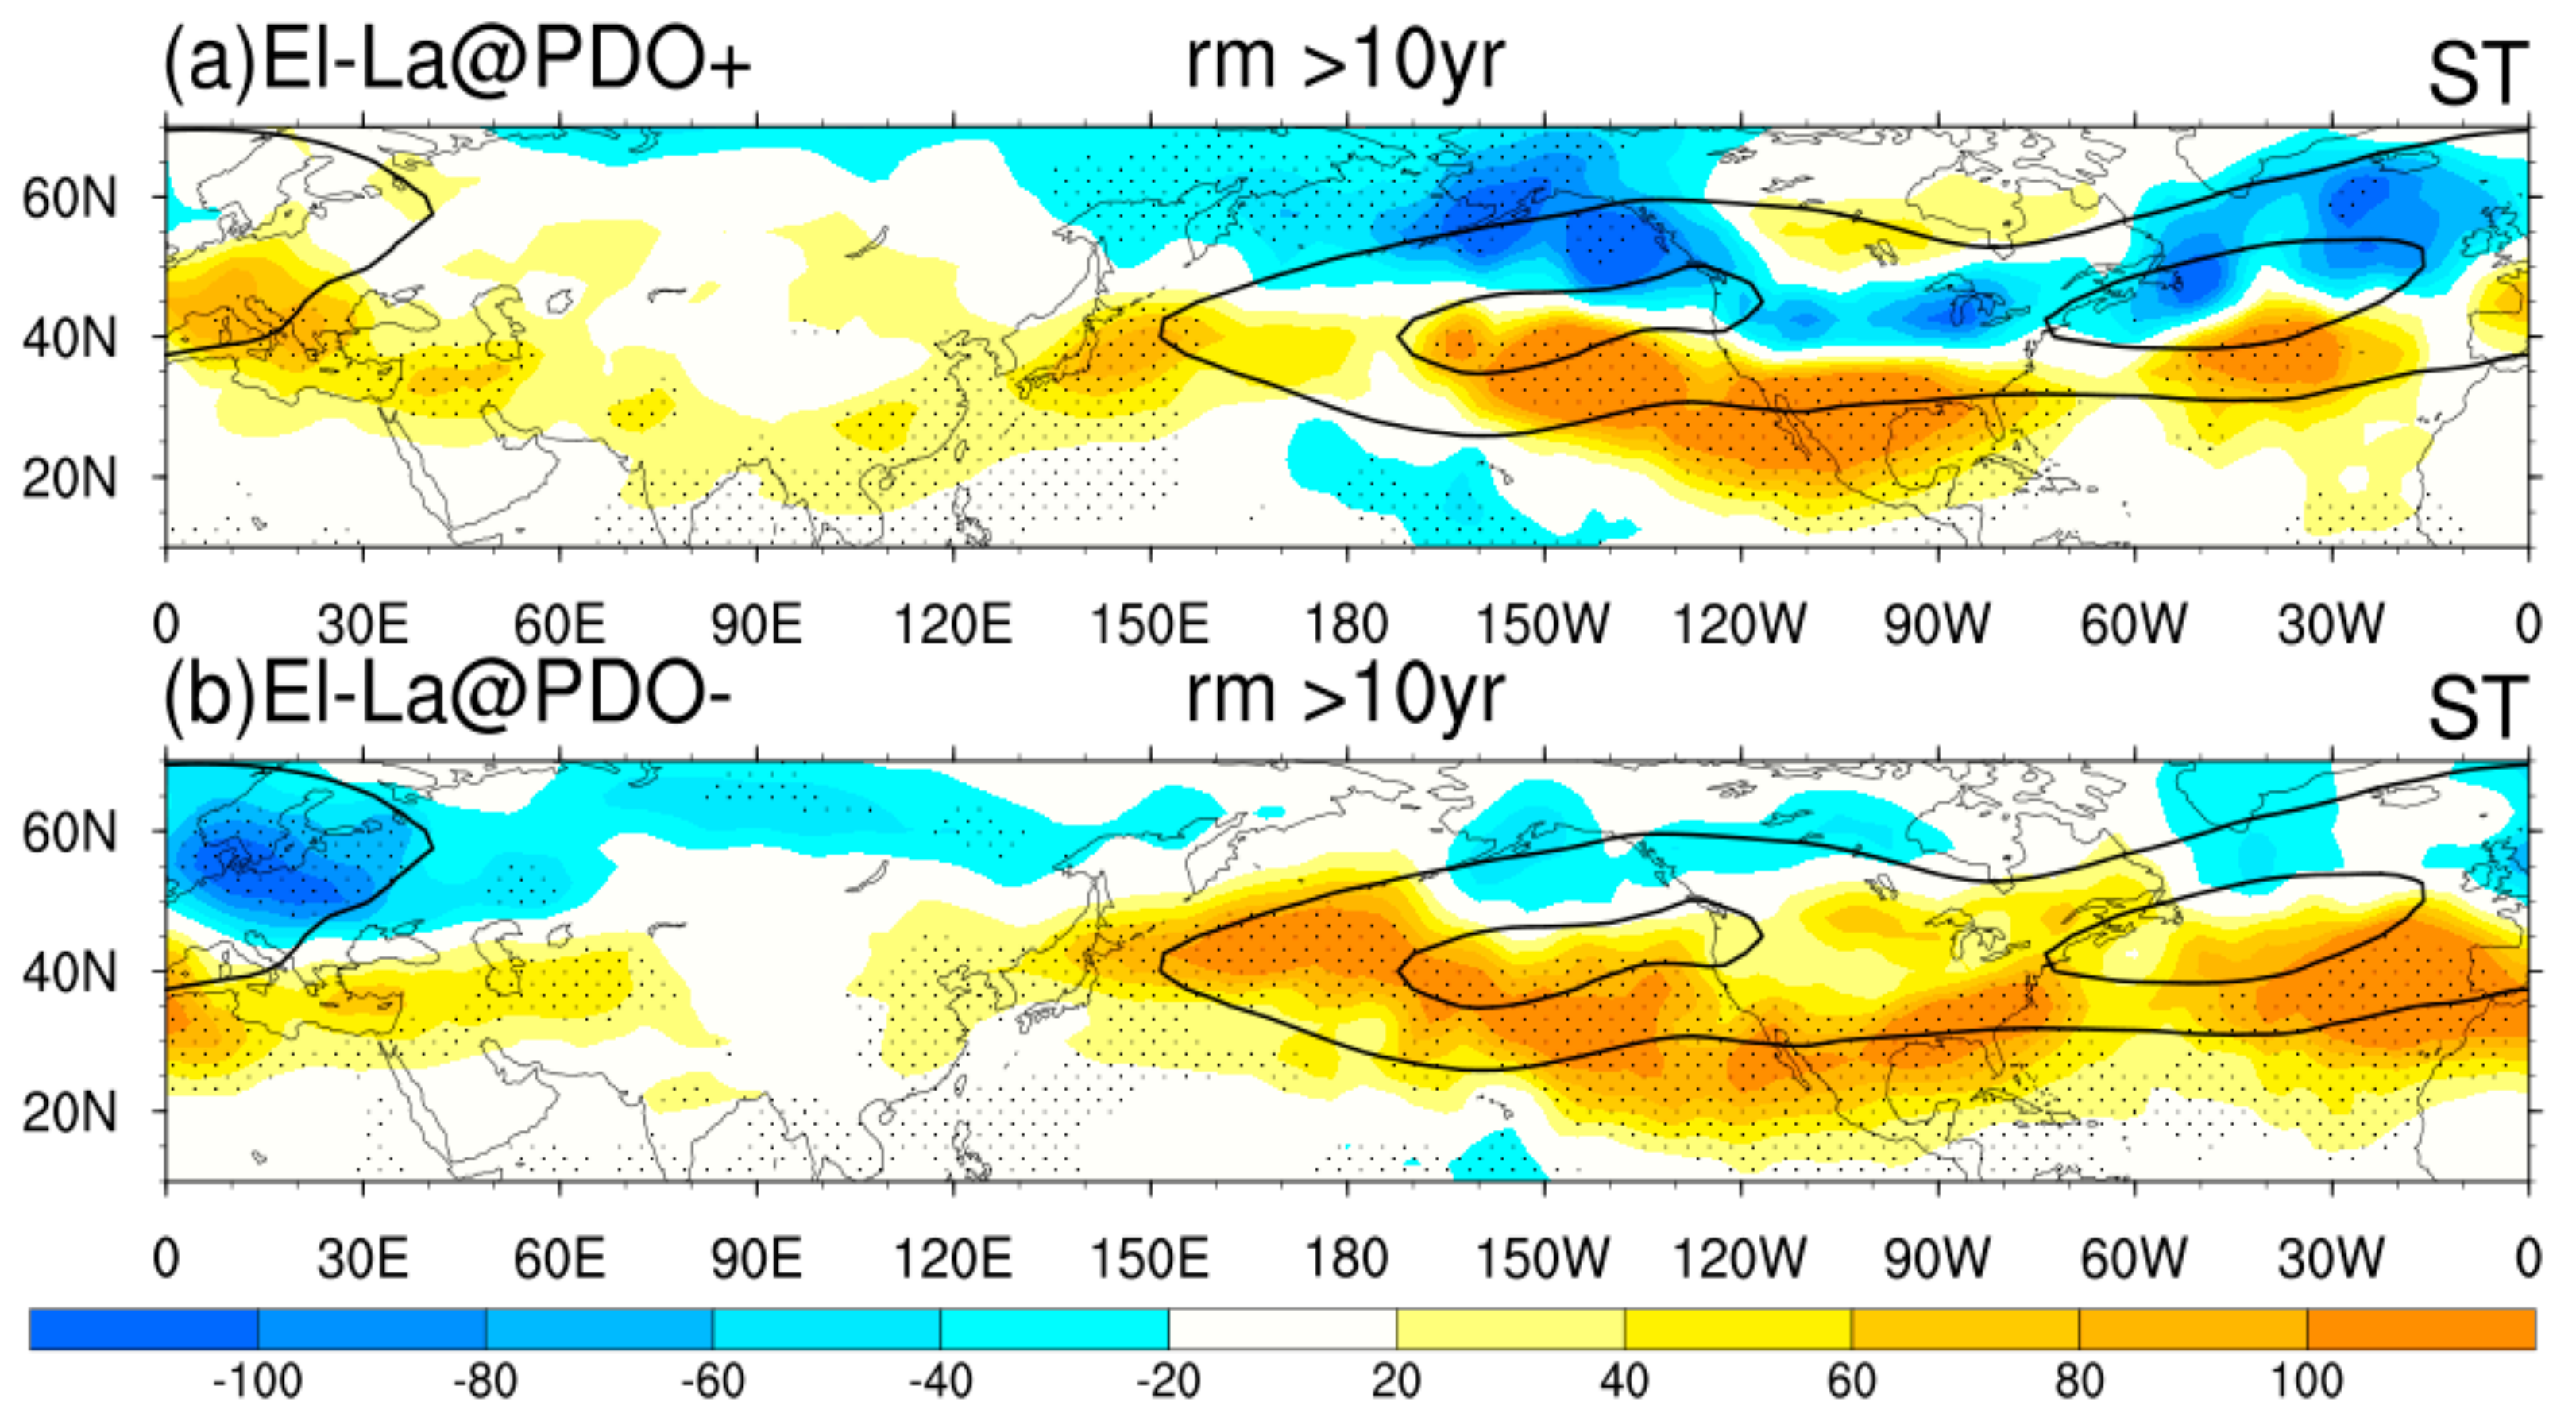
To express the nonlinear behavior of NHST’s response to El Niño/La Niña events in two PDO phases, we divide ENSO events into two categories according to the phase of PDO (Table 1). Here the differences between El Niño and La Niña events in two PDO phases are shown to represent the PDO modulation on the symmetric portion of ENSO’s influence on NHSTs in Figure 5 (the NHSTs’ interdecadal variation of above 10-year timescales has been removed). Note that if the ENSO and PDO storm track responses simply linearly superpose, the above and below panels in Figure 5 should be the same, but it is clear that there are obvious differences. The PST anomalies exhibit a generally parallel band of south-positive and north-negative dipole anomalies when ENSO is in the PDO positive phase, while only the south-positive branch largely presents when ENSO is in the PDO negative phase. A similar situation occurs to the AST anomalies over the Atlantic Ocean. Moreover, the PST anomalies over the north side of the PST climatological entrance perform a largely poleward expansion when ENSO is in the PDO negative phase (Figure 5b). Another noteworthy dipole anomaly occurs in the part of the AST over Europe, and it stretches further to western Asia when ENSO is in the PDO negative phase (Figure 5b), but only positive anomalies are present over the Mediterranean region when ENSO is in the PDO positive phase (Figure 5a).
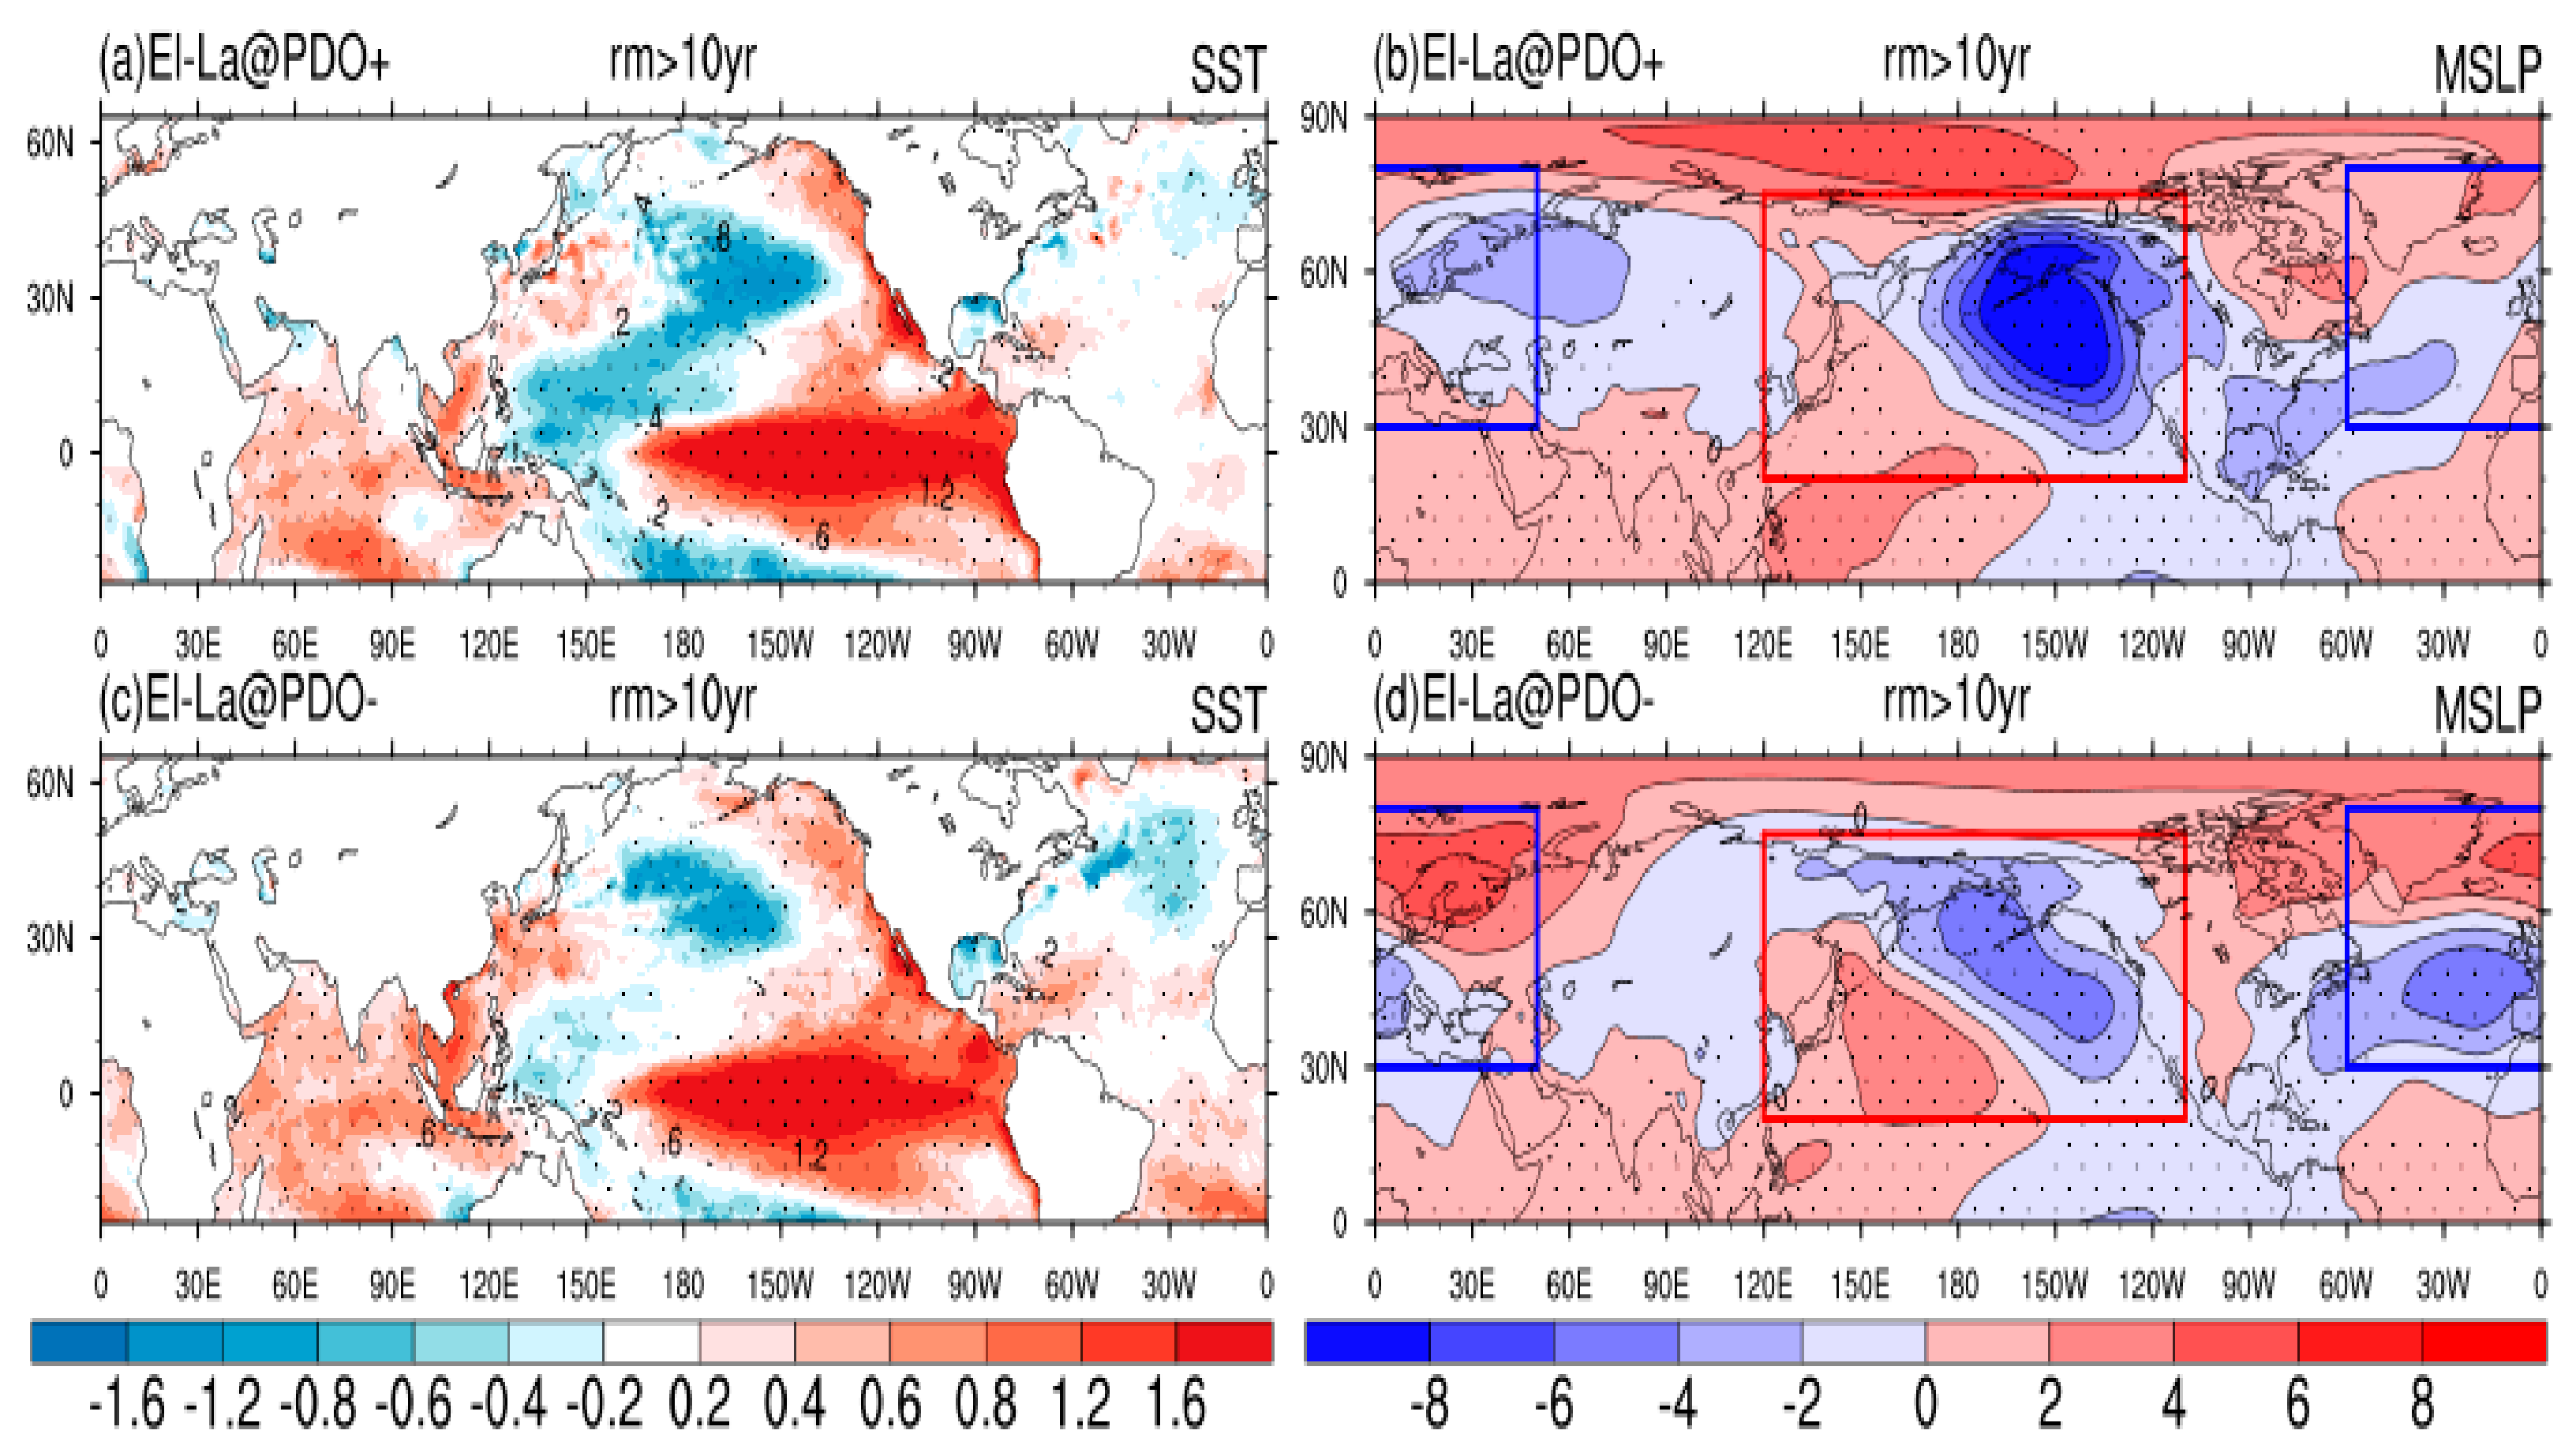
To understand the nonlinear modulation of PDO on ENSO-related NHST anomalies, the corresponding SSTAs and atmospheric anomalies are investigated. In Figure 6, ENSO-related positive SSTAs in the tropical central-eastern Pacific and negative SSTAs in the midlatitude Northern Pacific are observed both in the PDO positive and negative phases, but the SSTA seems colder in the North Pacific and tropical western Pacific in the PDO positive phase. From the composite anomalies of the mean sea level pressure, a large-scale and strengthening cyclonic anomaly occupies the entire Northeast Pacific in the PDO positive phase, suggesting the Aleutian Low is powerful (red box, Figure 6b). The main body of the Northwestern Pacific anticyclone anomaly (NWPA) is confined to the lower latitudes. The NWPA is a key system that bridges ENSO events and the East Asian winter monsoon, generally confined to the lower troposphere [18]. However, the NWPA strengthens and expands (red box, Figure 6d) to middle latitudes and is clearly visible in the mid-troposphere (Figure 7c) in the PDO negative phase. The cyclonic anomaly over the Northeast Pacific is relatively weak in the PDO negative phase, suggesting the Aleutian Low is limited-powerful. Moreover, the negative phase of NAO seems prominent in the PDO negative phase.
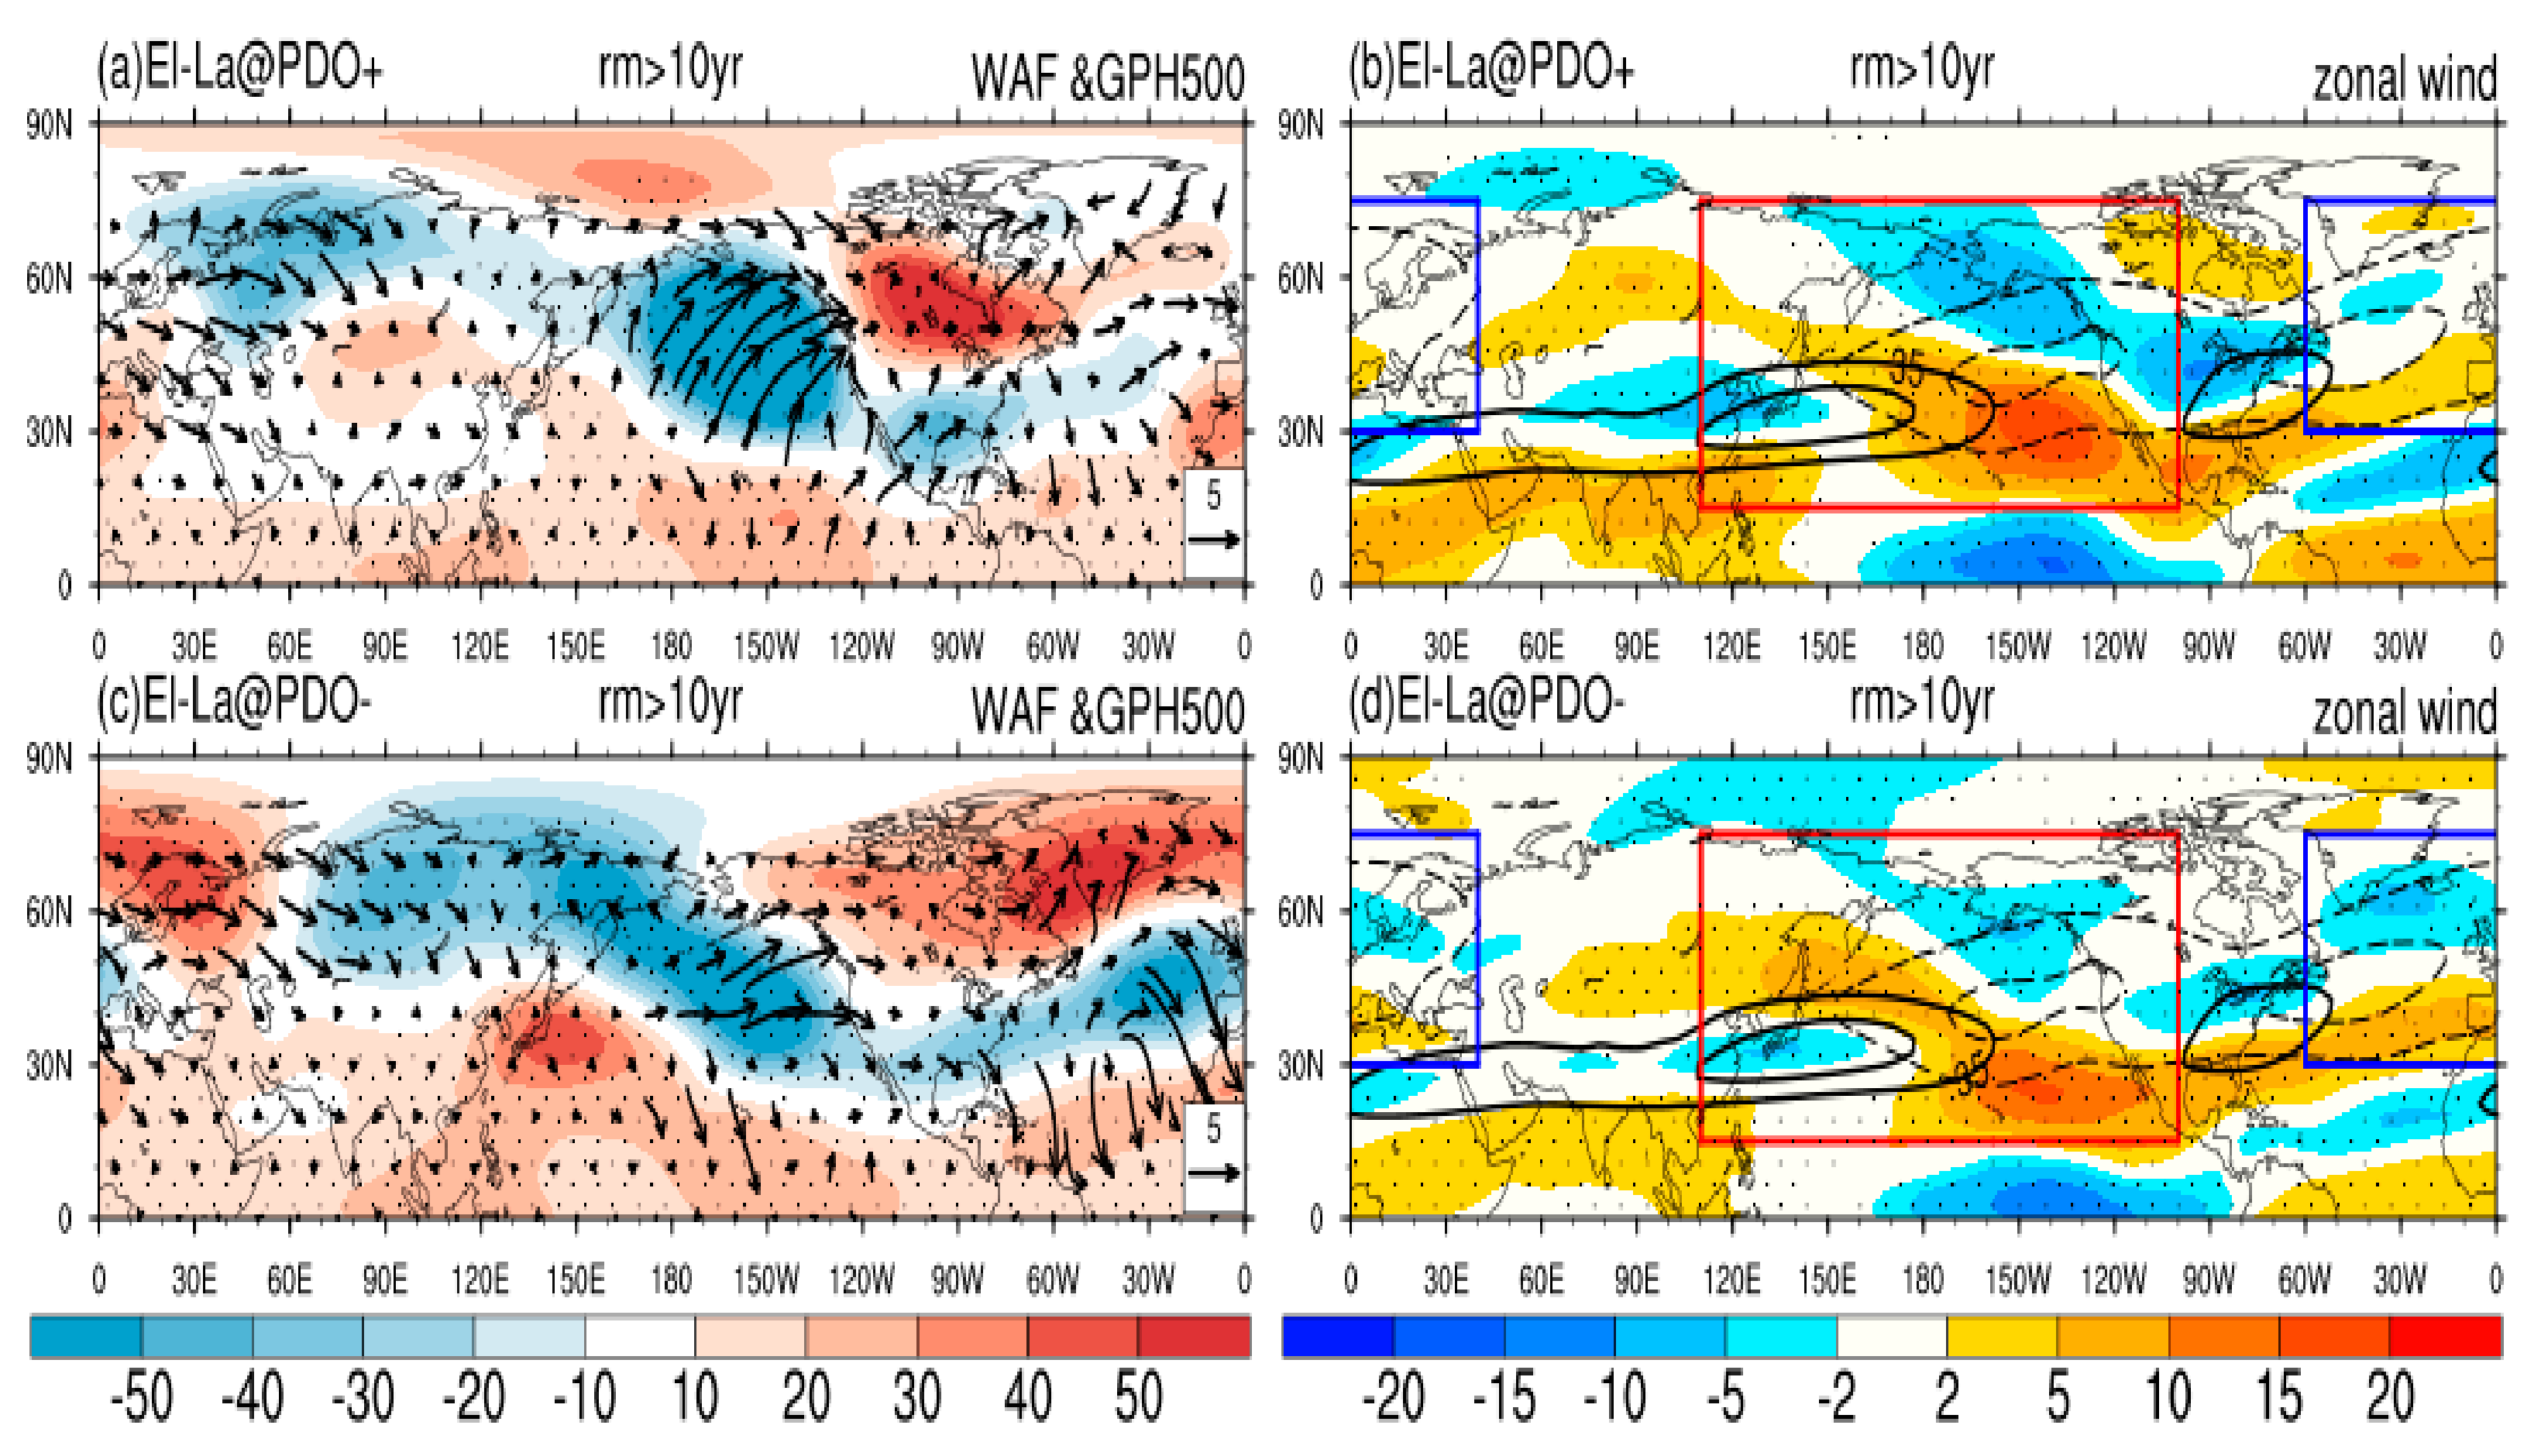
In the condition of such SSTA, the ENSO-related PNA pattern presents in the PDO positive phase (Figure 7a), while a PNA-like pattern and an NAO negative pattern coexist in the PDO negative phase (Figure 7c). The corresponding wave activity flux in El Niño events is also demonstrated. In the PDO positive phase (Figure 7a), the wave activity flux clearly illustrates that wave propagation originates from the tropical eastern and midlatitude northeastern Pacific and propagates eastward, converging into central North America, propagating downstream and diverging both poleward and equatorward over the North Atlantic, extending toward Europe, and weakening over the Eurasian continent. However, in the PDO negative phase (Figure 7c), the wave propagation from the midlatitude northeastern Pacific seems weak, but the diverging over the North Atlantic seems strengthening. Another distinguishing feature is the anticyclonic anomaly over the Northwestern Pacific. The stationary wave flux emanates from its eastern part, propagating eastward toward the cyclonic anomaly over the Northeast Pacific and southeastward to the western part of the anticyclonic anomaly over the tropical central Pacific, suggesting a wave source probably over that region. The midlatitude stationary wave anomalies could benefit the atmospheric teleconnection patterns in ENSO events in the PDO positive and negative phases, respectively.
Accompanying the atmospheric teleconnection patterns, the westerly jet shows corresponding anomalies, respectively (Figure 7b,d). The Pacific jet exhibits a general parallel band of south-positive and north-negative anomalies over the downstream of its climatology, accompanying the strong PNA pattern in the PDO positive phase (red box, Figure 7b), while only south-positive anomalies remain continuously extending to North America accompanying a weak PNA pattern in the PDO negative phase (red box, Figure 7d). In addition, large positive anomalies are present on the north side of Pacific jet climatology in the PDO negative phase, accompanying the strengthening NWPA over the Northwestern Pacific. Over the North Atlantic, the westerly jet dipole anomalies seem stronger over midlatitude, corresponding to the NAO negative pattern in the PDO negative phase (blue box, Figure 7d).
The westerly jet can serve as the waveguide for storm track activities. To their climatology (black contour for jet, dashed for storm tracks in Figure 7b,d), the westerly jet is generally located upstream, while statistical storm track activities are located downstream. Previous studies demonstrate their anomalies perform the characteristics of a symbiotic relationship [2,26]. In the PDO positive phase (comparing Figure 5a and Figure 7b), the general parallel band of Pacific jet anomalies, is consistent with the downstream parallel band of storm track anomalies. In the PDO negative phase (comparing Figure 5b and Figure 7d), the downstream positive anomaly of the Pacific jet, remains continuous, which agrees with the continuously positive anomalies of the PST. The positive anomalies over the north side of the main body of the Pacific jet accompany the storm track anomalies over the north side of the climatological entrance of the PST. Over the Atlantic, the jet anomalies are accompanied by the downstream AST anomalies, especially the AST dipole anomalies over Europe (blue box, Figure 7d). The results demonstrate that the interdecadal modulation of PDO on ENSO’s influence on NHSTs is generally consistent with the mean flow anomalies, suggesting that the NHST’s changes can be understood if the mean flow change can be understood.
In addition, from the view of the baroclinic generation, the midlatitude storm track activities are primarily attributed to atmospheric baroclinicity, which is measured by the Eady growth rate maximum [27]. Since the baroclinic development primarily occurs in the lower troposphere, the climatology and composites of the growth rate maximum between 900 and 800 hPa for El Niño minus La Niña in the PDO positive and negative phases are demonstrated in Figure 8a,c. In the PDO positive phase (Figure 8a), positive anomalies over the climatological main body of the Pacific growth rate maximum present and extend downstream, while largely negative anomalies occur over the Aleutian Islands. It is beneficial to the strengthening south-positive and north-negative dipole anomalies of the Pacific storm tracks in Figure 5a. In the PDO negative phase, largely positive anomalies are present over the north side of the climatology of the growth rate maximum (Figure 8c). They are relatively more remarkable and uniform than that in the PDO positive phase. The anomalies offer baroclinic instability to the generation of downstream-strengthened PST anomalies (Figure 5b). With respect to North America, the baroclinicity dipole anomalies over two sides of the climatological main body of North America’s growth rate maximum seem stronger in the PDO positive phase (Figure 8a), which are contributing to the largely dipole anomalies of the AST in the PDO positive phase (Figure 5a). However, no significant anomalies are visible over the Atlantic Ocean and Europe in both the PDO positive and negative phases.
According to Equation (1), the baroclinicity in the lower troposphere is mainly determined by the vertical wind shear and the Brunt-Vaisala frequency. The corresponding vertical wind shear anomalies are mainly responsible for the growth rate anomalies in both the PDO positive and negative phases (Figure 8b,d), in contrast to the small anomaly of the winter Brunt-Vaisala frequency over the ocean (not shown).
The PDO modulation on the asymmetric portion of ENSO’s influence on NHSTs is also demonstrated by the sum of NHST’s response to El Niño and La Niña in different phases of PDO in Figure 9. From the results, the asymmetric portion mainly occurs in the AST anomalies. In the PDO positive phase (Figure 9a), the largely north-positive and south-negative anomalies of the AST are mainly located over the East Atlantic and its extension. However, the AST positive anomalies are mainly located over Northern Europe, and the negative anomalies are located over North Africa in the PDO negative phase (Figure 9b). Compared to El Niño, La Niña events could largely induce the anomalies over Europe; it is implied that the La Niña events contribute more to the asymmetric portion. So far, the results suggest that the response of NHSTs to ENSO events is nonlinearly modulated by the PDO phase, whether the symmetric or asymmetric portion of the impacts of El Niño and La Niña are being considered. The modulation may be mainly associated with the differences in the response of the SSTA and atmospheric anomalies to ENSO in different PDO phases.

4. Conclusions

The combined impact of strong El Niño–Southern Oscillation (ENSO) and Pacific Decadal Oscillation (PDO) on wintertime Northern Hemisphere storm track activities (NHSTs) has been investigated using ERA-20C reanalysis data. While El Niño/La Niña events cause the entire NHSTs to exhibit a general south/north shift, it is shown that the combined impact of ENSO and PDO on NHSTs varies with the phase of PDO. The relationship between ENSO–PDO and Pacific storm track (PST) anomalies is intensified when ENSO and PDO are in phase; i.e., the PST anomalies largely strengthen (decrease) equatorward and downstream when both ENSO and PDO are in the positive (negative) phase. However, the PST anomalies tend to be weakened when ENSO and PDO are out of phase. In contrast, the generally opposite situation occurs in AST anomalies, which display strengthening dipole patterns when ENSO and PDO are out of phase. Apparently, the combined impact on NHSTs is roughly a linear superposition of ENSO, PDO-only impact. Nevertheless, they are not identical, suggesting nonlinear behavior between El Niño/La Niña under PDO’s influence.
Further analysis indicates that the impact of ENSO on the NHSTs is nonlinearly modulated by the PDO phase. The PST and its extension exhibit a general parallel band of south-positive and north-negative anomalies when ENSO is in the PDO positive phase, while only the south-positive branch largely remains when ENSO is in the PDO negative phase. Moreover, PST anomalies over the north side of the PST climatological entrance expand poleward and strengthen when ENSO is in the PDO negative phase. AST anomalies over the Atlantic Ocean exhibit a parallel band of south-positive and north-negative patterns when ENSO is in the PDO positive phase, but only the south portion largely remains when ENSO is in the PDO negative phase. In addition, the AST anomalies over Europe perform noteworthy dipole anomalies and stretch further to western Asia when ENSO is in the PDO negative phase.
Our analyses suggest that the nonlinear modulations may be mainly accounted for by the differences in atmospheric circulation anomalies and the SSTAs response to ENSO events in two PDO phases. The midlatitude atmospheric circulation anomalies under the influence of ENSO-related tropical SSTAs in two PDO phases are distinguished. The ENSO-related PNA pattern presents in the PDO positive phase, while a PNA-like pattern and an NAO negative pattern coexist in the PDO negative phase. When ENSO is in the PDO positive phase, the strengthening PNA pattern is accompanied by a continuous parallel band of Pacific jet anomalies, which leads to a downstream parallel band of storm track anomalies. When ENSO is in the PDO negative phase, the PNA pattern seems limited strengthening, and the accompanying Pacific jet anomalies on the poleward side exhibit less coherence. Meanwhile, the subtropical NWPA strengthens in the PDO negative phase, and a part of the Pacific jet anomalies strengthen over the north side of the climatology of the Pacific jet. Such jet anomalies contribute to the PST anomalies over the Northwest Pacific in the PDO negative phase.
In addition, ENSO-related midlatitude SSTAs in two PDO phases are also beneficial for storm track anomalies. The possible anchor effect of the midlatitude ocean frontal zone to maintain lower atmospheric baroclinicity anomalies and energize transient eddy anomalies from the view of baroclinic generation is suggested in the companion study of Chu et al. [6]. When ENSO is in the PDO positive phase, positive anomalies over the climatological main body of the Pacific growth rate maximum occur and extend downstream, while largely negative anomalies present over the Aleutian Islands. It is beneficial to the strengthening of south-positive and north-negative dipole anomalies of PST. When ENSO is in the PDO negative phase, largely positive anomalies are present over the north side of the climatological main body of the growth rate maximum, which is anchored by a strengthened subarctic frontal zone. They are relatively more remarkable and uniform than what is found in the PDO positive phase. The anomalies offer baroclinic instability to the generation of downstream strengthened PST anomalies.

5. Discussion

The combined impact of ENSO and PDO on AST anomalies may be related to North Atlantic Oscillation (NAO) variability. For the decadal variability, the PDO and NAO experienced similar regime shifts around the end of the 1970s, from the negative phase to the positive phase in Figure 10, and it is consistent with previous studies [28]. The consistent decadal transition of PDO and NAO is another interesting question out of this work. For the interannual variability, Li and Lau [29] suggested that there are more occurrences of the positive phase of the NAO pattern in La Niña and the negative phase in El Niño events. Our analysis demonstrates that the positive phase of the NAO pattern is strengthened when La Niña (El Niño) occurs in the PDO positive (negative) phase, thus affecting the AST anomalies.
Midlatitude cyclones are responsible for many high-impact weather events, including extreme precipitation, extreme cold, and high wind. However, not all extreme regional precipitation/cold is caused by storm track activities. Ning and Bradley [30] analyze the variability of winter precipitation over the northeastern United States and the corresponding teleconnections with five dominant large-scale modes of climate variability (AMO, NAO, PNA, PDO, ENSO). Multiple linear regression models generated using the indices of all five modes of climate variability show higher explained variance. On the interannual timescale, storm tracks change in response to the ENSO cycle. Nevertheless, our results indicate PDO variation should be considered relevant to NHSTs interannual anomalies. It is necessary to further investigate the dynamics behind storm activities and extreme weather events in observations and improve model simulations and the prediction accuracy of extreme events caused by storm tracks. Extreme weather events caused by the internal variability of climate systems may also affect the sustainable development of human society like global warming, including extreme floods or droughts, causing food crises and water shortages. Accurate prediction, early warning, and reasonable resource arrangement may contribute to mitigating the impact of extreme weather caused by NHSTs.
Transient eddy activities are fundamental dynamical issues that cannot be overemphasized in the midlatitude bands. They are involved in not only the complex eddy–mean flow interaction but also the midlatitude air–sea interaction. Compared with other studies that focus on atmospheric teleconnections, this work highlights the response of transient eddy activities to ENSO in PDO variations from mathematical linear superposition and nonlinear modulation, and it provides further evidence for understanding possible nonlinear modulation physically. To some extent, the results of this study enrich the knowledge of the responses of storm track activities to tropical and midlatitude SSTAs influence. However, the decadal variation employed here spans only 60 years, a PDO cycle available for observational study. In a 1000-year climate model study of the combined Pacific interannual ENSO and decadal–interdecadal PDO variability [31], the Pacific storm track shifts southward with a positive PNA for the in-phase combination of ENSO and PDO, confirming the observational results. Further coupled model experiments are required to better understand the dynamical processes of oceanic frontal zones affecting the atmospheric boundary layer.

Author Contributions

Formal analysis, C.C.; Investigation, X.R., J.F. and H.H.; Methodology, C.C. and X.S.; Resources, E.K.M.C.; Software, X.S.; Supervision, X.-Q.Y., X.R. and E.K.M.C.; Writing—original draft, C.C.; Writing—review and editing, C.C. and H.H. All authors have read and agreed to the published version of the manuscript.

Funding

The work was jointly funded by the National Key R&D Program of China (2022YFE0106600) and the National Natural Science Foundation of China (Grant No. 41505059 and 41775074). We would like to thank ECMWF, NOAA, and JISAO for available dataset.

Institutional Review Board Statement

Not applicable.

Informed Consent Statement

Not applicable.

Data Availability Statement

Data are contained within the article.

Conflicts of Interest

The authors declare no conflict of interest.

References

  1. Blackmon, M.L. A climatological spectral study of the 500 mb geopotential height of the Northern Hemisphere. J. Atmos. Sci. 1976, 33, 1607–1623. [Google Scholar] [CrossRef]
  2. Chang, E.K.M.; Lee, S.; Swanson, K.L. Storm track dynamics. J. Clim. 2002, 15, 2163–2183. [Google Scholar] [CrossRef]
  3. Chang, E.K.M.; Zheng, C.; Lanigan, P.; Yau, A.M.W.; Neelin, J.D. Significant modulation of variability and projected change in California winter precipitation by extratropical cyclone activity. Geophys. Res. Lett. 2015, 42, 5983–5991. [Google Scholar] [CrossRef]
  4. Lu, J.; Greatbatch, R.J. The changing relationship between the NAO and Northern Hemisphere climate variability. Geophys. Res. Lett. 2002, 29, 52-1–52-4. [Google Scholar] [CrossRef]
  5. Feser, F.; Barcikowska, M.; Krueger, O.; Schenk, F.; Weisse, R.; Xia, L. Storminess over the North Atlantic and northwestern Europe-a review. Q. J. R. Meteorol. Soc. 2015, 141, 350–382. [Google Scholar] [CrossRef]
  6. Chu, C.J.; Hu, H.B.; Yang, X.-Q.; Yang, D.J. Midlatitude Atmospheric transient eddy feedbacks influenced ENSO-associated wintertime Pacific teleconnection patterns in two PDO phases. Clim. Dyn. 2020, 54, 2577–2595. [Google Scholar] [CrossRef]
  7. Nakamura, H.; Sampe, T.; Goto, A.; Ohfuchi, W.; Xie, S.P. On the importance of midlatitude oceanic frontal zones for the mean state and dominant variability in the tropospheric circulation. Geophys. Res. Lett. 2008, 35, L15709. [Google Scholar] [CrossRef]
  8. Kobashi, F.; Xie, S.P.; Iwasaka, N.; Sakamoto, T. Deep atmospheric response to the North Pacific oceanic subtropical front in spring. J. Clim. 2008, 21, 5960–5975. [Google Scholar] [CrossRef]
  9. Zhang, Y.; Held, I.M. A linear stochastic model of a GCM’s midlatitude storm tracks. J. Atmos. Sci. 1999, 56, 3416–3435. [Google Scholar] [CrossRef]
  10. Son, S.-W.; Ting, M.F.; Polvani, L.M. The effect of topography on storm-track intensity in a relatively simple general circulation model. J. Atmos. Sci. 2009, 66, 393–411. [Google Scholar] [CrossRef]
  11. Shaw, T.A.; Baldwin, M.; Barnes, E.A.; Caballero, R.; Garfinkel, C.I.; Hwang, Y.-T.; Li, C.; O’Gorman, P.A.; Rivière, G.; Simpson, I.R. Storm track processes and the opposing influences of climate change. Nat. Geosci. 2016, 9, 656–664. [Google Scholar] [CrossRef]
  12. Straus, D.M.; Shukla, J. Variations of midlatitude transient dynamics associated with ENSO. J. Atmos. Sci. 1997, 54, 777–790. [Google Scholar] [CrossRef]
  13. Zhu, W.J.; Sun, Z.B.; Zhou, B. The impact of Pacific SSTA on the interannual variability of Northern Pacific storm track during in winter. Adv. Atmos. Sci. 2001, 18, 1029–1042. [Google Scholar]
  14. Hoerling, M.P.; Kumar, A. Atmospheric response patterns associated with tropical forcing. J. Clim. 2002, 15, 2184–2203. [Google Scholar] [CrossRef]
  15. Liu, Z.Y.; Alexander, M. Atmospheric bridge, oceanic tunnel, and global climatic teleconnections. Rev. Geophys. 2007, 45, RG2005. [Google Scholar] [CrossRef]
  16. Alexander, M.A.; Bladé, I.; Newman, M.; Lanzante, J.R.; Lau, N.-C.; Scott, J.D. The atmospheric bridge: The influence of ENSO teleconnection on air–sea interaction over the global oceans. J. Clim. 2002, 15, 2205–2231. [Google Scholar] [CrossRef]
  17. Horel, J.D.; Wallace, J.M. Planetary scale phenomena associated with the Southern Oscillation. Mon. Weather Rev. 1981, 109, 813–829. [Google Scholar] [CrossRef]
  18. Wang, B.; Wu, R.G.; Fu, X. Pacific–East Asian teleconnection: How does ENSO affect East Asian climate. J. Clim. 2000, 13, 1517–1536. [Google Scholar] [CrossRef]
  19. Mantua, N.J.; Hare, S.R.; Zhang, Y.; Wallace, J.M.; Francis, R.C. A Pacific interdecadal climate oscillation with impacts on salmon production. Bull. Amer. Meteor. Soc. 1997, 78, 1069–1079. [Google Scholar] [CrossRef]
  20. Yu, B.; Shabbar, A.; Zwiers, F.W. The enhanced PNA-like climate response to Pacific interannual and decadal variability. J. Clim. 2007, 20, 5285–5300. [Google Scholar] [CrossRef]
  21. Hu, Z.-Z.; Huang, B. Interferential impact of ENSO and PDO on dry and wet conditions in the U.S. Great Plains. J. Clim. 2009, 22, 6047–6065. [Google Scholar] [CrossRef]
  22. Poli, P.; Hersbach, H.; Dee, D.P. ERA-20C: An atmospheric reanalysis of the twentieth century. J. Clim. 2016, 29, 4083–4097. [Google Scholar] [CrossRef]
  23. Zhang, Y.; Wallace, J.M.; Battisti, D.S. ENSO-like interdecadal variability: 1900–93. J. Clim. 1997, 10, 1004–1020. [Google Scholar] [CrossRef]
  24. Wallace, J.M.; Lim, G.H.; Blackmon, M.L. Relationship between cyclone tracks, anticyclone tracks, and baroclinic waveguides. J. Atmos. Sci. 1988, 45, 439–462. [Google Scholar] [CrossRef]
  25. Takaya, K.; Nakamura, H. A formulation of a phase-independent wave-activity flux for stationary and migratory quasigeostrophic eddies on a zonally-varying basic flow. J. Atmos. Sci. 2001, 58, 608–627. [Google Scholar] [CrossRef]
  26. Cai, M.; Mak, M. Symbiotic relation between planetary and synoptic-scale waves. J. Atmos. Sci. 1990, 47, 2953–2968. [Google Scholar] [CrossRef]
  27. Hoskins, B.J.; Valdes, P.J. On the existence of storm tracks. J. Atmos. Sci. 1990, 47, 1854–1864. [Google Scholar] [CrossRef]
  28. Chelliah, M.; Bell, G.D. Tropical multidecadal and interannual climate variability in the NCEP-NCAR Reanalysis. J. Clim. 2004, 17, 1777–1803. [Google Scholar] [CrossRef]
  29. Li, Y.; Lau, N.-C. Impact of ENSO on the atmospheric variability over the North Atlantic in late winter-role of the transient eddies. J. Clim. 2012, 25, 320–342. [Google Scholar] [CrossRef]
  30. Ning, L.; Bradley, R.S. Winter precipitation variability and corresponding teleconnections over the northeastern United States. J. Geophys. Res. 2014, 119, 7931–7945. [Google Scholar] [CrossRef]
  31. Yu, B.; Zwiers, F.W. The impact of combined ENSO and PDO on the PNA climate: A 1000-year climate modeling study. Clim. Dyn. 2007, 29, 837–851. [Google Scholar] [CrossRef]
Figure 1. Composites of storm track activity anomalies for (a) El Niño and (b) La Niña (shaded, unit: m2s−2), (c) differences between El Niño and La Niña (shading), and the climatology of storm track activities (contoured from 100 to 150 by 50 m2s−2). Stippling denotes statistical significance at the 5% level, based on Student’s t-test.
Sustainability 15 16565 g001
Figure 2. As Figure 1, but for PDO: (a) positive and (b) negative phase.
Sustainability 15 16565 g002
Figure 3. Composites of storm track activity anomalies (shaded, unit: m2s−2) for (a,c) El Niño and (b,d) La Niña in (a,b) the PDO positive and (c,d) negative phase, and the climatology (contoured from 100 to 150 by 50 m2s−2). Stippling denotes statistical significance at the 5% level, based on Student’s t-test.
Sustainability 15 16565 g003
Figure 4. Linear superposition of storm track activity anomalies for El Niño/La Niña in Figure 1 and the PDO positive/negative phase in Figure 2.
Sustainability 15 16565 g004
Figure 5. Composites of storm track activity anomalies (shaded, unit: m2s−2) for El Niño minus La Niña in (a) the PDO positive and (b) negative phase and the climatology (contoured from 100 to 150 by 50 m2s−2). Stippling denotes statistical significance at the 5% level, based on Student’s t-test.
Sustainability 15 16565 g005
Figure 6. Composites of (a,c) the sea surface temperature anomalies (shaded, unit: K), (b,d) mean surface level pressure (shaded, unit: hPa) between El Niño and La Niña in (a,b) PDO positive and (c,d) negative phases. Stippling denotes statistical significance at the 5% level, based on Student’s t-test.
Sustainability 15 16565 g006
Figure 7. Same as Figure 6, but for (a,c) the geopotential height (shaded, unit: m) and wave activity flux (vector) at 500 hPa and (b,d) zonal wind at 300 hPa (shaded, unit: ms−1). The vector is the composite mean of the wave activity flux at 500 hPa for El Niño events in the PDO (a) positive and (c) negative phases. The curve in (b,d) is the climatology of storm track activities (dashed from 100 to 150 by 50 m2s−2) and the westerly jet (black contoured from 40 to 60 by 20 ms−1). Stippling denotes statistical significance at the 5% level, based on Student’s t-test.
Sustainability 15 16565 g007
Figure 8. Same as Figure 6, but for (a,c) the Eady growth rate maximum (shaded, unit: day−1) and (b,d) vertical wind shear between 900 and 800 hPa (shaded, unit: day−1) and their climatology (Eady growth rate contoured from 0.5 to 1.5 by 0.5 day−1 and the vertical wind shear contoured from 60 to 500 by 200 day−1), respectively. Stippling denotes statistical significance at the 5% level, based on Student’s t-test.
Sustainability 15 16565 g008
Figure 9. Composites of storm track activity anomalies (shaded, unit: m2s−2) for El Niño plus La Niña in (a) PDO positive and (b) negative phases, and the climatology (contoured from 100 to 150 by 50 m2s−2). Stippling denotes statistical significance at the 5% level, based on Student’s t-test.
Sustainability 15 16565 g009
Figure 10. The annual mean standardized values for the PDO index (histogram). The annual PDO index after the application of a 10-year low-pass filter (red curve), and the annual NAO index (PC-based) after the application of a 10-year low-pass-filter (blue curve).
Sustainability 15 16565 g010
Table 1. Classification of strong ENSO events based on the phases of ENSO and PDO for 1950–2010.
PDO PositivePDO Negative
El Niño1982/83, 1986/87, 1987/88, 1991/92, 1997/98, 2002/031953/54, 1957/58, 1963/64, 1965/66, 1968/69, 1972/73, 2009/10
La Niña1984/85, 1988/89, 1995/96, 1998/991955/56, 1970/71, 1973/74, 1975/76, 1999/2000, 2007/08
Disclaimer/Publisher’s Note: The statements, opinions and data contained in all publications are solely those of the individual author(s) and contributor(s) and not of MDPI and/or the editor(s). MDPI and/or the editor(s) disclaim responsibility for any injury to people or property resulting from any ideas, methods, instructions or products referred to in the content.