Article

Confidence in Greenhouse Gas Emission Estimation: A Case Study of Formaldehyde Manufacturing

by
Ernesto C. Marujo
1,2,*,
José R. U. C. Almeida
3,
Luiz F. L. Souza
3,
Alan R. S. P. Costa
3,
Paulo C. G. Miranda
2,
Arthur A. Covatti
2,
Solange G. Holschuch
2 and
Potira M. S. Melo
2
1
Departament of Fundamental Sciences, Instituto Tecnologico de Aeronautica, Sao Jose dos Campos 12228-900, SP, Brazil
2
DEEP Brasil Informação e Tecnologia S/A, Sao Jose dos Campos 12243-380, SP, Brazil
3
Copenor, Companhia Petroquímica do Nordeste, Camacari 42816-200, BA, Brazil
*
Author to whom correspondence should be addressed.
Sustainability 2023, 15(24), 16578; https://doi.org/10.3390/su152416578
Submission received: 14 August 2023 / Revised: 30 October 2023 / Accepted: 31 October 2023 / Published: 6 December 2023
(This article belongs to the Section Air, Climate Change and Sustainability)

Abstract

:
In this article, we discuss the uncertainties involved in the models and in the measurements necessary to estimate the emissions of greenhouse gases (GHG) in a chemical industry. When these uncertainties cannot be neglected and some measurements exhibit correlations with others, estimating the final emission is not a trivial task. Even if we intend to determine a simple point estimate for the mean emissions, we will need to use the average values of the measurements as well as information about their uncertainties and correlations in complex computations. To solve this problem, we propose a Monte Carlo method to estimate the mean and confidence interval of CO2 emissions in the context of uncertainties and correlations. We validated our approach through a case study involving a traditional chemical company in Brazil. Our results indicated that previously, there was an overestimation of the emission because the company did not consider uncertainties and correlations. The overestimation was modest since the parameters involved present relatively little uncertainty, but the bias effect was clear. This research has demonstrated the importance of accounting for uncertainties and correlations in emission estimates, providing a practical framework for analyses in industrial settings.

1. Introduction

Companies around the world are being encouraged and, in some cases, required to measure and report their greenhouse gas emissions (GHG) [1]. Proper accounting of GHG emissions allows investors and other stakeholders to assess the risks and opportunities related to investment decisions and to evaluate the company’s commitments to net-zero carbon emissions goals [2,3,4].
The Intergovernmental Panel on Climate Change (IPCC) leads an effort to develop guidelines to standardize the calculation and reporting of GHG emissions and inventories [5]. Although the procedures are based on data and statistical parameters [6], the IPCC [7] emphasizes that there may be uncertainties in estimating emission factors.
Companies that are more attuned to market changes are adopting procedures and indicators to measure environmental impacts, which allow them to ensure the quality of their ESG actions (environmental, social, and governance) and report their commitments to sustainable development. Faulty, ambiguous, or imprecise measurements and indicators can generate criticism and associate a company with “greenwashing” [8].
In this study, we examine the process of estimating GHG emissions from a formaldehyde producer, highlighting the challenges related to addressing uncertainties and deviations involved. The case is particularly interesting since many variables, possibly correlated, are evaluated to arrive at a final estimate of emissions. It is important to note that, when there are correlations among variables, evaluating uncertainties in the resulting emissions is not trivial.
Carotenuto et al. [9] state, “The uncertainties associated with each step in compiling emission inventories typically accumulate, although it is complicated to estimate the total effect due to the difficulty in determining the uncertainty in each step and how uncertainties interact with each other”. Furthermore, uncertainties may change over time as activities that produce emissions improve and sources become better characterized [10,11].
Uncertainty analysis is an important aspect of Life Cycle Assessment (LCA), a widely used method for evaluating the energy efficiency and environmental impact of products, services, and processes, from raw material production to end-of-life management of a service or product [12,13].
Park et al. [14] used the error propagation method to identify the main input parameters affecting the uncertainty of carbon footprint results for dairy farms in Korea. Similarly, Igos et al. [15] discuss the importance of uncertainties in LCA studies. Marujo et al. [16] studied uncertainties and deviations in the estimates of a company’s GHG inventory when there are significant correlations among emissions from various sources.
The objective of this study is to investigate how the uncertainties typically present in the operations data of an industrial plant must be considered to determine unbiased and precise estimates of its greenhouse gas emissions. We focused on the case where emissions are a function of the product of many random variables that are subject to variability. In such cases, the expected emission cannot be determined by simply multiplying the expected values due to the phenomenon known as the propagation of variance. Variances and covariances must be included in the calculation. The procedure we propose is based on the Monte Carlo method, and a specific algorithm was developed for the calculations. The procedure was applied to a real-life case study of an industrial plant dedicated to formaldehyde production.
In the Materials and Methods section, we present the necessary steps to estimate the direct emissions from the formaldehyde production plant. We demonstrate that, even for the point estimate of the emission average, the calculation is not straightforward, and we provide a procedure to obtain the mean and variance of the emission.
Finally, in the Results, Discussion, and Conclusion sections, we illustrate the method’s application in a real case and discuss the limitations of the proposed method, as well as potential applications for future studies. We end this article by arguing that this study will contribute to the assessment and quantification of uncertainties in emissions from an industrial plant and present suggestions for ways to improve the accuracy of these estimates.

2. Materials and Methods

2.1. Scope of Analysis

The case that motivated this study refers to the formaldehyde production process of Copenor, a chemical company that has been operating since 1986 in the municipality of Camaçari, Bahia, Brazil. Copenor is recognized as a leader in ESG practices in Brazil and holds certificates that attest to the conformity of its quality and environmental management systems, including health and safety at work. Moreover, the company invests in technology and innovation to improve its processes and reduce the environmental impact of its activities.
Currently, its industrial plant has three active operational units, two of which produce formaldehyde based on metal or silver oxide catalysts, a hexamethylenetetramine unit, and methanol tanks for consumption and resale.
Our analysis refers to the main unit of the plant, called formaldehyde oxide, or simply oxide route, about the catalyst, based on molybdenum oxide and iron molybdate, used in the reaction.
Formaldehyde is a chemical compound used as a stabilizing, bactericidal, and plasticizing agent, as well as a component of synthetic resins, in agricultural production chains and a variety of industries, including textiles, leather, rubber, cosmetics, and pharmaceuticals [17]. Due to its wide range of applications, formaldehyde is produced on a large scale worldwide, totaling approximately 25 to 27 million metric tons annually. The consumption rate of this product has maintained a notable consistency over the past two decades, indicating its significance and continuous demand in industrial sectors [18].
The most efficient formaldehyde production process, in terms of conversion and yield, is the one that uses iron oxide and molybdenum as catalysts, with a conversion rate above 92%. Alternative processes that use metallic silver as a catalyst are less efficient and produce more carbon dioxide equivalent (CO2e).
According to the GHG Protocol [19], our analysis is in a category called “Direct Emissions” and is included in Scope 1. The period of analysis corresponds to the year 2021.

2.2. The Formaldehyde Production Process through the “Oxide Route”

Formaldehyde is obtained by the partial oxidation of methanol in the gaseous phase using a fixed-bed reactor with a catalyst made of molybdenum oxide and iron molybdate (Equation (1)). The concentration of methanol is kept at controlled levels between 4% and 9% of volume to avoid the formation of explosive mixtures and to ensure an atmosphere suitable for oxidation. The heat generated by the reaction is removed from the reactor by boiling a heat transfer fluid (HTF), which is used for steam generation.
The actual yield of formaldehyde ranges from 91% to 94% of the theoretical maximum. The loss of methanol is expressed by measuring the unreacted methanol and the presence of carbon monoxide, dimethyl ether, and small amounts of formic acid present in the formaldehyde stream.
The oxidation of methanol occurs on the surface of the catalyst inside the tubes of the R-3006 reactor. When the gaseous mixture reaches the heated catalyst layer, the reaction starts, and the temperature rapidly increases, reaching its maximum point. As the methanol is completely reacted with, the temperature tends to approach the HTF boiling point.
The reaction gas is redirected from the bottom of the reactor to the vaporizer H-3004. The remaining gases at the top of the column are directed to the absorber tower C-5004. The exhaust gas from the top of C-5004 is divided between the emission control system (ECS) and the fans F-2008 and F-2009 in series. The amount of gas sent to the ECS is controlled by the oxygen content control valve, AV-30023. The gas recirculation and fresh air proportion control valves are adjusted to maintain a constant oxygen concentration after the fans.
Then, the exhaust gas is sent to the chemical incinerator R-5506, where it is oxidized over a platinum-based catalyst bed. During the exothermic reaction, the temperature increases, and the outlet gas is cooled through heat exchange with a water boiler. The single source of emissions from the formaldehyde oxide unit is reactor R-3006.

2.3. The Method to Estimate Direct Emissions in Formaldehyde Production

The direct emissions were estimated using measurements and approximate calculations. The basic stoichiometric relationship to produce formaldehyde (HCHO) from methanol (CH3OH) is shown in Equation (1):
CH 3 OH + ½ O 2     Δ H   HCHO   +   H 2 O                           Δ H = 159   kJ / mol
Note that the reaction does not produce any GHG. However, in an industrial environment, the reaction is not perfect, generating some waste that needs to be burned, and it is also influenced by the so-called “parallel reactions,” which depend on the quality of catalysts and other factors. Therefore, because of the complexity of the many reactions involved, GHG emissions are determined using direct measurements in the purging stream that are monitored by the emission control system. Thus, we determine the emissions resulting from the industrial process using a formula that has as its inputs the concentration of CO2 in the exhaust gases (measured by chromatography), temperature, production hours, and average daily production rate. This method was devised to calculate the CO2 emissions arising from the partial conversion of methanol into formaldehyde. The formula is based on the value of the CO2 concentration measured in the gas exhaustion tower and incorporates adjustment factors to account for variations in temperature and gas flow speed.
The mass of CO2 emitted during a certain period is estimated by Equation (2).
M = Q m e a n · V · h · r · k
where:
  • M = mass of CO2 emitted during the period (in t).
  • Qmean = average hourly flow rate during the period (in N m3/h).
  • V = CO2 concentration in exhaust gases (in N m3/N m3).
  • h = number of production hours during the period (in hours).
  • r = conversion factor from Nm3 of CO2 to tons of CO2 (in t/N m3).
  • k = adjustment factor for the Clapeyron formula (in K/K).
The Qmean is calculated based on the ratio of the flow rate (7216 N m3/h) for a projected daily production (134.4 t/d) using the following Equation (3):
Q m e a n = P · 7216 / 134.4
where:
  • P = average daily production of formaldehyde during the period (t/day).
This is an approximation because it is known that there is a relationship between the load (production) and the flow rate (purged amount), although it is not perfectly linear. In this work, we ignored the potential deviation that this linear approximation may cause.
The factor r was used to convert m3 of CO2 to tons of CO2 through Equation (4), derived from the Clapeyron equation [20].
r = 10 6 · 44 0.022414
In which 44 is the molecular mass of CO2 (in g/mol), 0.0022414 is the ideal gas constant, and 10−6 is the conversion factor from grams to tons. The factor k, according to Equation (5), was necessary to adjust the ideal gas equation to the case where the temperature is not at 0 °C.
k = 273.15 / T
Recalling that 273.15 is the temperature of 0 °C in Kelvin degrees and that the exhaust temperature (in Kelvin degrees) is T = 393.15 K. Thus, the emitted mass of CO2 ( M ) is a function of four variables: P, V, h, and the temperature of exhaust gases (1/T), as shown in Equation (6):
M = P 7216 134.4 · V · h 10 6 · 44 0.022414 · 273.15 T
We investigated how these variables are measured and what their associated uncertainties are. Then, as reported in the following sections, we calculated the estimated mean and variance of each variable based on our analysis of variability in the process and the data collection routines in a practical case study.

2.4. Statistical Model

Observe that, according to Equation (6), the emission of CO2 mass ( M ) is estimated by a product of a constant (k) and four other variables to be obtained by measurements in the field. See Equation (7).
M = k ·   P · ( 1 T ) · h · V

2.4.1. The Expected Value of M

Unless the variables P, V, h, and 1/T are statistically independent, the product of the mean values of them (and the constant k) will not produce the mean of the M. The mean of a variable, also called the “expected value” of a variable, is the weighted average of its possible values.
To compute the expected value of M, we needed a formula for the expectation of the product of four random variables. Such a formula is not a simple one in the general case where covariances are present. The exact formula for the mean and variance of the product of K-random variables involves the expected values, variances, and correlations among the original random variables, as well as the correlations of their squares. However, Bohrnstedt and Goldberger [21] proposed approximate formulas and discussed their efficiency under assumptions such as the symmetry of the probability distributions and the absence of certain correlations. We did not use those formulas and preferred a procedure that used Monte Carlo simulation because it can be applied in cases where the probability distributions are neither normal nor symmetrical and subject to any sort of correlation. Monte Carlo simulation is a computational technique that uses randomly generated samples to simulate the occurrence of a series of results. Another advantage of the Monte Carlo method is that it simultaneously solves the problem of estimating the variance of the product, as we comment in Section 2.4.2 below.
The information that was used as input for the method encompasses:
  • The mean and standard deviation of P, V, h, and 1/T.
  • The covariances among these variables.

2.4.2. The Variance of M

The variance of a variable is the usual measure of its dispersion around its mean value. Covariance is a measure of the joint variability of two random variables, and the correlation is defined as their covariance divided by the square root of each of their variances. The variance of the product involved in the expression in Equation (7) could be approximately computed using the so-called “variance propagation formula” [22]. This formula is derived using Taylor expansion, and its accuracy diminishes as the variation of the components increases [23].
Other approximate formulas are discussed in Bohrnstedt and Goldberger [21]. As we pointed out in Section 2.4.1, we did not use the approximate formulas but proposed an algorithm based on the Monte Carlo method to compute the expected value as well as the variance of the product of variables in Equation (7).
We used an algorithm detailed in Supplementary File S1 for the case under study; all variables were assumed to be normally distributed, with the mean and variation parameters determined by field measurements. The adequacy and effects of the normality assumption are discussed in Supplementary File S2.

2.4.3. Data Gathering

Each of the variables in Equation (7) was measured or estimated according to the following models:
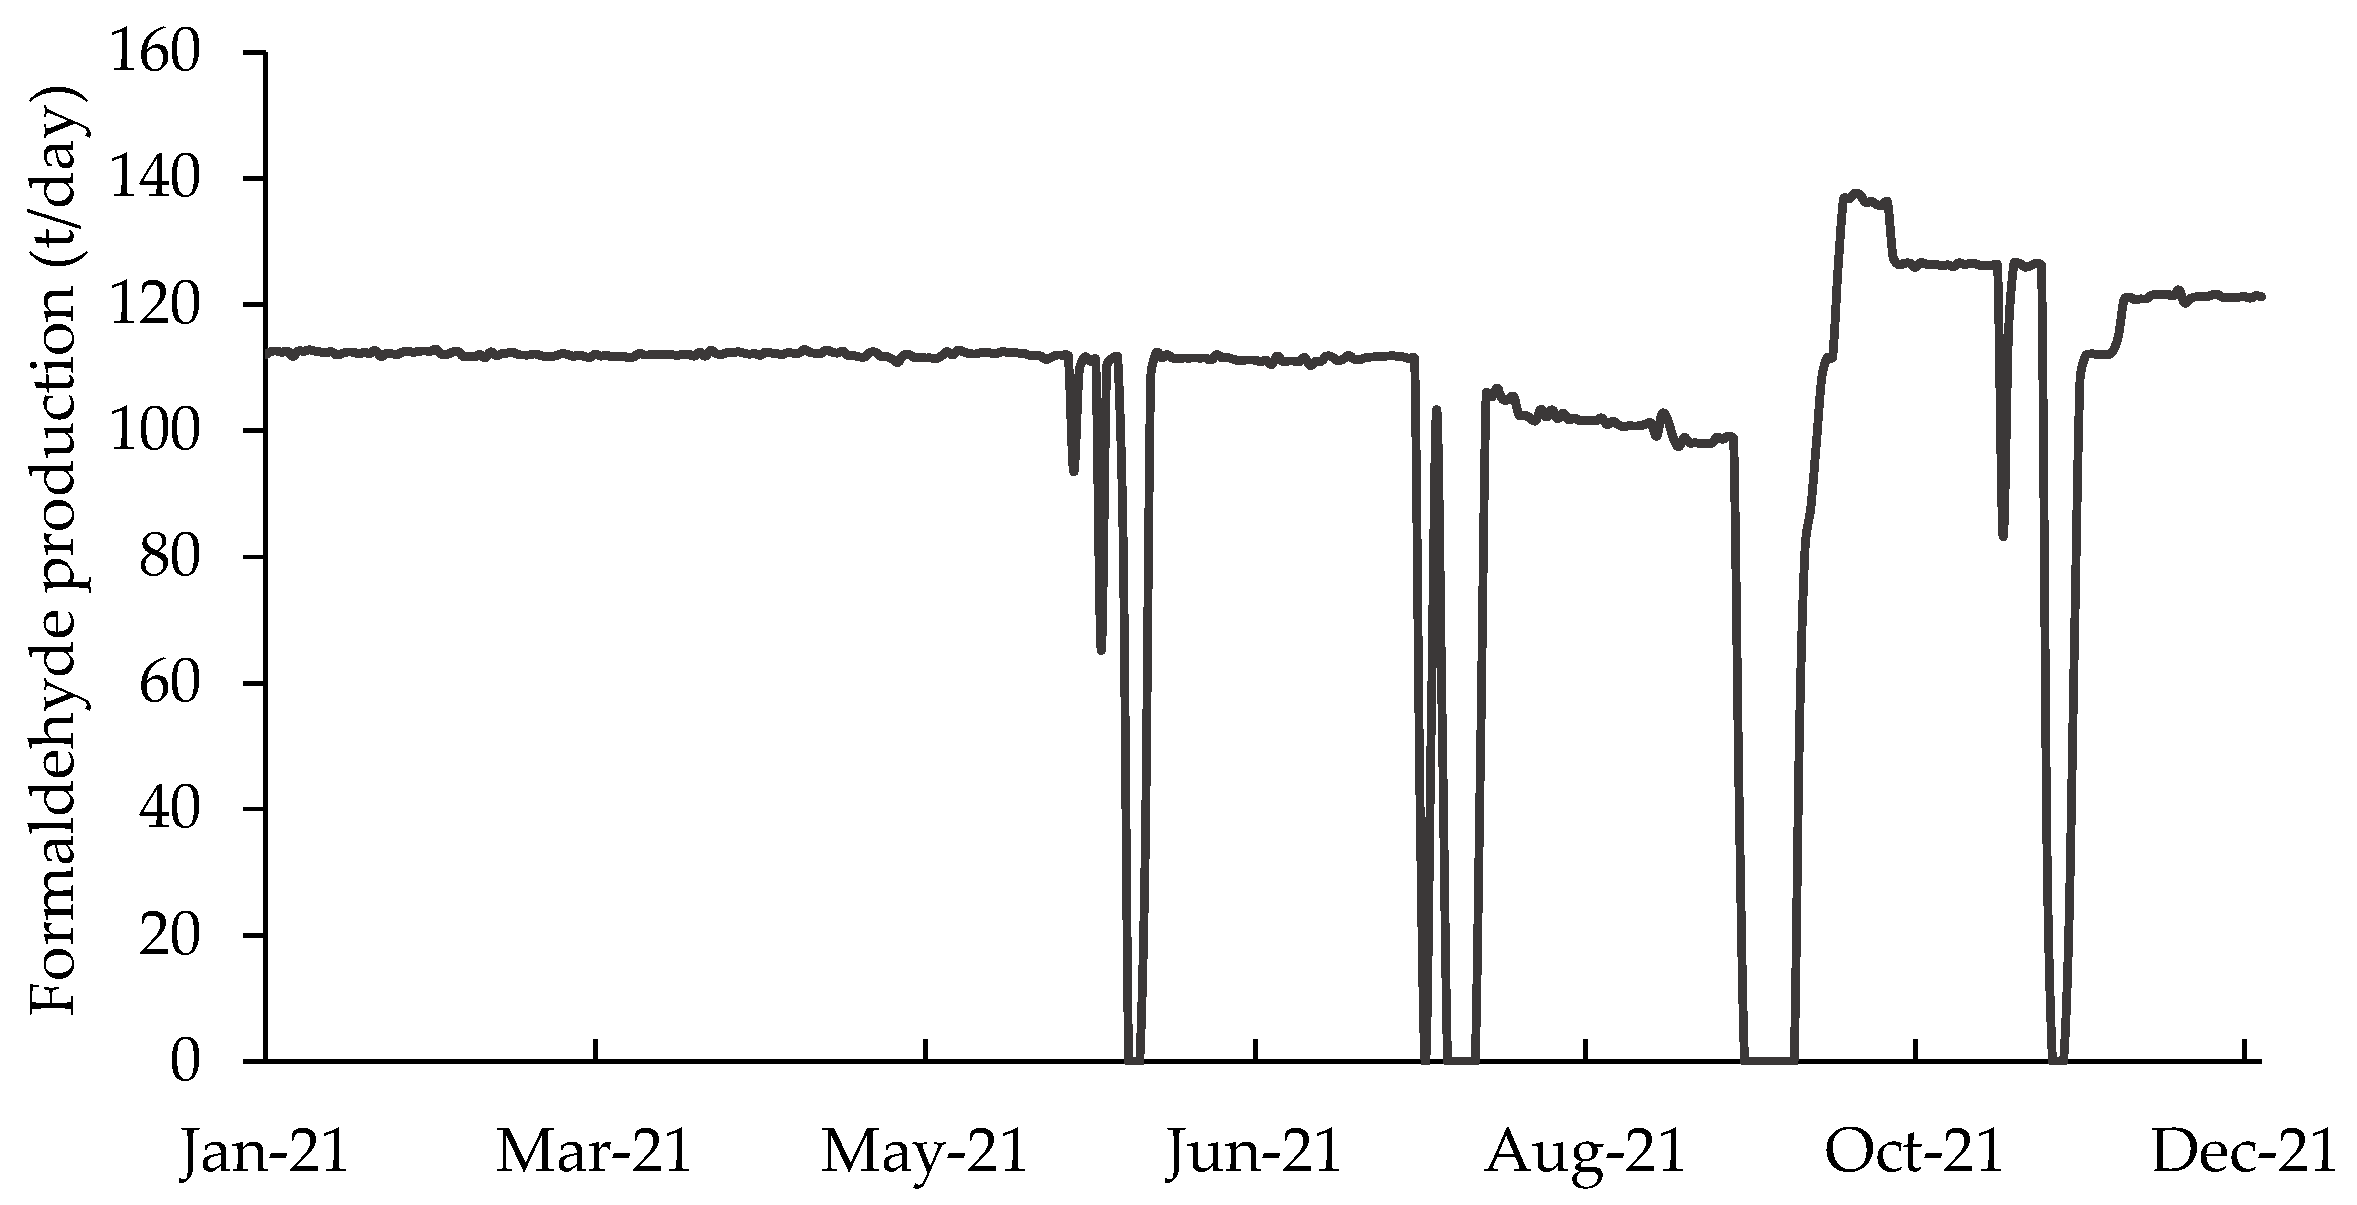
  • P—The daily production was directly measured according to the company’s management system records from 1 January to 31 December 2021. The value of the formaldehyde production in tons is considered quite accurate for long periods. For short periods (such as a day), there may be distortions between actual and recorded values. These variations cancel out the accumulated values produced over long periods. P was considered a normal random variable whose mean and standard deviation remained constant throughout the year. The average hourly flow rate during production periods was estimated without considering the variation of P caused by interruptions and resumptions of activity. Variations in production due to interruptions and resumptions were captured in the computation of the number of h. The value of P was used to calculate the Qmean during a day, and h was used to estimate the time in which this flow was practiced during the day. Thus, the uncertainty about the value of P affected the uncertainty about the value of the hourly flow, which was controlled to correspond to approximately 90% of the maximum design flow.
  • V—Volumetric concentration measurements were made by laboratory analysis using gas chromatography, which exhibits a high degree of precision. The volumetric concentration of CO2 corresponds to the average value of the readings during operations throughout the year. Therefore, V was considered a normal variable with a constant mean and standard deviation throughout the year.
  • h—The number of hours worked per day was a variable recorded by the company’s management and is subject to imprecision due to approximations and measurement errors. For example, some hours worked in a given month could be recorded in the subsequent month, or vice versa. Deviation in the recording of production hours was possible when there were interruptions in production, and it was difficult to determine when the counting of production time should begin as the process required a certain interval of time to stabilize.
  • 1/T—The temperature measurement of exhaust gases should remain controlled at 120 °C (393.15 K). However, variations in the process, load, flow, or even external temperature can affect this temperature. We consider that 1/T is a normal variable and that its mean and standard deviation remain constant throughout the year.

2.4.4. Correlations between the Variables

There are six possible correlations among these variables (Figure 1). In the first analysis, the variables P, V, h, and 1/T appear to be independent of each other. However, in a detailed examination of the data-gathering procedures and the physical operation of the industrial process, we observed a strong correlation among some of these variables, as reported in the next section.

3. Results

3.1. Means and Uncertainties in the Measurements

The means and standard deviations of the variables P, V, h, and 1/T are summarized in Table 1.

3.1.1. Measurements of P

During the period of continuous production, the recorded variations in P reflect day-to-day statistical deviations. In 2021, production was continuous from 1 January 2021 to 31 May (Figure 2), and during this period, the average daily production was 111.97 t with a standard deviation of 1.57 t (Table 1). It should be emphasized that, as described in the materials and methods section, to estimate the average hourly flow during the actual production period, variations in P due to stops and restarts should not be considered. However, variations of this nature were captured in the calculation of the number of hours, h.

3.1.2. Measurements of V

The volumetric concentration of CO2 in the exhaust gases was estimated from 64 measurements obtained, on average, every 5.6 days. Measurements were conducted only on days of effective production. The measurements have a mean value of 0.0144 m3/m3 (1.44%) and a standard deviation of 0.0029 (0.29%).
When production is stopped and resumed, the concentration of CO2 in the exhaust tower is not maintained within the usual distribution for a certain time. The duration and number of such discontinuities were small and had negligible effects on the overall mean and variance of the concentration of CO2 in the exhaust gases used in the calculations.

3.1.3. Measurements of h

The total h recorded in the company’s management system during the corresponding period of the year 2021 was 8278 h (Table 1). The number of production hours was recorded monthly. These records presented uncertainties, mainly due to difficulties in accounting for production hours on occasions of interruption and resumption. Experts consider that the uncertainty might correspond to 1% of the total production hours for the year (Table 1).

3.1.4. Measurements of 1/T

The exhaust gas temperature measurement 1/T should remain controlled at 120 °C. A simple calculation showed that a −10 °C difference in temperature (for example, if the exhaust occurs at a temperature of 110 °C instead of the considered 120 °C) would result in a +2.6% difference in the estimate of normal flow and the same 2.6% difference in the estimate of CO2 emission. If the temperature difference is +10 °C, the difference would be −2.5%. For this article, the temperature was estimated to be between 110 and 130 °C, or 383.15 and 403.15 K. Therefore, the quantity 1/T corresponds to 0.00254 ± 2.5% (Table 1).

3.2. Correlations between the Variables

The covariance matrix summarizing the statistical relationships between the variables P, V, h, and 1/T is presented in Table 2.
Experts, experienced engineers, and technicians in the operation of this system assessed that:
  • One possibility of correlation is that the measurements for determining the variables P, V, h, and 1/T use instruments subject to systematic errors. We found no indication of the occurrence of such a possibility, and, thus, such a reason for correlations was discarded.
  • The correlation between the values of h and the other variables should be disregarded. Thus, we will consider h as independent from the others.
  • The correlations between P and the variables T and V were also disregarded because of the following argument: Indeed, the temperature T and the concentration V depend on the production level P. However, in practice, once it is identified that the production level changes, process management commands adjustments to control the process, and, therefore, T and V are controlled. Thus, we will consider that P is independent of the other variables.
  • Between T and V, it was considered that there is an important correlation since the temperature increases when the level of residual gases increases. Therefore, conservatively, we assume that the correlation between 1/T and V is equal to −1.

3.3. Estimation of Mean and Variance of the Emission

The computational code that computes the mean and variance of the emission is available in Supplementary File S1. The simulation produces 10,000 results for the emissions that resulted from 10,000 instances of the four input variables. The average of these results is our estimate for the mean emission. The standard deviation of these 10,000 results is our estimate for the standard deviation of the annual emission.
From the estimated mean and standard deviation, we form the 95% confidence interval using critical values of the standardized normal distribution (z = 1.96) and the formula: L C L = μ ^ 1.96 σ ^ for the lower confidence limit and L C L = μ ^ + 1.96 σ ^ for the upper confidence limit of the interval.
The estimation of annual emissions resulted in a mean of 970 t of CO2 and a standard deviation of 175 t of CO2.
The 95% confidence interval for annual emissions resulted in Equation (8):
A n n u a l   E m i s s i o n = E Y e a r = 970   ±     342   ton   o f   CO 2 o r   970   ton   ± 35 %
The histogram presented (Figure 3) illustrates the results from the estimate of emissions using Monte Carlo simulations.

4. Discussion

4.1. Known and Unknown Uncertainties

The computation of the confidence interval for the emission is subject to limitations. Perhaps the most important one is that we cannot guarantee that we are capturing all uncertainties possibly affecting the resulting emissions. We have only considered those that we know exist and those that we could imagine using our experience and understanding of similar operations. The observations reinforce the points highlighted by Molina-Castro [24], who also emphasizes the innovative use of expert criteria to determine the expected variabilities in certain input variables when such information is not available. However, it’s important to acknowledge that this approach is not exempt from limitations.
Another fact that might distort the result is the presence of data outliers and possible data-gathering mistakes that went unnoticed. In practical applications, beyond the natural variability in the values associated with operational parameters, such as temperature or the quantity of raw materials processed over a specific period, the presence of outliers and recording errors can confound the analysis. Our approach in this study assumes that all data should be utilized once validated by company management. Furthermore, if this data contains mistakes and erroneous records, they must be considered constituents of the inherent data variability. In the present case, all recommended procedures were followed to ensure maximum reliability of the data and data processing procedures.

4.2. The Effect of Correlations

An important part of this article is dedicated to the analysis of correlations among P, V, h, and 1/T and the effect of these correlations in the estimation of the emission.
Assessing these correlations, though, depends on understanding the chemical and physical relationships in the production process. Groen and Heijungs [25] discuss the risks involved in ignoring correlations between the input parameters and how ignoring correlations can lead to an underestimation or overestimation of the output variation.
Thus, it is interesting to evaluate what would be missed if correlations were all assumed to be zero. Considering this assumption, while maintaining the rest of the data from the case study presented, the result changes to:
A n n u a l   E m i s s i o n   w i t h o u t   c o r r e l a t i o n s = E Y e a r = 977   ±     390   ton   o f     CO 2 o r   977   ton   ± 40 %
The average value obtained above by the Monte Carlo method with the assumption of zero correlation is the same result that we would obtain by simply multiplying the mean values of P, V, h, and 1/T. This observation serves as a remark for the statistical theorem that the mean of the product of random variables is equal to the product of their means only if there is no correlation among the factors of the product.
We must stress that such simplification might produce a result that appears more precise. This would occur if the disregarded correlations were positive numbers. However, it might be more precise but biased.
In our example, disregarding the correlation produced a bias of 1% in the estimation of the mean emission value. Neglecting the correlation would enlarge the standard deviation from 175 t to 199 t, a 14% increase.

4.3. Length of the Period of Analysis

The estimate of emissions for a period shorter than one year depends on knowing h, the variable accounting for the number of hours in that time interval, and the standard deviation of h. The standard deviation of h for an annual period or a monthly period need not be the same. Neither in percentage terms nor in absolute terms. This deviation depends on the number of disruptions during the period and on other factors.
Also, it is necessary to consider that the catalyst used in the formaldehyde production process wears out and is replaced every 12 to 15 months, approximately. As the catalyst wears out, the process tends to lose efficiency, and management adjusts the controls to maintain maximum efficiency. These adjustments alter the production load, flow rate, etc. The intake and exhaust of gases are also adjusted. Temperature, waste level, and CO2 concentration are affected. Therefore, all variables in Equation (7) might change from month to month and seem to be a gross approximation to consider the annual statistics for the monthly analysis.

4.4. Control of the Process and Precision

The measurement of exhaust gas temperature is another issue that requires attention. It should remain controlled at 120 °C (393.15 °K). The formaldehyde production process is exothermic and uses a special fluid to remove the reaction heat. The unit has an important thermal recovery system, as the output stream from the reactor heats the methanol and air mixture streams. The control of the system is guaranteed by a set of valves operated via SDCD. The control is targeted to maintain the temperature within a range of values where the process is most efficient.
However, it was identified that this is subject to variation. In this case, a temperature fluctuation of ±10 °C results in variations of +2.6% to −2.5% in the normal flow and CO2 emission estimates (Table 1). This shows that controlling the temperature of the exhaust tower might significantly improve results in terms of emissions and emission estimate precision.

4.5. Comparison with Other Emission Estimates

It is interesting to compare the estimates obtained by the methodology presented in this case study with the results obtained by the company itself and by third-party technicians hired in 2022 to analyze the emissions related to the 2021 formaldehyde production process.
The annual emissions for 2021 in formaldehyde production by the oxide method are presented in Table 3. The difference between estimates A and B was only 3%, while the difference between A and C was 48%.
Estimate C adopted a different procedure for measuring the volumetric flow rate in the exhaust gases, and it was not clear whether the choice of time to collect this information was appropriate. Another possible reason for the discrepancy was that the third-party contractors only took measurements during October 2021 and somehow extrapolated them to the entire year.
In a recent study, Barahmand and Eikeland [26] concluded that the use of different databases and the application of different methodologies are one of the main sources of variability in data and uncertainties. However, the methodologies and data used in A and B were the same. The difference in results was due to the procedures used to calculate the averages (procedure B did not calculate standard deviations) from the collected data.

5. Conclusions

The Copenor case study analyzed how variations in the data affect GHG emissions in an industrial plant dedicated to formaldehyde production. The means and standard deviations were recorded for the estimation of direct emissions, and the effects of variations in the variables P, V, h, and 1/T on the emission estimates were studied. It was observed that variations in the daily production of formaldehyde (P), the volumetric concentration of CO2 in the exhaust gases (V), the number of hours worked (h), and the temperature of the exhaust gases (1/T) led to deviations in the estimates of GHG emissions. Additionally, a correlation between the variables 1/T and V was identified, which required the application of Monte Carlo simulation to adequately estimate the variance considering the four variables involved (P, V, h, and 1/T).
This research highlights the significance of considering these variations in accurately estimating greenhouse gas emissions in industrial processes. It also holds great relevance for informing “carbon peak and carbon neutrality” policies, as it provides valuable insights into the complexities of emissions estimation. Policymakers can leverage these findings to design more effective strategies for emission reduction and carbon removal, contributing to a more sustainable and environmentally responsible industrial landscape. Moreover, this study’s methodology using Monte Carlo simulation offers a robust framework applicable to similar industries, facilitating the development of emission reduction initiatives.

Supplementary Materials

The following supporting information can be downloaded at: https://www.mdpi.com/article/10.3390/su152416578/s1. Refs. [27,28] are cited in Supplementary Materials.

Author Contributions

Conceptualization, J.R.U.C.A. and A.A.C.; methodology, E.C.M.; investigation and data curation, L.F.L.S. and A.R.S.P.C.; writing—review and editing, P.C.G.M., S.G.H. and P.M.S.M. All authors have read and agreed to the published version of the manuscript.

Funding

This research was partially funded by the São Paulo State Research Foundation (FAPESP; grant 2021/14296-5).

Institutional Review Board Statement

Not applicable.

Informed Consent Statement

Not applicable.

Data Availability Statement

Acknowledgments

The research reported in this article was conducted through a collaborative effort between DEEP Brasil Informação e Tecnologia S/A and Copenor Companhia Petroquimica do Nordeste. We would like to express our gratitude to Copenor personnel for all the support they provided.

Conflicts of Interest

The authors of this document do not identify any interest in its publication besides scientific disclosure.

References

  1. Kauffmann, C.; Less, C.T.; Teichmann, D. Corporate Greenhouse Gas Emission Reporting: A Stocktaking of Government Schemes; OECD Working Papers on International Investment No. 2012/01; OECD Publishing: Paris, France, 2012; 74p. [Google Scholar]
  2. Inakollu, S.; Morin, R.; Keefe, R. Carbon Footprint Estimation in Fiber Optics Industry: A Case Study of OFS Fitel, LLC. Sustainability 2017, 9, 865. [Google Scholar] [CrossRef]
  3. Carbon Disclosure Project (CDP). Global 500 Report; CDP: London, UK, 2009; 49p. [Google Scholar]
  4. Fonseca, R.C.; Indicadores de Sustentabilidade Empresarial de Boas Práticas para Micro e Pequenas Empresas: Análise Crítica e Framework Conceitual. Universidade Tecnológica Federal do Paraná, [S. L.]. 2020. Available online: https://utfws.utfpr.edu.br/acad01/sistema/mpCadDefQualPg.pcTelaAss (accessed on 20 February 2023).
  5. Yona, L.; Cashore, B.; Jackson, R.B.; Ometto, J.; Bradford, M.A. Refining national greenhouse gas inventories. Ambio 2020, 49, 1581–1586. [Google Scholar] [CrossRef] [PubMed]
  6. Tonin, S.; La Notte, A.; Nocera, S. A use-chain model to deal with uncertainties. A focus on GHG emission inventories. Carbon Manag. 2016, 7, 347–359. [Google Scholar] [CrossRef]
  7. Intergovernmental Panel on Climate Change (IPCC). IPCC Guidelines for National Greenhouse Gas Inventories. Volume 1: General Guidance and Reporting. Kanagawa: IPCC Guidelines for National Greenhouse Gas Inventories, National Greenhouse Gas Inventories Programme. 2006. Available online: https://www.ipcc-nggip.iges.or.jp/public/2006gl/vol1.html (accessed on 6 April 2023).
  8. Brandon, R.G.; Krueger, P.; Schmidt, P.S. ESG Rating Disagreement and Stock Returns; Finance Working Paper No. 651/2020; European Corporate Governance Institute: Brussels, Belgium, 2021; 57p. [Google Scholar] [CrossRef]
  9. Carotenuto, F.; Gualtieri, G.; Miglietta, F.; Riccio, A.; Toscano, P.; Wohlfahrt, G.; Gioli, B. Industrial point source CO2 emission strength estimation with aircraft measurements and dispersion modelling. Environ. Monit. Assess. 2018, 190, 165. [Google Scholar] [CrossRef] [PubMed]
  10. Jonas, M.; Marland, G.; Krey, V.; Wagner, F.; Nahorski, Z. Uncertainty in an emissions-constrained world. Clim. Chang. 2014, 124, 459–476. [Google Scholar] [CrossRef]
  11. Lesiv, M.; Bun, A.; Jonas, M. Analysis of change in relative uncertainty in GHG emissions from stationary sources for the EU 15. Clim. Chang. 2014, 124, 505–518. [Google Scholar] [CrossRef]
  12. Keoleian, G.A.; Spitzley, D.V. Chapter 7 Life cycle-based sustainability metrics. Sustain. Sci. Eng. 2006, 1, 127–159. [Google Scholar] [CrossRef]
  13. Lima, R.S.; Caldeira-Pires, A.A.; Cardoso, A.N. Uncertainty analysis in Life Cycle Assessment applied to biorefineries systems: A critical review of the literature. Process Integr. Optim. Sustain. 2020, 4, 1–13. [Google Scholar] [CrossRef]
  14. Park, Y.S.; Yeon, S.M.; Lee, G.Y.; Park, K.H. Proposed Consecutive Uncertainty Analysis Procedure of the Greenhouse Gas Emission Model Output for Products. Sustainability 2019, 11, 2712. [Google Scholar] [CrossRef]
  15. Igos, E.; Benetto, E.; Meyer, R.; Baustert, P.; Othoniel, B. How to treat uncertainties in Life Cycle Assessment studies. Int. J. Life Cycle Assess. 2019, 24, 794–807. [Google Scholar] [CrossRef]
  16. Marujo, E.C.; Rodrigues, G.G.; Amaral, W.A.N.; Leonardis, F.; Covatti, A. A procedure to estimate variances and covariances on GHG emissions and inventories. Carbon Manag. 2022, 13, 310–320. [Google Scholar] [CrossRef]
  17. Tang, X.; Bai, Y.; Duong, A.; Smith, M.T.; Li, L.; Zhang, L. Formaldehyde in China: Production, consumption, exposure levels, and health effects. Environ. Int. 2009, 3, 1210–1224. [Google Scholar] [CrossRef] [PubMed]
  18. Bahmanpour, A.M.; Hoadley, A.; Tanksale, A. Critical review and exergy analysis of formaldehyde production processes. Rev. Chem. Eng. 2014, 30, 583–604. [Google Scholar] [CrossRef]
  19. Greenhouse Gas Protocol Initiative (GHG). A Corporate Accounting and Reporting Standard; World Resources Institute and World Business Council for Sustainable Development: Geneva, Switzerland, 2004. [Google Scholar]
  20. Style, R.W.; Gerber, D.; Rempel, A.W.; Dufresne, E.R. The generalized Clapeyron equation and its application to confined ice growth. arXiv 2023, arXiv:2301.03895. [Google Scholar] [CrossRef]
  21. Bohrnstedt, G.W.; Goldberger, A.S. On the Exact Covariance of Products of Random Variables. J. Am. Stat. Assoc. 1969, 64, 1439–1442. [Google Scholar] [CrossRef]
  22. Intergovernmental Panel on Climate Change (IPCC). Good Practice Guidance and Uncertainty Management in National Greenhouse Gas Inventorie; Penman, J., Kruger, D., Galbally, I., Hiraishi, R., BYenzi, B., Emmanul, S., Buendia, L., Hoppaus, R., Martinsen, T., Meijer, J., et al., Eds.; Institute for Global Environmental Strategies: Hayama, Japan, 2000. [Google Scholar]
  23. Giordano, M. Uncertainty propagation with functionally correlated quantities. arXiv 2016, arXiv:1610.08716. [Google Scholar]
  24. Molina-Castro, G. A Monte Carlo Method for Quantifying Uncertainties in The Official Greenhouse Gas Emission Factors Database of Costa Rica. Front. Environ. Sci. 2022, 10, 896256. [Google Scholar] [CrossRef]
  25. Groen, E.A.; Heijungs, R. Ignoring correlation in uncertainty and sensitivity analysis in life cycle assessment: What is the risk? Environ. Impact Assess. Rev. 2017, 62, 98–109. [Google Scholar] [CrossRef]
  26. Barahmand, Z.; Eikeland, M.S. Life Cycle Assessment under Uncertainty: A Scoping Review. World 2022, 3, 39. [Google Scholar] [CrossRef]
  27. Devore, J.L. Probability and Statistics for Engineering and the Sciences, 8th ed.; Cengage Learning: Belmont, CA, USA, 2012. [Google Scholar]
  28. Wiki R Contributors. Teste Shapiro-Wilk (Ryan-Joiner). 2021. Available online: https://www.ufrgs.br/wiki-r/index.php?title=Teste_Shapiro-Wilk_(Ryan-Joiner)&oldid=3247 (accessed on 20 February 2023).
Figure 1. Correlations among the variables used to obtain the mass of CO2 emissions in the production of formaldehyde. P: Average daily production of formaldehyde during the period (in t/day); 1/T: Temperature of exhaust gases; h: Number of production hours during the period (in hours); and V: Concentration of CO2 in exhaust gases (in Nm3/Nm3). Source: The authors.
Sustainability 15 16578 g001
Figure 2. Daily production of formaldehyde at the Copenor oxide unit. Source: Copenor, 2021.
Sustainability 15 16578 g002
Figure 3. Histogram of simulated CO2 mass emitted at the Copenor oxide unit in 2021.
Sustainability 15 16578 g003
Table 1. Means and standard deviations of direct emission variables in the production of formaldehyde.
VariableMeanUnit of MeasurementStandard DeviationStandard
Deviation/Mean %
P111.97t/day1.571.4%
1/T0.002541/K0.000062.5%
H8.278hour/year831.0%
V0.01444m3/m30.2920%
Note: P: Average daily production of formaldehyde during the period (in t/day); 1/T: Temperature of exhaust gases; h: Number of production hours during the period (in hours); and V: Concentration of CO2 in exhaust gases (in Nm3/Nm3).
Table 2. Correlation matrix between the variables used to obtain the mass of CO2 emissions in the production of formaldehyde.
P1/THV
P1000
1/T010−1
H0010
V0−101
Note: P: Average daily production of formaldehyde during the period (in t/day); 1/T: Temperature of exhaust gases; h: Number of production hours during the period (in hours); and V: Concentration of CO2 in exhaust gases (in Nm3/Nm3).
Table 3. Estimates of CO2 emissions (in tons).
This Report
(A)
Own Company
(B)
Third-Party
(C)
9709381434
Disclaimer/Publisher’s Note: The statements, opinions and data contained in all publications are solely those of the individual author(s) and contributor(s) and not of MDPI and/or the editor(s). MDPI and/or the editor(s) disclaim responsibility for any injury to people or property resulting from any ideas, methods, instructions or products referred to in the content.

