Article

Environmental–Economic Analysis of Multi-Node Community Microgrid Operation in Normal and Abnormal Conditions—A Case Study of Indonesia

by
Mahshid Javidsharifi
1,*,
Najmeh Bazmohammadi
1,
Hamoun Pourroshanfekr Arabani
2,
Juan C. Vasquez
1 and
Josep M. Guerrero
1
1
Center for Research on Microgrids (CROM), AAU Energy, Aalborg University, 9220 Aalborg, Denmark
2
Division of Industrial Electrical Engineering & Automation, Lund University, 221 00 Lund, Sweden
*
Author to whom correspondence should be addressed.
Sustainability 2023, 15(24), 16625; https://doi.org/10.3390/su152416625
Submission received: 17 October 2023 / Revised: 27 November 2023 / Accepted: 29 November 2023 / Published: 7 December 2023

Abstract

:
This paper presents a comprehensive analysis of the operation management of a multi-node community microgrid (MG), emphasizing power flow constraints and the integration of photovoltaic (PV) and battery systems. This study formulates MG operation management as a multi-objective optimal power flow problem, aiming to minimize costs (maximize profits) and emissions simultaneously. The multi-objective particle swarm optimization (MPSO) method is employed to tackle this complex optimization challenge, yielding a Pareto optimal front that represents the trade-offs between these conflicting objectives. In addition to the normative operation scenarios, this research investigates the robustness of the MG system in the face of abnormal situations. These abnormal scenarios include damage to the PV system, sudden increases in the MG load, and the loss of connection to the main electricity grid. This study focuses on Lombok Island, Indonesia as a practical case study, acknowledging the ongoing efforts to implement the community MG concept in this region. It is observed that when the access to the electricity grid is limited, the energy not served (ENS) increases to 2.88 MWh. During the fault scenario in which there is a 20% increase in the hourly load of each MG, a total of 4.5 MWh ENS is obtained. It is concluded that a resilient operation management system is required to ensure a consistent and reliable energy supply in community MGs in the face of disruptions.

1. Introduction

The recent surge in energy demand, coupled with growing environmental concerns, has made a notable change in the worldwide energy scene, placing more importance on sustainable energy solutions, and it has prompted the integration of distributed energy resources (DERs), particularly those based on renewable sources [1]. During this transition, microgrids (MGs) have surfaced as promising options, enabling communities to have more influence over how they produce, use, and distribute energy [1,2,3]. Especially in distant and underserved areas, MGs offer significant potential for tackling energy accessibility issues while promoting economic, social, and environmental advantages [2]. The use of MGs has been recommended as a solution to harness various benefits, including enhanced reliability, sustainability, and cost-effectiveness, by aggregating DERs and loads within distribution networks [2,3].
A community MG is a compact and decentralized energy system that blends diverse energy sources, including renewables like solar energy, wind energy, and hydropower, alongside energy storage solutions like batteries, as well as traditional generators. Its purpose is to provide electricity to a particular community or a group of consumers. MGs can function independently or in coordination with the primary utility grid. This capability allows the community MG to sustain its power supply during grid failures and can also serve as a complementary source of electricity when the main grid is operational, with surplus renewable energy available [3].
In recent years, the idea of community MGs has gained considerable momentum, driven by the demand for sustainable energy solutions. Scholars and industry experts alike have delved into the possible advantages and obstacles associated with deploying community-based MG systems across various global contexts [1,2,3,4].
Resilience in MGs pertains to the capacity of energy systems to endure and re-bound from disturbances, interruptions, or unexpected circumstances while ensuring crucial energy services. This concept encompasses the ability to adjust, recover, and persist in operation under adverse conditions, including natural disasters, power grid failures, cyber-attacks, or severe weather events. Community MGs strengthen the resilience of the community power system, particularly in rural or isolated regions, by offering a dependable electricity source during emergencies or when the primary grid experiences disruptions [4].
To effectively make the most of the available resources and attain economic and environmental objectives, it is crucial to coordinate the operation of various resources efficiently [1,2,3,4,5]. An operation management system (OMS) takes on the responsibility of overseeing energy scheduling while considering operational objectives and technical and system constraints. This task can be particularly demanding, especially during abnormal operating conditions when unforeseen disruptions like natural disasters occur, and there is not enough power generation to meet the electricity demands of all power-consuming units [4,5,6,7,8,9,10].
In [6], the authors present an OMS designed for MGs, which employs a genetic algorithm (GA) framework. The model they propose integrates forecasted data for solar photovoltaic (PV) and wind power generation and focuses on optimizing the utilization of both batteries and grid power over a 24 h period. The aim of OMS is the optimal utilization of renewable energy sources (RESs) and storage while taking into account factors such as the cost and health of the batteries.
The authors in [7] propose an OMS designed for MGs to optimize energy generation while simultaneously reducing CO2 emissions and minimizing economic expenses. This OMS incorporates model predictive control, a multi-objective optimization algorithm, and a decision-making tool that can adapt to changing operational circumstances. The multi-objective algorithm produces Pareto optimal solutions, balancing the reduction in CO2 emissions and economic costs. Meanwhile, the decision tool automates the selection of the most appropriate solution from the set of Pareto optimal solutions.
In [8], an OMS tailored for MGs is introduced. It employs GA to optimize the utilization of the battery and grid power over 24 h. This model is designed to accomplish operation management, making the most use of RESs and storage, considering cost and battery health. Furthermore, the study introduces two distinct OMSs for MGs and smart homes. These systems are designed to operate under both normal and emergency conditions, showcasing their ability to ensure grid resilience by supplying power to both internal and external loads during disruptions or outages.
A forward-looking operation management strategy is introduced in [9], emphasizing the combination of flexible load control and MG resource planning. This approach is specifically designed to bolster the resilience of the power grid in the aftermath of natural disasters. The framework places a priority on managing loads by considering factors such as health and economic importance, thereby substantially mitigating the adverse impacts of power outages. The study underscores the vital importance of including MGs in resource planning to ensure a robust power grid. It emphasizes the need to invest in both PVs and battery energy storage systems (BESSs) to maintain uninterrupted load service during periods of grid downtime.
In [10], the economic dispatch problem within MGs is addressed by employing different optimization algorithms on an IEEE 30-bus system. The selected ant colony-based algorithm optimizes the energy costs of the MG, considering seasonal variations. This study also offers insights and recommendations for potential enhancements in this context.
In a world facing the pressing imperative of addressing climate change and transitioning to RESs, Indonesia, blessed with abundant natural resources, stands at a critical junction where it must reconsider and reshape its energy landscape [11,12,13,14]. Lombok Island, situated within the Indonesian archipelago, presents an ideal setting for investigating the integration of community MGs. Its distinctive geographical characteristics, encompassing remote villages and challenging terrain, contribute to energy access disparities that a conventional grid infrastructure struggles to rectify [15,16]. Consequently, implementing a community MG emerges as a promising solution to bridge this energy gap and enhance the overall quality of life for the island’s residents [15,16].
Indonesia faces various natural disasters, such as earthquakes, floods, and volcanic eruptions [11]. An overview of the number of natural disasters that have occurred in Indonesia from 2012 to 2022 is shown in Figure 1. In 2019, the National Disaster Mitigation Agency (BNPB) recorded a total of 3622 natural disasters, including tornadoes, floods, and landslides across the nation. An important incident occurred in August 2019 when a powerful 6.9-magnitude earthquake struck Java, causing a blackout lasting 9 h, and affecting around 21.3 million customers, including industries, mass transit, and the telecommunication system [11,12,13].
As climate change continues, it is expected that natural disasters and extreme weather events will become more frequent and prolonged worldwide [11]. This underscores the importance of urgently establishing strong and resilient electrical power networks in Indonesia and other susceptible regions to reduce the impacts of such events and guarantee a dependable power supply during challenging situations [14,18].
To ensure that the load demands are met while adhering to cost and emission constraints, the MG’s economic and environmental optimization must be approached as a multi-objective problem.
A review of the literature on the optimal operation of PV-based MGs is presented in [19]. Different modeling strategies, formulation, optimization objectives, and solving methods are investigated. The importance of applying metaheuristics algorithms to facilitate the optimization process of the operation management of MGs and future challenges are discussed.
A multi-objective differential evolution algorithm is used in [20] to solve the operation management of a renewable-based MG. The objective of this paper is to minimize the operational cost and environmental emissions. However, the effect of natural disasters and the resulting abnormal conditions are not investigated in this paper.
The techno-economic-environmental performance of grid-connected MGs under uncertainties is studied in [21]. A bi-objective algorithm is suggested to minimize the operation cost and emissions of the system. The only considered condition in this paper is the normal operation condition.
The authors suggested the improved weighted mean of the vectors algorithm in [22] to solve the day-ahead operation management of MGs to minimize the operation cost of the system. However, the operation of the system in abnormal conditions is not studied in this paper.
The intelligent Golden Jackal Optimization (GJO) algorithm is proposed in [23] to solve the operation management of an MG with hybrid resources. The only objective in this paper is to minimize the operation cost. Moreover, the effect of abnormal conditions on the operation of the MG is not considered in the paper.
Different methods, including mathematical models, such as mixed-integer linear programming, or metaheuristic algorithms, such as GA and the harmony search algorithm, are studied and compared in [24] to investigate the single-objective cost optimization in MGs under normal operation conditions.
To study the single-objective cost minimization of a renewable-based energy system, a nature-inspired algorithm, namely the Kestrel-based search algorithm (KSA), is suggested in [25], and the results are compared with some other algorithms. The operation of the system during faulty condition is not evaluated in this paper.
A multi-objective GA is employed in [26] to solve the operation management of an MG while considering emission and cost minimizations. Nevertheless, this paper does not explore the impact of natural disasters and the subsequent abnormal conditions.
In this paper, we explore operation management strategies for a multi-node community MG situated in the scenic surroundings of Lombok Island, Indonesia. The optimal MG operation management challenge is formulated as a multi-objective optimization problem to minimize both the operational costs of the community MG and its environmental impact. To address this optimization challenge, the multi-objective particle swarm optimization (MPSO) algorithm is employed. To gauge the effectiveness of the proposed strategy, various normal and abnormal operating scenarios are considered for evaluation. Accordingly, the main contributions of this paper are summarized as follows:
  • An economic–environmental operation management problem of a multi-node community MG is formulated using the real data of Lombok Island in Indonesia.
  • The MPSO algorithm is suggested to solve the multi-objective optimal operation management of the considered multi-node community MG.
  • Different normal and abnormal operating conditions are considered for both the single- and multi-objective operation management of the multi-node community MG to justify the efficiency of the suggested method.
  • A comprehensive analysis of the performance of the OMS designed for community MGs under both normal and abnormal conditions is performed while the technical constraints including the power flow and battery constraints are considered.
  • In the case of faults, the load curtailment strategy for each abnormal scenario is investigated.
The remainder of this paper is as follows: In Section 2, we explore the system structure of the proposed multiple-node community MG and the problem formulation. Section 3 is devoted to the applied methodology for solving the optimal operation of the proposed multi-node community MG. The results are studied in Section 4. The conclusions and future works are highlighted in Section 5.

2. Optimal Operation of a Multiple-Node Community MG

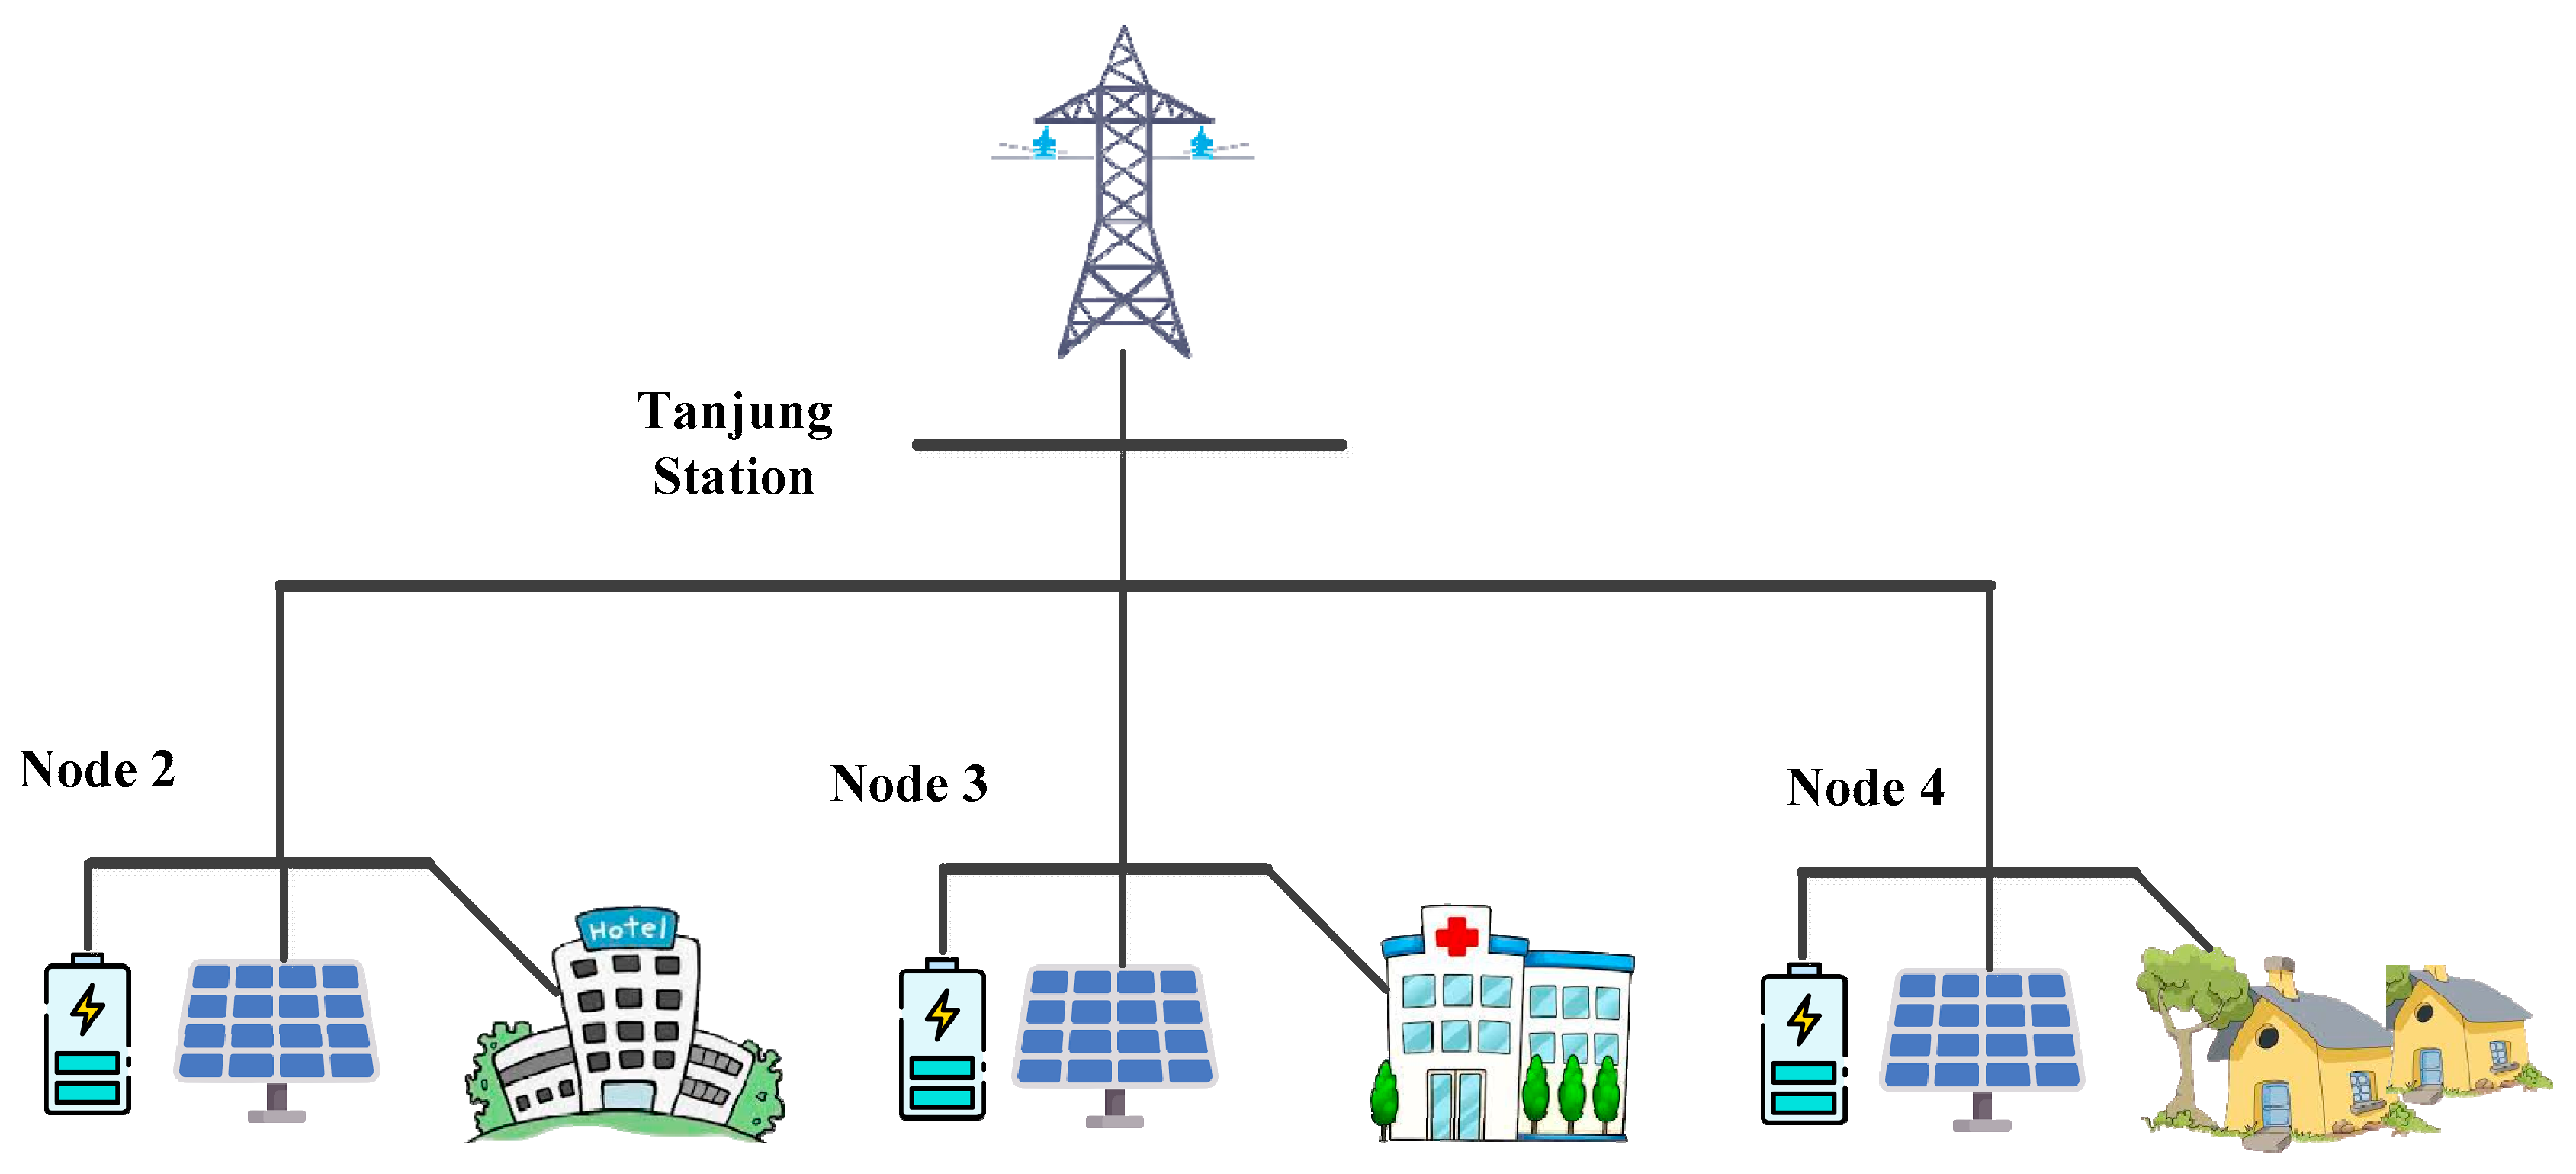
2.1. System Structure

The case study selected in this paper is Lombok Island, Indonesia. Lombok Island is located in West Nusa Tenggara province, Indonesia, with a population of 3,869,194 and an area of 4738.65 km2. A four-node community is considered on the island, consisting of several load centers, namely Tanjung station (Node 1); Mina Hotel (Node 2), which has 25 rooms [27]; RSUD hospital (Node 3), which is built on 902.4 m2 of land with a capacity of inpatient services at the UPTD RSUD East Lombok of 68 beds [28]; and a village nearby (Node 4). The topology of this community MG is shown in Figure 2. The proposed community MG consists of PV panels with crystalline silicon solar cell technology, and lithium-ion BESS units installed in Nodes 2, 3, and 4, with the capacities shown in Table 1.

2.2. Problem Formulation

This section describes the operation management problem of the considered community MG of Figure 2. The goal is to minimize the operating cost (maximize profit) and environmental impact of the MG’s daily operation while satisfying several technical and operational constraints. The decision variables include the amount of power to be exchanged with the main grid, either buying or selling, and the charging/discharging power of the battery. It is assumed that the PV is not dispatchable, and all of its available power is used. In a normal situation, the microgrid is in connection with a power system grid with enough capability to provide the microgrid’s local hourly load during a normal day, and as mentioned in Equation (2), any solution that results in any load curtailment will be penalized. Consequently, load curtailment will not happen in normal operation conditions.

2.2.1. Objective Functions

The goal of the considered optimal operation management problem is to minimize the operating cost and the environmental impact of the MG simultaneously by optimally splitting the required power among different available sources. Thereby, the problem can be formulated as a multi-objective optimization problem with two competing objectives as follows:
F = ( F 1 , F 2 )
The first objective function is the operation cost of the MG over the simulation horizon T, which is given below:
F 1 = t = 1 T P b u y t E b u y t P s e l l t E s e l l t + M × t = 1 T E N S t
In (2), P b u y t and P s e l l t are, respectively, the purchased and sold powers from/to the main grid in kW. E b u y t and E s e l l t ,     r e s p e c t i v e l y , represent the energy price for importing and exporting power from/to the main grid in USD/kWh.
E N S t is the energy not supplied at each hour of the day. M is a big number that is considered to be equal to 10 9 . This second term represents that under abnormal operation, the focus is on satisfying the critical load at each hour of the day.
The second objective is to minimize the following function, F 2 , which is the environmental impact of the system:
F 2 = t = 1 T P b u y t C e m t t
where C e m t t is the emission coefficient of each kWh of received power from the electricity grid in kg.
It should be mentioned that when the power is delivered to the electricity grid from the MG, the emission term related to the main electricity grid equals zero, and no emission is produced. Moreover, it should be mentioned that the BESS and PV units do not produce any emissions.

2.2.2. Technical Constraints

The operation management of the MG is influenced by various technical limitations, which encompass constraints related to power flow, battery charging, and discharging rates, energy transmission limitations, and the restrictions concerning power exchange with the electrical grid, all elaborated upon subsequently.

Power Flow Constraint

The power flow constraint refers to the limitation on the flow of power between different components within the MG, such as generators, energy storage systems, and loads. It ensures that the power injected into the MG matches the power consumed by the loads while considering the system characteristics. The power flow constraint ensures that the MG operates within its power limits, preventing the overloading or underutilization of the components.
The network constraints for the studied multi-node community MG are considered as follows [5]:
i = 1 N n o d e   ( V i t V j t Y i j cos θ i j δ i t + δ j t   + P P V , i t + P D c h , i t P C h , i t P L , i t ) P L o s s t = 0
i = 1 N n o d e   ( V i t V j t Y i j sin θ i j δ i t + δ j t   Q L , i t ) Q L o s s t = 0
V i m i n V i t V i m a x t = 1 ,   2 , ,   24 i ,   j = 1 ,   2 , , N n o d e
where N n o d e   is the number of nodes, θ i j   is the angle of the node (i, j) element of the Y B U S admittance matrix, δ i t   and δ j t are the angle of voltage at nodes i and j at hour t, respectively, and V i t and V j t are the voltage magnitude at nodes i and j at hour t, respectively. Y i j is the magnitude of (i, j) element of the Y B U S admittance matrix. P P V , i t is the estimated hourly power of PV units of each node in kW, and P C h , i t and P D c h , i t are the battery charging and discharging values in kW, respectively. P L , i t is the hourly total active demanded load of each node in kW, and Q L , i t is the hourly total reactive demanded load of each node in kVAR. P L o s s t and Q L o s s   t are the hourly active and reactive power losses, respectively.

Battery Constraints

The limitations pertaining to the battery are associated with both the maximum charging and discharging power thresholds, along with the state of charge (SOC) of the battery, which are delineated as follows:
0   P C h t P C h , M a x 0   P D c h t P D c h , M a x P C h , M a x = P D c h , M a x = C r a t e . B c a p
S O C B a t t , m i n   S O C B a t t t S O C B a t t , M a x
u c h t , u d c h t = 0,1 u c h t + u d c h t 1 S O C B a t t t = S O C B a t t t 1 + 1 B c a p u c h t . P c h t × η c h u d c h t . P d c h t η D c h
where u c h t , u d c h t represent the state of charging and discharging of the battery, respectively. B c a p is the battery capacity, C r a t e is the battery’s C-Rates that limit the battery’s charging and discharging rates, S O C B a t t t and S O C B a t t t 1 indicate the stored energy level of the battery at hours t and t − 1, respectively, and S O C B a t t , m i n and S O C B a t t , M a x indicate the minimum and the maximum allowable stored energy levels in the battery, respectively. η c h and η D c h are the battery charging and discharging efficiencies, respectively.

Power Exchange Constraints

A constraint exists for the transfer of power between the MG and the electricity grid, which is referred to as the power exchange limitation, detailed as follows:
0   P b u y t P b u y , M a x 0   P s e l l t P s e l l , M a x u s e l l t + u b u y t 1

3. Multi-Objective Particle Swarm Optimization (MPSO) Algorithm

3.1. PSO Algorithm

The Particle Swarm Optimization (PSO) algorithm is employed to address the operational management challenge within the multi-node community microgrid (MG) under consideration. Renowned for its stability, accuracy, straightforward formulation and implementation, and prompt responsiveness, the PSO algorithm has emerged as a robust metaheuristic solution that is extensively utilized for optimizing diverse problems [29,30,31,32]. Originating in 1995 from the work of Kennedy and Eberhart [30], the PSO algorithm has found widespread application in the research community for tackling various optimization challenges [29,30,31,32]. In the PSO algorithm, a collective behavior akin to a group of animals is simulated, where these entities collaborate by sharing their knowledge to achieve a common objective. The group, referred to as the swarm, consists of individual entities termed particles. Commencing with an initial random population, each particle traverses the search space while recording its optimal encountered position. Collaboration among swarm members involves the exchange of best positions, facilitating active updates to individual positions and velocities based on both the particle’s best-experienced position and the globally shared optimal position. Consequently, particles collectively converge towards the global optimum in the search space, effectively exploring the optimization problem’s solution space.
Let f ( X ) denote the objective function to be minimized, where X represents a D-dimensional decision vector encompassing design variables. The total number of potential solutions is denoted by N s w a r m , representing the number of swarm particles or the population size. The particles engage in an iterative exploration of the search space, with a maximum number of iterations denoted as i t e r m a x . The velocity V i ( i t e r ) and position X i ( i t e r ) of the ith particle in the next iteration, iter, are updated using the following equations:
V i i t e r + 1 = ω · V i i t e r + c 1 · r a n d 1 · · P b e s t i i t e r X i i t e r + c 2 · r a n d 2 · · G b e s t i t e r X i i t e r
X i ( i t e r + 1 ) = X i i t e r + V i ( i t e r + 1 )
X i i t e r = x i , 1 i t e r , x i , 2 i t e r , ,   x i , d i t e r
where ω   is the inertia weight, and r a n d 1 ( · ) and r a n d 2 ( · ) are two different random numbers uniformly distributed in [0, 1]. P b e s t i i t e r is the best recorded previous experience of the ith particle in the iterth iteration. The best particle among the whole population (the position of the best particle corresponding to the minimum value of the objective function in a minimization problem) is presented by G b e s t i t e r . c 1 and c 2 are constant weights (mostly set to 2 [32]) of the stochastic acceleration terms that force each particle to move towards P b e s t i i t e r and G b e s t i t e r .

3.2. MPSO Algorithm

To analyze the economic and environmental performance of the multi-node community microgrids (MGs), a Multi-Objective Particle Swarm Optimization (MPSO) algorithm is employed to optimize both the cost and emission objective functions. In adapting the PSO algorithm for multi-objective optimization challenges, the principle of Pareto dominance is incorporated to produce non-dominated (Pareto-optimal) solutions, resulting in the generation of Pareto fronts. After each iteration of the MPSO algorithm, the updated Pareto-optimal solutions are preserved and stored in a repository. The procedural steps of the MPSO algorithm are outlined as follows:
  • Step 1: Specify the input variables and their ranges and the termination criterion.
  • Step 2: Generate initial solutions in the feasible design variable range based on the following:
    X = X m i n + r a n d [ X m a x X m i n ]
    where X represents the vector of decision variables considered as a potential solution, encompassing hourly battery charge and discharge rates, and the exchanged power with the main grid. X m i n and X m a x denote the lower and upper bounds of the design variables, respectively, while rand represents a random value that is uniformly distributed within the range of (0, 1).
  • Step 3: Assess the initial solutions by examining the constraints and computing the objective functions.
  • Step 4: Identify and record the non-dominated solutions in the repository.
  • Step 5: Identify both P b e s t i i t e r and G b e s t i t e r .
  • Step 6: Set iter = 1.
  • Step 7: Apply the PSO algorithm using Equations (11)–(13) to each existing solution to generate new or modified solutions.
  • Step 8: Verify compliance with the constraints for every newly generated solution. Subsequently, compute the objective functions for each of the new solutions.
  • Step 9: Substitute the current solution with the corresponding improved solution if any of the newly generated solutions prove to be superior to the existing ones, (updating P b e s t i i t e r ).
  • Step 10: Identify and preserve the non-dominated solutions from the modified solutions in the repository. Following that, determine the G b e s t i t e r from the solutions stored in the repository.
  • Step 11: Update G b e s t i t e r if any better solution is found in Step 10.
  • Step 12: Examine the termination criterion, and if it is met, conclude the algorithm, and proceed to Step 13. If the termination criterion is not satisfied, increment the iteration counter (iter) by 1 and return to Step 7.
  • Step 13: Display the solutions stored in the repository, representing them as the Pareto-optimal front.
The modular framework of the applied methodology is depicted in Figure 3. The input module comprises hourly input parameters, encompassing the output power of the PV units and load, and the electricity price. The optimization module employs the PSO (for single objective case) or MPSO (for multi-objective case) algorithm to address the optimal operation of the multi-node MG framework under consideration. The output module encompasses the optimal scheduling of units, the charging and discharging of batteries, the ENS at each hour, and the power exchange between the multi-node MG system and the electricity grid.

4. Simulation Results

To assess the OMS of the MG, various scenarios, encompassing both normal and abnormal operations, have been considered. In normal operation, we delve into two distinct case studies: single-objective and multi-objective MG operation management.
In the context of abnormal MG operation, different situations are considered. These scenarios involve instances where the MGs lose access (either entirely or partially) to the main grid or the available RESs due to natural disasters. In these abnormal conditions, the MGs might be called upon to aid by supporting critical loads in neighboring MGs that have lost their local generation resources, or by supplying power to emergency-related facilities like temporary water treatment systems or clinical facilities with increased power demands. Consequently, in Case 2, we simulate and analyze a sudden surge in the MG load as a part of this abnormal operational scenario. The considered scenarios are summarized in Table 2.
The battery data utilized for the simulation are presented in Table 3. The maximum power that can be exchanged with the main grid, i.e., P b u y , M a x and P s e l l , M a x , are set to 5000 kW.

4.1. Scenario 1: Normal Operation

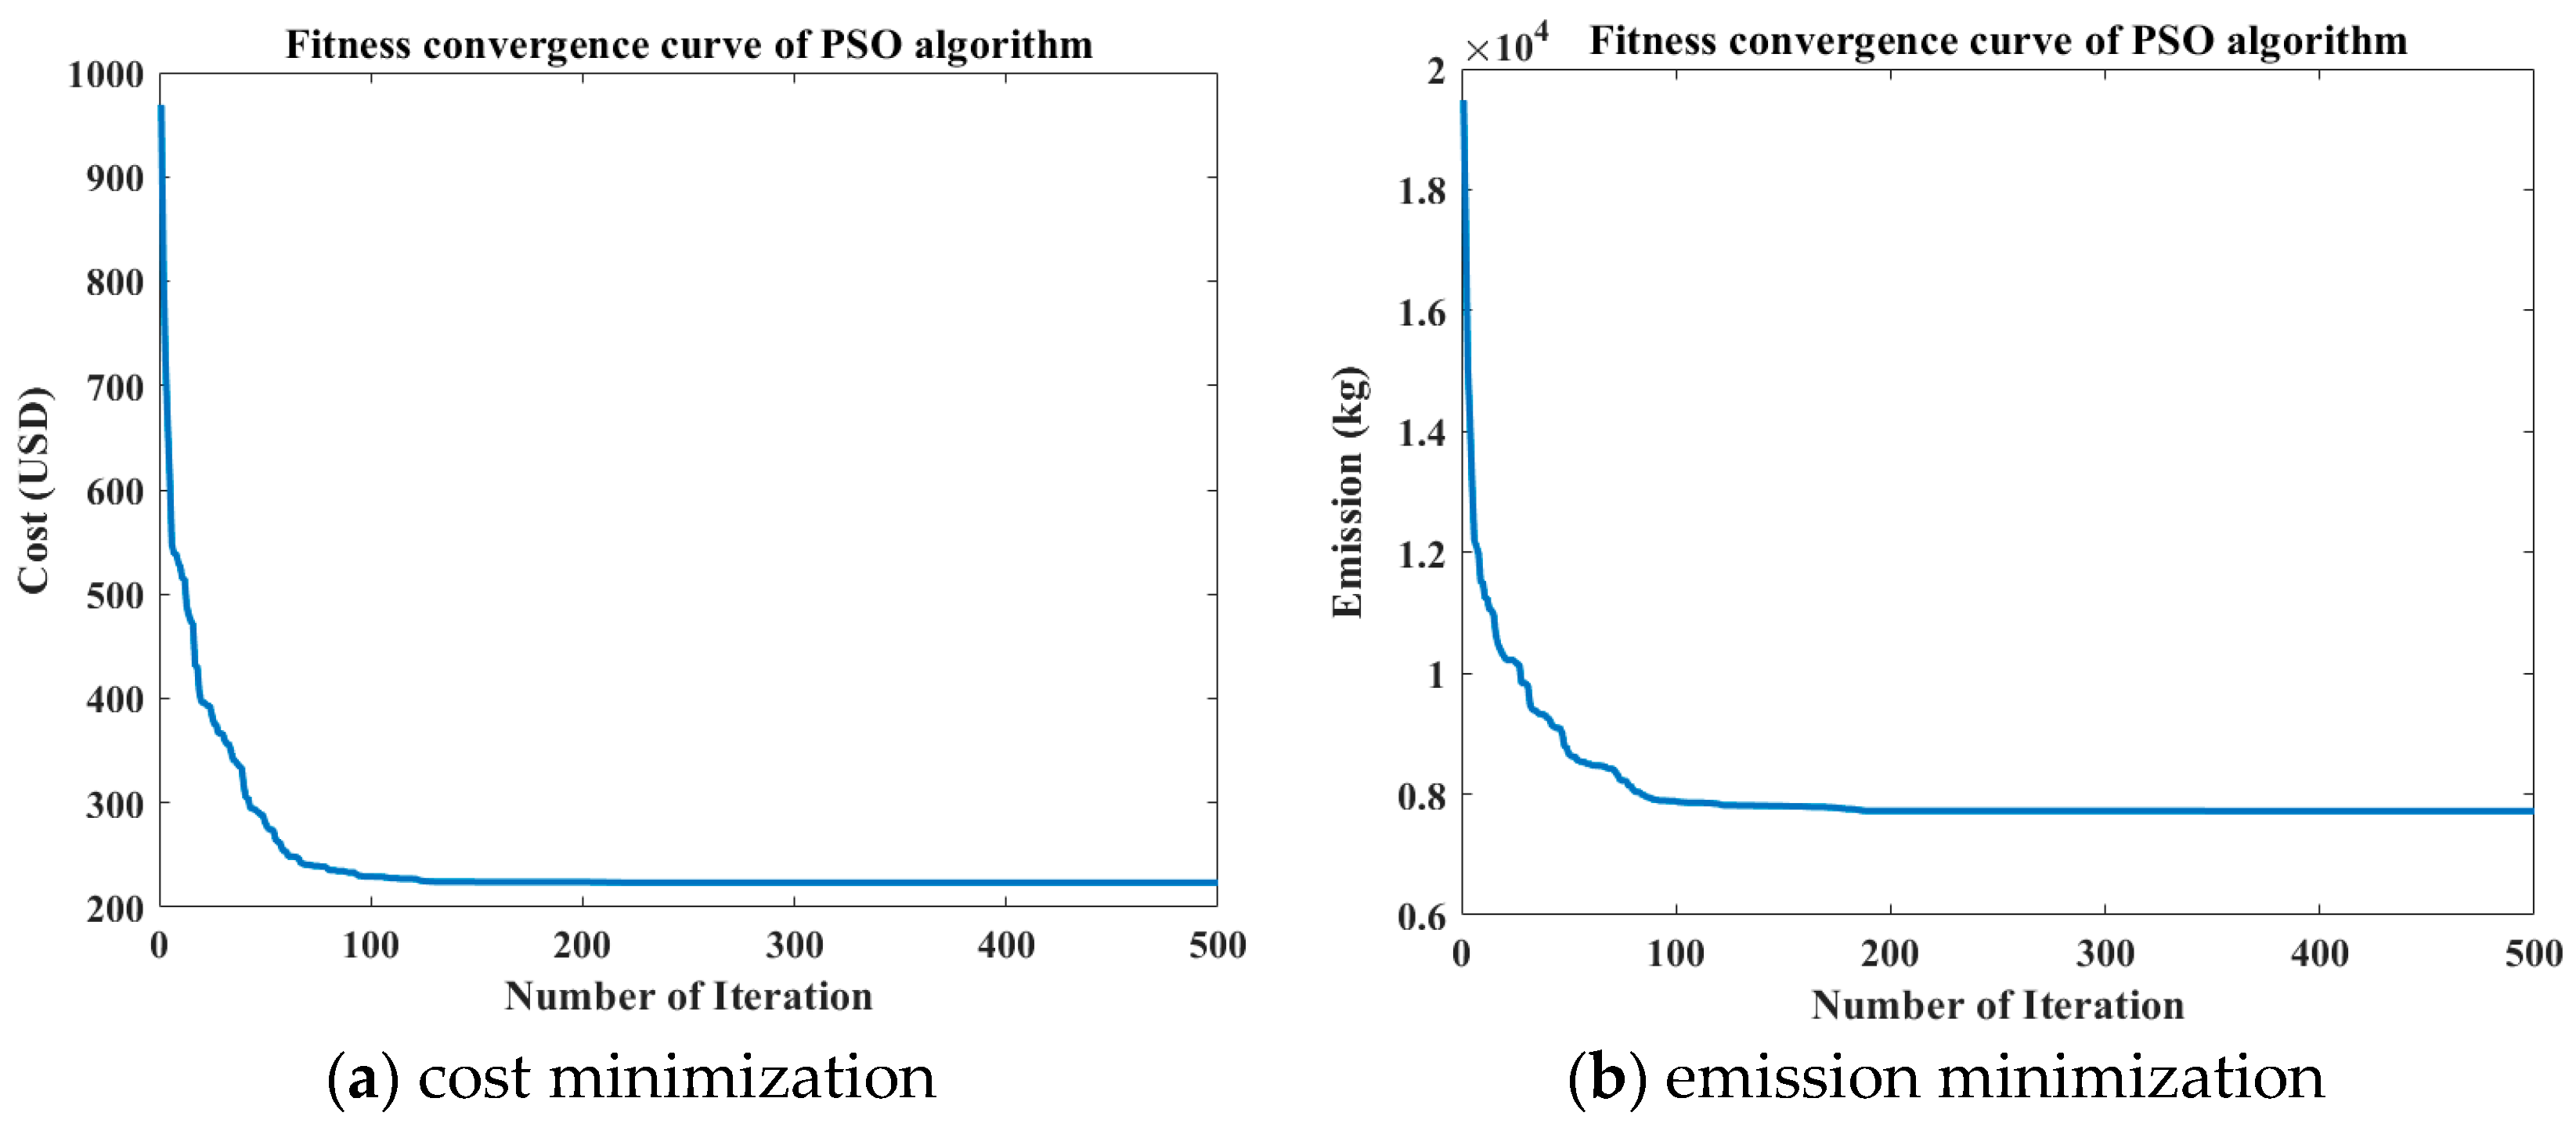
4.1.1. Scenario 1—Case 1: Single-Objective Operation Management

The initial case in Scenario 1 examined within this context focuses on the operation management of the multi-node MG during regular conditions, where the two objectives of minimizing the operational cost and emission are studied separately. To assess the efficacy of the proposed operation management strategy across various load situations and power generation levels from the PV system, we chose a peak day, a weekday, and a weekend in July as our evaluation points. The electricity price was assumed to be similar on all days [33]. The hourly electricity price is shown in Figure 4. The PSO algorithm is applied to solve the single-objective optimization problem modeled through Equations (1)–(10). Table 4 presents the parameters used in the PSO algorithm. The output power of PV panels, shown in Figure 5, is derived from the PVGIS tool [34] based on the location of the case study in our paper, i.e., Lombok Island, Indonesia, and the rated power of the PV panels. It should be noted that the PV generation profile is considered the same for all three of the different day load profiles (i.e., peak day, a weekday, or a weekend in July). The hourly demanded load of each node (Mina hotel, RSUD hospital, and a village nearby) of the multi-node MG on the peak day, a weekday, and a weekend in July are shown in Figure 6, Figure 7 and Figure 8.
The results of daily operation management (considering operational cost as the only objective function) of the studied multi-node MG for the peak day, a weekday, and a weekend in July are shown in Figure 9, Figure 10 and Figure 11, respectively. In these figures, the hourly power demand and other variables that are related to the consumption of power are shown with negative power values at each hour, while the variables that are related to the power supply have positive values. Batteries can play the roles of both power producers and consumers. During the charging intervals, batteries are considered as power consumers, while during discharging hours, they are considered as power producers. Furthermore, negative values related to the exchanged power with the electricity grid reveal selling power to the electricity grid, while positive values present purchasing power from the grid and power sharing from the electricity grid to the MG. It can be seen from the figures that the load demand is satisfied in all cases and the MG could obtain high revenue by selling the extra power to the main grid.
In Figure 9, Figure 10 and Figure 11, MG dispatch profiles are shown for minimizing operation cost (maximizing profit). The horizon of study starts from midnight, and it can be seen until 6:00 that the load demand is satisfied by the main electricity grid, and due to the low energy price, the battery is charged during these hours. During sunlight (from 6:00 to 15:00), the demand is fulfilled by PV system generation, and extra available PV power is stored in the battery or sold to the electricity grid. After 15:00, the demand is satisfied mainly by the battery and the electricity grid. Between 17:00 and 21:00, the electricity price is high; therefore, during these hours, the batteries are discharged to sell the stored energy to maximize the MG operation profit.
Figure 12, Figure 13 and Figure 14 show the nodes’ voltages for the considered peak day, a weekday, and a weekend in July, respectively. As is observed, the voltage levels of the nodes remain within the permissible ranges, which is [1.05, 0.95]. During the sunlight hours, the nodes’ voltage amplitudes are higher because of the PV generation system, and when the PV system generation is not available, the batteries discharge, and the nodes’ voltage amplitudes have lower values.
The results of daily operation management (considering the environmental index as the only objective function) of the studied multi-node MG for the peak day, a weekday, and a weekend in July are shown in Figure 15, Figure 16 and Figure 17, respectively. As depicted in the figures, it is evident that the load demand is adequately met in all instances, and the MG can generate substantial revenue by selling surplus power to the main grid. Until 6:00, the load demand is satisfied by the electricity grid, and the battery is charged during these hours to provide load demand when it is needed. Between 6:00 and 15:00, the PV system generation fulfills the demand, and extra available power via the PV generation system is stored in batteries. The battery system and the electricity grid satisfy the load after 15:00.
Figure 18, Figure 19 and Figure 20 illustrate the voltage levels at the nodes for the selected peak day, a typical weekday, and a weekend in July, respectively. It is noteworthy that the voltage levels at the nodes consistently remain within the allowable range. When the PV system output is high and the battery charging value is not so high, the nodes’ voltage amplitudes are higher, and during the discharging of the batteries that happens when the PV system generation is not available, the nodes’ voltage amplitudes have lower values.
The convergence process of the PSO algorithm for both the cost and emission objective functions for the operation management problem of the community MG, on a selected weekend in July, as an example, is shown in Figure 21. Also, Table 5 shows the worst, the best, the average, and the standard deviation (SD) of the fitness values over 10 trials with different random initial points. As can be seen in Table 5, the PSO algorithm has a good performance in solving the operation management problem of a multi-node community MG.

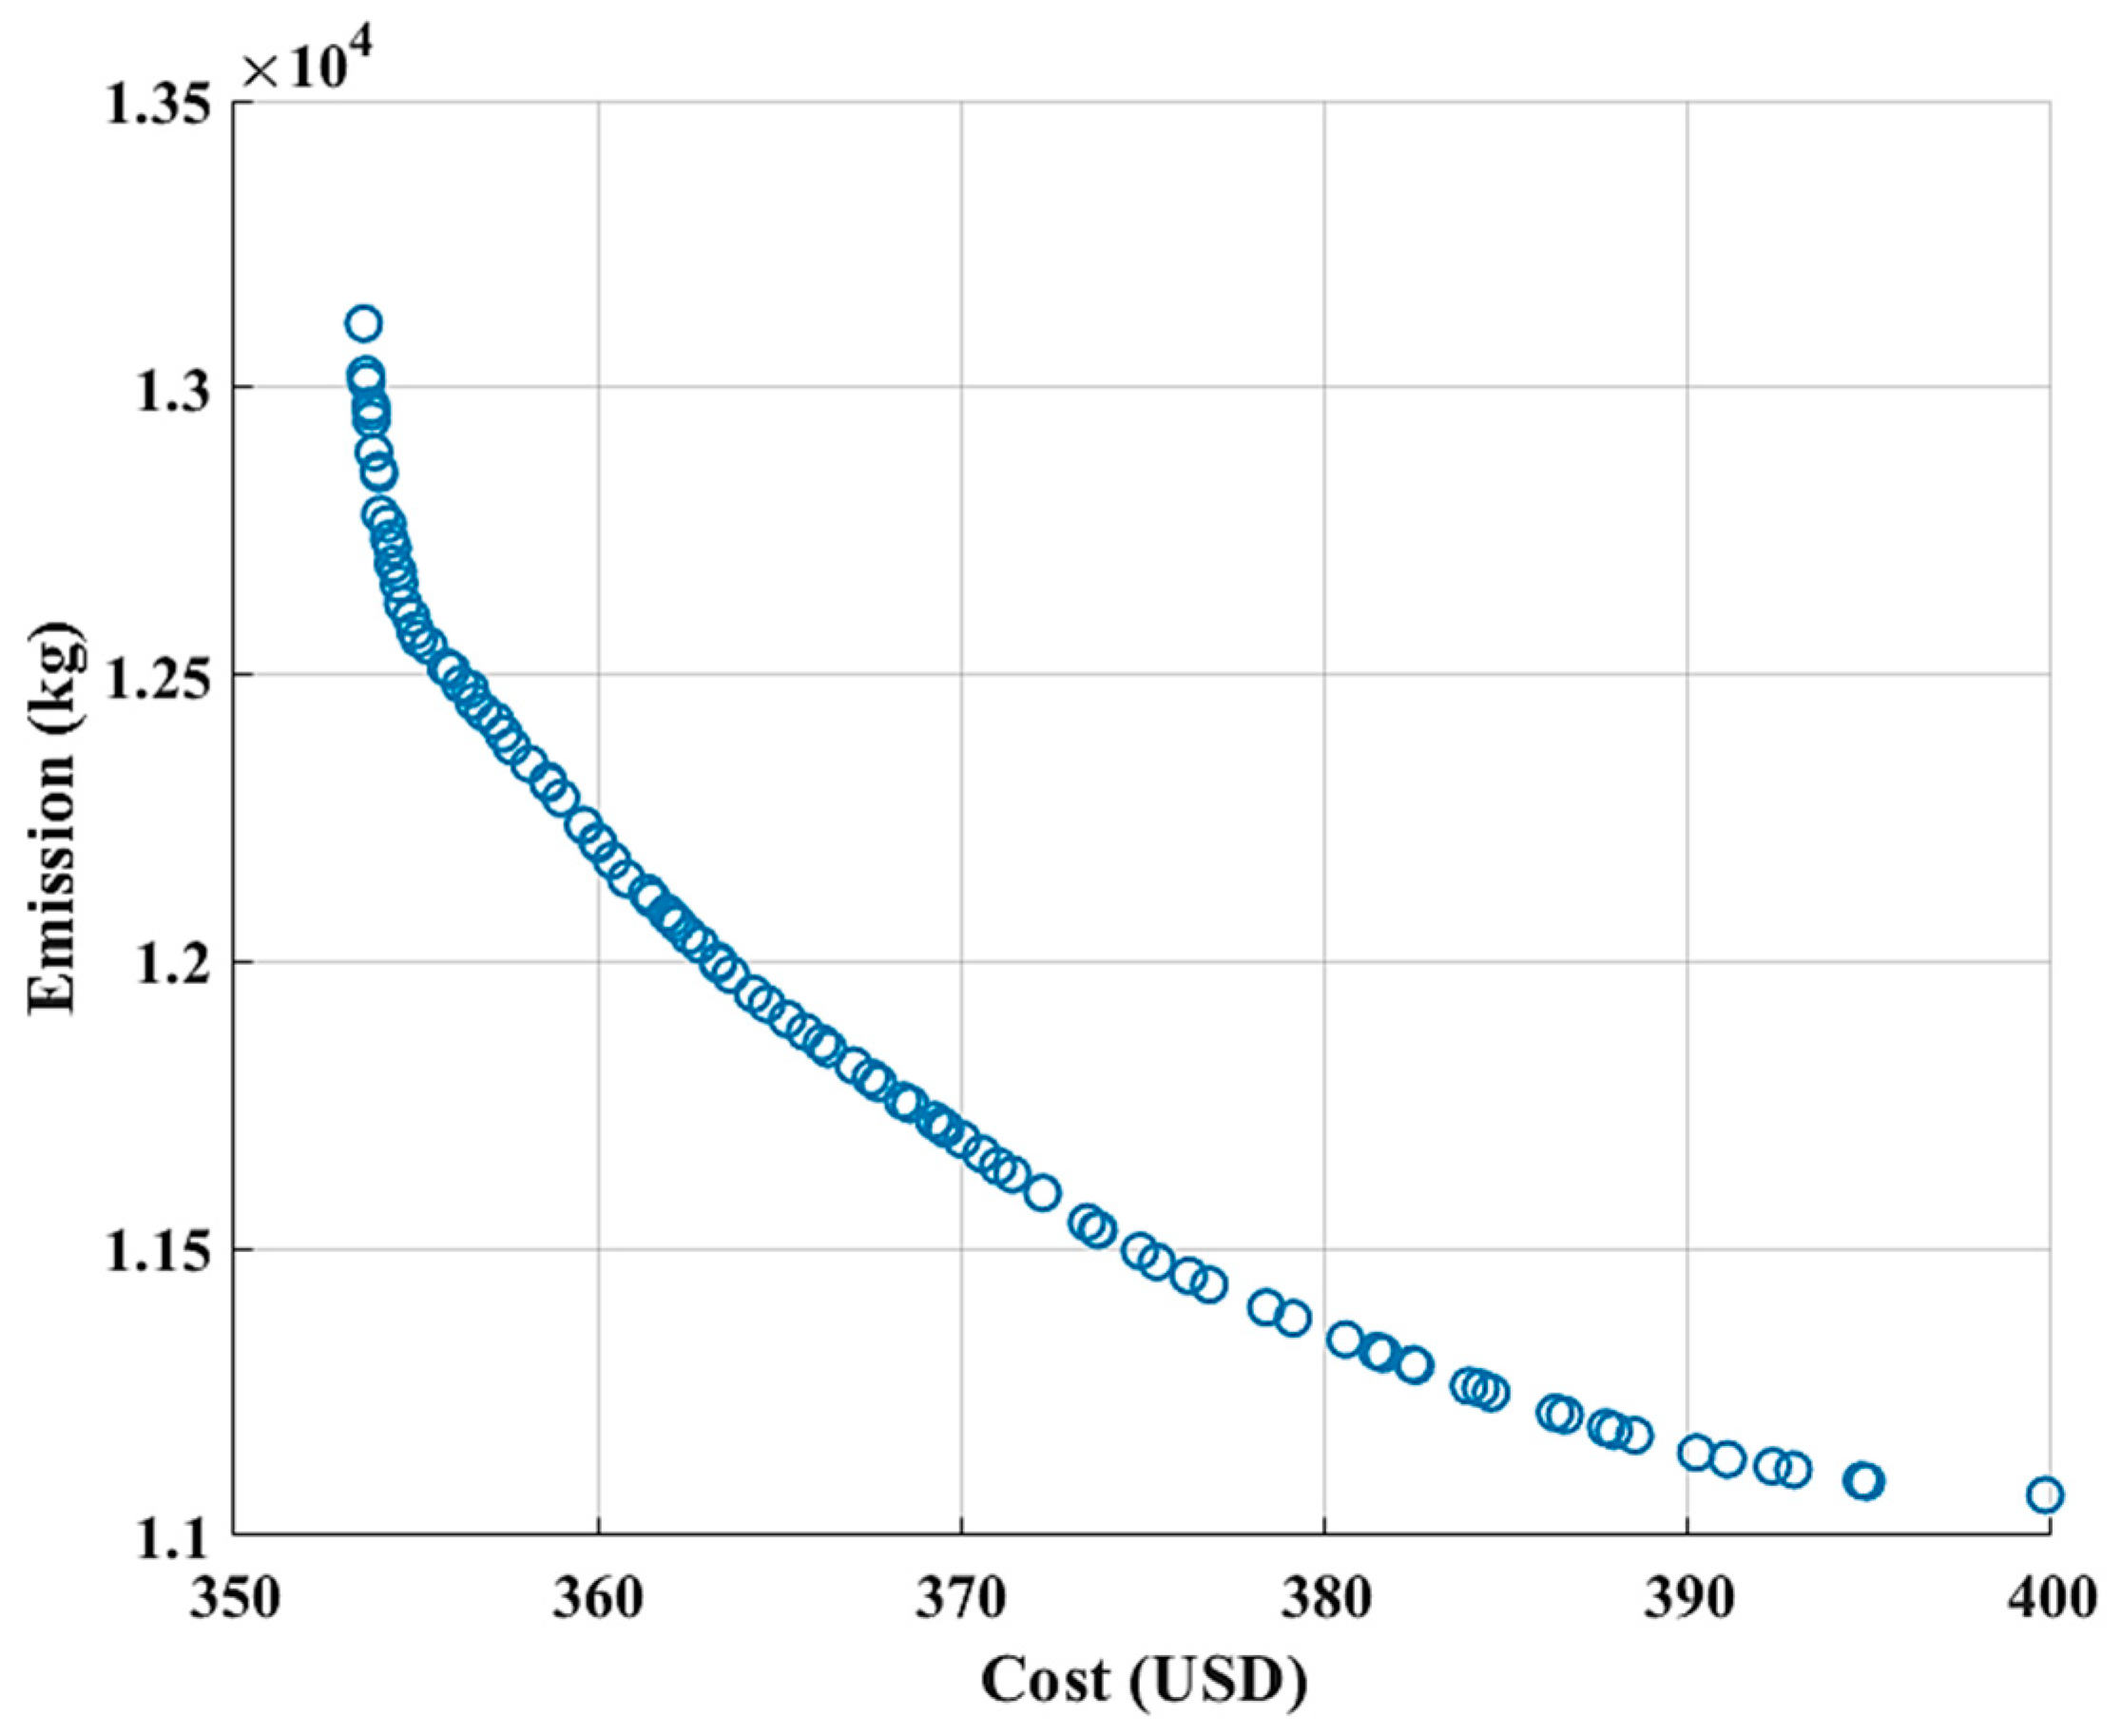
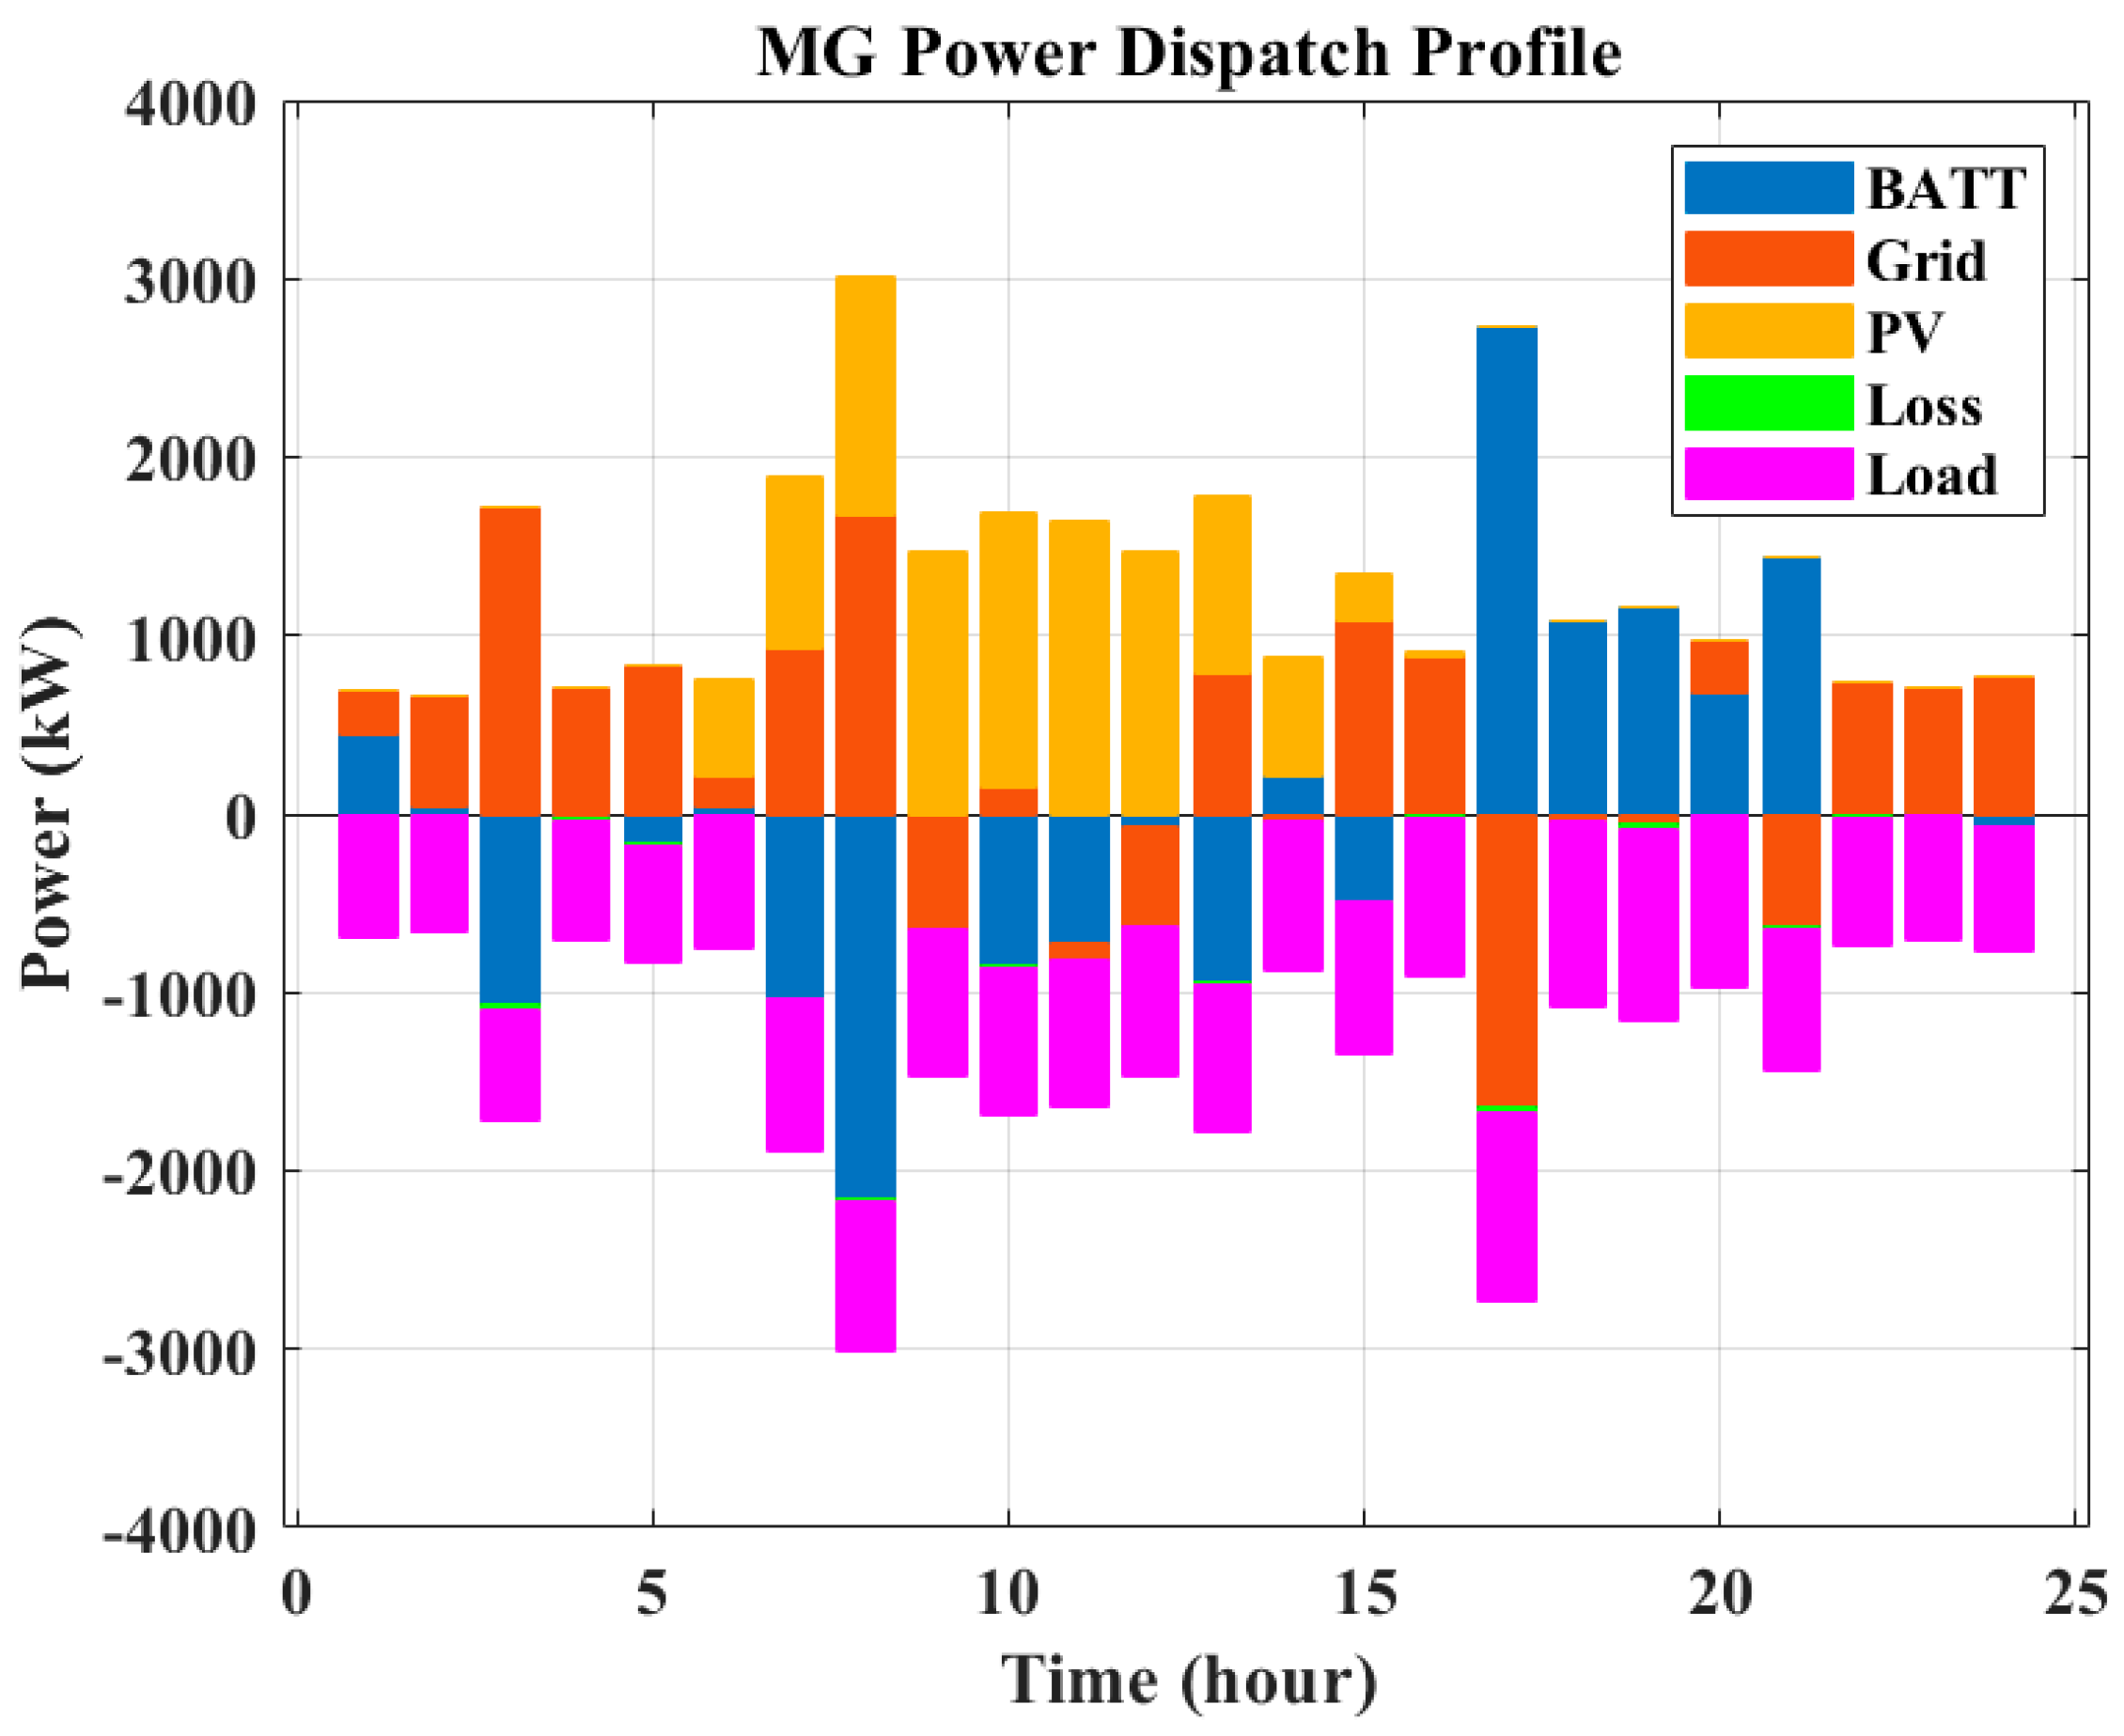
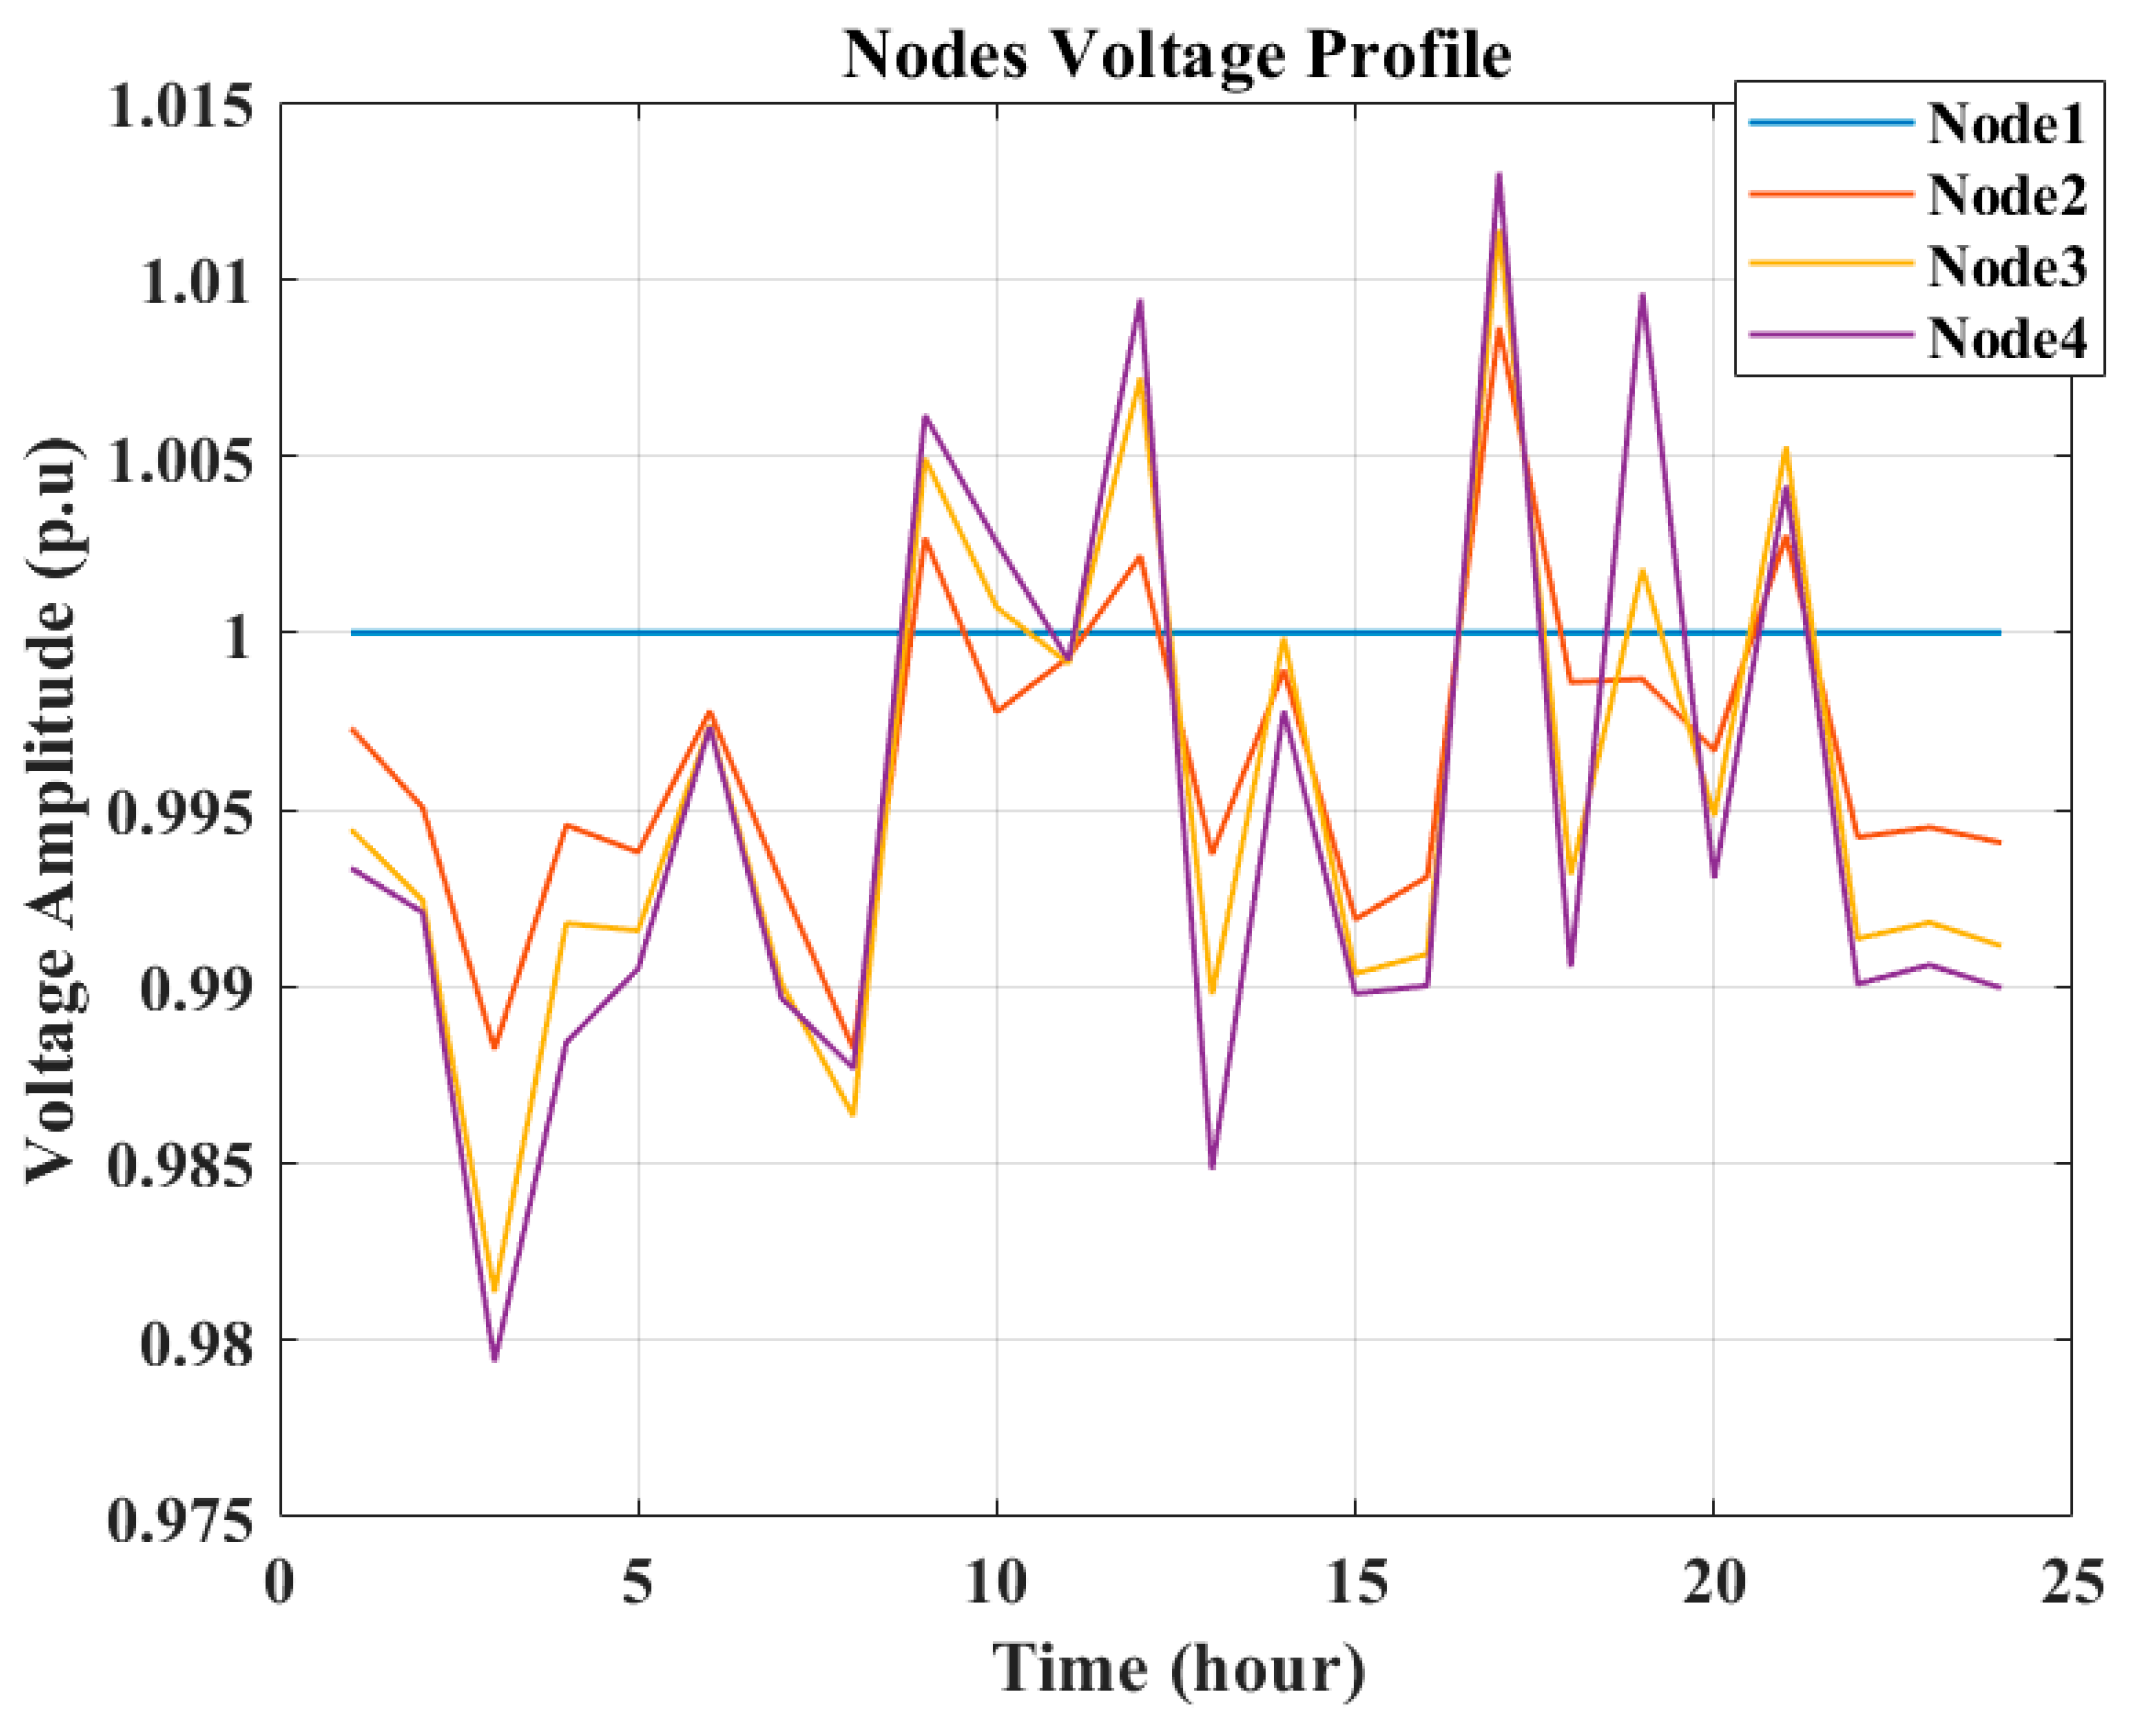
4.1.2. Scenario 1—Case 2: Multi-Objective Operation Management of the Multi-Node MG

In this section, both objectives, namely minimizing the operation cost and minimizing the total emission, are considered, and the MPSO algorithm is applied to solve the multi-objective MG operation management problem. According to Figure 22, the MG operator decides to choose one of the solutions in the set of solutions with different economic/environmental indices based on the priority of the indices. In Figure 22, the Pareto optimal front of the optimal operation of the considered multi-node MG is shown.

4.2. Scenario 2: Abnormal Operation

In this scenario, the aim is to explore the potential impacts of natural disasters on the system’s performance in three distinct cases. Subsequently, the effectiveness of the proposed OMS for the multi-node MG is assessed. These evaluations are conducted with a focus on the peak day in July 2022, with the primary objectives being the minimization in costs and the reduction in unsupplied energy.

4.2.1. Scenario 2—Case 1: Loss of 30% Capacity of the PV Power System

In this case, it is presumed that the electrical grid remains accessible, although 30% of the PV panels sustain damage starting from 12:00. The power scheduling of the units and the voltage profile of the nodes are presented in Figure 23 and Figure 24, respectively.

4.2.2. Scenario 2—Case 2: A Temporary Increase of 20% in the Islanded MG’s Load

In this case, it is assumed that the electrical grid is inaccessible, and there is a 20% surge in the load demand between 15:00 and 23:00. This increase in the load could be attributed to temporary facilities required during the natural disaster, such as medical services and water provision, or due to requests from neighboring areas whose power supply infrastructure has been compromised.
Figure 25 and Figure 26, respectively, show the power scheduling of the units and the SOC profile of the battery at each node under these conditions. It is assumed that the batteries are at 50% SOC at the beginning of the operation. As can be seen, there is a partial load that is not served at 4:00, and the full load is not served at 5:00. However, after 5:00, the PV power is available and supplies the whole demand of the MG between 6:00 and 14:00, during which the excess PV output is stored in the batteries. The PV and batteries fulfill the load between 15:00 and 16:00, and the load is fully satisfied only by batteries between 17:00 and 19:00. There is a partial load that is not served at 20:00, and it is observed that the hourly MG load cannot be supplied after 21:00. According to Figure 26, the battery SOC profile is maintained within the desired limits during the entire simulation horizon.

4.2.3. Scenario 2—Case 3: Loss of Access to the Main Electricity Grid

In this case, it is presumed that the MG loses its connection to the electricity grid due to a natural disaster, and the loads can only be supplied by the battery and PV units. The scheduling of power for these units and the SOC profile of the batteries are illustrated in Figure 27 and Figure 28, respectively. It is assumed that batteries are at 50% SOC at the beginning of the operation. It can be seen from the figures that there is a partial load that is not served at 4:00, and the full load is not served at 5:00. However, after 5:00, the PV power is available and supplies the whole demand of the MG between 6:00 and 14:00, during which the excess PV output is stored in the batteries. The PV and batteries fulfill the load between 15:00 and 16:00, and the load is fully satisfied only by batteries between 17:00 and 21:00. It is observed that the MG load cannot be supplied after 22:00. According to Figure 28, the battery SOC is maintained within the desired limits during the entire optimization horizon.
In Figure 27, it is observed that from 15:00 to 18:00, and from hour 21:00 to 24:00, ENS ≠ 0. One possible solution to solve the problem of fulfilling the not-served load is deploying ad hoc MGs that can be considered as a temporary supply to support the main installation.
The required load curtailment of the MG in all three cases is summarized in Table 6. It is observed that the amount of ENS is not zero in Case 2 and Case 3.

5. Conclusions

This paper provides a comprehensive analysis of the performance of an operation management system (OMS) designed for a community microgrid (MG) in Lombok, Indonesia, serving as a detailed case study under both normal and abnormal conditions. The central focus of this study revolves around framing the optimal operation management of MGs as a multi-objective optimization problem, where the primary objectives include minimizing the operational costs and reducing emissions while considering technical constraints such as the power flow and battery-related constraints. To tackle this complex challenge, the paper employs the multi-objective particle swarm optimization (MPSO) algorithm, which effectively generates Pareto optimal solutions, offering various trade-offs between the cost and emission indices, providing valuable insights for decision makers. The effectiveness of the proposed operation management strategies is rigorously assessed through the evaluation of multiple normal and abnormal operating scenarios. From the simulation results, in the abnormal operation conditions, when the access to the electricity grid is limited, the ENS increases to 2.88 MWh. During the fault scenario in which there is a 20% increase in the hourly load of each MG, a total of 4.5 MWh ENS is resulted. The research concludes that a resilient OMS can ensure a consistent and reliable energy supply in community MGs, even when faced with disruptions. In summary, this study underscores the critical importance of resilience in MGs, emphasizing their ability to provide dependable, secure, and sustainable energy solutions for communities and critical infrastructure. Embracing resilience measures, MGs can significantly contribute to building a more robust and adaptable energy infrastructure that is capable of confronting the uncertainties and challenges of the modern world. The findings of this study offer valuable insights into the optimal operation and resilience of community MGs with PV-battery systems. The Pareto optimal front provides decision makers with a range of solutions that balance economic, environmental, and operational considerations. Moreover, the analysis of abnormal scenarios underscores the importance of designing MG systems that are capable of withstanding unforeseen challenges. This research contributes to the advancement of sustainable energy solutions in remote and island communities and provides a framework for evaluating and optimizing MG operation management in real-world applications. The insights gained from this study can inform the development of resilient and efficient MG systems in similar regions worldwide, driving the adoption of renewable energy sources and enhancing energy security. To investigate more realistic scenarios, future works can include considering uncertainties of PV generation and load demand and solving the probabilistic optimal operation of community MGs.

Author Contributions

Conceptualization, M.J., H.P.A., N.B., J.C.V. and J.M.G.; methodology, M.J. and H.P.A.; software, H.P.A. and M.J.; validation, H.P.A. and M.J.; formal analysis, H.P.A. and M.J.; investigation, H.P.A., M.J. and N.B.; resources, M.J., H.P.A., N.B., J.C.V. and J.M.G.; data curation, M.J., H.P.A., N.B., J.C.V. and J.M.G.; writing—original draft preparation, M.J. and H.P.A.; writing—review and editing, M.J., H.P.A., N.B., J.C.V. and J.M.G.; visualization, M.J., H.P.A., N.B., J.C.V. and J.M.G.; supervision, J.C.V. and J.M.G.; project administration, J.C.V. and J.M.G.; funding acquisition, J.C.V. and J.M.G. All authors have read and agreed to the published version of the manuscript.

Funding

This work was sponsored by the Ministry of Foreign Affairs of Denmark, DANIDA Fellowship Centre (Project No. 20-M06-AAU) and supported by the Danida Fellowship Centre (https://www.energy.aau.dk/research/research-groups/crom/research-and-projects/microgrid-technologies-for-remote-indonesian-islands-tech-in (accessed on 6 December 2023)).

Institutional Review Board Statement

Not applicable.

Informed Consent Statement

Not applicable.

Data Availability Statement

Data is contained within the article.

Conflicts of Interest

The authors declare no conflict of interest.

References

  1. Karavas, C.S.G.; Plakas, K.A.; Krommydas, K.F.; Kurashvili, A.S.; Dikaiakos, C.N.; Papaioannou, G.P. A review of wide-area monitoring and damping control systems in Europe. In Proceedings of the 2021 IEEE Madrid PowerTech, Madrid, Spain, 28 June–2 July 2021; pp. 1–6. [Google Scholar]
  2. Boglou, V.; Karavas, C.S.; Karlis, A.; Arvanitis, K.G.; Palaiologou, I. An Optimal Distributed RES Sizing Strategy in Hybrid Low Voltage Networks Focused on EVs’ Integration. IEEE Access 2023, 11, 16250–16270. [Google Scholar] [CrossRef]
  3. Boglou, V.; Karavas, C.S.; Karlis, A.; Arvanitis, K. An intelligent decentralized energy management strategy for the optimal electric vehicles’ charging in low-voltage islanded microgrids. Int. J. Energy Res. 2022, 46, 2988–3016. [Google Scholar] [CrossRef]
  4. Rodrigues, S.D.; Garcia, V.J. Transactive energy in microgrid communities: A systematic review. Renew. Sustain. Energy Rev. 2023, 171, 112999. [Google Scholar] [CrossRef]
  5. Gholami, A.; Shekari, T.; Aminifar, F.; Shahidehpour, M. Microgrid scheduling with uncertainty: The quest for resilience. IEEE Trans. Smart Grid 2016, 7, 2849–2858. [Google Scholar] [CrossRef]
  6. Babu, V.V.; Roselyn, J.P.; Sundaravadivel, P. Multi-objective genetic algorithm-based energy management system considering optimal utilization of grid and degradation of battery storage in microgrid. Energy Rep. 2023, 9, 5992–6005. [Google Scholar] [CrossRef]
  7. Vásquez, L.O.P.; Redondo, J.L.; Hervás, J.D.Á.; Ramírez, V.M.; Torres, J.L. Balancing CO2 emissions and economic cost in a microgrid through an energy management system using MPC and multi-objective optimization. Appl. Energy 2023, 347, 120998. [Google Scholar] [CrossRef]
  8. AlOwaifeer, M.; Alamri, A.; Meliopoulos, A.S. Microgrid energy management system for normal and emergency operating conditions. In Proceedings of the 2019 North American Power Symposium (NAPS), Wichita, KS, USA, 13–15 October 2019. [Google Scholar]
  9. Yankson, S.; Ullah, S.S.; Ebrahimi, S.; Ferdowsi, F.; Ritter, K.A.; Chambers, T. Resilience-Enabling Load Flexibility and Resource Adequacy Investment in Microgrids. In Proceedings of the 2023 IEEE Texas Power and Energy Conference (TPEC), College Station, TX, USA, 13–14 February 2023. [Google Scholar]
  10. Suresh, V.; Janik, P.; Jasinski, M.; Guerrero, J.M.; Leonowicz, Z. Microgrid energy management using metaheuristic optimization algorithms. Appl. Soft Comput. 2023, 134, 109981. [Google Scholar] [CrossRef]
  11. Economic Benefits of Increasing Electric Grid Resilience to Weather Outages. Executive Office of the President. 2013. Available online: http://energy.gov/sites/prod/files/2013/08/f2/Grid%20Resiliency%20Report_FINAL.pdf (accessed on 24 August 2023).
  12. Millions Affected by Major Blackout to Be Compensated: PLN-Business-the Jakarta Post. Available online: https://www.thejakartapost.com/news/2019/08/05/millions-affected-by-major-blackout-to-be-compensated-pln.html (accessed on 22 August 2023).
  13. ESDM. Electricity Statistics 2020 [Statistik Kelistrikan 2020]; Ministry of Energy and Mineral Resources. Directorate General of Electricity [Kementrian Energi dan Sumber Daya Miner. Direktrat Jenderal Keteragalistrikan]: Jakarta, Indonesia, 2021; Volume 13, p. 122.
  14. Syamni, G.; Majid, M.S.A.; Siregar, W.V. Bankruptcy Prediction Models and Stock Prices of the Coal Mining Industry in Indonesia. Etikonomi 2018, 17, 57–68. [Google Scholar] [CrossRef]
  15. Hardianto, H. Utilization of Solar Power Plant in Indonesia: A Review. Int. J. Environ. Eng. Educ. 2019, 1, 1–8. [Google Scholar] [CrossRef]
  16. Rumbayan, M.; Abudureyimu, A.; Nagasaka, K. Mapping of solar energy potential in Indonesia using artificial neural network and geographical information system. Renew. Sustain. Energy Rev. 2012, 16, 1437–1449. [Google Scholar] [CrossRef]
  17. Available online: https://www.statista.com/ (accessed on 4 October 2023).
  18. Sendari, S.; Diantoro, M.; Nur, H.; Ling, L.S.; Rahmawati, Y.; Wibawanto, S.; Arengga, D.; Adriodanel, A.; Asmara, S.B. IoT-Based Monitoring System of PEMFC-Solar Cell Hybrid Prototype Power Plant. In Proceedings of the 2022 6th International Conference on Electrical, Telecommunication and Computer Engineering (ELTICOM), Medan, Indonesia, 22–23 November 2022. [Google Scholar]
  19. Tajjour, S.; Chandel, S.S. A comprehensive review on sustainable energy management systems for optimal operation of future-generation of solar microgrids. Sustain. Energy Technol. Assess. 2023, 58, 103377. [Google Scholar] [CrossRef]
  20. Dixit, S.; Singh, P.; Ogale, J.; Bansal, P.; Sawle, Y. Energy Management in Microgrids with Renewable Energy Sources and Demand Response. Comput. Electr. Eng. 2023, 110, 108848. [Google Scholar] [CrossRef]
  21. Rawa, M.; Abusorrah, A.; Al-Turki, Y.; Sindi, H.; Bassi, H.; Mostafa, M.H. Efficient energy management framework for enhancing the techno-economic-environmental performance of grid-connected microgrids under uncertain conditions. Ain Shams Eng. J. 2023, 15, 102336. [Google Scholar] [CrossRef]
  22. Alamir, N.; Kamel, S.; Hassan, M.H.; Abdelkader, S.M. An improved weighted mean of vectors algorithm for microgrid energy management considering demand response. Neural Comput. Appl. 2023, 35, 20749–20770. [Google Scholar] [CrossRef]
  23. Kumar, R.P.; Karthikeyan, G. A multi-objective optimization solution for distributed generation energy management in microgrids with hybrid energy sources and battery storage system. J. Energy Storage 2024, 75, 109702. [Google Scholar] [CrossRef]
  24. Szilagyi, E.; Petreus, D.; Paulescu, M.; Patarau, T.; Hategan, S.M.; Sarbu, N.A. Cost-effective energy management of an islanded microgrid. Energy Rep. 2023, 10, 4516–4537. [Google Scholar] [CrossRef]
  25. Agbehadji, I.E.; Abayomi, A.; Millham, R.C.; Frimpong, S.O.; Jung, J.J. Cost Optimization of Hybrid Renewable Energy System Based on Nature-Inspired Search Method. In International Conference on Soft Computing and Pattern Recognition; Springer International Publishing: Cham, Switzerland, 2021; pp. 279–292. [Google Scholar]
  26. Torkan, R.; Ilinca, A.; Ghorbanzadeh, M. A genetic algorithm optimization approach for smart energy management of microgrids. Renew. Energy 2022, 197, 852–863. [Google Scholar] [CrossRef]
  27. Available online: https://mina-tanjung-hotel.booked.net/ (accessed on 4 October 2023).
  28. RSUD Lombok Timur Hospital. Available online: https://rsudlomboktimur.co.id/ (accessed on 4 October 2023).
  29. Ridha, H.M.; Gomes, C.; Hazim, H.; Ahmadipour, M. Sizing and implementing off-grid stand-alone photovoltaic/battery systems based on multi-objective optimization and techno-economic (MADE) analysis. Energy 2020, 207, 118163. [Google Scholar] [CrossRef]
  30. Eberhart, R.; Kennedy, J. Particle swarm optimization. In Proceedings of the IEEE International Conference on Neural Networks, Perth, WA, Australia, 27 November–1 December 1995; Volume 4, pp. 1942–1948. [Google Scholar]
  31. Al-Kazemi, B.; Habib, S. Complexity analysis of problem-dimension using PSO. In Proceedings of the WSEAS International Conference on Evolutionary Computing, Cavat, Croatia, 12–14 June 2006; pp. 45–52. [Google Scholar]
  32. Ridha, H.M.; Gomes, C.; Hizam, H.; Ahmadipour, M. Optimal design of standalone photovoltaic system based on multi-objective particle swarm optimization: A case study of Malaysia. Processes 2020, 8, 41. [Google Scholar] [CrossRef]
  33. Available online: https://web.pln.co.id/statics/uploads/2022/08/Statistik-PLN-2021-29-7-22-Final.pdf (accessed on 10 June 2023).
  34. Photovoltaic Geographical Information System. Available online: https://re.jrc.ec.europa.eu/pvg_tools/en/ (accessed on 15 March 2023).
Figure 1. Number of natural disasters that have occurred in Indonesia from 2012 to 2022 [17].
Sustainability 15 16625 g001
Figure 2. Structure of the multi-node community MG in Lombok, Indonesia.
Sustainability 15 16625 g002
Figure 3. Flowchart of the modular structure of the implemented methodology for solving the problem of optimal operation of multi-node community MG.
Sustainability 15 16625 g003
Figure 4. Hourly electricity price [33].
Sustainability 15 16625 g004
Figure 5. Output power of PV system [34].
Sustainability 15 16625 g005
Figure 6. Hourly load profile in Node 2 (Mina Hotel) for a weekday, the peak day, and a weekend.
Sustainability 15 16625 g006
Figure 7. Hourly load profile in Node 3 (RSUD hospital) for a weekday, the peak day, and a weekend.
Sustainability 15 16625 g007
Figure 8. Hourly load profile of Node 4 (a village nearby) for a weekday, the peak day, and a weekend.
Sustainability 15 16625 g008
Figure 9. Power dispatch profile of the multi-node MG on a peak day in July (minimizing cost).
Sustainability 15 16625 g009
Figure 10. Power dispatch profile of the multi-node MG on a weekday in July (minimizing cost).
Sustainability 15 16625 g010
Figure 11. Power dispatch profile of the multi-node MG on a weekend in July (minimizing cost).
Sustainability 15 16625 g011
Figure 12. Nodes’ voltages on the peak day in July (minimizing cost).
Sustainability 15 16625 g012
Figure 13. Nodes’ voltages on a weekday in July (minimizing cost).
Sustainability 15 16625 g013
Figure 14. Nodes’ voltages on a weekend in July (minimizing cost).
Sustainability 15 16625 g014
Figure 15. Power dispatch profile of the multi-node MG on the peak day in July (minimizing emission).
Sustainability 15 16625 g015
Figure 16. Power dispatch profile of the multi-node MG on a weekday in July (minimizing emission).
Sustainability 15 16625 g016
Figure 17. Power dispatch profile of the multi-node MG on a weekend in July (minimizing emission).
Sustainability 15 16625 g017
Figure 18. Nodes’ voltages on the peak day in July (minimizing emission).
Sustainability 15 16625 g018
Figure 19. Nodes’ voltages on a weekday in July (minimizing emission).
Sustainability 15 16625 g019
Figure 20. Nodes’ voltages on a weekend in July (minimizing emission).
Sustainability 15 16625 g020
Figure 21. Convergence process of PSO algorithm for (a) cost and (b) emission objective functions (solving the operation management problem on a weekend in July).
Sustainability 15 16625 g021
Figure 22. Pareto optimal front of the multi-objective operation management problem of multi-node MG.
Sustainability 15 16625 g022
Figure 23. Scenario 2—Case 1: power scheduling of community MG units.
Sustainability 15 16625 g023
Figure 24. Scenario 2—Case 1: nodes’ voltages.
Sustainability 15 16625 g024
Figure 25. Scenario 2—Case 2: power scheduling of units of community MG.
Sustainability 15 16625 g025
Figure 26. Scenario 2—Case 2: SOC level of batteries in each node.
Sustainability 15 16625 g026
Figure 27. Scenario 2—Case 3: power scheduling of units of community MG.
Sustainability 15 16625 g027
Figure 28. Scenario 2—Case 3: SOC level of batteries in each node.
Sustainability 15 16625 g028
Table 1. Installed PV and battery in each node of the multi-node MG.
PV (kWp)Battery Capacity (kWh)
Node 214973887
Node 314974773
Node 414974767
Table 2. Overview of the considered scenarios.
ScenarioCase
Scenario 1: Normal operationCase 1: Single-objective operation management
Case 2: Multi-objective operation management
Scenario 2: Abnormal operationCase 1: Loss of 30% capacity of the PV power system
Case 2: A temporary increase of 20% in the islanded MG’s load
Case 3: Loss of access to the main electricity grid
Table 3. Battery data.
C r a t e S O C m i n S O C m a x S O C i n i t i a l η c h = η D c h
0.7   C 30%100%50%90%
Table 4. PSO parameters.
wC1C2 N s w a r m i t e r m a x
0.9227201000
Table 5. Evaluating the performance of the PSO algorithm over 10 trials.
CaseBestWorstAverageSD
Cost minimization (USD)223.48232.8225.111.091
Emission minimization (kg)7718.367723.047720.021.49
Table 6. Comparison of the total ENS in different fault cases.
#Abnormal Operating SituationENS (MWh)
Case 1: PV panels are 30% down 0
Case 2: 20% increase in the load demand (no grid)4.5
Case 3: grid is not available2.882
Disclaimer/Publisher’s Note: The statements, opinions and data contained in all publications are solely those of the individual author(s) and contributor(s) and not of MDPI and/or the editor(s). MDPI and/or the editor(s) disclaim responsibility for any injury to people or property resulting from any ideas, methods, instructions or products referred to in the content.

