Abstract
The COVID-19 pandemic has had a significant impact on the economic operations of many cities worldwide. Because tourism depends on migratory qualities, it has been severely constrained by the pandemic, which has affected the tourism business in several places. The research period for this paper is 2019–2021, and a comprehensive analysis of the spatiotemporal evolution pattern and influencing factors of the tourism economic resilience of China’s coastal cities is conducted using the resistance index, Theil index, spatial autocorrelation analysis, and geographic detector model with the goal of deepening the theory of tourism economic resilience and providing a reference for the sustainable development of tourism. The results revealed several trends. First, in terms of temporal changes, the fluctuation trend of tourism’s economic resilience in each city before and after the pandemic had a certain degree of stability and convergence, with only a few cities showing significant differences in their amplitude of fluctuations in 2021. Second, in the spatial pattern, the regions with high resilience and relatively high resilience were mainly concentrated in the western, northeastern, and eastern regions, and the northeastern-eastern regions with relatively high resilience were gradually developed in the agglomeration and a contiguous pattern. Third, the influencing factors of tourism’s economic resilience before and after the pandemic, despite differences, are still largely affected by the combined influence of the city’s economic level, industrial structure, tourism resource endowment, and other factors.
1. Introduction
The outbreak of the novel coronavirus 2019 (COVID-19) was an unprecedented public health event that had a huge impact on major economies around the world [1]. At the beginning of the pandemic, China’s GDP in the first quarter of 2020 showed a negative growth of −6.8% compared to 2019. With strict traffic control, shutdowns, and other measures, the government was able to cut off the virus’s transmission path in time. As a result, the economy of the nation recovered quickly from the devastating effects of COVID-19, with a GDP growth rate of 2.3% in 2020, making it the only country with positive growth in major global economies [2]. However, the pandemic still exhibited a recurrent pattern because of the virus’s ongoing mutation and the fast global migration of people, prompting numerous adjustments to China’s pandemic prevention strategy. Adapting to COVID-19 created a problem for all facets of society’s development.
The tourism industry is characterized by a wide range of industries and a strong driving force, which makes it play an important role in promoting economic growth and other aspects. According to the Culture and Tourism Development Statistics Bulletin (2019) released by the Ministry of Culture and Tourism at the beginning of 2020, China’s domestic tourist arrivals in 2019 amounted to 6.006 billion, an increase of 8.4% compared with the same period of the previous year, and the total income from tourism amounted to 663 million, an increase of 11.1% year-on-year. This shows that tourism has become an important part of the national economy and an important economic source for the region.
According to relevant data, the number of domestic tourist arrivals in 2020 was 2.879 billion, down 3.022 billion from the same period the previous year, with a 52.1% decrease rate; domestic tourism revenue was CNY 2.23 trillion, down CNY 3.50 trillion from the same period last year, with a 61.1% decrease. Globalization is under threat at the international level, with a large number of tourism enterprises shutting down for extended periods. The sensitivity and vulnerability that characterize tourism make it one of the most exposed and slowest to recover from shocks in the global economic system. Despite the current declining pathogenicity of the virus, the global and long-term socio-economic and transportation mobility impacts of the spread of COVID-19 continue. It is, therefore, crucial to study the impact and recovery processes of crisis events such as COVID-19 on the tourism industry. Accurately assessing the level of tourism economic resilience before and after COVID-19 in the coastal region can provide substantial guidance and recommendations for resilience enhancements and the sustainable development of the tourism economy in the future. On this basis, this paper focuses on the following issues: (1) What are the characteristics of the spatiotemporal distribution of tourism economic resilience among coastal cities under COVID-19? (2) What are the differences in tourism economic resilience across coastal cities? (3) What factors are responsible for the regional differences in tourism economic resilience?
The article is structured as follows: Section 2 summarizes the current research progress on tourism’s economic resilience through a literature review, laying the foundation for subsequent research. Section 3 introduces the research area, research methods, and the selection of influencing factors. Section 4 calculates tourism’s economic resilience in coastal cities through the resistance index and introduces the Theil index and Moran index to analyze its spatial distribution characteristics, revealing the spatiotemporal evolution characteristics of the tourism economic resilience of coastal cities and using the geographic detector to analyze the influencing factors. Section 5, based on the analysis of the spatial distribution characteristics of tourism economic resilience in this study and the research results of influencing factors, summarizes the theoretical significance of this study and proposes relevant suggestions for the policy formulation of future urban tourism development and the industrial development strategy of resilient city construction. Section 6 summarizes the main research results of this study and puts forward the limitations of this study and the prospects for future research.
2. Literature Review
This study primarily investigates the resilience of the tourism economy in coastal cities in the context of the COVID-19 pandemic. To enhance our understanding of the concept and research progression of tourism’s economic resilience, this section reviews previous studies. Initially, we examine the concept of resilience and its evolution while also organizing its theoretical development and empirical research within the realm of regional economics. This establishes a theoretical foundation for studying tourism’s economic resilience in coastal regions. Subsequently, we delve into related tourism research. We first review tourism studies in coastal cities to understand the current state of tourism research in coastal areas. This provides a reference for this paper to focus on certain characteristics of coastal cities. Next, we review tourism research in the context of crisis events. Given the recent emergence of the COVID-19 pandemic, related research is still scarce. Therefore, this research overview extends to tourism crisis events exemplified by COVID-19. By comparing this with past crisis events, we can highlight the unique characteristics of the COVID-19 pandemic. Finally, we review the progress of tourism resilience research. This section summarizes the research fields of tourism resilience, the methods of resilience assessment, and the analysis of influencing factors. It clarifies the current shortcomings of tourism resilience research in the economic field, providing a breakthrough for the research in this paper.
2.1. Resilience
2.1.1. Concept and Development of Resilience
Resilience, a mechanical concept first used in physics, comes from the Latin word resilire. It refers to the ability of a material to deform and have a tendency to recover potential energy due to external forces without complete deformation. In 1973, Holling first introduced the concept of resilience into ecology, which refers to the ability of a system to recover quickly back to its initial state and maintain its original structure and function after a shock [3]. In 2000, Adger introduced resilience into social sciences [4]. Since then, resilience is no longer only used to explain the dynamics of natural systems but has also been gradually expanded to social, economic, and other disciplines. The scope of research and research objects are also increasingly diversified.
2.1.2. Progress in the Study of Regional Economic Resilience
In the field of economics, the introduction of the concept of resilience appeared in Reggiani’s research on spatial economic systems [5], and since then, resilience analysis has been more rapidly promoted and applied in the field of economics. At the same time, due to the frequent occurrence of various types of global crises, especially after the 2008 financial crisis, regional resilience in the aftermath of crises has become a popular research issue in academia, and the concept of “regional economic resilience” has gradually emerged. Some scholars have divided the development of research on regional economic resilience into the following two phases: the concept of regional economic resilience was developed and launched between 2002 and 2010. Since 2010, regional economic resilience, bolstered by a plethora of theoretical and empirical studies, has entered an exploratory phase [6]. The current research on regional economic resilience is mainly divided into the following two aspects: theoretical research and empirical research (Table 1).

Table 1.
The study of regional economic resilience.
In terms of theoretical research, the current research mainly includes the interpretation of concepts and connotations and theoretical analysis methods from different perspectives. In the conceptualization of regional economic resilience, Martin et al. consider it to be the ability of a regional economy to withstand shocks and restore its growth path, encompassing the following four dimensions: vulnerability, resistance, adaptability, and recoverability [7]. Some scholars have also argued that this resilience refers not only to the ability to face short-term crises but also to consider the region’s resilience in response to longer-term perturbations [8]. The equilibrium perspective and the evolutionary perspective are the two mainstream cognitive perspectives used in the theoretical analysis method of regional economic resilience. The equilibrium perspective includes engineering resilience and ecological resilience, and the evolutionary perspective mainly focuses on the study of evolutionary resilience.
In terms of empirical research, it mainly includes the discussion of the regional economic resilience measurement and influencing factors. There are two primary approaches in the field of resilience measurement research. The first approach, known as the main indicator method, chooses a core variable to gauge the economic resilience of a region. Examples of such core variables include GDP, output, and population employment. Martin used output levels and employment numbers to assess the economic resilience of the United Kingdom between 1972 and 2010 [9]. Building a resilience indicator system is the second approach, and creating an assessment framework with several dimensions has become popular in regional resilience assessments. At present, there is still no consensus on the selection of indicators, so the indicator systems constructed by different scholars are quite different. Frazier et al. constructed a resilience assessment system from the following nine dimensions: societal, economic, institutional, infrastructure, community capital, regulatory, ecological, temporal, and spatial, and assigned weights to different indicators [10]. Zhang Shuai et al. constructed an urban economic resilience evaluation index system from the three dimensions of absorptive capacity, restorative capacity, and conversion capacity to evaluate the level of urban economic resilience in the three northeastern provinces [11]. In the study of influencing factors, scholars pay much attention to the influence of industrial structure, innovation capacity, the institutional environment, social capital, etc., on regional economic resilience, and the industrial structure is generally recognized as a crucial factor affecting the resilience of the regional economy. Desrochers et al. argued that a diversified industrial structure acts as a shock absorber, dispersing the impact of shocks. Additionally, because of the variety of industries, there is a greater chance of a shock striking the system [12]. Martin summarizes the various types of influencing factors affecting the resilience of the regional economy into three categories, namely, constitutive factors, common factors, and environmental factors, highlighting the importance of the industrial structure, governmental management, and the ecological environment [13].
2.2. Tourism and Resilience
2.2.1. Coastal Cities Tourism Study
The abundant tourism resources and complex ecological environment of the coastal area have made it a popular area for scholars to conduct tourism research. Most of the current domestic and international studies on the coastal area are conducted in the context of natural environmental changes, with the ecological level of research as the main focus. Zhan Yarong et al. measured the social–ecological system resilience of coastal tourism destinations in Liaoning Province from 2006 to 2015 through the construction of an indicator system and the introduction of a variable fuzzy identification model [14]. Liu Jia et al. studied the spatiotemporal evolution pattern of environmental tourism’s carrying capacity and its formation mechanism in China’s coastal areas between 2000 and 2018, using the DPSIR model to build an index system for evaluating environmental tourism’s carrying capacity based on multi-scale spatial units [15]. Emma et al. used Samoa as a case to examine whether PPPs can help the South Pacific tourism industry adapt to climate change [16].
However, there are fewer studies on coastal tourism at home and abroad at the social and economic levels, especially for coastal tourism resilience. At present, only a few scholars in China have conducted research on the tourism flow network in the eastern coastal region, and the research scale is regional. Cheng Xuelan et al. used Python to collect travel route data from five major city clusters on China’s east coast. They then built a tourism network for the city clusters and applied social network analysis to uncover the structural features of the tourism flow network [17]. Fang Yelin et al. used Python software to collect data on the tourism routes of five major city clusters in China’s eastern coastal region and evaluated their structural characteristics and structural resilience on the basis of constructing a tourism flow network [18].
2.2.2. Tourism Research in the Face of Crisis Events
As an important economic source in this region, tourism resilience research has also received extensive attention from the academic community. At present, due to the frequent occurrence of various types of crisis events, the impact of crisis events on tourism has gradually become a research hotspot for scholars at home and abroad. Related tourism research in the context of COVID-19 also originates from the study of the tourism crisis. With regard to the connotations of the tourism crises, scholars at home and abroad have recognized the definition given by the World Tourism Organization as “an unanticipated event that affects travelers’ confidence in a destination and disrupts the normal operation of the tourism industry”, and some scholars equate tourism crises with sudden crisis events, thus making the connotation of tourism crises broader [19].
In the existing literature, scholars have mainly focused on the impact of specific crisis events on tourism, such as financial turmoil, earthquakes [20], terrorist incidents, and public health events. Wu Jun examined the regional tourism competitiveness of 17 cities in Shandong Province under the influence of the SARS epidemic in 2003 through principal component analysis [21]. Zhang Tiesheng et al. analyzed the impact of crisis events such as SARS, international financial crises, and natural disasters on Zhangjiajie’s tourism based on the background trend line model and tourism statistics from 2001 to 2011 [22]. Ruan Wenqi et al. took the “8-8 Jiuzhaigou Earthquake” as an example to explore the intensity and spatial difference of the impact of natural disaster-type crisis events on tourism demand in the source area [23]. The COVID-19 pandemic has had a significant impact on the global economy, with the tourism industry being the most severely affected [24]. Due to the highly contagious nature of COVID-19, most regions have adopted strict control measures, severely affecting the mobility of people. Many tourism businesses have also suspended operations to comply with prevention and control policies [25]. Therefore, the impact of the COVID-19 pandemic on tourism activities has attracted widespread attention from scholars. Stefan et al. compared the impact of COVID-19 with previous epidemics and other types of global crises to explore how epidemics have changed societies, economies, and tourism [26]. Yang Yang et al. used an analytical tool called the “COVID-19 Tourism Index” to monitor the tourism impact of the pandemic [27].
COVID-19 is significantly different from previous natural crises, financial crises, etc. This pandemic is a global public health event with the following characteristics: First of all, because it is worldwide, this means that many internal and external exchanges are disrupted. In addition, as the pandemic spreads, more globally dependent regions find themselves forced to make policy changes that could help the tourism sector recover. Secondly, it is a public health event, a category of events that primarily affect human health and life safety and requires moderate social distancing due to its highly contagious nature. Therefore, factors like ecological conditions and population density might be given more consideration. As a result, it is important to clearly define how the current crisis differs from earlier ones, and this research should be carried out based on the characteristics of COVID-19.
2.2.3. Tourism Resilience Study
Tourism resilience research originated in the 1990s, and the current research on tourism resilience mainly focuses on specific tourist destinations. The research focuses on community resilience [28,29], environmental resilience [30], socio-ecological resilience [14,31], and economic resilience. The ecological level of resilience is the primary focus, while the economic level has received less attention, and the connotation of tourism’s economic resilience has received insufficient attention. Based on the existing literature and regional economic resilience studies [32,33,34], this paper defines tourism’s economic resilience as “the ability of the tourism economic system to withstand external disturbances and restore its growth path”.
The assessment of resilience and the analysis of influencing factors are important parts of tourism resilience research, and there are two main methods for measuring tourism resilience. The first one is the resilience proxy method, i.e., a certain core indicator is selected to measure resilience, and this type of method is usually based on time series data. Cui et al. measured the economic resilience of the tourism industry in Guangdong-Hong Kong-Macao Greater Bay Area cities using two indicators, resistance, and recoverability, in accordance with Martin’s measure [35]. The second type of method is the indicator system method, which is a comprehensive assessment of tourism resilience based on a series of indicators. This type of method is mainly based on cross-sectional data and is operational and widely used but lacks a recognized and reasonable indicator system. Wang Qian et al. developed an evaluation system based on four dimensions, namely resilience, recovery, reconstruction, and renewal, to assess the resilience of China’s tourism economic system from 2010 to 2016 [36]. Pang Dongyan et al. developed an evaluation index system to assess the resilience of Shandong Province’s tourism economic system from the perspectives of resistance, recovery, and innovation [37]. To summarize, different scholars use different indicator variables due to different research objects and perspectives.
In terms of the influencing factors, what is involved in the current research can be categorized as internal and external factors. Internal factors mainly refer to the development conditions of the tourism industry itself, such as the structure of the industry and the endowment of tourism resources. External factors include subjective factors and environmental factors, among which human subjective factors include communities, enterprises, the government, and other subjects of interest. As for the influence of environmental factors, most scholars believe that the level of technological innovation and the quality of the ecological environment play a significant role in the resilience of the tourism economy. Wang Qian et al. analyzed the influencing factors of China’s tourism economic resilience and concluded that factors such as the level of the tourism economy, the degree of marketization, the ecological environment, the level of science and technology, the rate of economic growth, and the innovation capacity of the tourism industry have a significant impact on the resilience of the tourism economic system [36]. Pengyang Zhang analyzed China’s tourism economic resilience from the perspectives of resistance and recoverability, and in terms of influencing factors, they believed that the level of technological innovation, the quality of the ecological environment, the government’s management ability, and the structure of the tourism industry play a vital role in the resilience of the tourism economy [38].
In conclusion, studies on resilience, both domestically and internationally, have yielded comparatively rich results; however, tourism resilience has received less attention. From the perspective of research content, the existing research on tourism resilience mainly focuses on tourist destinations, including community resilience, environmental resilience, social and ecological resilience, etc., and there are fewer studies on the resilience of tourism’s economic system. Moreover, most of the existing results still focus on the role of tourism in overall regional economic resilience [39,40], ignoring the abundant implications of tourism economic resilience as an independent system. The analysis of influencing factors is still insufficient, and the existing literature mostly examines the independent influence of multiple variables [36,37], ignoring the intrinsic correlation between the influencing elements. In terms of research scales, most tourism resilience studies focus on community resilience or small destinations [28,29]; most tourism economic resilience studies take the provincial scale as the basic research unit [34], with fewer studies at the municipal scale. Based on this, this paper takes China’s coastal cities as the study area and analyzes the spatiotemporal evolution characteristics of tourism’s economic resilience as well as the influencing factors using tourism-related data from 2019 to 2021. It is anticipated that by expanding the theory of tourism’s economic resilience, a useful foundation for future developments in the coastal tourism industry can be found, enabling policy adjustments and the establishment of a resilient tourism economic system that is capable of handling unforeseen crises. At the same time, it can also provide ideas for the current industrial development of resilient city construction as well as the strategic choice of regional economic development.
3. Materials and Methods
3.1. Study Area
Through the establishment of coastal open cities and other initiatives, the state has improved the environment for the growth of coastal cities since the reform and opening up. As a result, the economy of coastal cities has grown by leaps and bounds, and they have become China’s most economically developed regions with the richest resource conditions and the highest degree of openness. At the same time, the inherent superior geographic location and resource endowment of the coastal area have also laid the foundation for the development of tourism, making it the core area of China’s tourism industry. However, the regional imbalance between coastal areas still exists and is becoming more pronounced, which has also resulted in the waste of tourism resources and the obstruction of regional development. In response to this, the coastal area has become a popular area for domestic and foreign scholars to conduct tourism research [41,42,43].
As the most open region in this country, its tourism industry is also more susceptible to the impact of the pandemic, but different cities have been affected differently and have recovered at different rates in the face of the impact. Consequently, it is crucial to investigate the distribution characteristics of tourism’s economic resilience in coastal cities during the sudden crisis and to understand the factors that contribute to regional variations in tourism’s economic resilience. This can help to advance coastal city tourism development in the future, create a resilient tourism economic system to withstand the crisis and address the issue of regional imbalance.
Coastal cities refer to municipalities and prefecture-level cities with coastlines and the seas and islands under their jurisdiction. According to the Classification and Code of Coastal Administrative Regions [44], there are currently 55 coastal cities in China, including Dandong, Dalian, Panjin, Yingkou, Jinzhou, Huludao in Liaoning; Qinhuangdao, Tangshan, Cangzhou in Hebei; Binzhou, Dongying, Weifang, Yantai, Weihai, Qingdao, Rizhao in Shandong; Lianyungang, Yancheng, Nantong in Jiangsu; Jiaxing, Zhoushan, Ningbo, Taizhou, Wenzhou, Hangzhou, Shaoxing in Zhejiang; Ningde, Fuzhou, Putian, Quanzhou, Xiamen, and Zhangzhou in Fujian; Chaozhou, Shantou, Jieyang, Shanwei, Huizhou, Guangzhou, Dongguan, Shenzhen, Jiangmen, Zhongshan, Zhuhai, Yangjiang, Maoming, and Zhanjiang in Guangdong; Beihai, Qinzhou, and Fangchenggang in Guangxi; Haikou, Danzhou, Sanya, Sansha in Hainan, and the two municipalities directly under the central government of Tianjin and Shanghai. Among them, due to its unique characteristics, Sansha City is not open to tourism, and official statistical data are not disclosed. Therefore, this study focuses on the coastal cities, excluding Sansha City. These coastal cities are the core areas of China’s tourism industry, and due to their high degree of openness, they are easily impacted by unexpected events, thus making them highly representative.
3.2. Research Methods
3.2.1. Resistance Index
Martin proposed a method to measure regional economic resilience using two indicators: resistance and recoverability [7]. The study period selected for this paper is 2019–2021, which is a period when the pandemic has not yet ended; therefore, this study uses the resistance index to reflect tourism resilience.
The equation for the change in the city’s expected tourism economic output is as follows:
where denotes the amount of change in economic output expected in city r during the resistance or recovery period (t + k); denotes the economic output of the tourism industry (i) in year t in each coastal city r; and denotes the rate of change in the economic output of the country as a whole during the period (t + k). Then, a measure of regional resistance can be expressed as follows:
where denotes the actual change in the tourism economic output of city r over the resistance period and denotes the expected change in th tourism economic output of city r over the resistance period.
indicates that the city’s tourism economic resistance in the face of shocks is higher than the average at the national level, while indicates that it is lower than the average at the national level.
3.2.2. Theil Index
The Theil index was initially used for the measurement of the imbalance of the economic level between regions and was then widely used in different fields such as economy and society [45,46]. The source of inter-regional differences can be clarified through the measurement of the Thiel index, and furthermore, inter-regional and intra-regional differences can be portrayed. In this paper, the Thiel index is used to portray the regional differences in the level of economic resilience of tourism, and the equations are as follows:
where T is the tourism economic resilience level; is the regional tourism economic resilience level; is the average regional tourism economic resilience level; is the interregional variance; is the intraregional variance. , and the larger the value of T, the larger the reflection of regional differences.
3.2.3. Spatial Autocorrelation Analysis
The first law of geography states that everything is related to everything else, but near things are more related than distant things [47]. This article uses the spatial econometric software GeoDa 1.20 to conduct spatial autocorrelation analysis to test whether the tourism economy resilience of coastal cities is significantly correlated with neighboring cities. Spatial autocorrelation analysis is divided into global and local spatial autocorrelation. This article uses Moran’s I index and LISA statistics to represent global and local spatial autocorrelation, respectively. The calculation method is as follows:
where n is the number of study areas; is the spatial weight matrix; and are the observed values on the spatial unit; and is the mean value.
3.2.4. Geographical Detector Model
The geodetector is a new statistical method that detects spatially stratified heterogeneity and reveals the driving factors behind it. They have been widely used in many fields of natural and social sciences [48,49]. Therefore, this article employs geodetector to explore the relationship between different influencing factors and the tourism economic resilience of coastal cities.
- (1)
- Factor detector
This can be used to detect to what extent factor X explains the spatial differentiation of attribute Y. It is measured by the q value, which is expressed as follows:
where q represents the degree to which the detection factor explains the spatial differentiation of tourism’s economic resilience with a value between 0 and 1. The larger the q value, the stronger the explanatory power of the factor for tourism economic resilience, and vice versa. By comparing the q values of each factor, we can identify the main factors that affect the spatial variation in tourism’s economic resilience in each city. n is the total sample size of the study area; is the total variance of the study area; L is the number of categories; and are the sample size and variance of region h, respectively.
- (2)
- Interactive detector
Interaction detection can identify the interaction between different influencing factors, that is, evaluate whether the explanatory power of different factors for tourism economic resilience increase or decrease when they work together or detect whether the impact of these factors on tourism economic resilience is independent of each other. The judgment criteria are as follows in Table 2:
Table 2.
Interaction detection criterions.
3.3. Index Selection and Data Sources
The tourism economic resilience in various cities during the pandemic was impacted by a multitude of factors, which, in turn, affected the resistance and recoverability exhibited by various regions in the face of an unexpected crisis. From the previous literature, it can be understood that tourism’s economic resilience is often closely related to the regional economic level, industrial structure, ecological environment, tourism resource endowment, etc. Overall, these influencing factors can be divided into the following two levels: internal factors and external factors. With reference to the current research results at home and abroad, combined with the characteristics of the COVID-19 pandemic and the availability of data, this study quantitatively analyzes the impact of the following indicators on the resilience of the tourism economy in terms of both the regional basic conditions and the tourism industry’s own conditions and explores the changes in the resilience of the tourism economy of each city under the interaction of internal and external factors (Table 3).
Table 3.
Index system of factors influencing the resilience of the tourism economy.
Regional basic conditions typically refer to various factors that influence the development of a specific region, generally involving economic, social, and ecological aspects. These conditions together constitute the basic conditions of the region, profoundly impacting regional economic development, social progress, and ecological environment protection. As an important industry in the region, the tourism industry also relies on the support of regional basic conditions. Only by deeply understanding the impact of these conditions on the tourism industry can we achieve sustainable development of the tourism industry. The regional economic level is a vital condition for the development of the tourism industry. The improvement of the regional economic level can not only drive the rapid development of the tourism industry but also provide stable economic support for it. This article selects three factors, namely, financial security level (X1), industrial structure (X2), and economic openness level (X3), to reflect the level of urban economic development [33,37]. The social development level is closely related to the development of the tourism industry. This article selects two factors, namely, the urbanization level (X4) and resident consumption level (X5), to, respectively, to reflect the urbanization process and residents’ consumption needs. The rapid process of urbanization and the improvement of residents’ consumption levels have promoted the development of the tourism industry [50]. However, high levels of urbanization also mean a more compact spatial structure, which may be more vulnerable to the impact of pandemics and, thus, affect the tourism economy of that region. At the ecological level, the following two factors were selected: urban greening level (X6) and urban air quality status (X7). Good ecological conditions can provide rich resource conditions for a city’s tourism industry, thereby enhancing its attractiveness. Meanwhile, under the influence of pandemics, people may also tend to choose cities with superior ecological conditions when selecting tourist destinations.
Tourism resource endowment is an important foundation for the development of the tourism industry in cities. Abundant tourism resources can enhance the appeal of the tourism industry, attracting more tourists. In times of crisis, a solid foundation of tourism resources typically signifies a more pronounced advantage in recovery [51]. In order to represent the state of tourist resources in cities, this article explores the following two factors: the industry’s agglomeration efficiency (X8) and the diversity of its resources (X9). The protection motivation theory states that people often act in a protective manner in response to the risks they perceive as real [52,53]. COVID-19 is a highly infectious public health event that threatens human health. Therefore, people may be more inclined to choose areas with less traffic and better ecological conditions when traveling. Thus, this article selects the proportion of natural scenic spots in A-level scenic spots (X10) to reflect the types of tourist attractions in cities. The structure of tourist sources can reflect the degree of dependence of a city’s tourism industry on external sources. Regions with a high dependence on external sources may be more severely impacted during crises, but they may also be more likely to revitalize their tourism economy through the use of external resources after a crisis. This article selects two indicators, namely, the number of foreign tourists (X11) and domestic tourists (X12), to reflect the composition of tourist sources.
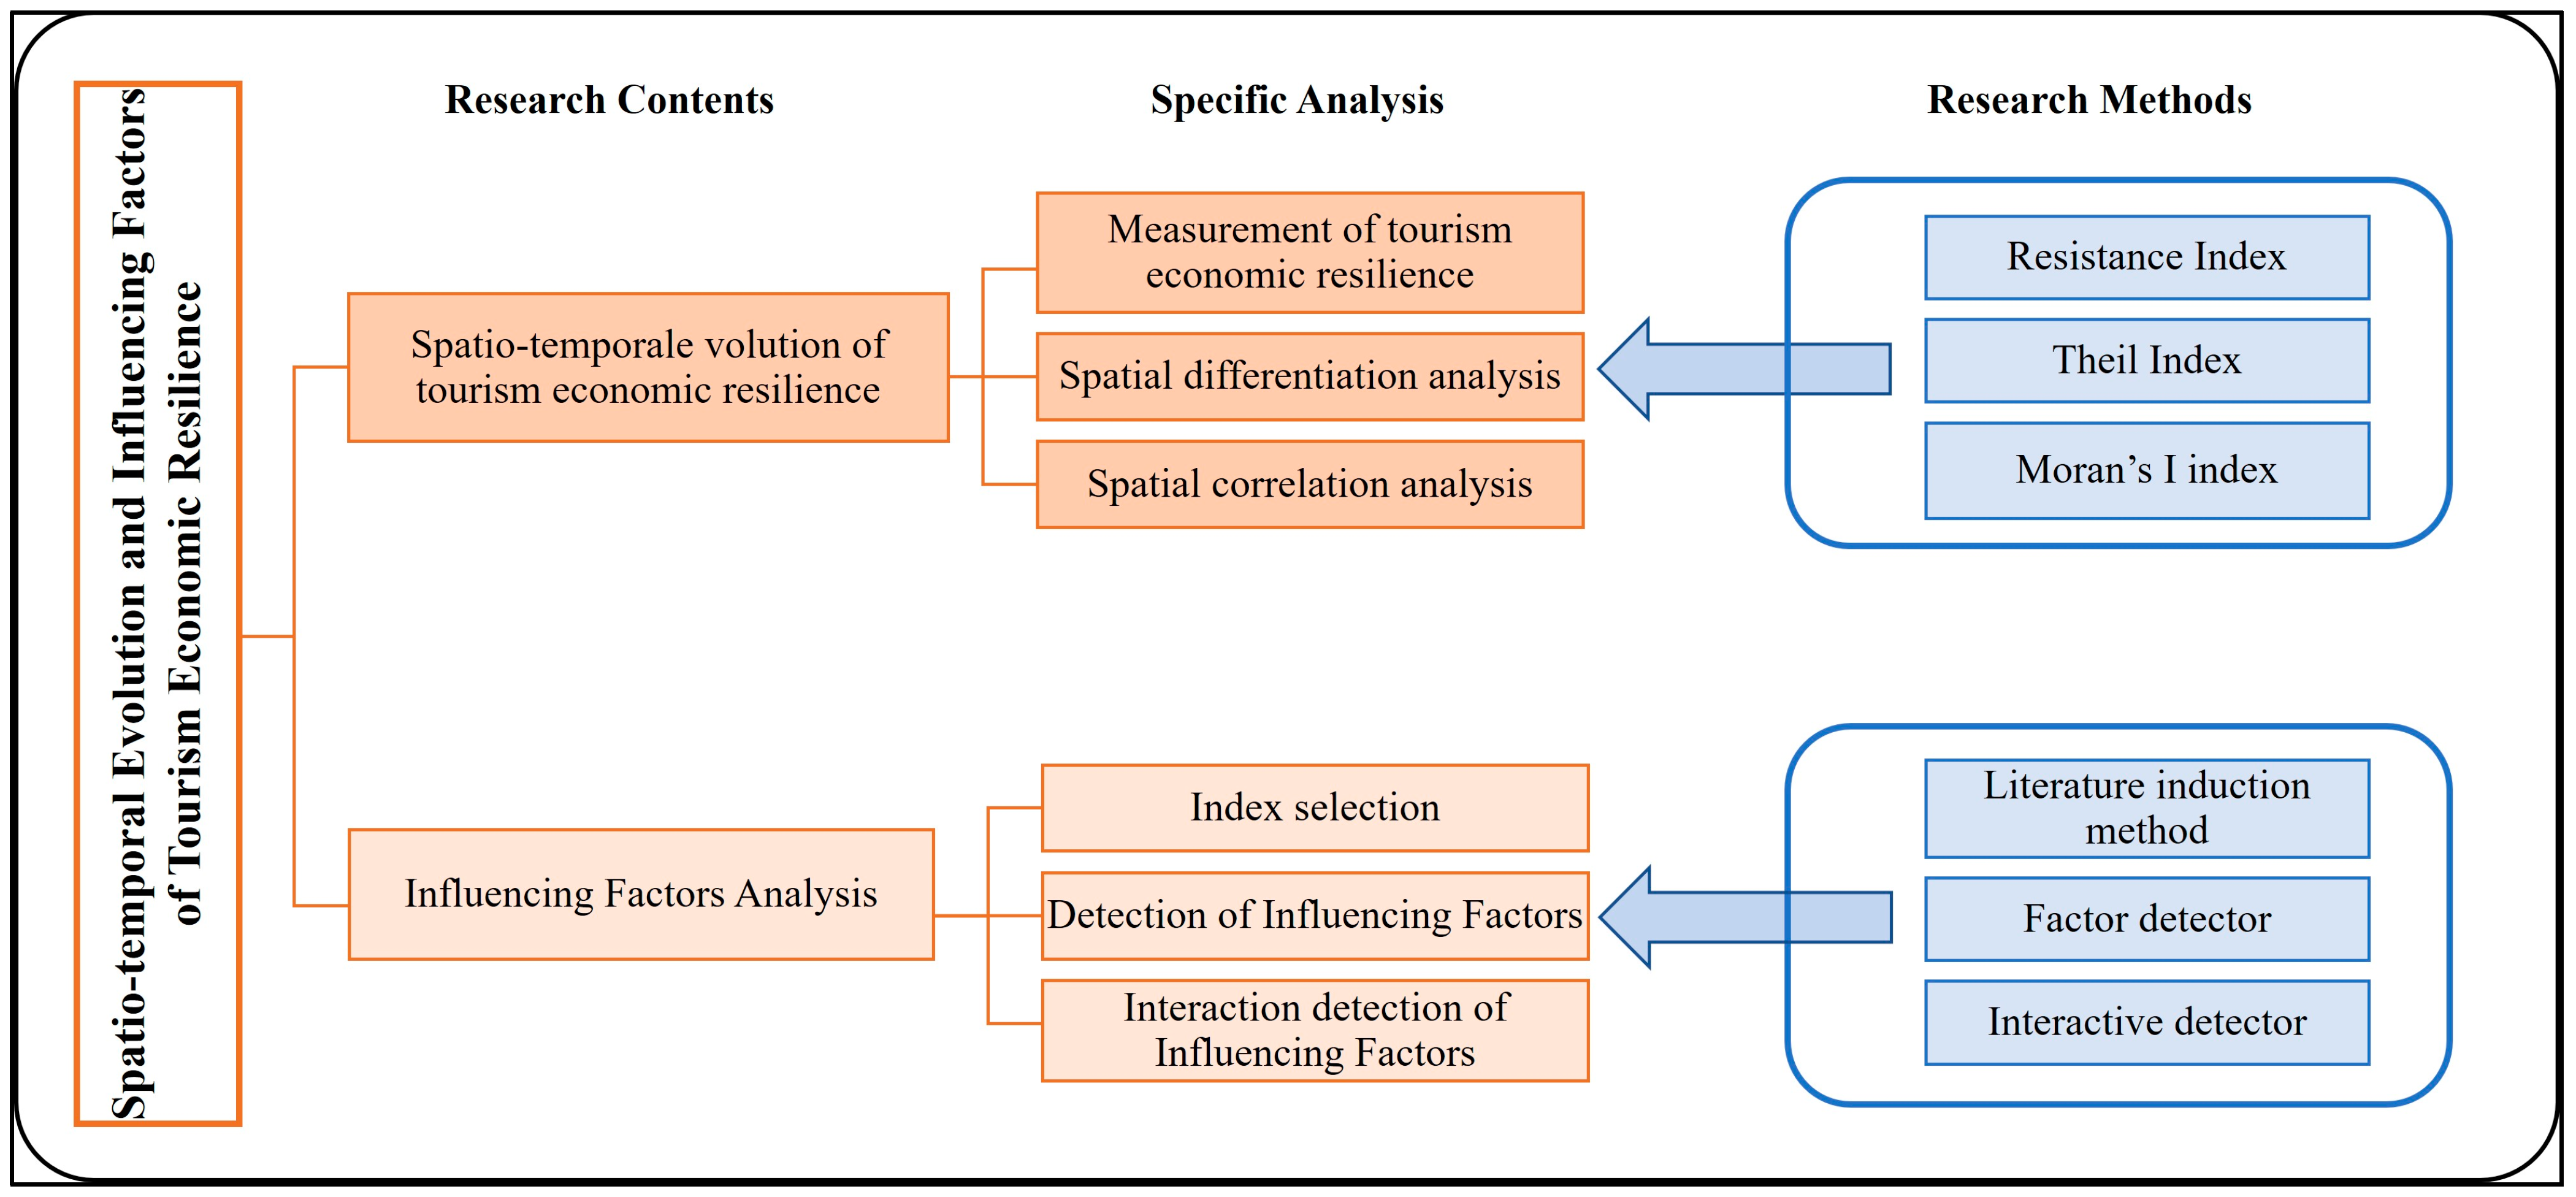
The data referenced in this article primarily originate from the 2019–2022 Statistical Yearbook of each province and city and the 2018–2021 Statistical Bulletin. Information regarding the per capita area of park green spaces is derived from the China Urban Construction Statistical Yearbook spanning the years 2019 to 2021. Data related to A-level scenic spots are sourced from directories of A-level tourist attractions, as published by the cultural and tourism departments of each province. The flowchart of the research method is shown in Figure 1.
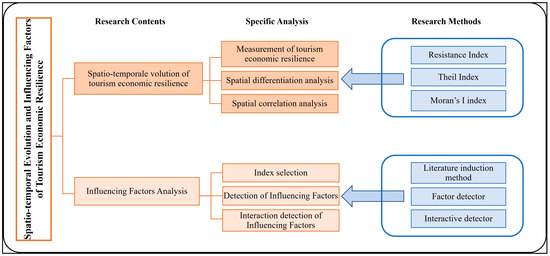
Figure 1.
The flow chart of research methods.
4. Results
4.1. Temporal Evolution of Tourism Economic Resilience
Equations (1) and (2) are applied to measure the economic resilience of the tourism industry in coastal cities for each year from 2019 to 2021, and the results are shown in Figure 2. Overall, during the study period, the resilience of the tourism economy in various cities showed a certain degree of convergence in terms of temporal changes. Compared with 2019, when the pandemic had not yet occurred, the resilience of the tourism economy in most cities in 2020 showed a relatively stable trend, with no significant fluctuations. Among them, Dalian, Tangshan, Wenzhou, Fuzhou, Shenzhen, Haikou, Shanghai, and the other 39 cities had a tourism economic resilience value greater than 0, accounting for 72.2% of coastal cities. This indicates that the resilience level of the tourism economy in coastal cities is relatively high compared to the national level. In 2021, the fluctuation of each city remains similar to that of 2019 and 2020, with only a few cities showing significant differences in the magnitude of their fluctuations. Among them, Dandong in Liaoning, Lianyungang, Yancheng, and Nantong in Jiangsu, as well as Haikou, Danzhou, and Sanya in Hainan are 7 cities that all saw a significant increase in the level of tourism economic resilience.
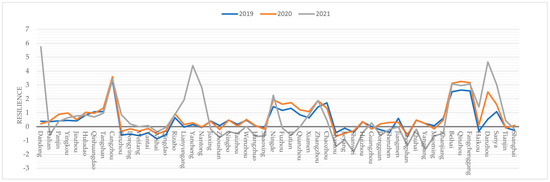
Figure 2.
Chart of tourism economic resilience in coastal cities from 2019 to 2021.
4.2. Spatial Evolution of Tourism Economic Resilience
4.2.1. Spatial Pattern of Tourism Economic Resilience
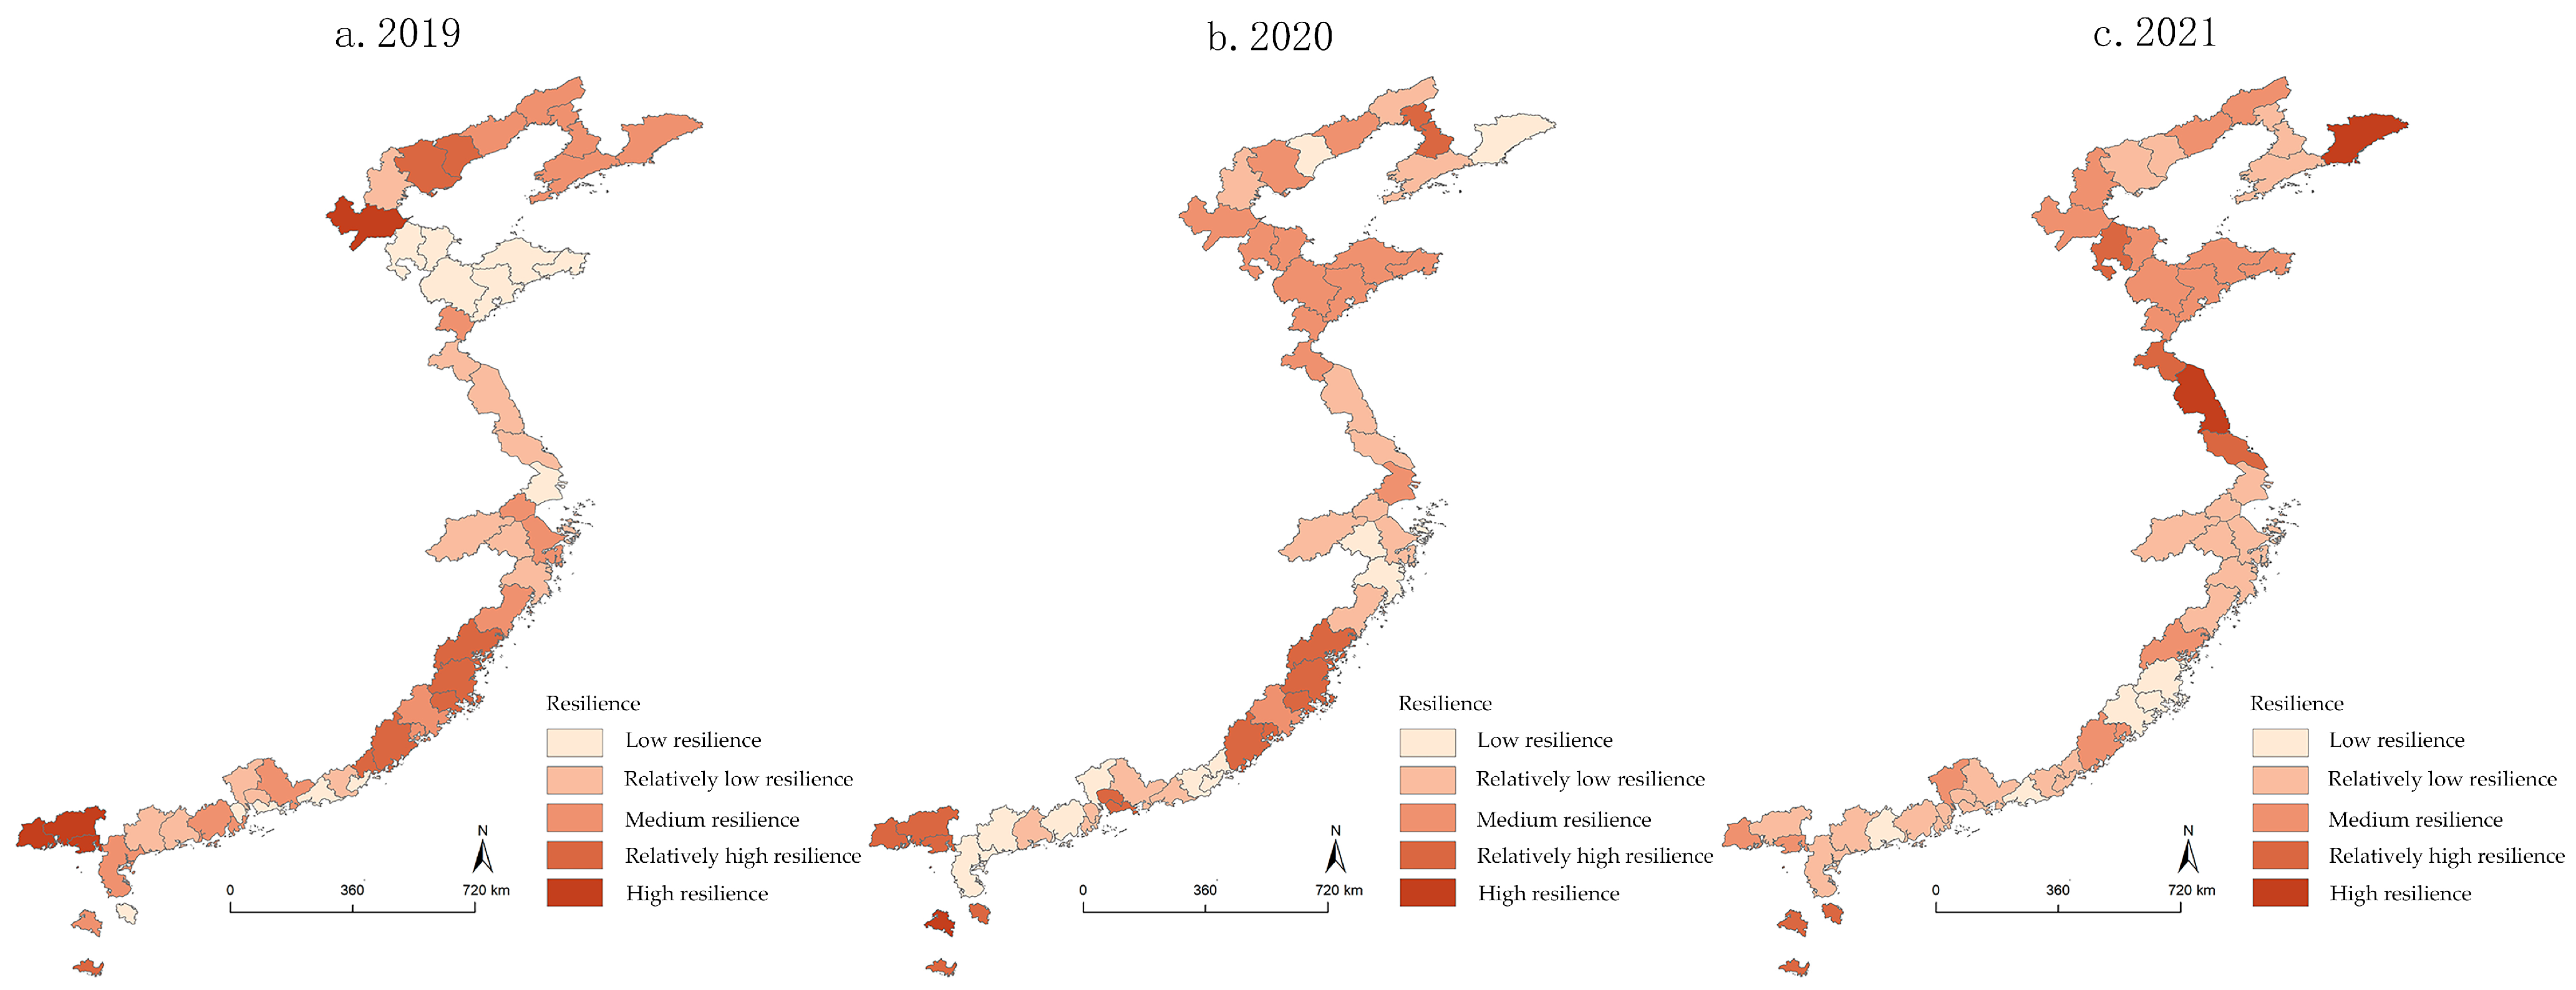
Based on the calculation results of Figure 2, the spatial distribution pattern of the tourism economic resilience level of coastal cities from 2019 to 2021 was analyzed using the natural breakpoint classification method in ArcGIS 10.6. According to the size of the values, the resilience intensity was divided into the following five levels: low, relatively low, medium, relatively high, and high. The division results were spatially visualized, as shown in Figure 3. Overall, the tourism economic resilience of coastal cities is generally at a relatively high level, but there is also a certain degree of spatial differentiation. This indicates that the impact of each city when facing the pandemic shock is not exactly the same.
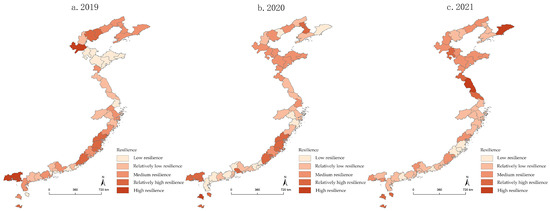
Figure 3.
Spatial distribution pattern of tourism economic resilience.
In 2019, the overall tourism economic resilience of coastal cities was relatively high. High-value and relatively high-value areas were mainly concentrated in the western, northeastern, and eastern regions, such as Beihai, Qinzhou, and Fangchenggang in Guangxi, Dalian, Panjin, and Yingkou in Liaoning, Ningde, Putian, and Zhangzhou in Fujian. Low-value areas were mainly concentrated in the coastal areas of Shandong, such as Weifang and Binzhou. In 2020, despite the severe impact of the pandemic, the coastal areas still showed a relatively high level of tourism economic resilience. High-value and relatively high-value areas were mainly concentrated in the coastal areas of Guangxi, Fujian, and Shandong. Compared with 2019, the change mainly lay in the coastal cities of Shandong Province, from a low-value area to a relatively high-value area, which could be associated with the rich marine tourism resources in Shandong Province. When faced with a sudden crisis, a robust tourism foundation and abundant tourism resources could enable the region to quickly recover to a high level of resilience. In 2021, the tourism economic resilience level of coastal cities formed a northeastern-eastern relatively high resilience level concentrated area, showing certain spatial agglomeration characteristics. Compared with 2020, the spatial distribution of tourism economic resilience levels in the entire coastal area showed a continuously optimized trend. This also indicates, to a certain extent, that the impact of the pandemic in 2021 has been effectively controlled.
4.2.2. Spatial Differentiation in Tourism Economic Resilience
In order to investigate the spatial differences in the tourism economic resilience of coastal cities, this study refers to the division method of the eight major economic zones [54], dividing the coastal region into the northern coast, eastern coast, and southern coast, and using the Theil index to measure the different characteristics between regions and within regions. The results show (Table 4) that the total difference in tourism economic resilience in coastal cities presented a fluctuating upward trend, falling from 0.3821 in 2019 to 0.3503 in 2020 and then rising to 0.5061 in 2021. This could be related to changes in pandemic prevention policies to some extent. In the early stage of the outbreak in 2020, national pandemic prevention policies were relatively consistent, all within strict lockdown states. In 2021, as the epidemic was brought under control, different regions began to implement differentiated management. Some cities may have more flexible pandemic prevention policies, which are conducive to economic development, while some cities are stricter, which restricts economic development to a certain extent. The regional economic level is a crucial condition for the development of the tourism industry. Economic recovery also brings the possibility of recovery to the tourism industry. To some extent, cities implementing flexible policies provide a guarantee for the recovery of the tourism economy. As a result, in 2021, the regional differences in tourism economic resilience in coastal cities further expanded. At the same time, when comparing inter-domain differences and intra-domain differences, it was known that the contribution rate of intra-domain differences from 2019 to 2021 was as high as 80% or more. This shows that whether there is an impact of the pandemic or not, intra-domain differences are always a key factor affecting overall differences.
Table 4.
Theil Index of tourism economic resilience from 2019 to 2021.
4.2.3. Spatial Correlation in Tourism Economic Resilience
To further analyze whether the tourism economic resilience of each coastal city has a clustering relationship in space, this study uses GeoDa software, chooses Queen adjacency, sets the rank of adjacency to one, and calculates the global Moran’s I index of tourism economic resilience in coastal cities from 2019 to 2021. The results show (Table 5) that Moran’s I during the study period are all positive values, fluctuating within the range of 0.2~0.4, and all passed the 5% significance test. At the same time, the Z value is between (2.2491 and 3.8293), which indicates that the tourism economic resilience of coastal cities is not randomly distributed in space. Specifically, the global Moran’s I index of tourism economic resilience in coastal cities dropped from 0.414 in 2019 to 0.338 in 2020 and then to 0.229 in 2021. This indicates that the tourism economic resilience of coastal cities presents certain clustering characteristics in spatial patterns, but as time goes by, the value of Moran’s I index gradually decreases, indicating that the degree of spatial clustering shows a weakening trend. This could be related to differentiated pandemic prevention policies in different cities during the pandemic.
Table 5.
Moran’s I Index of tourism economic resilience from 2019 to 2021.
Since global spatial autocorrelation can only analyze the spatial relationship of tourism economic resilience in coastal cities as a whole and cannot reflect the specific clustering situation of each city, this study uses GeoDa software to conduct local autocorrelation analysis. The spatial association feature types of tourism economic resilience in coastal cities are divided into “high-high” clustering, “low-low” clustering, “high-low” clustering, “low-high clustering”, and “not significant” for these five types (Table 6). Among them, cities of the “not significant” type are the majority, indicating that the city does not have a significant spatial clustering relationship with surrounding cities. The analysis results show that the “high-high” clustering area and the “low-low” clustering area present migration evolution characteristics with the change in the overall pattern. In 2019, the “high-high” clustering area was mainly located in Fangchenggang, Qinzhou, and Beihai in Guangxi, and the “low-low” clustering area was mainly located in Dongying, Weifang, and Yantai in Shandong. In 2020, Fangchenggang and Qinzhou in Guangxi were still “high-high” clustering areas, Haikou and Sanya in Hainan became “high-high” clustering areas, while “low-low” clustering areas were mainly concentrated in Shaoxing and Ningbo in Zhejiang and Yangjiang, Shanwei, and Jieyang in Guangdong. This may be related to the severity of the impact of the pandemic on cities. At the beginning of the outbreak, Zhejiang and Guangdong were severely impacted by the pandemic due to dense population gatherings and rapid population movement. The tourism economy was affected to a certain extent. However, cities such as Fangchenggang, Qinzhou, Haikou, and Sanya had less impact at the beginning of the pandemic, so they showed higher tourism economic resilience. In 2021, most cities did not have significant spatial clustering relationships. This could be related to changes in pandemic prevention policies in 2021. During the outbreak in 2020, there was a nationwide unified strict prevention and control policy. In 2021, as the pandemic was effectively controlled, there were significant differences in prevention and control policies across regions. As a result, the tourism economic resilience of various cities showed weaker spatial association characteristics.
Table 6.
Local spatial autocorrelation types of tourism economic resilience from 2019 to 2021.
4.3. Influencing Factors Analysis
With the resistance index of each coastal city as the dependent variable and 11 indicators from 5 dimensions as independent variables, this study uses the GD package in R language [55] based on the optimal parameter geographic detector model and applies the equal interval method, natural breakpoint classification, quantile classification, geometric interval classification, standard deviation classification and other methods to discretize the independent variables. It selects the best scale for spatial data discretization and analyzes the spatial differentiation influencing factors of tourism economic resilience in coastal cities through factor detection and interaction detection (Appendix A).
4.3.1. Detection Results of Influencing Factors
The results of factor detection show (Table 7) that all 12 factors have an impact on tourism economic resilience, indicating that tourism economic resilience is jointly influenced by factors such as the city’s economic level, industrial structure, ecological conditions, and tourism resource endowment. However, there are still certain differences in the dominant influencing factors before and after the outbreak of the pandemic.
Table 7.
Detection results of driving factors of tourism economic resilience.
In 2019, cities were not yet affected by the pandemic. At this time, the core influencing factors of tourism economic resilience were the financial security level, urbanization level, city greening level, city air quality status, and tourist attraction types, all of which had an explanatory power of over 30%. This indicates that the city’s ecological conditions are one of the key factors affecting a city’s tourism economic resilience. The main attraction of the tourism industry lies in the city’s natural scenery and cultural landscape. The quality of the ecological environment affects the city’s tourism attractiveness and, thus, has an impact on tourism economic resilience. At the same time, the city’s economic conditions provide strong support for the tourism economy. The economic status of a city directly affects the scale and quality of the tourism industry. In 2020, when the COVID-19 pandemic broke out, the core influencing factors of tourism economic resilience were industrial structure, city air quality status, and the richness of tourism resources. Among them, the explanatory power of city air quality status (0.3583) was the highest. This indicates that during the outbreak of COVID-19, the impact of a city’s ecological conditions on tourism is more significant. Good ecological conditions can provide a better buffer for urban tourism. Health has become the primary starting point for travel during the pandemic. People pay more attention to the hygiene and safety of tourist destinations and are more willing to choose cities with health guarantees. In 2021, when the pandemic was under control to some extent, the financial security level, tourism industry agglomeration efficiency, and tourist attraction types became core influencing factors. During this period, normalizing the pandemic and economic recovery became major tasks, and once again, the city’s economic level became a major influencing factor.
4.3.2. Detection Results of Interaction of Influencing Factors
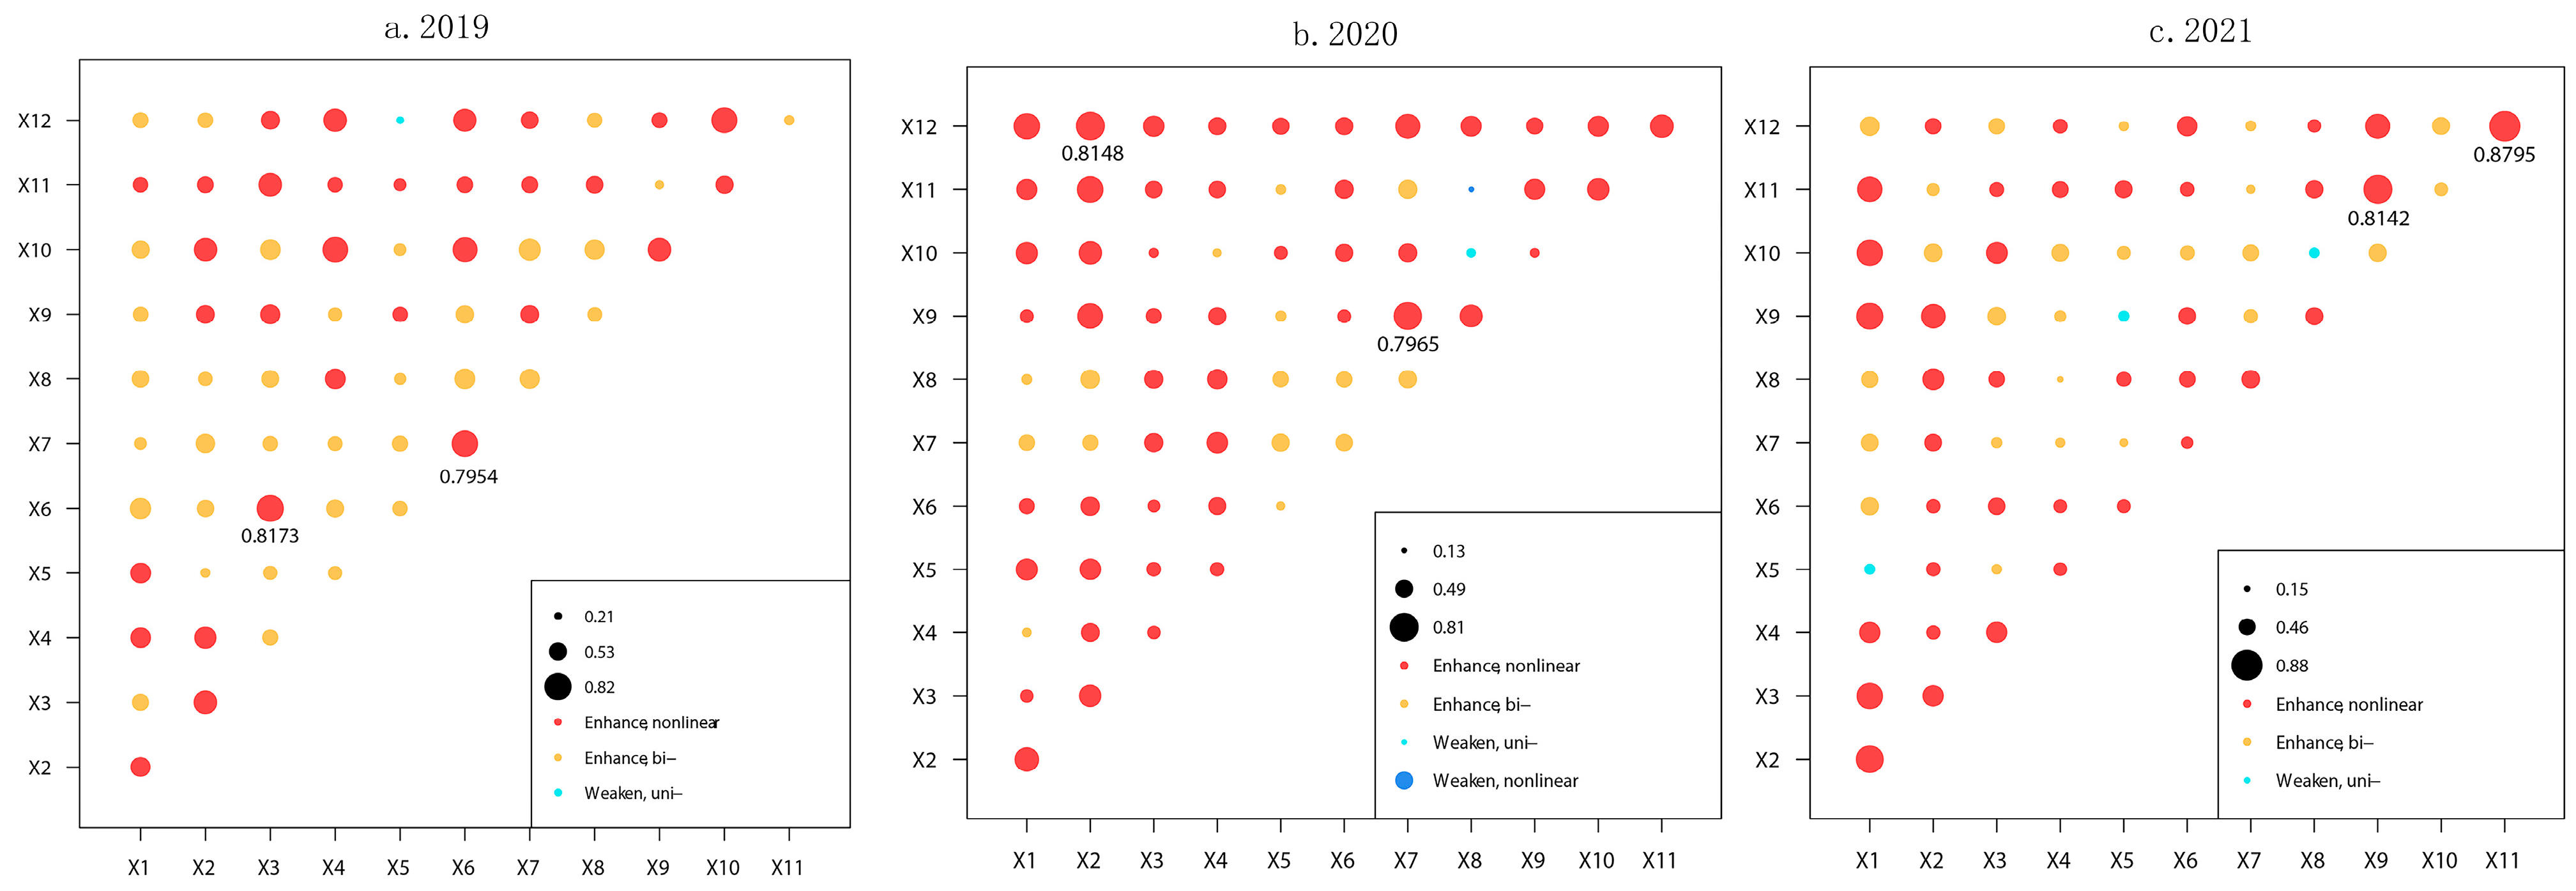
Overall, throughout the study period, the interaction of driving factors was primarily characterized by nonlinear enhancement and dual-factor enhancement, with only a few types of interaction involving single-factor nonlinear weakening and nonlinear weakening. The impact of the interaction between most factors on tourism economic resilience exceeded the impact of any single factor on tourism economic resilience. This indicates that the spatial differentiation of urban tourism economic resilience is the outcome of the combined effect of multiple factors.
As can be seen from Figure 4, in 2019, the dominant interactive factors affecting the tourism economic resilience of coastal areas were the level of economic openness and urban greening level, followed by urban greening level and city air quality status, with explanatory powers of 0.8173 and 0.7954, respectively. In 2020, the strongest interaction was between industrial structure and domestic tourist numbers, at 0.8148, followed by city air quality status and tourism industry agglomeration efficiency, at 0.7965. In 2021, the dominant interactive factors were the number of foreign tourists and domestic tourists, followed by the number of foreign tourists and tourism industry agglomeration efficiency, both of which were nonlinear enhancements, i.e., the combined effect of two factors on city tourism economic resilience was greater than the independent effect of a single factor. The interaction detection results of each factor indicate that, during the period when the pandemic had not yet occurred, the level of tourism economic resilience in cities was more closely related to external factors, among which city economic level and city ecological conditions played a decisive role. However, when cities were impacted, internal conditions of the tourism industry became important factors determining tourism economic resilience.
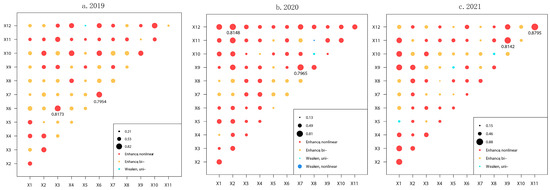
Figure 4.
Interactive detection results of driving factors of tourism economic resilience.
5. Discussion
5.1. Theoretical Implications
While there is a wealth of research on resilience both domestically and internationally, exploration in the realm of tourism resilience, particularly in relation to tourism economic resilience, remains limited. The scope of such studies often confines itself to macro scales, such as national or provincial levels, with less focus on the city scale. Moreover, since the research in the field of tourism on resilience is still in its infancy and some conceptual connotations have not yet been unified. This study summarizes the conceptual connotation of tourism economic resilience through a literature review and case study and uses the resistance index to measure the tourism economic resilience of coastal cities in China, analyzing the spatiotemporal evolution characteristics of tourism’s economic resilience in coastal cities before and after the COVID-19 epidemic. This endeavor enriches our comprehension of tourism’s economic resilience and broadens the scope of related work. In addition, current research is still lacking in the exploration of influencing factors. This paper, in alignment with the unique characteristics of the COVID-19 pandemic, selects pertinent influencing factors for analysis by considering both internal and external aspects of tourism. The research results further show that the decisive factors are different at different stages of the crisis. Overall, this study deepens the theory of tourism economic resilience at home and abroad, offering new perspectives and insights for future explorations.
5.2. Policy Implications
The COVID-19 pandemic, as a global public health emergency, has brought about challenges of an unprecedented scale to the tourism industry across various regions. Coastal cities, with their advanced development and inherent resource advantages, offer a fertile environment for the growth of the tourism sector. However, their high degree of openness also renders them more vulnerable to shocks in the face of sudden crises, underscoring the need for a resilient tourism economic system. This study reaffirms the influence of factors such as the city’s economic level, industrial structure, and conditions of tourism resource endowment on tourism economic resilience. Simultaneously, the interaction detection results reveal that, in a stable state where the city is not impacted, external factors like the city’s economic level and ecological conditions determine a city’s tourism economic resilience. Yet, in times of crisis, it is the internal resource conditions of the tourism industry that emerge as the decisive factor for the city’s tourism economic resilience. Drawing from these research conclusions, this study puts forth several policy implications.
Firstly, regional basic conditions remain an important factor affecting tourism’s economic resilience. To provide stable development conditions for the tourism industry, cities should strive to promote industrial structure transformation and upgrades in the future, consolidate infrastructure for the development of the tourism industry, and also improve the employment and income levels of the population in this region to drive the development of the city’s economy. Secondly, attention should be paid to the governance and construction of the ecological environment. Good ecological conditions can not only provide a buffer space for cities to better cope with crises but are also an important basic condition for tourism resource endowment. Therefore, it is necessary to improve the quality of urban ecological resources, establish the concept of resilient urban spatial planning, integrate the concept of resilient city construction into various aspects such as society, economy, and ecology, and improve the city’s risk resistance ability. Finally, we need to take into account both internal and external development conditions. In the construction of a city’s tourism economy, external socio-economic conditions are certainly important, but the internal construction of the tourism industry itself should not be ignored. Only by building and optimizing internal resources, combining regional characteristics, promoting the digital transformation and development of tourism, and optimizing the structure of the tourism industry can we improve the resilience of the city’s tourism economy, better cope with the challenges of sudden public crises, and achieve sustainable development.
6. Conclusions
6.1. Explanation of Findings
This study utilizes data related to the development of the tourism economy in coastal cities from 2019 to 2021. Upon measuring tourism economic resilience, it examines the spatiotemporal evolution patterns of tourism economic resilience under the influence of the pandemic and further uncovers its underlying mechanisms. The primary conclusions are as follows:
(1) Despite the impact of the COVID-19 pandemic, coastal cities maintain a relatively high level of tourism economic resilience compared to other regions nationwide. From a temporal perspective, the fluctuation trends of tourism’s economic resilience in various cities exhibit a certain degree of stability and convergence before and after the pandemic. In 2020, compared to 2019, the tourism economic resilience of most cities remained relatively stable without significant fluctuations. In 2021, the fluctuation trends across cities did not change significantly, with only a handful of cities experiencing notable differences in their fluctuation amplitude.
(2) From a spatial perspective, coastal cities generally exhibit a high level of tourism economic resilience, with significant spatial correlations. Areas with high and relatively high values are primarily concentrated in the western, northeastern, and eastern regions. In 2021, the tourism economic resilience of coastal cities manifested a spatial clustering phenomenon, with contiguous areas of relatively high resilience in the northeast and east. Compared to 2019 and 2020, the spatial distribution of tourism economic resilience levels across the entire coastal region also demonstrated a trend of continuous optimization.
(3) The influencing factors of tourism economic resilience before and after the pandemic are different, but they are generally still jointly affected by factors such as the city’s economic level, industrial structure, ecological conditions, and tourism resource endowment. From the perspective of interactive dominant factors, when the city is stably developed, the external basic conditions of the tourism industry are closely related to tourism’s economic resilience. However, when a crisis occurs, the internal resource endowment conditions of the tourism industry become the dominant factor determining tourism’s economic resilience.
6.2. Limitations and Future Prospects
This article measures the resilience of the tourism economy in coastal cities before and after the pandemic, including the spatiotemporal distribution characteristics of tourism economic resilience, and identifies the influencing factors that cause regional differences in tourism economic resilience under the background of sudden crises. This not only provides valuable insights for future research on tourism economic resilience in coastal regions but also provides useful reference for future policy adjustments for the development of the tourism industry in coastal areas. Based on this, each city can explore this path to establish a resilient tourism economic system according to local conditions, thereby enhancing their ability to withstand sudden crises. This study also provides strategic guidance for industrial development within resilient cities and regional economic growth. However, it is important to note that this research has certain limitations due to constraints in personal cognition and data accessibility. Firstly, the angle of resilience measurement is relatively single, and future attempts can be made to calculate and compare this from multiple dimensions. Secondly, due to data acquisition issues, this study only discusses the situation during the pandemic resistance period. Follow-up studies can be conducted in post-pandemic periods, further revealing the impact characteristics of such crisis events on tourism’s economic resilience.
Author Contributions
Conceptualization, X.C.; methodology, X.C.; software, X.C.; validation, X.C.; formal analysis, X.C.; investigation, X.C.; resources, X.C.; data curation, X.C.; writing—original draft preparation, X.C.; writing—review and editing, X.C.; visualization, X.C.; supervision, Y.X.; project administration, Y.X. All authors have read and agreed to the published version of the manuscript.
Funding
This research received no external funding.
Institutional Review Board Statement
Not applicable.
Informed Consent Statement
Not applicable.
Data Availability Statement
The data presented in this study are available on request from the corresponding author. The data are not publicly available due to privacy.
Conflicts of Interest
The authors declare no conflict of interest.
Appendix A
| discmethod <-c(“equal”, “natural”, “quantile”, “geometric”, “sd”) |
| discitv <- c(3:9) |
| re <- gdm(Y~X1+X2+X3+X4+X5+X6+X7+X8+X9+X10+X11+X12, |
| continuous_variable=c(“X1”,”X2”,”X3”,”X4”,”X5”,”X6”,”X7”,”X8”,”X9”,”X10”,”X11”,”X12”), |
| data= , |
| discmethod=discmethod, |
| discitv=discitv) |
References
- Liu, Y.; Gu, T.; Li, L.; Cui, P.; Liu, Y. Measuring the Urban Resilience Abased on Geographically Weighted Regression (GWR) Model in the Post-Pandemic Era: A Case Study of Jiangsu Province, China. Land 2023, 12, 1453. [Google Scholar] [CrossRef]
- Li, L.; Hu, X. Analysis on the spatial-temporal pattern and influencing factors of regional economic resilience in China under the COVID-19 pandemic. World Reg. Stud. 2022, 5, 1–13. [Google Scholar]
- Holling, C.S. Resilience and Stability of Ecological Systems. Annu. Rev. Ecol. Syst. 1973, 4, 1–23. [Google Scholar] [CrossRef]
- Adger, W.N. Social and Ecological Resilience: Are They Related? Prog. Hum. Geogr. 2000, 24, 347–364. [Google Scholar] [CrossRef]
- Reggiani, A. Resilience: An Evolutionary Approach to Spatial Economic Systems. Netw. Spat. Econ. 2002, 2, 211–229. [Google Scholar] [CrossRef]
- Sun, J.; Sun, X. Research Progress of Regional Economic Resilience and Exploration of Its Application in China. Econ. Geogr. 2017, 37, 1–9. [Google Scholar] [CrossRef]
- Martin, R.; Sunley, P.; Gardiner, B.; Tyler, P. How Regions React to Recessions: Resilience and the Role of Economic Structure. Reg. Stud. 2016, 50, 561–585. [Google Scholar] [CrossRef]
- Boschma, R. Towards an Evolutionary Perspective on Regional Resilience. Reg. Stud. 2015, 49, 733–751. [Google Scholar] [CrossRef]
- Martin, R. Regional Economic Resilience, Hysteresis and Recessionary Shocks. J. Econ. Geogr. 2012, 12, 1–32. [Google Scholar] [CrossRef]
- Frazier, T.G.; Thompson, C.M.; Dezzani, R.J.; Butsick, D. Spatial and Temporal Quantification of Resilience at the Community Scale. Appl. Geogr. 2013, 42, 95–107. [Google Scholar] [CrossRef]
- Zhang, S.; Wang, C.; Li, B. Spatial Differentiation of Urban Economic Elasticity and Its Influencing Factors in Northeast China. Hum. Geogr. 2019, 34, 73–80. [Google Scholar] [CrossRef]
- Desrochers, P.; Leppala, S. Opening up the “Jacobs Spillovers” Black Box: Local Diversity, Creativity and the Processes Underlying New Combinations. J. Econ. Geogr. 2011, 11, 843–863. [Google Scholar] [CrossRef]
- Martin, R.; Sunley, P.; Tyler, P. Local Growth Evolutions: Recession, Resilience and Recovery. Camb. J. Reg. Econ. Soc. 2015, 8, 141–148. [Google Scholar] [CrossRef]
- Zhan, Y.; Gai, M. Study on Measurement and Coordinated Development of Socio-ecological System Resilience in Coastal Tourism Destination. Areal Res. Dev. 2018, 37, 158–164. [Google Scholar]
- Liu, J.; An, K. Multi-Scale Analysis of Spatiotemporal Evolution and Influencing Factorsof Tourism Environmental Carrying Capacity in China’s Coastal Areas. J. Ocean. Univ. China Soc. Sci. 2022, 1, 92–102. [Google Scholar] [CrossRef]
- Wong, E.P.Y.; de Lacy, T.; Jiang, M. Climate Change Adaptation in Tourism in the South Pacific—Potential Contribution of Public–Private Partnerships. Tour. Manag. Perspect. 2012, 4, 136–144. [Google Scholar] [CrossRef]
- Cheng, X.; Fang, Y.; Su, X.; Li, J. Spatial distribution characteristics of network structure of tourism flow in five major urban agglomerations of coastal China. Prog. Geogr. 2021, 40, 948–957. [Google Scholar] [CrossRef]
- Fang, Y.; Su, X.; Huang, Z.; Guo, B. Structural Characteristics and Resilience Evaluation of Tourism Flow Networks in Five Major Urban Agglomerations in Coastal China: From the Perspective of Evolutionary Resilience. Econ. Geogr. 2022, 42, 203–211. [Google Scholar] [CrossRef]
- Zhou, X. Overview on Domestic and International Tourism Crisis during Recent Fifteen Years. Tour. Forum 2016, 9, 11–16. [Google Scholar] [CrossRef]
- Li, Y.; Zhang, J.; Liu, Z.; Zhang, H.; Su, X.; Chen, X. Resilience of Domestic Tourist Market after Crisis: A Case Study of Jiuzhai Valley. Tour. Trib. 2016, 31, 104–112. [Google Scholar]
- Wu, J. Study on the Competitive Power of Regional Tourism in Fluenced by Outburst Affair—A Case Study of Shandong Province. Econ. Geogr. 2006, 12, 38–43. [Google Scholar]
- Zhang, T.; Sun, G.; Ma, L. An Assessment on Influences of Crises on Zhangjiajie Tourism: Analysis Based on the Tourism Background Trend Line in High Time Resolution. Econ. Geogr. 2012, 32, 145–151. [Google Scholar] [CrossRef]
- Ruan, W.; Li, Y. The Impact and Spatial Difference of Natural Disaster Crisis on Tourist Demand. Econ. Geogr. 2018, 38, 214–223. [Google Scholar] [CrossRef]
- Cheung, C.; Takashima, M.; Choi, H.; Yang, H.; Tung, V. The Impact of COVID-19 Pandemic on the Psychological Needs of Tourists: Implications for the Travel and Tourism Industry. J. Travel Tour. Mark. 2021, 38, 155–166. [Google Scholar] [CrossRef]
- Fotiadis, A.; Polyzos, S.; Huan, T.-C.T.C. The Good, the Bad and the Ugly on COVID-19 Tourism Recovery. Ann. Tour. Res. 2021, 87, 103117. [Google Scholar] [CrossRef]
- Gössling, S.; Scott, D.; Hall, C.M. Pandemics, Tourism and Global Change: A Rapid Assessment of COVID-19. J. Sustain. Tour. 2021, 29, 1–20. [Google Scholar] [CrossRef]
- Yang, Y.; Altschuler, B.; Liang, Z.; Li, X. Monitoring the Global COVID-19 Impact on Tourism: The COVID19tourism Index. Ann. Tour. Res. 2021, 90, 103120. [Google Scholar] [CrossRef]
- Yang, E.; Kim, J.; Pennington-Gray, L.; Ash, K. Does Tourism Matter in Measuring Community Resilience? Ann. Tour. Res. 2021, 89, 103222. [Google Scholar] [CrossRef]
- Strickland-Munro, J.; Moore, S. Exploring the Impacts of Protected Area Tourism on Local Communities Using a Resilience Approach. Koedoe 2014, 56, 10. [Google Scholar] [CrossRef]
- Yang, X.; Jia, Y.; Weng, G.; Li, Y.; Niu, J. A Study on System Dynamics of the Resilience of Urban Tourism Environment System: A Case Study of Lanzhou City. Tour. Sci. 2020, 34, 23–40. [Google Scholar] [CrossRef]
- Wang, Q.; Lu, L.; Yang, X. Research Progress and Enlightenment of Tourism Socio-Ecological System Resilience in Foreign Countries. J. Nat. Resour. 2014, 29, 894–908. [Google Scholar]
- Fang, Y.; Wang, Q.; Huang, Z.; Wu, Y. Spatial and temporal evolution of tourism economic resilience and mechanism of impact in China. Prog. Geogr. 2023, 42, 417–427. [Google Scholar] [CrossRef]
- Di, Q.; Chen, K.; Chen, X. The Economic Resilience Measurement of Beijing’s Tourism Industry and Its Influencing Factors under the Impact of the COVID-19 Pandemic. Econ. Geogr. 2023, 43, 133–140. [Google Scholar] [CrossRef]
- Yang, Y.; Zhou, Y.; Li, Y.; Wu, P. Configurational Analysis and Spatial Difference of Provincial TourismEconomy Resilience under the lmpact of Epidemic in China. Geogr. Geo-Inf. Sci. 2022, 38, 111–120. [Google Scholar]
- Cui, W.; Xue, T. Research on the Influencing Factors of Economic Resilience of Tourism Industry in Guangdong-Hong Kong-Macao Greater Bay Area Urban Agglomeration. Spec. Zone Econ. Issue 2021, 7, 26–32. [Google Scholar]
- Wang, Q.; Zhao, L.; Yu, W.; Jia, J. Spatial-Temporal Evolution Characteristics and Influencing Factors of Resilience of Tourism Economic System in China. Geogr. Geo-Inf. Sci. 2020, 36, 113–118. [Google Scholar]
- Pang, D.; Zhao, L.; Yu, W.; Wang, Q. Resilience Measurement and Obstacle Factors of Tourism Economy in Shangdong Province. Resour. Ind. 2021, 23, 50–59. [Google Scholar] [CrossRef]
- Zhang, P.; Huang, Y.; Pan, S.; Chen, W.; Zhong, H.; Xu, N.; Zhong, M. Does Resilience Exist in China’s Tourism Economy? From the Perspectives of Resistance and Recoverability. Sustainability 2022, 14, 10641. [Google Scholar] [CrossRef]
- Cheng, L.; Zhang, J. Is Tourism Development a Catalyst of Economic Recovery Following Natural Disaster? An Analysis of Economic Resilience and Spatial Variability. Curr. Issues Tour. 2020, 23, 2602–2623. [Google Scholar] [CrossRef]
- Bellini, N.; Grillo, F.; Lazzeri, G.; Pasquinelli, C. Tourism and Regional Economic Resilience from a Policy Perspective: Lessons from Smart Specialization Strategies in Europe. Eur. Plan. Stud. 2017, 25, 140–153. [Google Scholar] [CrossRef]
- Wang, X.; Liu, G.; Guo, W. The Analysis of the Tourism’s Developing Trend of the Coastal Cities in China Based on the Grey Prediction. Math. Pract. Theory 2014, 44, 92–98. [Google Scholar]
- Lu, F.; Zhang, H. Spatial-temporal Evolution of Touriatization in Coastal Cities of China and Its Interactive Response with Urbanization. Resour. Dev. Mark. 2022, 38, 376–384. [Google Scholar]
- Liu, J.; Zhao, J.; Du, Y. Research on the Relationship between Tourism Development and Regional Economic Growth in Coastal Cities: Based on Spatial Dynamic Panel Data Model. Inq. Into Econ. Issues 2013, 7, 172–180. [Google Scholar]
- Classification and Code of Coastal Administrative Regions. 2020. Available online: https://m.mnr.gov.cn/gk/tzgg/202202/P020220221604668134181.pdf (accessed on 4 November 2023).
- Luan, H.; Zhang, Q.; Zhang, X. Measurement and comparison of urban economic resilience in the eastern region based on two economic cycles. Stat. Decis. 2023, 39, 111–116. [Google Scholar] [CrossRef]
- Zhang, G.; Liu, S. The analysis of the spatiotemporal evolution and the constraint factors of the agricultural modernization level in the Yellow River Basin. Res. Agric. Mod. 2023, 44, 624–634. [Google Scholar] [CrossRef]
- Tobler, W.R. A Computer Movie Simulating Urban Growth in the Detroit Region. Econ. Geogr. 1970, 46, 234. [Google Scholar] [CrossRef]
- Wang, J.; Xu, C. Geodetector: Principle and prospective. Acta Geogr. Sin. 2017, 72, 116–134. [Google Scholar]
- Jiang, R.; Jing, X. Measurement, Decomposition and Driving Factors of China’s Economic Resilience under the Influence of Epidemic Situation. J. Southwest Minzu Univ. Humanit. Soc. Sci. 2022, 43, 109–120. [Google Scholar]
- Wang, M.; Mei, Q. Study on Evaluation and Driving Factors of Resilience of Urban Tourism Economic System: A Case Study of Jinan City. J. Taishan Univ. 2022, 44, 52–62. [Google Scholar]
- Jinyan, Y.; Yingnan, Z.; Yahui, Z.; Yixuan, J. Spatial and Temporal Changes and Influencing Factors of Tourism Resilience in China’s Provinces under the Impact of COVID-19. J. Resour. Ecol. 2023, 14, 217–229. [Google Scholar] [CrossRef]
- Zheng, D.; Luo, Q.; Ritchie, B.W. Afraid to Travel after COVID-19? Self-Protection, Coping and Resilience against Pandemic ‘Travel Fear’. Tour. Manag. 2021, 83, 104261. [Google Scholar] [CrossRef]
- Wen, Z.; Huimin, G.; Kavanaugh, R.R. The Impacts of SARS on the Consumer Behaviour of Chinese Domestic Tourists. Curr. Issues Tour. 2005, 8, 22–38. [Google Scholar] [CrossRef]
- Li, Y.; Bi, Y. Urban entrepreneurial activity: Regional differences, dynamic evolution and influencing factors. China Soft Sci. 2023, 5, 99–106. [Google Scholar]
- Song, Y.; Wang, J.; Ge, Y.; Xu, C. An Optimal Parameters-Based Geographical Detector Model Enhances Geographic Characteristics of Explanatory Variables for Spatial Heterogeneity Analysis: Cases with Different Types of Spatial Data. GISci. Remote Sens. 2020, 57, 593–610. [Google Scholar] [CrossRef]

Disclaimer/Publisher’s Note: The statements, opinions and data contained in all publications are solely those of the individual author(s) and contributor(s) and not of MDPI and/or the editor(s). MDPI and/or the editor(s) disclaim responsibility for any injury to people or property resulting from any ideas, methods, instructions or products referred to in the content. |
© 2023 by the authors. Licensee MDPI, Basel, Switzerland. This article is an open access article distributed under the terms and conditions of the Creative Commons Attribution (CC BY) license (https://creativecommons.org/licenses/by/4.0/).