Abstract
Soil accumulated on a photovoltaic (PV) module can significantly reduce the transmittance of the cover glass, resulting in power losses and consequent economic losses. Natural atmospheric parameters influence the accumulation of soil at various geographic locations. In this paper, the approaches and outcomes of the research studies on either indoor (simulator-based) or outdoor (field-based) PV soiling have been thoroughly reviewed. It has been noted that conducting an indoor study is necessary in order to estimate future power losses prior to the installation of a solar PV power plant. Different parameters depicted for the power loss due to the soiling of PV modules are analyzed individually and presented. Moreover, this study delves into a detailed examination of the key factors influencing dust depositions on PV modules in various geographical regions, with a particular focus on their relationship with climatic conditions. This study demonstrates that the soiling effect on PV modules is site-specific, necessitating the investigation of optimal cleaning procedures to suit a certain climate while considering cost effectiveness. This way, probable future research directions to quantify soiling losses are identified. In addition, different loss prevention and mitigation techniques are also reviewed. This makes it possible to highlight effective strategies and pinpoint potential future research lines in these areas.
1. Introduction
Solar photovoltaic (PV) systems are one of the most popular renewable energy conversion technologies nowadays [1]. Thanks to the availability of abundant solar energy resources on Earth, its low cost, and its versatility, PV represented two thirds of the whole newly installed renewable energy capacity in 2022 [2]. This growing installation trend is expected to persist, and PV is projected to surpass three TW of global installed capacity by 2027, after reaching its first terawatt in 2022 [2].
While this massive PV deployment, estimated to grow even beyond the current decade, will provide the benefit of a lack of emissions while in operation, there are additional environmental impacts that should be taken into account. Factors related to PV manufacturing, installation, operation, and decommissioning can potentially harm the environment and affect the sustainability of this technology. In particular, PV systems and renewables in general are known to have a significant land use requirement [3]. This means that, in order to achieve the future capacity goals, a significant surface will have to be occupied by PV modules, and this can pose threats to agriculture and/or affect biodiversity [4]. Being aware of these issues, the PV community has already proposed innovative solutions to lower the land competition, such as the integration of PV modules in buildings (building-integrated PV) [5], the dual use of agricultural land for crops and energy generation (agrivoltaics), or the installation of PV modules on water surfaces (floating PV) [5,6,7]. However, while this effort is fundamental, it is also important to reduce any negative effects of the systems already in operation. Indeed, if existing PV systems can work at higher energy yields, they would achieve higher material and land efficiencies, reducing their overall footprint and improving their sustainability.
The conversion of energy in a PV system depends on the irradiance and spectral content radiated from the sun, along with environmental and climatic variables, the integral system, and the balance of systems [8]. Soiling PV modules is the third major concern for the success of PV technology after irradiance and temperature [9,10]. Soiling intrinsically affects PV modules, gradually accumulating after the installation of the PV power plant. As a result, the output power and efficiency may completely terminate in the long run [11,12]. Over the years, the impact of soiling has been investigated in several regions worldwide, especially in regions where such soiling is a major showstopper issue or solar energy is the only option to generate electricity [10,13,14,15,16,17]. Ilse et al. estimated that 4% to 7% of the global energy yield is currently lost because of soiling [18]. While the economic repercussions of this loss significantly affect PV owners and operators, the magnitude of this phenomenon also unveils an untapped potential: with effective soiling mitigation, the global PV energy yield could be elevated with no additional land or material consumption. This does not eliminate the need for additional PV systems but proves that the land and material efficiencies of PV can and should be enhanced through an adequate soiling mitigation strategy. In this light, an assessment of soiling loss characterization and mitigation techniques is the main aim of the present work.
Soiling particles (1 µm to 500 µm in size) can comprise dried cells of flora and fauna, microorganisms like fungi and bacteria, human or animal cells, fibers of textiles, and sand, clay, or eroded limestone from geomorphic fallout [19]. In addition, they can include aerosols or atmospheric dust due to soil elements lifted by the wind, volcanic eruptions, vehicle movement on the highway, and pollution near industrial areas [20,21,22]. The size of dust particles, their constituents, and their deposition behaviors vary due to a region’s topography, climate, and urbanization. The characteristics of dust can be classified by size or distribution, density or shape, charge, and composition. Different ambient conditions that are related to dust characteristics are humidity and moisture gradients, wind velocity and directions, and seasonal variations [23]. The fundamental characteristics of dust and its effects on power conversion, deposition behaviors, and mitigation techniques are not fully understood yet. Most importantly, a study and observation of the post-effects on a glass surface after dust deposition and then cleaning have not yet come to light.
The most widely used technique for cleaning PV modules is washing with detergent water [10]. However, this cleaning technique may not be effective and sustainable in regions with high annual solar insolation but limited water availability. This urges the need for a detailed study of dust deposition behaviors on solar PV modules. Globally, several studies and observations have been conducted for decades in the field of soiling PV modules. Also, many review papers have been published on soiling for different climatic zones, cell types, dust properties, and cleaning techniques. However, in this light, the novelty of this present study relies on the following key points:
- i.
- It critically analyzes the degraded outputs of soiled PV modules from most of the reported work for different environmental conditions.
- ii.
- It also discusses the effect of atmospheric parameters accounted for in soiling as well as PV module output characteristics in different climatic conditions around the globe.
- iii.
- It presents a review of soiling loss investigations in outdoor (outdoor exposure) conditions.
- iv.
- It also presents the importance of soiling loss investigations in artificial environmental (emulator based) conditions.
- v.
- It compares the mitigation approaches developed so far in terms of practicality.
A first categorization of global regions is presented in Section 2 based on dust concentration. Different factors accountable for soiling PV modules under various environmental conditions are analyzed in Section 3. Also, the effect of atmospheric parameters such as wind speed, humidity, rainfall, tilt angle, and the properties of dust particles accountable for dust deposition are discussed critically with reference to earlier research works. In Section 4, soiling loss investigations, both outdoor and emulator-based, are discussed with working models. Different technologies have been developed so far to reduce soiling, and their comparisons are depicted in Section 5. Section 6 forecasts future research paths to improve the conversion of solar energy to electricity using PV technology.
2. Dust Belt Areas
The amount and rate of dust deposition on a PV module’s surface depend on the weather conditions of a particular location [24]. The concentration of dust particles and pollutants is not the same in different parts of the world, depending on the local conditions. A classification of different countries according to the characteristics of dust concentration and climatic zones is mapped in Figure 1. The dust concentration is represented through PM10, a common metric that expresses the mass of liquid and solid particles of diameter < 10 µm suspended in 1 m3 of air [25]. The darker color on the map represents a higher PM10 concentration; this decreases as the color gets lighter.
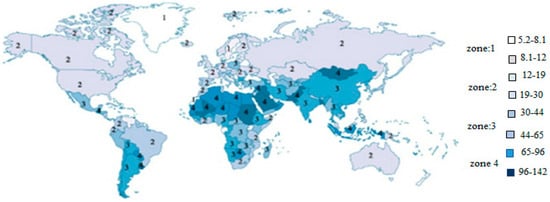
Figure 1.
Dust intensity around the globe expressed as PM10 concentration (µg/m3) [25].
Four climatic zones are identified. Zone 1 covers humid and cold regions with the lowest levels of dust density. The humid climatic regions are classified as Zone 2. Many European and North American countries are in this zone, and soiling reduces PV power generation by 25% [26]. In Zone 3, countries around the equator and/or with a humid climate, like India, Mexico, and China, are grouped [25]. These countries are among those that are investigating more photovoltaic capacities and together represent 60% of the lower power generation due to soiling [26]. In this zone, annual losses can be as high as 10%. In Zone 4, most of the places have dry climates and higher concentrations of PM10. This zone includes countries that have significant PV potential but that experience substantial soiling losses. For example, yearly soiling losses higher than 15% and 10% have been reported for Egypt and Saudi Arabia, respectively, which are both classified as Zone 4 [25,26].
3. Physical Factors Influencing Soiling of PV Modules
Dust and local atmospheric conditions determine PV module soiling [27]. The transmittance of a PV module will decrease gradually with time due to the increased soil density of glass surfaces. The soiling characteristics and impacts depend on environmental factors and local weather conditions [28,29]. For example, finer dust particles affect module performance more than coarser particles [27,30]. Prime factors affecting dust deposition involve wind, relative humidity, rainfall, orientation, the elevation angle, and the surface characteristics of modules, which will be assessed in the following subsections.
3.1. Effect of Wind
The velocity of wind and its direction are equally important factors in soiling PV modules [31]. It is well known that wind enhances PV cell efficiency by reducing the module temperature through dissipative convection [32]. In addition, wind may result in an increase in module performance by detaching dust particles. On the other hand, dust-laden winds might increase soil accumulation.
A previous study conducted in a wind tunnel reported that high-speed winds might result in more dust deposition on a module’s surface compared to low-speed winds [33]. However, the impact of wind velocity will also depend on the dust particles present at the local sites [33]. In addition, wind speed and air pressure are not constant over the surface of a PV module. In cases of lower wind speeds, there will be higher pressure over a module’s surface, which may result in higher soil accumulation, and vice versa [29].
3.2. Effect of Humidity and Dew
Many researchers have examined PV module surface soiling in relation to humidity fluctuations [14,32,34,35]. For example, Mekhilef et al. [32] found that dust, humidity, and air velocity affect each other. Increased humidity leads to dew formation on a module’s surface, which favors dust coagulation [30]. High humidity can also favor the growth of moss and fungus on the surfaces of PV modules [27]. Furthermore, at high humidity levels, there is a rise in the vertical adhesion of dust to a glass cover owing to the generated capillary forces between the two. It was observed that due to humidity, capillary adhesion occurred, and dew settled on the surface of modules. For example, Said et al. observed an increase in adhesion to around 80% when the relative humidity level went from 40% to 80% [34]. Also, cementation can occur when dust particles mix with water and are later heated by sunlight [34,36].
Vuollekoski et al. [37] mapped the mean number of days for each season in which dew forms on the surface of the Earth. In Figure 2, these are expressed as percentages, ranging from 0% (no days with dew in the season) to 100% (dew present every day of the season). Dew forms in most continental places except hot places and deserts, according to the authors. In those locations where more dew is present, there will be more attraction for dust particles. So, vigorous cleaning will be necessary to remove coagulated dust from a PV module’s surface [38].

Figure 2.
Geographical locations of seasonal dew incidence as a proportion of a day (%) [37]. MAM (March, April, and May), DJF (December, January, and February), JJA (June, July, and August), and SON (September, October, and November).
Eylul et al. [39] observed that dew typically forms on PV module surfaces in semi-arid and tropical environments. The water droplets formed by the dew reduce the transmittance of light through a PV module’s glass surface. In San Francisco, California, the authors built a south-facing, 30°-tilted solar cell to investigate the impact of dew formation on an hourly basis. They found that energy production dropped by 53% because of the presence of dew. Increased humidity leads to dew formation, which favors dust coagulation [40].
3.3. Effect of Rainfall
Rainfall is often regarded as the most prevalent natural cleaning agent. [18]. However, cleaning effectiveness is known to be affected by rainfall intensity. Many studies have found cleaning thresholds (i.e., the minimum fall of rain needed to realize a cleaning effect) ranging from 1 mm/day to 10 mm/day, even if in some cases they can go up to 20 mm/day [29,40].
However, the cleaning mechanisms of rainfall have yet to be fully understood. For example, Pedersen et al. [41] presented a correlation between the amount of precipitation and the observed dust density in Norway. The authors found that for a density of deposition of 40 mg/m2, even heavy rainfall cannot clean the modules, and the cleaning efficiency saturates.
Mejia et al. [42] analyzed the variation in PV module efficiency due to the events of rainfall in Santa Clara, California, and showed that efficiency drops during summer droughts. The results revealed that events of slight rainfall (<0.508 mm/day) are not sufficient for cleaning the PV modules but rather maximize dust deposition. The observed efficiency for dust deposition over a 108-day dry spell in the summer was found to drop from 7.2% to 5.6%. As shown in Figure 3A, the first rainfall at the end of that dry period boosted the efficiency to 7.1%. The authors also observed that the first rain after a dry period is more effective at restoring the power output of PV modules than rainfall during a period with significant rain [43]. Rain improves PV performance by 6% in dusty environments. In tropical climates, rain may dramatically impact a c-Si PV system’s performance. Future studies must evaluate the effects of rain on solar PV modules in rapidly changing weather [44].
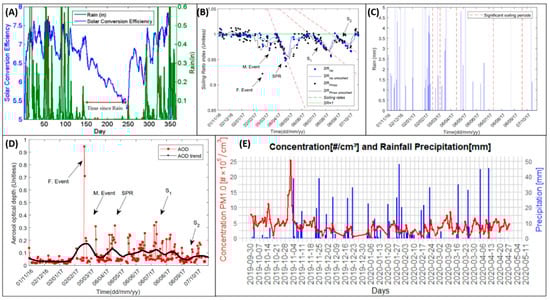
Figure 3.
(A) In 2010, a time series of daily solar conversion efficiency and daily rainfall was recorded at an 86.4 kWdc PV facility in Santa Clara, CA, USA [42]; (B) soiling ratios and rates for different seasons [45]; (C) rain frequency [45]; (D) AOD variations [45]; (E) concentration of suspended particles due to rainfall precipitation [46].
A team from the University of Évora studied organic soiling during rainfall for each season in Alentejo, Portugal, and compared cleaned and uncleaned PV modules [45]. The researchers used the soiling ratio and the soiling rate to describe the measured soiling pattern. The first one describes the fractional part of energy left after soiling (1-loss). The soiling ratio (SR) on PV modules can be calculated using the short-circuit current (Isc, denoted as SRIsc) or the maximum power output (Pmax, denoted as SRPmax), according to the following mathematical Equations (1)–(3).
The mathematical variables used in the above equations (Equations (1)–(3)) are as follows: defines the short-circuit current under Standard Test Conditions (STC) of the dusty panel, α defines the short-circuit temperature correction coefficient, defines the cell temperature of the soiled panel, T0 defines the temperature at the reference condition (25 °C), G defines the irradiance in the PV plane, G0 defines the irradiance at STC conditions (1000 W/m2), defines the maximum power of the dirty PV panel, defines the maximum power under clean conditions, γ defines the maximum power–temperature correction coefficient, defines the short-circuit current of the clean PV panel, defines the short-circuit current under STC of the clean panel, and defines the cell temperature of the clean panel. The authors of [45] found soiling rates of 4.1%/day, 1.9%/day, and 1.6%/day in the spring, summer, and fall in Alentejo. They correlated soiling loss with the rain, recording the soiling ratios and rates for one full year, as reported in Figure 3A. The same figure also shows the soiling rates in periods without rainy days, marked in red dashed lines. In Figure 3A, two long-distance desert dust transport occurrences are highlighted, one in February (F, Event) and the other in March (M, Event). In addition, there are three times when there was no rain, marked as SPR (spring seasons S1 and S2), which led to severe soiling rates and, consequently, a drop in the soiling ratio. According to the authors, rain plays a vital role not only as a natural cleaning agent but also for the aerosol optical depth (AOD), whose pattern is shown in Figure 3B,C. The soiling ratio is close to one during the fall and winter due to frequent rain. The F Event in Figure 3D indicates high amounts of soiling due to the transportation of dust from the Sahara to South Europe, which caused losses as high as 8%. The M Event, although it had a lower intensity, resulted in a decline of approximately 3% in the SR in March. In the spring season (SPR), the minimum rainfall occurred, leading to a 4.1% drop in both SRIsc and SRPmax. After the heavy rainfall from May to June, the SR indices were restored to unity. But, in the month of July, dust particles settled on the PV glass and decreased the SR to 1.9% because of the less frequent rainfall. As it rained more in August, the PV modules were naturally cleaned, improving the soiling ratio. September saw less rain and more soil accumulation. The heavy October rainfall improved soiling, leading to an SR~1. It has been observed that there was a ≈3% decrease in both SRIsc and SRPmax for the dry deposition of dust for their experimental setup during the period of 14–16 March 2017.
Souza et al. [46] suggest a statistical prediction for PV power generation based on ambient data and PV system soiling. A log-logistic function was used to fit a nonlinear mixed-effects model. Environmental variables may affect the model’s accuracy. The authors measured the suspended particle content and rainfall precipitation for a 10.45 kWp PV plant in Mato Grosso do Sul, Brazil, for 105 days (Figure 3E). The higher rainfall level had a direct impact on the airborne particle concentrations at the observed site. The authors attribute this effect to the soiling of the PV modules during the natural cleaning process. The fitted model’s greatest MSE is 0.0032, and a linear correlation of 0.9997 exists between the predicted and observed values. Moreover, 1.4% of the regular soiling loss was estimated.
3.4. Effect of Tilt on Dust Deposition
It can be anticipated that steeper tilt angles would impede the deposition of soil and facilitate its natural removal, consequently leading to reduced losses compared to surfaces that are closer to horizontal. Negash et al. [47] conducted observations for tilt angles, namely 0°, 5°, 11.6°, 15°, 21.5°, 25°, 30°, and 35°, to quantify this correlation. It was found that the highest PV energy loss (33.5%) occurred at a 0° tilt angle, and that it decreased progressively up to a 25° tilt (14.5%). Afterwards, the energy loss increased to 17.8% at the 30° tilt angle and then decreased to 14.9% at the 35° tilt angle. The unpredicted variation in power loss due to soiling was not clearly justified in the paper. The reason for this may be due to the non-uniform dust deposition distribution over the glass surface of PV modules, a phenomenon studied by Qasem et al. [48]. Indeed, the authors observed higher non-uniformity in the dust distribution at a 30° tilt angle compared to a 15° tilt angle [48,49].
Hagazy [50] studied the effect of dust deposition on glass plates exposed for one year by changing tilt angles in the Minia region of Egypt. The experiment was carried out with nine glass slides of 3 mm thickness each, keeping one slide constantly clean for reference. The eight glass slides were kept on wooden casings with inclinations, β, of 0°, 10°, 20°, 30°, 40°, 50°, 60°, and 90°. It was observed that with the increase in the number of days of exposure, the transmittance decreased due to soiling. In the tested glass samples, soiling decreased with an increase in the tilt angles. Xu et al. [51] also observed that tilt angles should be optimized to reduce dust depositions, considering the solar position at each geographical location. In general, higher tilt angles should be preferred to reduce soiling.
3.5. Effect of Properties of Dust
Fine particles tend to deteriorate PV performance more than coarser particles [30]. This is possibly due to two reasons. First, the fine dust elements scatter on the whole of a PV module’s plane, leaving very narrow interparticle gaps. Second, high-wind blowing removes more coarse particles than fine particles deposited on a module’s surface. However, larger dust particles settle faster due to gravity [31].
The deposition of soiling, however, also depends on the characteristics of dust and on its interaction with a module’s surface. For example, once the first dust layer is deposited, it facilitates the deposition of new layers that overlap [30]. Therefore, the minimization or elimination of the soiling layer is a very critical challenge. Several studies in the literature focused on the impact of various forms of dust and their deposition on solar modules [27,28,52]. A study in Athens, Greece, used two pairs of Poly-Si PV modules (102 Wp) and three dust samples, i.e., ash, red soil, and limestone [28]. The power generation loss was found to vary depending on the various dust types and deposition patterns. The authors calculated the deposition density (∂M) by measuring the weight of the dust collected (∆m) and dividing it by the active area of the module’s surface (Ac), as in Equation (4):
∂M = ∆m/Ac
The authors observed that, as the deposition density of the reddish soil fragments increased from 0.12 to 0.35 g/m2, the power output decreased by 4%. Correspondingly, when the observed deposition density of the limestone increased from 0.28 to 1.51 g/m2, the power output dropped by 11%. For the ash, when deposition density increased from 0.63 to 3.71 g/m2, the power decreased by 2.3%. According to the findings, 0.35 g/m2 of red soil deposition over PV modules reduces the energy by 7.5%, whereas the same density for limestone reduces the energy by 4%. Even if the ash pollutant’s mass is practically doubled, the energy produced is only 2.3% lower. Red soil’s color, composition, and diameter range may hinder the PV module’s performance [28].
Adinoyi et al. [53] used scanning electron microscope (SEM) micrographs to show that dust particles have diverse asymmetrical structures which impact the PV module surface as a shading effect in the Eastern Province of Saudi Arabia. The authors analyzed different dust spectra and showed that oxygen (58% by weight) had the largest content in dust, followed by calcium (13%), carbon (10%), and sulfur (6%), respectively. Yilbas et al. [54] also performed the characterization of environmental dust in Dammam, Saudi Arabia, which is a high-humidity area during spring, summer, and autumn. The average particle size of dust was found to be 1.2 µm (varying from the nanometer range to 30 µm). The elemental compositions present were Fe, Si, Ca, Mg, Na, K, O, and S. The elements with the highest concentrations were Na, K, Ca, and O. Among these, Cl was found more frequently in small particles (≤2 µm). This might be because the smaller particles remain suspended in the air for longer periods and interact more with solar radiation, leading to the attachment of ionic compounds in that area. Also, a study by Mishra et al. [55] in Rajasthan, India, on regional atmospheric dust observed the presence of C, N, O, and Si, as well as rich amounts of NaCl and CaCO3.
Appels et al. [56] examined the physical properties of dust in Belgium with soil samples collected from glass coupons littered with pollen (approx. 60 µm in size). Power losses as high as 4% were registered due to soiling at the experimental site during five weeks of outdoor exposure only. After regular intervals of rainfall, a small cleaning effect was found for smaller dust particles with diameters of 2–10 µm. The authors compared SEM images taken from coupons that were and were not shielded from rain. The SEM images shielded from rain are shown in Figure 4A. Likewise, the unshielded SEM images are shown in Figure 4B. The pollens were completely washed away by rain in the unshielded SEM images, but PM2.5 to PM10 seem to have remained after the rainfall. Mahfaud et al. [57] estimated the distribution of particle sizes in different soil samples using a digital microscope (Dino-lite AM4113). The authors compared the observed particle sizes with those reported in the literature, as shown in Table 1. The variation shown in measured grain sizes may be due to the unalike particles present in the dust types at divergent sites. The authors observed PV power losses of up to 16% when dust was deposited on the bottom edges of module surfaces.

Figure 4.
(A) SEM images of glass sample (30° tilt angle); identification of pollen: (a, b, and c are pine, maple, and oak) [56]; (B) SEM image for surface of a glass sample after rain fall (30° tilt angle) [56]; (C) SEM image of agglomerated dust particles [59]; (D) EDS images of exposed glass samples [59].

Table 1.
Comparison of particle sizes with dust types, as measured and reported in [57].
Table 1.
Comparison of particle sizes with dust types, as measured and reported in [57].
| Dust Types | Measured Particle Sizes (in µm) | Reference Particle Sizes (in µm) | Reference |
|---|---|---|---|
| Cement | 10 | 10 | [56] |
| Soil | 128.466 | 100–300 | [58] |
| Sand | 230.50 | 250 | [58] |
| Salt (NaCl) | 3191 | >210 | [56] |
| Gypsum | 18.332 | <60 | [58] |
| Ash | 9.696 | <10 | [58] |
Conceição et. al. [59] analyzed the PM present in deposited dust in Évora, southern Portugal, through SEM and Energy-Dispersive X-ray Spectroscopy. The experiment was performed during a Saharan dust transportation event in Portugal. Figure 4C,D represents the SEM and EDS images for exposed glass samples. Figure 4C shows agglomerated dust particles, which were mostly mixed with aluminosilicates (AS) and halite (NaCl). The other observed particles present in the accumulated dust were aluminum, sulfur, and chlorine, marked in the color codes of blue, green, and red, respectively, as shown in Figure 4D.
4. Power Loss of PV Modules Due to Soiling
Soiling limits the light transmittance of PV modules, resulting in a loss in energy conversion. In humid environments, different substances, including alkaline metals (e.g., K, Na) and chemicals that are not soluble (e.g., calcite, silica), can form sticky patches on a module’s surface that (i) reduce the optical transmittance of a glass surface and (ii) affect a surface’s texture and microhardness [29,54]. In addition, dried leaves, bird droppings, etc., may completely block sunlight if modules are left unclean [29]. Soiling can also induce partial shading, which might create hot spots. These lead to cells that act as resistance to the flow of current generated by the other cells. Hot spots reduce energy efficiency and shorten a module’s lifespan. Also, some additional adverse effects of hotspot formation on PV cells are the cracking of glass, the melting of solders, etc. [29]. A bypass diode can be connected in parallel with the opposite polarity of the cell to solve the problem of hot spot creation due to partial shading in solar modules [22].
The studies available in the literature have investigated the effects of soiling on PV modules from two different perspectives. In one case, natural soiling has been collected on PV modules or glass coupons. In the other case, the soiling deposition has been realized indoors, in a controlled environment. These two different categories of studies are reviewed individually in the two following subsections.
4.1. Study of Soiling in Outdoors
In general, dust deposition is more often observed in tropical regions due to PV modules being installed with a lower tilt [60]. In various regions of Spain, soiling loss ranging from 1 to 7% was observed, whereas for dry climatic regions like Kuwait, Cyprus, and Egypt, it was found to be more than 10% [36,41]. It is necessary to formulate a relationship between power drops due to soiling and accumulated dust over a PV module at installation sites. Since the dust accumulation per unit area depends on the local environment [61], the dust deposition rate can be formulated from the data obtained from PV performance parameters such as Voc, Isc, and FF rather than environmental parameters. Furthermore, an analysis can be performed with advanced electronic monitoring tools and sensors present in the market for emerging PV technology [62].
Said [20] observed the performance of a PV module during a long-term outdoor exposure oriented to the south with a tilt angle of 26° in the Dhahran desert, Saudi Arabia. The efficiencies of clean and soiled photovoltaic modules were compared. The authors found that the average degradation rate of efficiency was 7% per month due to dust deposition. Numerous pieces of research until 2021 reported that the soiling loss per unit area of PV modules occurred in the vicinity of 2 to 3.7% [63]. As previously stated, dust’s impact on degradation is site- and system-dependent; natural cleaning does not eradicate all degradation, and an irreversible decrease in maximum power may attain a constant value after a long period of time. [64,65]. Oh et al. [66] have reported a 14.3% reduction in the average power of modules after two months of outdoor exposure in Middle Eastern deserts in Asia. Massi Pavan et al. [67] studied two 1-MW PV systems in the southern Italian countryside and found that the system on sandy soil lost 6.9% of its power in seven weeks, while the system on compacted soil lost 1.1%.
Previous research suggests that dust deposition is linked to the solar collector’s tilt angle, the period of installation, the site geography, wind movement, and the dust characteristics. Few studies have examined how PV modules’ features, like cell types and surface materials, affect dust deposition and efficiency deterioration [68]. Likewise, in 2014, Rao et al. [60] conducted a simulated experiment to study the impact of dust on PV modules in Bangalore, India. They found a power loss of 5–6% of Pmax with a deposition density of 1.4 g/m2 at a cell temperature of 30 °C with 800 W/m2 radiation.
Lopez et al. [69] carried out a study on the long-term soiling loss of silicon PV modules in Ispra, Northern Italy. They analyzed 28 modules installed from 1981 to 1985, kept unclean, and dismantled in 2014. After cleaning, the value of Pmax improved in the range of 3.5% to 19.4%, averaging 9.8%, indicating a reduction of 0.20% and 0.31% in Isc and Pmax, respectively.
The correlations between deposition density and glass transmittance losses have also been investigated to foster an understanding of the detrimental effects of soiling [55,56]. Pederson et al. [41] used clean glass pieces to study the reduction in transmittance due to soiling after two months of exposure in Kalkbult, South Africa. They used uncoated and anti-soiling-coated glass coupons placed on a rooftop at an elevation angle of 45°. There was a finding that the transmittance decreased by 0.09% and 0.11%, respectively, with a 10 mg/m2 dust density. Shehri et al. [70] plotted seven days of observational results by exposing glass samples in the outdoor environment of Thuwal, Saudi Arabia. It was found that the maximum drop in transmittance occurred on the first day (i.e., a 2% reduction in transmittance with respect to clean glass slides). Likewise, Tanesab et al. [71] observed the seasonal effect of dust on the degradation of PV module performance at all inclinations in NTT, Indonesia, and Perth, Australia. They found the lowest drop in transmittance at the end of the wet season and the maximum in the summer season.
As can be seen, the soiling losses strongly depend on local conditions, which vary both geographically and seasonally. In addition, the geometry of a system does impact soil accumulation as well. To provide a comprehensive overview of the current knowledge, a list of studies in which the impact of natural soiling was assessed in various locations worldwide is reported in Table 2.
4.2. Study of Soiling in an Artificial Environment
In this emerging time of need and optimistic demand for energy, solar PV indoor-based studies are a prerequisite to understanding the soiling phenomenon to optimize power generation as well as the economy [72]. Indeed, indoor investigations make it possible to assess PV performance in a controlled environment. In 1993, El–Shobokshy et al. [61] designed a solar simulator with three 1000 W tungsten halogen lamps maintaining constant radiation and surface temperature on PV modules. Experimental dusts (i.e., ground, dried, and sieved), containing materials like calcite and silica, were uniformly spread in the simulator on pre-cleaned modules. The investigation showed that when the dust deposition density rose, there was a nonlinear drop in the normalized short-circuit current and the normalized power. At a deposition density of 250 g/m2, the particles with a mean diameter of 80 µm were found to reduce the Isc by 82%, leading to a power degradation of about 84%. The fill factor was also affected by the dust deposition density. In 1999, Goossens et al. [33] designed a simulator with a wind tunnel and observed that the drop in short-circuit current due to soiling in high-wind-speed conditions was higher compared to low wind speed. It was observed that the voltage and power dropped as the speed of the dust-laden artificial wind increased, whereas no systematic variation was observed for the fill factor of the module. Jiang et al. [68] constructed a test chamber with ESD acrylic plates to simulate a natural dust deposition process virtually, as shown in Figure 5. A dust generator and a particle counter were utilized to generate dust and measure its concentration within the simulator. Industries, laboratories, and studies of the environment all make use of dust generators to simulate or evaluate dust-related conditions. A small fan was used to spread the dust particles inside the test space. A solar simulator created artificial solar radiation in the range of 0 to 1000 W/m2, and a pyranometer was used to measure radiation at various points inside the chamber. The temperature and relative humidity inside the chamber were monitored. The η of the tested module rose linearly from 0 to 26%, with a soiling density of 0 to 22 g/m2. The authors also found that the surface material can considerably affect dust deposition and accumulation.
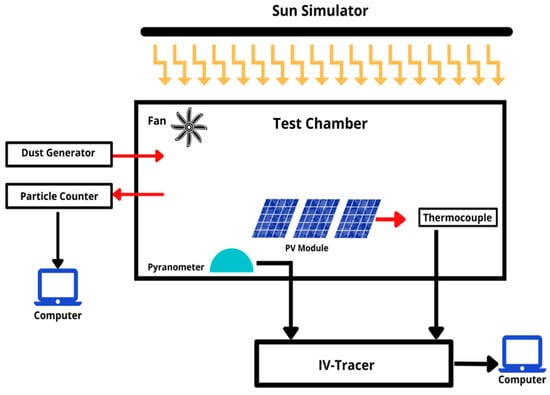
Figure 5.
Schematic of the simulator designed by Jiang et al. [68].
Naveed et al. [72] assembled an indoor soiling chamber to investigate dust deposition patterns and losses on PV modules. The overall working system concept with electrical connections and components used is shown in Figure 6. A PV module was subjected to a daily cycle of outdoor circumstances, and it was observed that after seven days, the module lost 33.54% of its Isc. The suggested soiling station was to investigate the optimum soiling loss on PV modules by altering the elevation angle and atmospheric conditions.
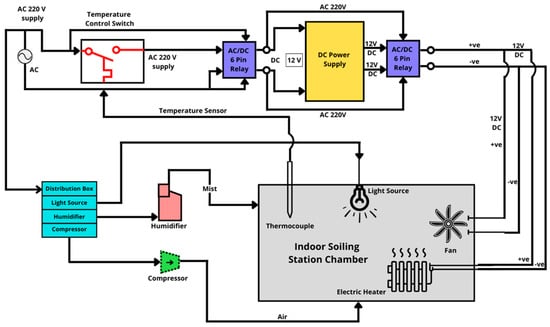
Figure 6.
Assembled indoor soiling chamber [72].
Rao et al. [60] used a solar simulator made of halogen lamps to study soiling losses on PV modules in a dark room. A power loss from 45% to 55% was observed for a soil density of 7.155 g/m2. Sulaiman et al. [27] investigated the effect of different types of dust particles on cleaned and soiled solar PV modules under different solar insolations. The authors used spotlights to simulate natural radiation conditions by applying varieties of dust, which included moss, talcum, sand, etc., on modules exposed to radiations of 310 W/m2 and 250 W/m2. The maximum power was found to be lowered by 86% due to moss accumulation on the PV modules. Because of their small size, dust particles impede transmission.
Many authors have focused on indoor optical soiling detection approaches that have been validated in real-world soiling situations. [73]. Rahman et al. [74] studied PV cell performance parameters, including the effect of dust on power and efficiency. The authors compared the efficiency degradation caused by increasing the solar cell temperature with and without dust conditions. It was found that the efficiency dropped by 1.47% for a soiling rate of 0.012 g/cm2 and a cell temperature of 72.57 °C under an 800 W/m2 irradiation.
As previously shown in Table 2, dust deposition patterns and losses vary with different geographic locations, climatic conditions, and types of dust present. In simulator-type observations, it is not possible to reproduce all the variables that interact with and influence soiling. Despite that, they are equally important as outdoor studies, as they make it possible to analyze and evaluate the impact of specific factors on losses while keeping other variables controlled.
Table 2.
List of outdoor soiling assessments available in the literature. The exposure time (in days) and the observed loss are reported.
Table 2.
List of outdoor soiling assessments available in the literature. The exposure time (in days) and the observed loss are reported.
| Experiment Sites (Latitude and Longitude) | Climate | Mounting Configuration | Experiment Period (Days) | Observed Parameter | Observed Loss (%) | Reference |
|---|---|---|---|---|---|---|
| Jordan, (32.1029° N, 36.1811° E) | Subtropical arid | 26° South | 179 | ηav/day | 0.768 | [75] |
| Spain, (36.8°N, 2.4° W) | Mild oceanic | 22° South | 230 | Isc | 15 | [76] |
| Saudi Arabia (24.71° N, 46.72° E) | Desert | Solar tracking | 30 | Isc | 35 | [77] |
| Pakistan (33.766° N, 72.8232° E) | Continental | 15° South | 30 | T | 60 (coal dust) 31 (module dust) | [78] |
| Kuwait (29.36° N, 47.97° E) | Desert | 30° South | 420 | Pout | 55 | [79] |
| Arequipa (16.40° S, 71.53° W) | Subtropical desert | 16° South | 730 | E | ≈8 | [80] |
| Nigeria (12.5° N, 4.3° E) | Tropical semi-arid | 12.5° South | 120 | Pmax | 60 | [81] |
| Jeddah (21.4933° N, 39.2391° E) | Desert | 10° South | 20 | E | 27 | [82] |
| Saudi Arabia(26.28° N, 50.11° E) | Desert | 26° South | 180 | η | 60 | [20] |
| Nigeria (12.5° N, 4.3° E) | Tropical semi-arid | 13° South | 14 | Isc | 4.7 | [83] |
| Thailand (16.8211° N, 100.2659° E) | Semi-arid | 17° East | 60 | Isc | 2.83–6.03 | [84] |
| Bahrain (26.17° N, 50.54° E) | Desert | 0° | 60 | Isc | 41.4 | [85] |
| Northern Poland (54.37° N, 18.62° E) | Moderate | 34° | 365 | η | 10 | [86] |
| Atacama Desert (23.8634° S, 69.1328° W) | Desert | 20° South | 365 | Isc | 15–55 | [87] |
| Spain (36.8296° N, 2.4048° W) | Mediterranean | 22° South | >30 | E | 10 | [88] |
| India (22.57° N, 88.36° E) | Tropical wet and dry | 20° South | 30 | η | 43.3 | [89] |
| Iran (35.69° N, 51.42° E) | Cold semi-arid | 45° South | 8 | Pout | 43 | [24] |
| Egypt (28.07° N, 30.76° E) | Subtropical | 20°, 40°, 60°, South | 30 | T | 11–21 | [50] |
| Egypt (29.84° N, 31.33° E) | Arid | 15° Northeast | 210 | T | 20.9 | [90] |
| Palestine (32.370° N, 35.108° E) | Mediterranean | 29° South | 365 | Pout | 13.1 | [91] |
| Cairo (30.0444° N, 31.2357° E) | Desert | 20° South | 21 | Isc Voc | 26 8 | [92] |
| UAE (24.9° N and 55.5° E) | Desert | 22° South | 90 | Pout | 13 | [93] |
| Greece (37.98° N, 23.72° E) | Hot summer Mediterranean | 30° South | 60 | E | 6.5 | [94] |
| Kuwait (29.3117° N, 47.4818° E) | Desert | 30° North | 365 | T | 5 | [95] |
| Mexico (29.09° S–110.96° W) | Desert | Sun tracker | 20 | Pout | 8.5 | [8] |
| Santiago, Chile (33.4489° S, 70.6693° W) | Mild | 32° South | 365 | Pout | 1.29–2.77 | [96] |
| Saudi Arabia (30.98° N, 41° E) | Continental | 31° North | 10 | Isc | 27.8 | [97] |
| UAE (24.46° N, 54.36° E) | Desert | 25° South | 18 | Pout | 13 | [98] |
| Italy (40.79° N, 17.10° E) | Mediterranean | 25° South | 240 | Pout | 6.9 | [67] |
| Qatar (27.92° N, 15.54° W) | Desert | 28° South | 180 | Pout | 43 | [99] |
| China (49.7448° N and 116° 21′49.0500″ E) | Simulator | 50° tilt | On 22 g/m2 dust | η | 26 | [68] |
| Northern Nigeria (11°59′02.1″ N, 8°28′ 52.5″ E) | Tropical semi-arid | 12° South | 365 | η | 78 | [100] |
| Libya (26.33° N, 17.22° E) | Desert | 40° North | 120 | Pout | 2.5 | [101] |
| Bangladesh (23.70° N, 90.40° E) | Tropical | 23.5° South | 30 | Isc | 33 | [102] |
| Arabia (26.28° N, 50.11° E) | Desert | 30° South | 30 | Pout | 5.9 | [103] |
| Nigeria (8.13° N, 4.25° E) | Tropical | 0° | 70 | Pout | 25 | [104] |
| Spain (36.72° N, 4.42° W) | Hot summer Mediterranean | 30° South | 365 | E | 20 | [105] |
| China (37.87° N, 112.56° E) | Semi-arid | 45° South | 14 | Pout | 18.2 | [106] |
| Cyprus (34.70° N, 33.02° E) | Mediterranean | 31° South | 70 | Pout | 8 | [107] |
| USA (37.42° N, 120.59° W) | Desert | 25° South | 480 | Isc | 8.6 | [108] |
| Saudi Arabia (26.28° N, 50.11° E) | Desert | 26° South | 240 | Pmax | 45.4 | [53] |
| Spain (36.72° N, 4.42° W) | Hot summer Mediterranean | 21° South | 300 | Isc | 12.5 | [109] |
| Egypt (26.8206° N, 30.8025° E) | Hot summer | 27° South | 120 | η | 50 | [110] |
| Toluca, México (19°21′54.36″ N; 99°9′24.84″ W) | Cold, Mild | 20.3° South | 60, 365 | η | 15,3.6 | [111] |
| India, latitude 12.97° N, longitude 77.56° E). | Semi-arid | 13° South | 30 | Isc | 4–5 | [60] |
| UK (55.3781° N, 3.4360° W) | Mediterranean | 55° North | 30 | T | 5–6 | [25] |
| Senegal, (12.5° and 16.5° North latitude and 12° and 17° West longitude) | Tropical | 4.43° North | 365 | Pmax | 2.6 | [112] |
| Algeria (28.0339° N, 1.6596° E) | Desert | 32° South | 210 | T | 8 | [113] |
| Northern Poland (51.9194° N, 19.1451° E) | Indoor | 37° Tilt | 365 | Pmax | 3 | [114] |
| Gurgaon, India (28°37′ N, 77°14′ E) | Composite climate | 28° South | 365 | Voc and FF, Isc and Pmax | 1.4 and 2.6, 1.8 and 4.1 | [115] |
| Kathmandu, Nepal (27°40′51″ N,85° 14′29″ E) | Composite climate, dry winter | 27° North | 150 | η | 29.76 | [116] |
| Perth, Western Australia (31.95° S and 115.85° E) | Temperate climate | 32° South | 365 | Pmax | 2.3–2.7 | [117] |
| Oman (Northern) (16°40′, 26°20′) N, (51°50′, 59°40′) E | Tropical desert | 16° North | 90 | Pmax | 40 | [118] |
| Dhahran (Saudi Arabia) (26.2361° N, 50.0393° E) | Desert | 26° North | 7 | η | 7.34 | [70] |
| Doha, Qatar (25.2854° N, 51.5310° E) | Semi-arid | 25° North | 150 | Pmax | 30 | [119] |
| Ispra, Northern Italy (45°48′43.4″ N–8°37′37.4″ E) | Moderate subtropical | 45° North | 10,950 | Pmax, Isc | 19.4, 6.7 | [69] |
| Surabaya, Indonesia (7.2575° S, 112.7521° E) | Tropical savannah | 7° and 23° South | 14 | Pmax | 10.8; in dry season. | [35] |
| Baghdad, Iraq (33.3152° N, 44.3661° E) | Desert | 30° North | 7 | Isc | 6.9–16.4 | [120] |
| Atacama Desert (23.8634° S, 69.1328° W) | Desert | 24° South | 120 | T | 55 | [121] |
| China (49.7448″ N and 116°21′49.0500″ E) | Semi-arid | 45° South | 8 | T | 20 | [122] |
| Minas Gerais, Brazil (18.5122° S, 44.5550° W) | Tropical | 8° South | 43 | Pmax | 6.5–13.7 | [123] |
| Tehran, Iran (35.6892° N, 51.3890° E) | Cold semi-arid | 35° North | 70 | Pmax | 21.47 | [124] |
| Doha Qatar (25.2854° N, 51.5310° E) | Desert | 22° North | 01 | Pmax | 0.5 | [125] |
5. Prevention and Restoration from Soiling of PV Modules
5.1. Manual Cleaning
PV modules’ output degrades in high-soiling areas [70,126]. However, low soiling conditions or recurrent precipitation that naturally cleans surfaces pose a risk for long-term exposure to dust. Differently from other performance issues, soiling can be artificially removed from PV modules, either manually or using cleaning robots. Cleaning, however, has a cost that must be lower than the profits made from the recovered energy to make it viable. So, understanding the magnitude of the losses is an essential step to correctly planning an effective cleaning schedule.
A study by Mani et al. [30] may be consulted for a first estimate of the most favorable cleaning cycle at a given location. The authors categorized three different climatic zones based on a study of dust deposition on field-based samples. The authors identified low-, medium-, and high-latitude regions and different dust deposition behaviors, and for each category, they reported recommended mitigation tools and cleaning cycles.
Yu Jiang et al. [127] estimated the cleaning rate of PV modules in a desert area (located at low latitudes; the chosen elevation angle was equal to 0°) based on the dust deposition rate and the relationship between deposited dust concentration. The authors found that a 20-day cleaning frequency at the investigated site restored a power output reduction of 5% for a 100 µg/m3 particle concentration of dust. The authors of [127] also proposed a method to assess the most effective cleaning interval for different particle sizes and tilt angles. Indeed, gravity impacts glass dust deposition. Due to Brownian and turbulent diffusion, frequent cleaning is required for areas with high-diameter dust particles. Brownian and turbulent diffusion both contribute to the overall soiling process, but their relative impact is determined by particle sizes and atmospheric conditions. The authors estimated the cleaning interval time (Ti) using Equation (5). Md represents the particle accumulation density for certain energy losses, Cd represents the particle mass concentration in the ambient air at a particular location, and Vd represents the particle deposition velocity.
Ti = Md/(Cd × Vd)
Figure 7A shows that cleaning times increased with the particle accumulation density. In Figure 7B, the authors tested the tilt angle’s effects on cleaning time. The inclined angle increases the cleaning time, which also depends on the particle concentration and diameter. The authors used a novel method to compute the cleaning time that excludes rainfall to present site-based results. Therefore, the approach works in dry environments. The cleaning time for 5 µm, 10 µm, and 20 µm dust particulates with wind speeds ranging from 1 to 10 m/s was determined to be 287, 76, and 20 days, respectively.
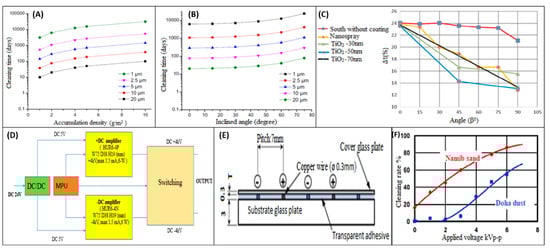
Figure 7.
(A) Cleaning time with respect to dust accumulation density [127]; (B) cleaning time with respect to varied inclination angles [127]; (C) the transmittance of each sample with respect to tilt angles for coated and uncoated samples [128] (D) electrostatic cleaning mechanism [129]; (E) electrostatic cleaning device in cross-sectional view [129]; (F) for dust samples, cleaning rate vs. applied voltage. (Cover glass is 0.1 mm thick; 1 Hz is the applied frequency; and 100 g/m2 is the starting load of dust) [129].
5.2. Natural Cleaning
Soil on PV modules can also be cleaned at no cost by natural processes like rainfall, wind, gravitational forces, and melting snow. As aforementioned, among these cleaning mechanisms, rainfall is the most effective and common one. Snowmelt and enough rain may restore a PV module’s power output. Furthermore, smart tracking solutions can be incorporated to enhance the cleaning process through rain [127]. However, it has been observed that slick mud puddles can form on the surface of solar modules just after a light rainfall [126]. Also, in arid and semi-arid zones, rainfall effects are irregular and low. Likewise, occasional rainfall events in desert lands, including semi-arid zones, cannot clean PV modules [127]. High wind speed is another natural cleaning process that can remove larger dust particles from solar PV modules, but it is restricted to seasonal durations and high tilt angles [126]. Moreover, the cleaning effectiveness depends on the dust particle diameter and the microstructure of the dust layer. Indeed, the force to remove dirt from module surfaces is restricted by the air velocity in the boundary layer and is ineffective for particles that have a diameter under 50 mm at free-stream velocities less than 50 m/s [115,127].
5.3. Passive Cleaning
As an alternative to manual cleanings, operators can try to prevent soil deposition, facilitate its removal, or adopt automated cleaning technologies. Various solutions have been proposed over the years, reaching different stages of development. Their status, limitations, and potential are assessed in the following subsections:
5.3.1. Anti-Soiling Coatings
Anti-soiling coatings may be used as passive measures to reduce dust adherence on PV module surfaces [130,131,132]. To protect a PV system from dust deposition, hydrophobic and hydrophilic self-cleaning coatings may be used [1]. Magnum et al. [133] performed a study on the feasibility of anti-soiling coatings for solar cell glass covers in Brazil, Italy, and Spain. They developed and tested superhydrophilic sol–gel films composed of TiO2/SiO2, superhydrophilic e-beam evaporation films composed of TiO2, and hydrophobic sol–gel films composed of functionalized SiO2. The TiO2/SiO2 layers had a superhydrophilic character with water contact angles of about 0°, whereas the functionalized SiO2 presented hydrophobic properties. A comparative soil testing emphasized the importance of developing anti-soiling techniques in a drier climate region. The authors observed that in the driest periods, the transmittance losses were halved when the TiO2/SiO2 coating was employed. Gholami et al. [128] observed transmittance losses of up to 22% affected by the accumulation of dust on a PV module’s surface over a 70-day test period. They also proposed a nanospray coating with titanium dioxide to reduce dust deposition and tested it at the facilities of the Isfahan University of Technology (Isfahan, Iran). The hydrophobic film was created with nanospray on the sample’s surface, and TiO2 was coated at three different thicknesses to create the hydrophilic film. The transmittance of each sample was measured after 70 days for different tilt angles, as illustrated in Figure 7C. The samples installed at 0° to 90° tilt angles showed the best performance when surface modifications were carried out in no-rain conditions. The authors found that the amount of dust that settled on the sample’s surface decreased by 41%, with a 24% loss in transmission efficiency. The TiO2 layer with a thickness of 50 nm worked the best after 70 days. It was also found that, in addition to having a better self-cleaning property, the TiO2 nanofilms are more permanent, while the nanospray coatings should be reinstated after two years. The findings have not optimized the thickness of the coatings, the durability of anti-soiling behaviors in the long run, or cost-effectiveness.
Anti-soiling coatings are an effective approach to making the module’s surface either highly hydrophobic or very hydrophilic [23,130,132]. However, this method has proven to have a short lifespan and to be site-dependent in terms of both effectiveness and durability [134,135]. Another disadvantage of these approaches is that the re-application of coatings may reduce the transmittance of PV glass, and dust adhesion is heavily reliant on the electrostatic characteristics of the coating. Also, the market segment has yet to produce acceptable coatings with multifunctional properties such as anti-reflection and anti-soiling [136,137].
5.3.2. Electrodynamics Screens (EDSs)
Cleaning dust off solar PV modules is a difficult process since it requires labor, the use of natural resources such as water, the expense of the technology utilized, and its dependability [138,139]. The use of integrated EDSs is a recent breakthrough for self-cleaning solar modules. The EDS technique does not require mechanical movement, water, or labor for cleaning [140]. In an EDS, an electrodynamic field is generated to repel the particles from the PV surface with minimum power consumption. An EDS is a thin layer of electrodes, either straight or complicated, produced on a substrate. Electrodes are isolated from the air by a transparent, dielectric, thin sheet. Standing or traveling waves can be used on EDSs. Dust is moved horizontally by traveling waves, whereas standing waves move it upward and downward. The traveling wave system needs a voltage booster circuit to produce alternating high voltages [1]. Jennifer et al. [141] proposed a computational model to simulate micro-scale particle interactions to optimize an electrodynamic dust shield for desert area applications. The authors computationally simulated the transit, collision, and adhesion of the charged particles, which were a representation of the soiling in Doha, Qatar, using the discrete element approach. Two-phase waves were modeled on an inclined EDS. The simulation showed the optimal distance between electrodes, voltage, and dust transport distance per cycle, as well as the different ways dust particles were repelled and attracted by electrodes under different conditions, which produced different transport patterns to minimize dust deposition on solar modules. The present limitations of the use of EDSs consist of their early development stage and the limited conditions in which they can operate (i.e., RH < 50%). Furthermore, the durability of this technique has not yet been demonstrated and requires further investigation [142]. Extensive research aims to identify and characterize key parameters that influence an EDS’s cleansing efficiency, increase its electrode optical transmission and conductivity, and develop scalable electrode coatings. The fine dust particle removal efficiency must be enhanced while optimizing power consumption; theoretical models constructed to compute cleaning efficiency for simulated EDSs must be experimentally validated further; and new materials must be explored for electrode production on a large scale [143].
5.3.3. Electrostatic Cleaning
Hiroyuki et al. [129] suggested an electrostatic cleaning method that delivered a two-phase high voltage to parallel wire electrodes implanted in the glass plate of a PV module to remove dust from the surfaces of solar modules. The process of applying a high-voltage source to the experimental set is shown in Figure 7D,E, which show a cross-sectional drawing of the cleaning equipment with the cover glass plate thickness. They conducted the experiment in an air-conditioned laboratory, maintaining a temperature of 20–27 °C and a relative humidity of 40–60%, using dust samples from Namib and Doha. The sample diameter of the Namib dust was 200–300 μm, and the diameter of the Doha dust was about 6 to 10 μm. The system enhances performance by applying a high voltage, reducing the adhesion force, and operating it frequently. The authors assessed the high-voltage source’s frequency response and actual power consumption in order to provide data for the system’s design and efficiency evaluation. As shown in Figure 7F, 15% of the Namib dust particles slipped down from the slanted glass plate without a voltage applied, but applying a high voltage increased the performance to 90%. The Doha dust samples did not fall until high voltages were applied. Even at high voltages, the adhesive force hindered small cleanings of the Doha dust particles. This supports the previous finding that tiny particles have a larger adhesion force than the Coulomb driving force. Thus, minute particles stick to the glass plate, reducing the cleaning system’s efficiency. The electrostatic force applied to the particles was outweighed by the adhesion force between the particles and the glass plate; hence, the plate could not be cleaned with a low applied voltage (2 kVp-p). A large-scale solar PV plant’s technology must be tested in desert, dry, and semi-arid regions.
5.3.4. Robotics-Based Cleaning
Robotics-based cleaning technology can automate both cleaning and scrubbing [144,145]. Robots are currently commercially available and are already in use in large solar power plant facilities in the Middle East [18,146]. A dry-cleaning robotic device was designed for use in the UAE. This robot had its own battery and was charged by solar panels. This device had soft microfiber brushes as a cleaning tool. The robot was equipped with four wheels, a rain detection sensor, a controller, and three stepper motors [1]. Parrott et al. [147] developed a robotic dry cleaner and conducted a study of its effectiveness using a silicone rubber brush to clean solar PV modules in Thuwal, Saudi Arabia. The authors claimed the effectiveness of cleaning module surfaces using a silicone rubber foam brush in the automated cleaning technology compared to monthly or weekly cleaning, but might not have considered the power consumption for the said design.
Ahmed et al. [148] created a dry-cleaning robot for Egypt to remove soiling from PV modules. A machine vision camera actuated a microcontroller, which ran the robot. A cleaning hold head was linked to a microfiber bush for cleaning operations. Color differences for various densities of dust deposition were used to create the control mechanism. The cleaning robot was put through three levels of dust density testing: basic (43.69 g/m2), moderate (61.19 g/m2), and intensive (75.23 g/m2). The authors discovered efficiency enhancements of 1.09%, 7.31%, and 37.89% for simple, moderate, and strong dust concentrations, respectively.
Al Shehri et al. [70] mentioned that choosing an optimal brush type is important to meet the required level of cleaning while preventing abrasion, which can lead to the degradation of the transmittance. To address the issues of severe climatic conditions, tough roadways, and incomplete dust particle cleaning on solar module surfaces, an improved robotic cleaning system might be a solution [149].Furthermore, robotic devices consume power, resulting in high operation and maintenance costs, which may not be cost-effective in some applications [150].
5.3.5. High-Pressure Water Jet
A commonly used method for cleaning solar PV modules nowadays is high-pressure water jets and controlled water sprays [151]. In these processes, cleaning is performed by automatically or manually activating a well-designed pump. Water washing improves module performance in two ways: it lowers the cell operating temperature and gets rid of soiling. Moharram et al. [110] observed the influence of cleaning using liquid (water-containing surfactants) on dust-covered solar PV modules. The cell efficiency was preserved at a constant level after the application of the water spray and surfactants made of a mixture of anionic and cationic surfactants. The main drawbacks of these processes are the need for water resources and surfactants and the not-yet-cost-effective scalability of the process. Desert regions have a very limited supply of water, and the surfactants used for cleaning are bad for the environment and might eventually degrade the transmittance of a solar module’s glass cover. Organic salts may form sticky-like coatings on the surface of PV modules if they are not removed. So, the water spraying process does not necessarily provide uniform cleaning and requires trained labor to avoid scratches when scrubbing with a brush. Also, the power required to drive the high-pressure pumps is also a determinantal factor for the PV power plant applied by these processes [110]. In Figure 8, the different cleaning techniques and systems for PV systems are showcased with their advantages and disadvantages [152].
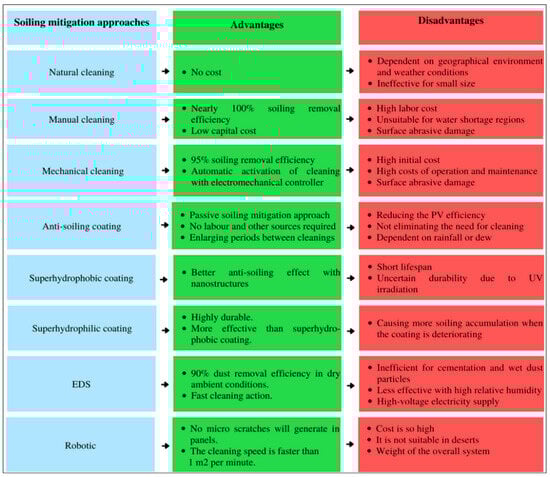
Figure 8.
Comparison of cleaning technologies for solar PV modules [152].
6. Recommendation for the Future Direction of Research
To create efficient soiling mitigation and prevention strategies, it is difficult to understand the connections between dust particles’ physical characteristics, deposition patterns, and PV module performance. So, research and development are still fundamental to addressing the needs and challenges related to dust issues in solar PV systems. Additionally, there are several issues that need more research, including the use of natural resources for cleaning, the deterioration of PV glass surfaces caused by dust, the site-specificity of dust particle composition and size distribution, and the effects of cleaning on PV modules’ glass surfaces.
From numerous studies, we can observe that the current cleaning tools and technologies are not properly utilized in PV power plants because of technological, technical, or economic constraints [144,145,147,151,152]. It has been observed that the electrostatic cleaning system and the water-free automated solar cleaning system are the most effective in cleaning [152]. If a new method is developed that combines both (an electrostatic cleaning system and water-free automated solar cleaning system), it will be more efficient [145,147]. More research should be conducted on this to build the most economically acceptable and efficient one. Novel anti-soiling and cleaning technologies can still be developed and need further research to improve their techno-economic viability and reliability.
7. Conclusions
Soiling (i.e., dust deposition) is a major concern for PV power systems, as it affects their efficiency and their economics. The lower power output in the presence of soiling also reduces the land and material efficiencies of PV modules, negatively affecting the sustainability of this technology. In addition, soiling does not only reduce the transmittance of glass but may also cause permanent degradation as it can lead to the formation of hot spots and abrasion. In this work, the factors that govern soiling on PV modules are discussed based on earlier studies’ findings, and the losses reported in the literature for various locations are assessed. It has been noted that in a single year, dust cover can cause a PV module’s efficiency to decline to 78%.
Some indoor studies have been carried out to understand the effect of environmental circumstances on soiling, but these are not sufficient yet to identify long-term dust deposition patterns for a given location. The problem of dust deposition on PV modules in an artificial environment necessitates the analysis and evaluation of the impact of specific elements on losses for solar power installations in any location. Additionally, thorough confirmation of an indoor study in relation to specific field-based observations is necessary for upcoming soiling research.
The advantages and disadvantages of different mitigation techniques and tools have been discussed in earlier observations and designs. Subsequently, the achievable prerequisites for forthcoming investigations on anti-soiling and cleaning technologies have also been deliberated. Overall, it is found that the effects of soiling and mitigation activities on the glass surfaces of PV modules still require some more in-depth analyses.
Author Contributions
P.B.: Conceptualization, Methodology, Investigation, Formal analysis, Writing—original draft, Data curation. L.M.: Formal analysis, Investigation, Data curation, Writing—original draft. N.S.: Writing—review & editing, Funding acquisition, Supervision. All authors have read and agreed to the published version of the manuscript.
Funding
Funded by Sole4PV, a project funded by the Italian Ministry of University and Research under the 2019 «Rita Levi Montalcini » Program for Young Researchers.
Institutional Review Board Statement
Not applicable.
Informed Consent Statement
Not applicable.
Data Availability Statement
Data sharing is not applicable to this article as no new data were created or analyzed in this study.
Conflicts of Interest
The authors declare no conflict of interest.
Nomenclature
| ∂M | Deposition density (g/m2) |
| ∆m | Weight of dust collected (g) |
| Ac | Area of module surface (m2) |
| AOD | Aerosol optical depth |
| Cd | Particle mass concentration |
| E | Energy (J) |
| FF | Fill factor |
| G | Irradiance over PV module surface |
| G0 | Irradiance at Standard Test Conditions (STC) |
| Isc | Short-circuit current (A) |
| Isc at STC of the dusty module (A) | |
| Isc at STC of the clean module (A) | |
| Isc of the clean PV module (A) | |
| Md | Dust accumulation density (g/m2) |
| MSE | Maximum mean-squared error |
| PM | Particulate Matter (PMx) |
| Pmax | Maximum power (W) |
| Maximum power at clean condition (W) | |
| Maximum power of the soiled PV module (W) | |
| Pout | Output power (W) |
| RM | Relative humidity |
| SEM | Scanning Electron Microscope |
| SR | Soiling Ratio |
| SRIsc | Short-circuit current on soiling (A) |
| SRPmax | Maximum power output on soiling (W) |
| T | Transmission of light |
| Cleaned module temperature (°C) | |
| Soiled module temperature (°C) | |
| T0 | Temperature at 25 °C |
| Ti | Cleaning interval time (Day) |
| Vd | Dust deposition velocity (m/s) |
| Voc | Open circuit voltage |
| Short-circuit temperature correction coefficient | |
| γ | Maximum power temperature correction coefficient |
| η | Efficiency of PV module (%) |
References
- Ghosh, A. Soiling losses: A barrier for India’s energy security dependency from photovoltaic power. Challenges 2020, 11, 9. [Google Scholar] [CrossRef]
- Solar Power Europe, Global Market Outlook 2023–2027. 2023. Available online: http://www.solarpowereurope.org/insights/global-market-outlook/ (accessed on 21 November 2023).
- Capellán-Pérez, I.; De Castro, C.; Arto, I. Assessing vulnerabilities and limits in the transition to renewable energies: Land requirements under 100% solar energy scenarios. Renew. Sustain. Energy Rev. 2017, 77, 760–782. [Google Scholar] [CrossRef]
- Serrano, D.; Margalida, A.; Pérez-García, J.M.; Juste, J.; Traba, J.; Valera, F.; Carrete, M.; Aihartza, J.; Real, J.; Mañosa, S. Renewables in Spain threaten biodiversity. Science 2020, 370, 1282–1283. [Google Scholar] [CrossRef] [PubMed]
- Shukla, A.K.; Sudhakar, K.; Baredar, P. Recent advancement in BIPV product technologies: A review. Energy Build. 2017, 140, 188–195. [Google Scholar] [CrossRef]
- Fernandez, E.F.; Villar-Fernandez, A.; Montes-Romero, J.; Ruiz-Torres, L.; Rodrigo, P.M.; Manzaneda, A.J.; Almonacid, F. Global energy assessment of the potential of photovoltaics for greenhouse farming. Appl. Energy 2022, 309, 118474. [Google Scholar] [CrossRef]
- Kumar, M.; Niyaz, H.M.; Gupta, R. Challenges and opportunities towards the development of floating photovoltaic systems. Sol. Energy Mater. Sol. Cells 2021, 233, 111408. [Google Scholar] [CrossRef]
- Cabanillas, R.; Munguía, H. Dust accumulation effect on efficiency of Si photovoltaic modules. J. Renew. Sustain. Energy 2011, 3, 043114. [Google Scholar] [CrossRef]
- Comello, S.; Reichelstein, S.; Sahoo, A. The road ahead for solar PV power. Renew. Sustain. Energy Rev. 2018, 92, 744–756. [Google Scholar] [CrossRef]
- Sarver, T.; Al-Qaraghuli, A.; Kazmerski, L.L. A comprehensive review of the impact of dust on the use of solar energy: History, investigations, results, literature, and mitigation approaches. Renew. Sustain. Energy Rev. 2013, 22, 698–733. [Google Scholar] [CrossRef]
- Toth, S.; Muller, M.; Miller, D.C.; Moutinho, H.; To, B.; Micheli, L.; Linger, J.; Engtrakul, C.; Einhorn, A.; Simpson, L. Soiling and cleaning: Initial observations from 5-year photovoltaic glass coating durability study. Sol. Energy Mater. Sol. Cells 2018, 185, 375–384. [Google Scholar] [CrossRef]
- Zhang, J.; Zhou, C.; Tang, Y.; Zheng, F.; Meng, M.; Miao, C. Criteria for particles to be levitated and to move continuously on traveling-wave electric curtain for dust mitigation on solar panels. Renew. Energy 2018, 119, 410–420. [Google Scholar] [CrossRef]
- Laarabi, B.; Sankarkumar, S.; Rajasekar, N.; El Baqqal, Y.; Barhdadi, A. Modeling investigation of soiling effect on solar photovoltaic systems: New findings. Sustain. Energy Technol. Assess. 2022, 52, 102126. [Google Scholar] [CrossRef]
- Dahlioui, D.; Laarabi, B.; Barhdadi, A. Review on dew water effect on soiling of solar panels: Towards its enhancement or mitigation. Sustain. Energy Technol. Assess. 2022, 49, 101774. [Google Scholar] [CrossRef]
- Raillani, B.; Chaatouf, D.; Salhi, M.; Amraqui, S.; Mezrhab, A. Effect of wind barrier height on the dust deposition rate of a ground-mounted photovoltaic panel. Sustain. Energy Technol. Assess. 2022, 52, 102035. [Google Scholar] [CrossRef]
- Khodakaram-Tafti, A.; Yaghoubi, M. Experimental study on the effect of dust deposition on photovoltaic performance at various tilts in semi-arid environment. Sustain. Energy Technol. Assess. 2020, 42, 100822. [Google Scholar] [CrossRef]
- Derakhshandeh, J.F.; AlLuqman, R.; Mohammad, S.; AlHussain, H.; AlHendi, G.; AlEid, D.; Ahmad, Z. A comprehensive review of automatic cleaning systems of solar panels. Sustain. Energy Technol. Assess. 2021, 47, 101518. [Google Scholar] [CrossRef]
- Ilse, K.; Micheli, L.; Figgis, B.W.; Lange, K.; Daßler, D.; Hanifi, H.; Wolfertstetter, F.; Naumann, V.; Hagendorf, C.; Gottschalg, R. Techno-economic assessment of soiling losses and mitigation strategies for solar power generation. Joule 2019, 3, 2303–2321. [Google Scholar] [CrossRef]
- Tsoar, H. Bagnold, RA 1941: The physics of blown sand and desert dunes. London: Methuen. Prog. Phys. Geogr. 1994, 18, 91–96. [Google Scholar] [CrossRef]
- Said, S. Effects of dust accumulation on performances of thermal and photovoltaic flat-plate collectors. Appl. Energy 1990, 37, 73–84. [Google Scholar] [CrossRef]
- Al-Alawy, I.T. Wind and other factor requirements to solar energy applications in Iraq. Sol. Wind Technol. 1990, 7, 597–600. [Google Scholar] [CrossRef]
- Biryukov, S. An experimental study of the dry deposition mechanism for airborne dust. J. Aerosol Sci. 1998, 29, 129–139. [Google Scholar] [CrossRef]
- Arabatzis, I.; Todorova, N.; Fasaki, I.; Tsesmeli, C.; Peppas, A.; Li, W.X.; Zhao, Z. Photocatalytic, self-cleaning, antireflective coating for photovoltaic panels: Characterization and monitoring in real conditions. Sol. Energy 2018, 159, 251–259. [Google Scholar] [CrossRef]
- Asl-Soleimani, E.; Farhangi, S.; Zabihi, M. The effect of tilt angle, air pollution on performance of photovoltaic systems in Tehran. Renew. Energy 2001, 24, 459–468. [Google Scholar] [CrossRef]
- Ghazi, S.; Sayigh, A.; Ip, K. Dust effect on flat surfaces–A review paper. Renew. Sustain. Energy Rev. 2014, 33, 742–751. [Google Scholar] [CrossRef]
- Li, X.; Mauzerall, D.L.; Bergin, M.H. Global reduction of solar power generation efficiency due to aerosols and panel soiling. Nat. Sustain. 2020, 3, 720–727. [Google Scholar] [CrossRef]
- Sulaiman, S.A.; Singh, A.K.; Mokhtar, M.M.M.; Bou-Rabee, M.A. Influence of dirt accumulation on performance of PV panels. Energy Procedia 2014, 50, 50–56. [Google Scholar] [CrossRef]
- Kaldellis, J.; Fragos, P.; Kapsali, M. Systematic experimental study of the pollution deposition impact on the energy yield of photovoltaic installations. Renew. Energy 2011, 36, 2717–2724. [Google Scholar] [CrossRef]
- Maghami, M.R.; Hizam, H.; Gomes, C.; Radzi, M.A.; Rezadad, M.I.; Hajighorbani, S. Power loss due to soiling on solar panel: A review. Renew. Sustain. Energy Rev. 2016, 59, 1307–1316. [Google Scholar] [CrossRef]
- Mani, M.; Pillai, R. Impact of dust on solar photovoltaic (PV) performance: Research status, challenges and recommendations. Renew. Sustain. Energy Rev. 2010, 14, 3124–3131. [Google Scholar] [CrossRef]
- Said, S.A.; Hassan, G.; Walwil, H.M.; Al-Aqeeli, N. The effect of environmental factors and dust accumulation on photovoltaic modules and dust-accumulation mitigation strategies. Renew. Sustain. Energy Rev. 2018, 82, 743–760. [Google Scholar] [CrossRef]
- Mekhilef, S.; Saidur, R.; Kamalisarvestani, M. Effect of dust, humidity and air velocity on efficiency of photovoltaic cells. Renew. Sustain. Energy Rev. 2012, 16, 2920–2925. [Google Scholar] [CrossRef]
- Goossens, D.; Offer, Z.Y.; Zangvil, A. Wind tunnel experiments and field investigations of eolian dust deposition on photovoltaic solar collectors. Sol. Energy 1993, 50, 75–84. [Google Scholar] [CrossRef]
- Said, S.A.; Walwil, H.M. Fundamental studies on dust fouling effects on PV module performance. Sol. Energy 2014, 107, 328–337. [Google Scholar] [CrossRef]
- Ramli, M.A.; Prasetyono, E.; Wicaksana, R.W.; Windarko, N.A.; Sedraoui, K.; Al-Turki, Y.A. On the investigation of photovoltaic output power reduction due to dust accumulation and weather conditions. Renew. Energy 2016, 99, 836–844. [Google Scholar] [CrossRef]
- Corn, M. The adhesion of solid particles to solid surfaces, I. A review. J. Air Pollut. Control Assoc. 1961, 11, 523–528. [Google Scholar] [CrossRef] [PubMed]
- Vuollekoski, H.; Vogt, M.; Sinclair, V.; Duplissy, J.; Järvinen, H.; Kyrö, E.; Makkonen, R.; Petäjä, T.; Prisle, N.; Räisänen, P. Estimates of global dew collection potential. Hydrol. Earth Syst. Sci. Discuss 2014, 11, 9519–9549. [Google Scholar] [CrossRef]
- Isaifan, R.J.; Johnson, D.; Ackermann, L.; Figgis, B.; Ayoub, M. Evaluation of the adhesion forces between dust particles and photovoltaic module surfaces. Sol. Energy Mater. Sol. Cells 2019, 191, 413–421. [Google Scholar] [CrossRef]
- Simsek, E.; Williams, M.J.; Pilon, L. Effect of dew and rain on photovoltaic solar cell performances. Sol. Energy Mater. Sol. Cells 2021, 222, 110908. [Google Scholar] [CrossRef]
- Beysens, D. Estimating dew yield worldwide from a few meteo data. Atmos. Res. 2016, 167, 146–155. [Google Scholar] [CrossRef]
- Pedersen, H.; Strauss, J.; Selj, J. Effect of soiling on photovoltaic modules in Norway. Energy Procedia 2016, 92, 585–589. [Google Scholar] [CrossRef]
- Mejia, F.; Kleissl, J.; Bosch, J. The effect of dust on solar photovoltaic systems. Energy Procedia 2014, 49, 2370–2376. [Google Scholar] [CrossRef]
- Valerino, M.; Ratnaparkhi, A.; Ghoroi, C.; Bergin, M. Seasonal photovoltaic soiling: Analysis of size and composition of deposited particulate matter. Sol. Energy 2021, 227, 44–55. [Google Scholar] [CrossRef]
- Del Pero, C.; Aste, N.; Leonforte, F. The effect of rain on photovoltaic systems. Renew. Energy 2021, 179, 1803–1814. [Google Scholar] [CrossRef]
- Conceição, R.; Silva, H.G.; Mirão, J.; Collares-Pereira, M. Organic soiling: The role of pollen in PV module performance degradation. Energies 2018, 11, 294. [Google Scholar] [CrossRef]
- Souza, G.; Santos, R.; Saraiva, E. A Log-Logistic Predictor for Power Generation in Photovoltaic Systems. Energies 2022, 15, 5973. [Google Scholar] [CrossRef]
- Negash, T.; Tadiwose, T. Experimental investigation of the effect of tilt angle on the dust photovoltaic module. Int. J. Energy Power Eng 2015, 4, 227–231. [Google Scholar] [CrossRef]
- Qasem, H.; Betts, T.R.; Müllejans, H.; AlBusairi, H.; Gottschalg, R. Dust-induced shading on photovoltaic modules. Prog. Photovolt. Res. Appl. 2014, 22, 218–226. [Google Scholar] [CrossRef]
- Costa, S.C.S.; Kazmerski, L.L.; Diniz, A.S.A. Impact of soiling on Si and CdTe PV modules: Case study in different Brazil climate zones. Energy Convers. Manag. X 2021, 10, 100084. [Google Scholar] [CrossRef]
- Hegazy, A.A. Effect of dust accumulation on solar transmittance through glass covers of plate-type collectors. Renew. Energy 2001, 22, 525–540. [Google Scholar] [CrossRef]
- Xu, R.; Ni, K.; Hu, Y.; Si, J.; Wen, H.; Yu, D. Analysis of the optimum tilt angle for a soiled PV panel. Energy Convers. Manag. 2017, 148, 100–109. [Google Scholar] [CrossRef]
- El-Shobokshy, M.S.; Hussein, F.M. Degradation of photovoltaic cell performance due to dust deposition on to its surface. Renew. Energy 1993, 3, 585–590. [Google Scholar] [CrossRef]
- Adinoyi, M.J.; Said, S.A. Effect of dust accumulation on the power outputs of solar photovoltaic modules. Renew. Energy 2013, 60, 633–636. [Google Scholar] [CrossRef]
- Yilbas, B.S.; Ali, H.; Al-Aqeeli, N.; Khaled, M.M.; Said, S.; Abu-Dheir, N.; Merah, N.; Youcef-Toumi, K.; Varanasi, K.K. Characterization of environmental dust in the Dammam area and mud after-effects on bisphenol-A polycarbonate sheets. Sci. Rep. 2016, 6, 1–14. [Google Scholar] [CrossRef] [PubMed]
- Mishra, S.K.; Agnihotri, R.; Yadav, P.K.; Singh, S.; Prasad, M.; Praveen, P.S.; Tawale, J.S.; Mishra, N.D.; Arya, B.C.; Sharma, C. Morphology of atmospheric particles over Semi-Arid region (Jaipur, Rajasthan) of India: Implications for optical properties. Aerosol Air Qual. Res. 2015, 15, 974–984. [Google Scholar] [CrossRef]
- Appels, R.; Lefevre, B.; Herteleer, B.; Goverde, H.; Beerten, A.; Paesen, R.; De Medts, K.; Driesen, J.; Poortmans, J. Effect of soiling on photovoltaic modules. Sol. Energy 2013, 96, 283–291. [Google Scholar] [CrossRef]
- Abderrezek, M.; Fathi, M. Experimental study of the dust effect on photovoltaic panels’ energy yield. Sol. Energy 2017, 142, 308–320. [Google Scholar] [CrossRef]
- Kaldellis, J.K.; Kapsali, M. Simulating the dust effect on the energy performance of photovoltaic generators based on experimental measurements. Energy 2011, 36, 5154–5161. [Google Scholar] [CrossRef]
- Conceicao, R.; Silva, H.G.; Mirao, J.; Gostein, M.; Fialho, L.; Narvarte, L.; Collares-Pereira, M. Saharan dust transport to Europe and its impact on photovoltaic performance: A case study of soiling in Portugal. Sol. Energy 2018, 160, 94–102. [Google Scholar] [CrossRef]
- Rao, A.; Pillai, R.; Mani, M.; Ramamurthy, P. Influence of dust deposition on photovoltaic panel performance. Energy Procedia 2014, 54, 690–700. [Google Scholar] [CrossRef]
- Fernández-Solas, Á.; Montes-Romero, J.; Micheli, L.; Almonacid, F.; Fernández, E.F. Estimation of soiling losses in photovoltaic modules of different technologies through analytical methods. Energy 2022, 244, 123173. [Google Scholar] [CrossRef]
- Bessa, J.G.; Micheli, L.; Almonacid, F.; Fernández, E.F. Monitoring photovoltaic soiling: Assessment, challenges, and perspectives of current and potential strategies. Iscience 2021, 24, 102165. [Google Scholar] [CrossRef]
- Javed, W.; Guo, B.; Figgis, B.; Aïssa, B. Dust potency in the context of solar photovoltaic (PV) soiling loss. Sol. Energy 2021, 220, 1040–1052. [Google Scholar] [CrossRef]
- Micheli, L.; Theristis, M.; Livera, A.; Stein, J.S.; Georghiou, G.E.; Muller, M.; Almonacid, F.; Fernández, E.F. Improved PV soiling extraction through the detection of cleanings and change points. IEEE J. Photovolt. 2021, 11, 519–526. [Google Scholar] [CrossRef]
- Nimmo, B.; Said, S.A. Effects of dust on the performance of thermal and photovoltaic flat plate collectors in Saudi Arabia: Preliminary results. In Proceedings of the Miami International Conference on Alternative Energy Sources, Miami Beach, FL, USA, 10 December 1979. [Google Scholar]
- Oh, W.; Kang, B.; Choi, S.; Bae, S.; Jeong, S.; Kim, S.M.; Lee, H.-S.; Kim, D.; Hwang, H.; Chan, S.-I. Evaluation of anti-soiling and anti-reflection coating for photovoltaic modules. J. Nanosci. Nanotechnol. 2016, 16, 10689–10692. [Google Scholar] [CrossRef]
- Pavan, A.M.; Mellit, A.; De Pieri, D. The effect of soiling on energy production for large-scale photovoltaic plants. Sol. Energy 2011, 85, 1128–1136. [Google Scholar] [CrossRef]
- Jiang, H.; Lu, L.; Sun, K. Experimental investigation of the impact of airborne dust deposition on the performance of solar photovoltaic (PV) modules. Atmos. Environ. 2011, 45, 4299–4304. [Google Scholar] [CrossRef]
- Lopez-Garcia, J.; Pozza, A.; Sample, T. Long-term soiling of silicon PV modules in a moderate subtropical climate. Sol. Energy 2016, 130, 174–183. [Google Scholar] [CrossRef]
- Al Shehri, A.; Parrott, B.; Carrasco, P.; Al Saiari, H.; Taie, I. Impact of dust deposition and brush-based dry cleaning on glass transmittance for PV modules applications. Sol. Energy 2016, 135, 317–324. [Google Scholar] [CrossRef]
- Tanesab, J.; Parlevliet, D.; Whale, J.; Urmee, T. Seasonal effect of dust on the degradation of PV modules performance deployed in different climate areas. Renew. Energy 2017, 111, 105–115. [Google Scholar] [CrossRef]
- Hussain, N.; Shahzad, N.; Yousaf, T.; Waqas, A.; Javed, A.H.; Khan, S.; Ali, M.; Liaquat, R. Designing of homemade soiling station to explore soiling loss effects on PV modules. Sol. Energy 2021, 225, 624–633. [Google Scholar] [CrossRef]
- Fernández-Solas, Á.; Micheli, L.; Almonacid, F.; Fernández, E.F. Indoor validation of a multiwavelength measurement approach to estimate soiling losses in photovoltaic modules. Sol. Energy 2022, 241, 584–591. [Google Scholar] [CrossRef]
- Rahman, M.; Hasanuzzaman, M.; Rahim, N.A. Effects of various parameters on PV-module power and efficiency. Energy Convers. Manag. 2015, 103, 348–358. [Google Scholar] [CrossRef]
- Al-Kouz, W.; Al-Dahidi, S.; Hammad, B.; Al-Abed, M. Modeling and analysis framework for investigating the impact of dust and temperature on PV systems’ performance and optimum cleaning frequency. Appl. Sci. 2019, 9, 1397. [Google Scholar] [CrossRef]
- Simal Pérez, N.; Alonso-Montesinos, J.; Batlles, F.J. Estimation of soiling losses from an experimental photovoltaic plant using artificial intelligence techniques. Appl. Sci. 2021, 11, 1516. [Google Scholar] [CrossRef]
- KHOSHAIM, B.H. Performance characteristics of 350 kW photovoltaic power system for Saudi Arabian villages. Int. J. Sol. Energy 1982, 1, 91–103. [Google Scholar] [CrossRef]
- Riaz, M.H.; Mahmood, T. Experimental Analysis of Soiling Loss on PV Module in Cement Plant Environment. Eng. Proc. 2022, 20, 13. [Google Scholar] [CrossRef]
- Sayyah, A.; Horenstein, M.N.; Mazumder, M.K. Energy yield loss caused by dust deposition on photovoltaic panels. Sol. Energy 2014, 107, 576–604. [Google Scholar] [CrossRef]
- Romero-Fiances, I.; Muñoz-Cerón, E.; Espinoza-Paredes, R.; Nofuentes, G.; De la Casa, J. Analysis of the performance of various pv module technologies in Peru. Energies 2019, 12, 186. [Google Scholar] [CrossRef]
- Bajpai, S.; Gupta, R. Performance of Silicon solar-cells under Hot and dusty environmental-conditions. Indian J. Pure Appl. Phys. 1988, 26, 364–369. [Google Scholar]
- Alghamdi, A.S.; Bahaj, A.S.; Blunden, L.S.; Wu, Y. Dust removal from solar PV modules by automated cleaning systems. Energies 2019, 12, 2923. [Google Scholar] [CrossRef]
- Yahya, H.; Sambo, A. The effect of dust on the performance of photovoltaic modules in Sokoto. Niger. J. Renew. Energy 1991, 2, 36–42. [Google Scholar]
- Ketjoy, N.; Konyu, M. Study of dust effect on photovoltaic module for photovoltaic power plant. Energy Procedia 2014, 52, 431–437. [Google Scholar] [CrossRef]
- Som, A.; Al-Alawi, S. Evaluation of efficiency and degradation of mono-and polycrystalline PV modules under outdoor conditions. Renew. Energy 1992, 2, 85–91. [Google Scholar] [CrossRef]
- Klugmann-Radziemska, E.; Rudnicka, M. The analysis of working parameters decrease in photovoltaic modules as a result of dust deposition. Energies 2020, 13, 4138. [Google Scholar] [CrossRef]
- Vásquez, P.; Devoto, I.; Ferrada, P.; Taquichiri, A.; Portillo, C.; Palma-Behnke, R. Inspection data collection tool for field testing of photovoltaic modules in the atacama desert. Energies 2021, 14, 2409. [Google Scholar] [CrossRef]
- López, G.; Ramírez, D.; Alonso-Montesinos, J.; Sarmiento, J.; Polo, J.; Martín-Chivelet, N.; Marzo, A.; Batlles, F.J.; Ferrada, P. Design of a low-cost multiplexer for the study of the impact of soiling on PV panel performance. Energies 2021, 14, 4186. [Google Scholar] [CrossRef]
- Sengupta, S.; Ghosh, A.; Mallick, T.K.; Chanda, C.K.; Saha, H.; Bose, I.; Jana, J.; Sengupta, S. Model based generation prediction of SPV power plant due to weather stressed soiling. Energies 2021, 14, 5305. [Google Scholar] [CrossRef]
- Elminir, H.K.; Ghitas, A.E.; Hamid, R.; El-Hussainy, F.; Beheary, M.; Abdel-Moneim, K.M. Effect of dust on the transparent cover of solar collectors. Energy Convers. Manag. 2006, 47, 3192–3203. [Google Scholar] [CrossRef]
- Abdallah, R.; Juaidi, A.; Abdel-Fattah, S.; Qadi, M.; Shadid, M.; Albatayneh, A.; Çamur, H.; García-Cruz, A.; Manzano-Agugliaro, F. The effects of soiling and frequency of optimal cleaning of PV panels in Palestine. Energies 2022, 15, 4232. [Google Scholar] [CrossRef]
- Alquthami, T.; Menoufi, K. Soiling of photovoltaic modules: Comparing between two distinct locations within the framework of developing the photovoltaic soiling index (PVSI). Sustainability 2019, 11, 4697. [Google Scholar] [CrossRef]
- Shah, A.H.; Hassan, A.; Laghari, M.S.; Alraeesi, A. The influence of cleaning frequency of photovoltaic modules on power losses in the desert climate. Sustainability 2020, 12, 9750. [Google Scholar] [CrossRef]
- Kaldellis, J.; Kokala, A. Quantifying the decrease of the photovoltaic panels’ energy yield due to phenomena of natural air pollution disposal. Energy 2010, 35, 4862–4869. [Google Scholar] [CrossRef]
- Aldihani, A. Performance and cost assessment of three different crystalline silicon PV modules in Kuwait environments. Int. J. Renew. Energy Res. 2017, 7, 128–136. [Google Scholar] [CrossRef]
- Urrejola, E.; Antonanzas, J.; Ayala, P.; Salgado, M.; Ramírez-Sagner, G.; Cortés, C.; Pino, A.; Escobar, R. Effect of soiling and sunlight exposure on the performance ratio of photovoltaic technologies in Santiago, Chile. Energy Convers. Manag. 2016, 114, 338–347. [Google Scholar] [CrossRef]
- Ibrahim, A. Effect of shadow and dust on the performance of silicon solar cell. J. Basic Appl. Sci. Res. 2011, 1, 222–230. [Google Scholar]
- Al Hanai, T.; Hashim, R.B.; El Chaar, L.; Lamont, L.A. Environmental effects on a grid connected 900 W photovoltaic thin-film amorphous silicon system. Renew. Energy 2011, 36, 2615–2622. [Google Scholar] [CrossRef]
- Zeedan, A.; Barakeh, A.; Al-Fakhroo, K.; Touati, F.; Gonzales Jr, A.S. Quantification of PV power and economic losses due to soiling in Qatar. Sustainability 2021, 13, 3364. [Google Scholar] [CrossRef]
- Chanchangi, Y.N.; Ghosh, A.; Baig, H.; Sundaram, S.; Mallick, T.K. Soiling on PV performance influenced by weather parameters in Northern Nigeria. Renew. Energy 2021, 180, 874–892. [Google Scholar] [CrossRef]
- Mohamed, A.O.; Hasan, A. Effect of dust accumulation on performance of photovoltaic solar modules in Sahara environment. J. Basic Appl. Sci. Res. 2012, 2, 11030–11036. [Google Scholar]
- Rahman, M.M.; Islam, M.A.; Karim, A.; Ronee, A.H. Effects of natural dust on the performance of PV panels in Bangladesh. Int. J. Mod. Educ. Comput. Sci. 2012, 4, 26–32. [Google Scholar] [CrossRef]
- Rehman, S.; El-Amin, I. Performance evaluation of an off-grid photovoltaic system in Saudi Arabia. Energy 2012, 46, 451–458. [Google Scholar] [CrossRef]
- Sanusi, Y. The performance of amorphous silicon PV system under Harmattan dust conditions in a tropical area. Pac. J. Sci. Technol. 2012, 13, 168–175. [Google Scholar]
- Zorrilla-Casanova, J.; Piliougine, M.; Carretero, J.; Bernaola-Galván, P.; Carpena, P.; Mora-López, L.; Sidrach-de-Cardona, M. Losses produced by soiling in the incoming radiation to photovoltaic modules. Prog. Photovolt. Res. Appl. 2013, 21, 790–796. [Google Scholar] [CrossRef]
- Liqun, L.; Zhiqi, L.; Chunxia, S.Z.L. Degraded output characteristic at atmospheric air pollution and economy analysis of PV power system: A case study. Prz. Elektrotechniczny 2012, 88, 281–284. [Google Scholar]
- Kalogirou, S.A.; Agathokleous, R.; Panayiotou, G. On-site PV characterization and the effect of soiling on their performance. Energy 2013, 51, 439–446. [Google Scholar] [CrossRef]
- Caron, J.R.; Littmann, B. Direct monitoring of energy lost due to soiling on first solar modules in California. IEEE J. Photovolt. 2012, 3, 336–340. [Google Scholar] [CrossRef]
- Piliougine, M.; Canete, C.; Moreno, R.; Carretero, J.; Hirose, J.; Ogawa, S.; Sidrach-de-Cardona, M. Comparative analysis of energy produced by photovoltaic modules with anti-soiling coated surface in arid climates. Appl. Energy 2013, 112, 626–634. [Google Scholar] [CrossRef]
- Moharram, K.; Abd-Elhady, M.; Kandil, H.; El-Sherif, H. Influence of cleaning using water and surfactants on the performance of photovoltaic panels. Energy Convers. Manag. 2013, 68, 266–272. [Google Scholar] [CrossRef]
- Weber, B.; Quiñones, A.; Almanza, R.; Duran, M.D. Performance reduction of PV systems by dust deposition. Energy Procedia 2014, 57, 99–108. [Google Scholar] [CrossRef]
- Ndiaye, A.; Kébé, C.M.; Charki, A.; Ndiaye, P.A.; Sambou, V.; Kobi, A. Degradation evaluation of crystalline-silicon photovoltaic modules after a few operation years in a tropical environment. Sol. Energy 2014, 103, 70–77. [Google Scholar] [CrossRef]
- Semaoui, S.; Arab, A.H.; Boudjelthia, E.K.; Bacha, S.; Zeraia, H. Dust effect on optical transmittance of photovoltaic module glazing in a desert region. Energy Procedia 2015, 74, 1347–1357. [Google Scholar] [CrossRef]
- Klugmann-Radziemska, E. Degradation of electrical performance of a crystalline photovoltaic module due to dust deposition in northern Poland. Renew. Energy 2015, 78, 418–426. [Google Scholar] [CrossRef]
- Rajput, P.; Tiwari, G.; Sastry, O.; Bora, B.; Sharma, V. Degradation of mono-crystalline photovoltaic modules after 22 years of outdoor exposure in the composite climate of India. Sol. Energy 2016, 135, 786–795. [Google Scholar] [CrossRef]
- Paudyal, B.R.; Shakya, S.R. Dust accumulation effects on efficiency of solar PV modules for off grid purpose: A case study of Kathmandu. Sol. Energy 2016, 135, 103–110. [Google Scholar] [CrossRef]
- Tanesab, J.; Parlevliet, D.; Whale, J.; Urmee, T. Dust effect and its economic analysis on PV modules deployed in a temperate climate zone. Energy Procedia 2016, 100, 65–68. [Google Scholar] [CrossRef]
- Kazem, H.A.; Chaichan, M.T. Experimental analysis of the effect of dust’s physical properties on photovoltaic modules in Northern Oman. Sol. Energy 2016, 139, 68–80. [Google Scholar] [CrossRef]
- Touati, F.; Al-Hitmi, M.; Chowdhury, N.A.; Hamad, J.A.; Gonzales, A.J.S.P. Investigation of solar PV performance under Doha weather using a customized measurement and monitoring system. Renew. Energy 2016, 89, 564–577. [Google Scholar] [CrossRef]
- Saidan, M.; Albaali, A.G.; Alasis, E.; Kaldellis, J.K. Experimental study on the effect of dust deposition on solar photovoltaic panels in desert environment. Renew. Energy 2016, 92, 499–505. [Google Scholar] [CrossRef]
- Olivares, D.; Ferrada, P.; de Matos, C.; Marzo, A.; Cabrera, E.; Portillo, C.; Llanos, J. Characterization of soiling on PV modules in the Atacama Desert. Energy Procedia 2017, 124, 547–553. [Google Scholar] [CrossRef]
- Guan, Y.; Zhang, H.; Xiao, B.; Zhou, Z.; Yan, X. In-situ investigation of the effect of dust deposition on the performance of polycrystalline silicon photovoltaic modules. Renew. Energy 2017, 101, 1273–1284. [Google Scholar] [CrossRef]
- Fraga, M.M.; de Oliveira Campos, B.L.; de Almeida, T.B.; da Fonseca, J.M.F.; Lins, V.d.F.C. Analysis of the soiling effect on the performance of photovoltaic modules on a soccer stadium in Minas Gerais, Brazil. Sol. Energy 2018, 163, 387–397. [Google Scholar] [CrossRef]
- Gholami, A.; Khazaee, I.; Eslami, S.; Zandi, M.; Akrami, E. Experimental investigation of dust deposition effects on photo-voltaic output performance. Sol. Energy 2018, 159, 346–352. [Google Scholar] [CrossRef]
- Ilse, K.K.; Figgis, B.W.; Werner, M.; Naumann, V.; Hagendorf, C.; Pöllmann, H.; Bagdahn, J. Comprehensive analysis of soiling and cementation processes on PV modules in Qatar. Sol. Energy Mater. Sol. Cells 2018, 186, 309–323. [Google Scholar] [CrossRef]
- Syafiq, A.; Pandey, A.; Adzman, N.; Abd Rahim, N. Advances in approaches and methods for self-cleaning of solar photovoltaic panels. Sol. Energy 2018, 162, 597–619. [Google Scholar] [CrossRef]
- Jiang, Y.; Lu, L.; Lu, H. A novel model to estimate the cleaning frequency for dirty solar photovoltaic (PV) modules in desert environment. Sol. Energy 2016, 140, 236–240. [Google Scholar] [CrossRef]
- Gholami, A.; Alemrajabi, A.A.; Saboonchi, A. Experimental study of self-cleaning property of titanium dioxide and nanospray coatings in solar applications. Sol. Energy 2017, 157, 559–565. [Google Scholar] [CrossRef]
- Kawamoto, H.; Guo, B. Improvement of an electrostatic cleaning system for removal of dust from solar panels. J. Electrost. 2018, 91, 28–33. [Google Scholar] [CrossRef]
- Bake, A.; Merah, N.; Matin, A.; Gondal, M.; Qahtan, T.; Abu-Dheir, N. Preparation of transparent and robust superhydrophobic surfaces for self-cleaning applications. Prog. Org. Coat. 2018, 122, 170–179. [Google Scholar] [CrossRef]
- Sueto, T.; Ota, Y.; Nishioka, K. Suppression of dust adhesion on a concentrator photovoltaic module using an anti-soiling photocatalytic coating. Sol. Energy 2013, 97, 414–417. [Google Scholar] [CrossRef]
- Adak, D.; Ghosh, S.; Chakrabarty, P.; Mondal, A.; Saha, H.; Mukherjee, R.; Bhattacharyya, R. Self-cleaning V-TiO2: SiO2 thin-film coatings with enhanced transmission for solar glass cover and related applications. Sol. Energy 2017, 155, 410–418. [Google Scholar] [CrossRef]
- de Jesus, M.A.M.L.; Timò, G.; Agustín-Sáenz, C.; Braceras, I.; Cornelli, M.; de Mello Ferreira, A. Anti-soiling coatings for solar cell cover glass: Climate and surface properties influence. Sol. Energy Mater. Sol. Cells 2018, 185, 517–523. [Google Scholar] [CrossRef]
- Bhaduri, S.; Farkade, M.; Bajhal, R.; Mallick, S.; Shiradkar, N.; Kottantharayil, A. Abrasion resistance of spray coated anti-soiling coatings during waterless cleaning of PV modules. Mater. Today Commun. 2023, 35, 106168. [Google Scholar] [CrossRef]
- Khan, M.Z.; Ghaffar, A.; Bahattab, M.A.; Mirza, M.; Lange, K.; Abaalkheel, I.M.S.; Alqahtani, M.H.M.; Aldhuwaile, A.A.A.; Alqahtani, S.H.; Qasem, H. Outdoor performance of anti-soiling coatings in various climates of Saudi Arabia. Sol. Energy Mater. Sol. Cells 2022, 235, 111470. [Google Scholar] [CrossRef]
- Hossain, M.I.; Ali, A.; Bermudez Benito, V.; Figgis, B.; Aïssa, B. Anti-soiling coatings for enhancement of PV panel performance in desert environment: A critical review and market overview. Materials 2022, 15, 7139. [Google Scholar] [CrossRef]
- Wang, J.; Li, K.; Zhang, J.; Feng, J. Transparent and superhydrophobic FHA/SiO2 coatings with obvious anti-soiling performance for photovoltaic modules. Prog. Org. Coat. 2023, 183, 107679. [Google Scholar] [CrossRef]
- Saeidpour, S.; Khoshnevisan, B.; Boroumand, Z.; Ahmady, N. Effect of electrode design and dust particle size on electrodynamics dust shield procedure. Phys. Open 2023, 14, 100131. [Google Scholar] [CrossRef]
- Nomeir, B.; Lakhouil, S.; Boukheir, S.; Ali, M.A.; Naamane, S. Recent progress on transparent and self-cleaning surfaces by superhydrophobic coatings deposition to optimize the cleaning process of solar panels. Sol. Energy Mater. Sol. Cells 2023, 257, 112347. [Google Scholar] [CrossRef]
- Sayyah, A.; Crowell, D.R.; Raychowdhury, A.; Horenstein, M.N.; Mazumder, M.K. An experimental study on the characterization of electric charge in electrostatic dust removal. J. Electrost. 2017, 87, 173–179. [Google Scholar] [CrossRef]
- Chesnutt, J.K.; Ashkanani, H.; Guo, B.; Wu, C.-Y. Simulation of microscale particle interactions for optimization of an electrodynamic dust shield to clean desert dust from solar panels. Sol. Energy 2017, 155, 1197–1207. [Google Scholar] [CrossRef]
- Guo, B.; Javed, W.; Pett, C.; Wu, C.-Y.; Scheffe, J.R. Electrodynamic dust shield performance under simulated operating conditions for solar energy applications. Sol. Energy Mater. Sol. Cells 2018, 185, 80–85. [Google Scholar] [CrossRef]
- Patel, S.; Veerasamy, V.; John, J.S.; Orlov, A. A comprehensive review on dust removal using electrodynamic shield: Mechanism, influencing factors, performance, and progress. Renew. Sustain. Energy Rev. 2023, 183, 113471. [Google Scholar] [CrossRef]
- Costa, S.C.; Diniz, A.S.A.; Kazmerski, L.L. Dust and soiling issues and impacts relating to solar energy systems: Literature review update for 2012–2015. Renew. Sustain. Energy Rev. 2016, 63, 33–61. [Google Scholar] [CrossRef]
- Kumar, N.M.; Sudhakar, K.; Samykano, M.; Sukumaran, S. Dust cleaning robots (DCR) for BIPV and BAPV solar power plants-A conceptual framework and research challenges. Procedia Comput. Sci. 2018, 133, 746–754. [Google Scholar] [CrossRef]
- Zainuddin, N.; Abdullah, M.N. Development of Solar Panel Cleaning Robot for Residential Sector. Evol. Electr. Electron. Eng. 2023, 4, 606–614. [Google Scholar]
- Parrott, B.; Zanini, P.C.; Shehri, A.; Kotsovos, K.; Gereige, I. Automated, robotic dry-cleaning of solar panels in Thuwal, Saudi Arabia using a silicone rubber brush. Sol. Energy 2018, 171, 526–533. [Google Scholar] [CrossRef]
- Amin, A.; Wang, X.; Alroichdi, A.; Ibrahim, A. Designing and Manufacturing a Robot for Dry-Cleaning PV Solar Panels. Int. J. Energy Res. 2023, 2023, 7231554. [Google Scholar] [CrossRef]
- Yang, J.; Zhao, X.; Gao, Y.; Guo, R.; Zhao, J. Research on Mechanism Design and Kinematic Characteristics of Self-Propelled Photovoltaic Cleaning Robot. Appl. Sci. 2023, 13, 6967. [Google Scholar] [CrossRef]
- Figgis, B.; Bermudez, V.; Garcia, J.L. PV module vibration by robotic cleaning. Sol. Energy 2023, 250, 168–172. [Google Scholar] [CrossRef]
- Costa, S.C.; Diniz, A.S.A.; Kazmerski, L.L. Solar energy dust and soiling R&D progress: Literature review update for 2016. Renew. Sustain. Energy Rev. 2018, 82, 2504–2536. [Google Scholar] [CrossRef]
- Song, Z.; Liu, J.; Yang, H. Air pollution and soiling implications for solar photovoltaic power generation: A comprehensive review. Appl. Energy 2021, 298, 117247. [Google Scholar] [CrossRef]
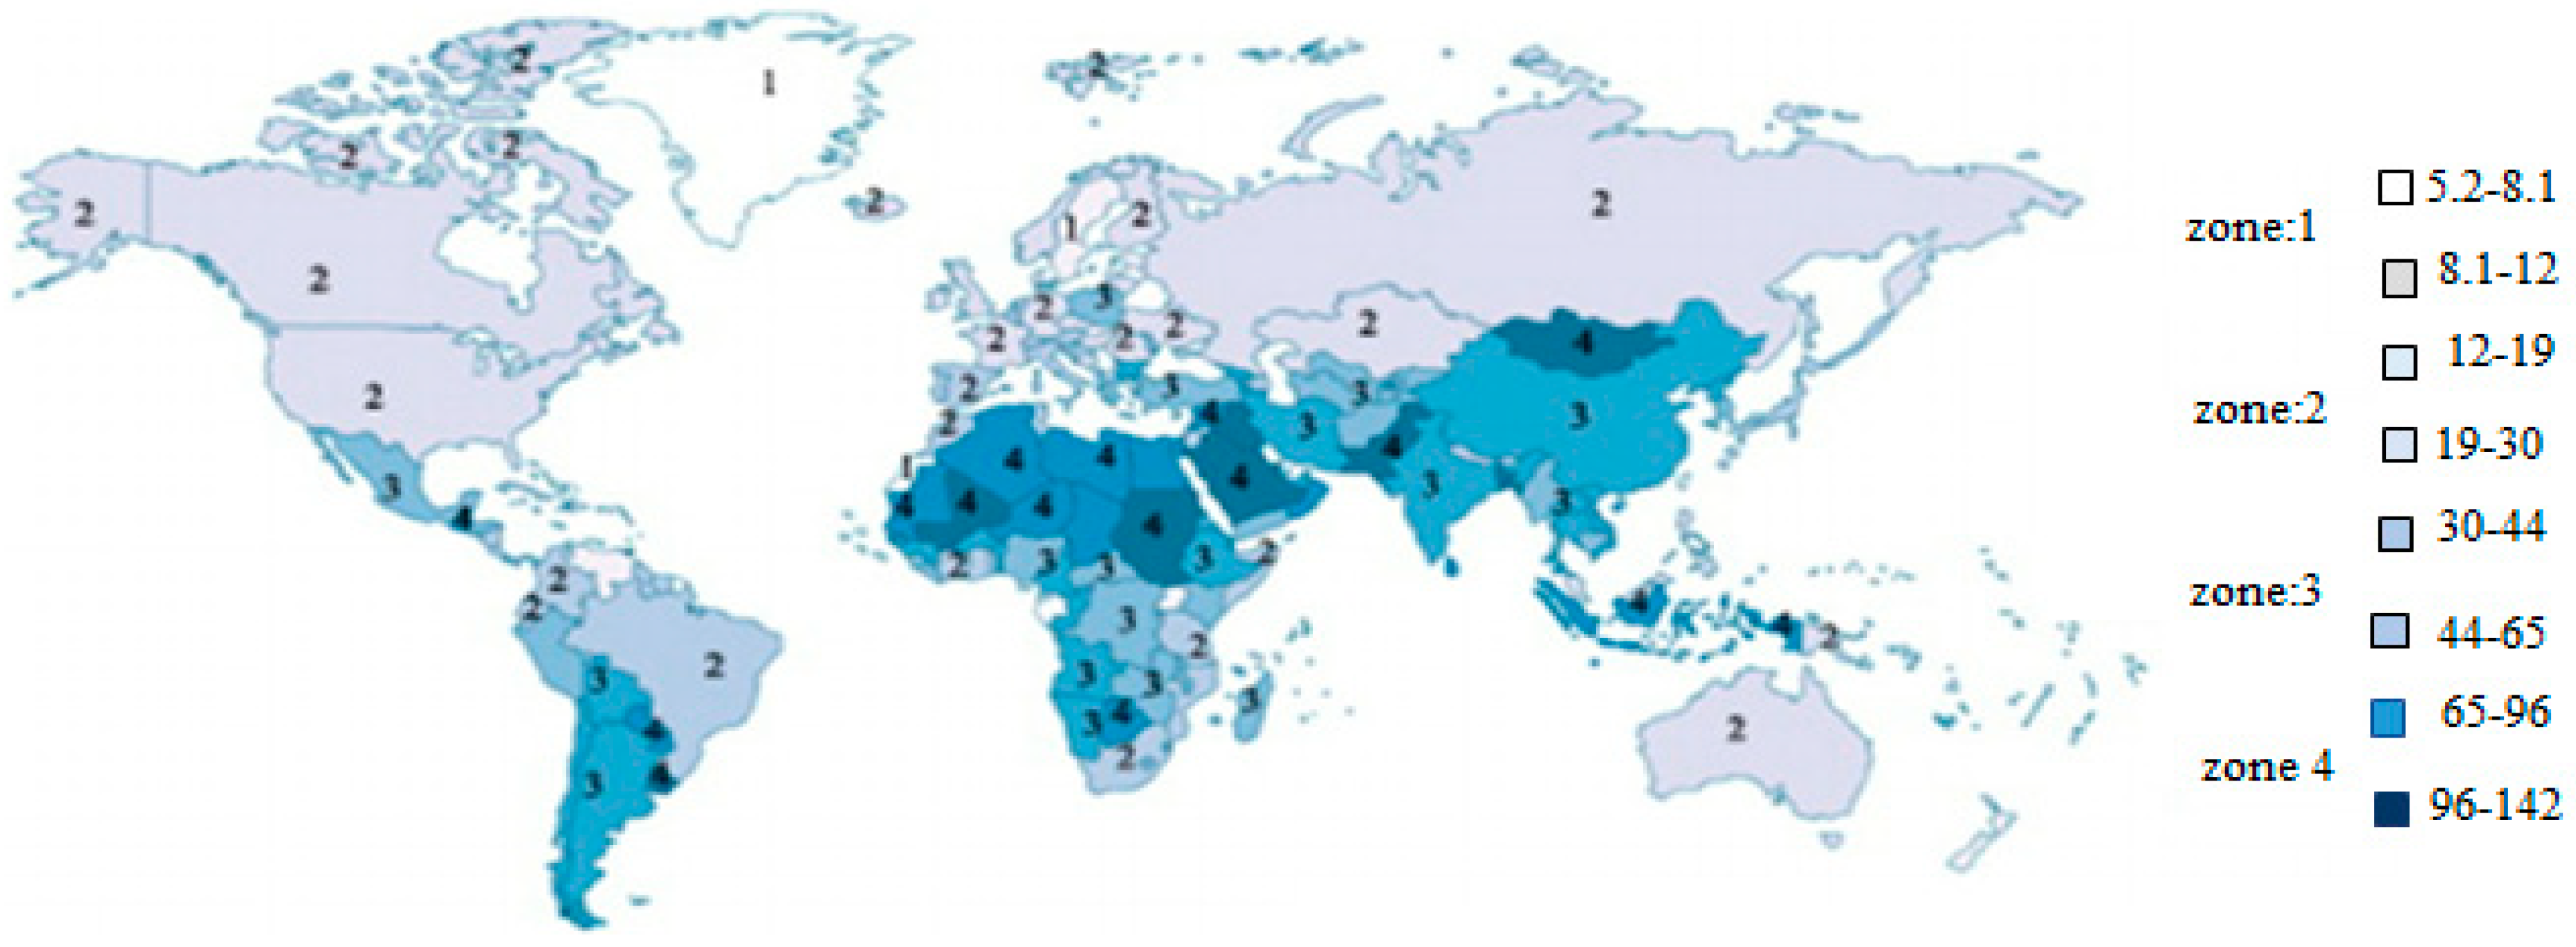
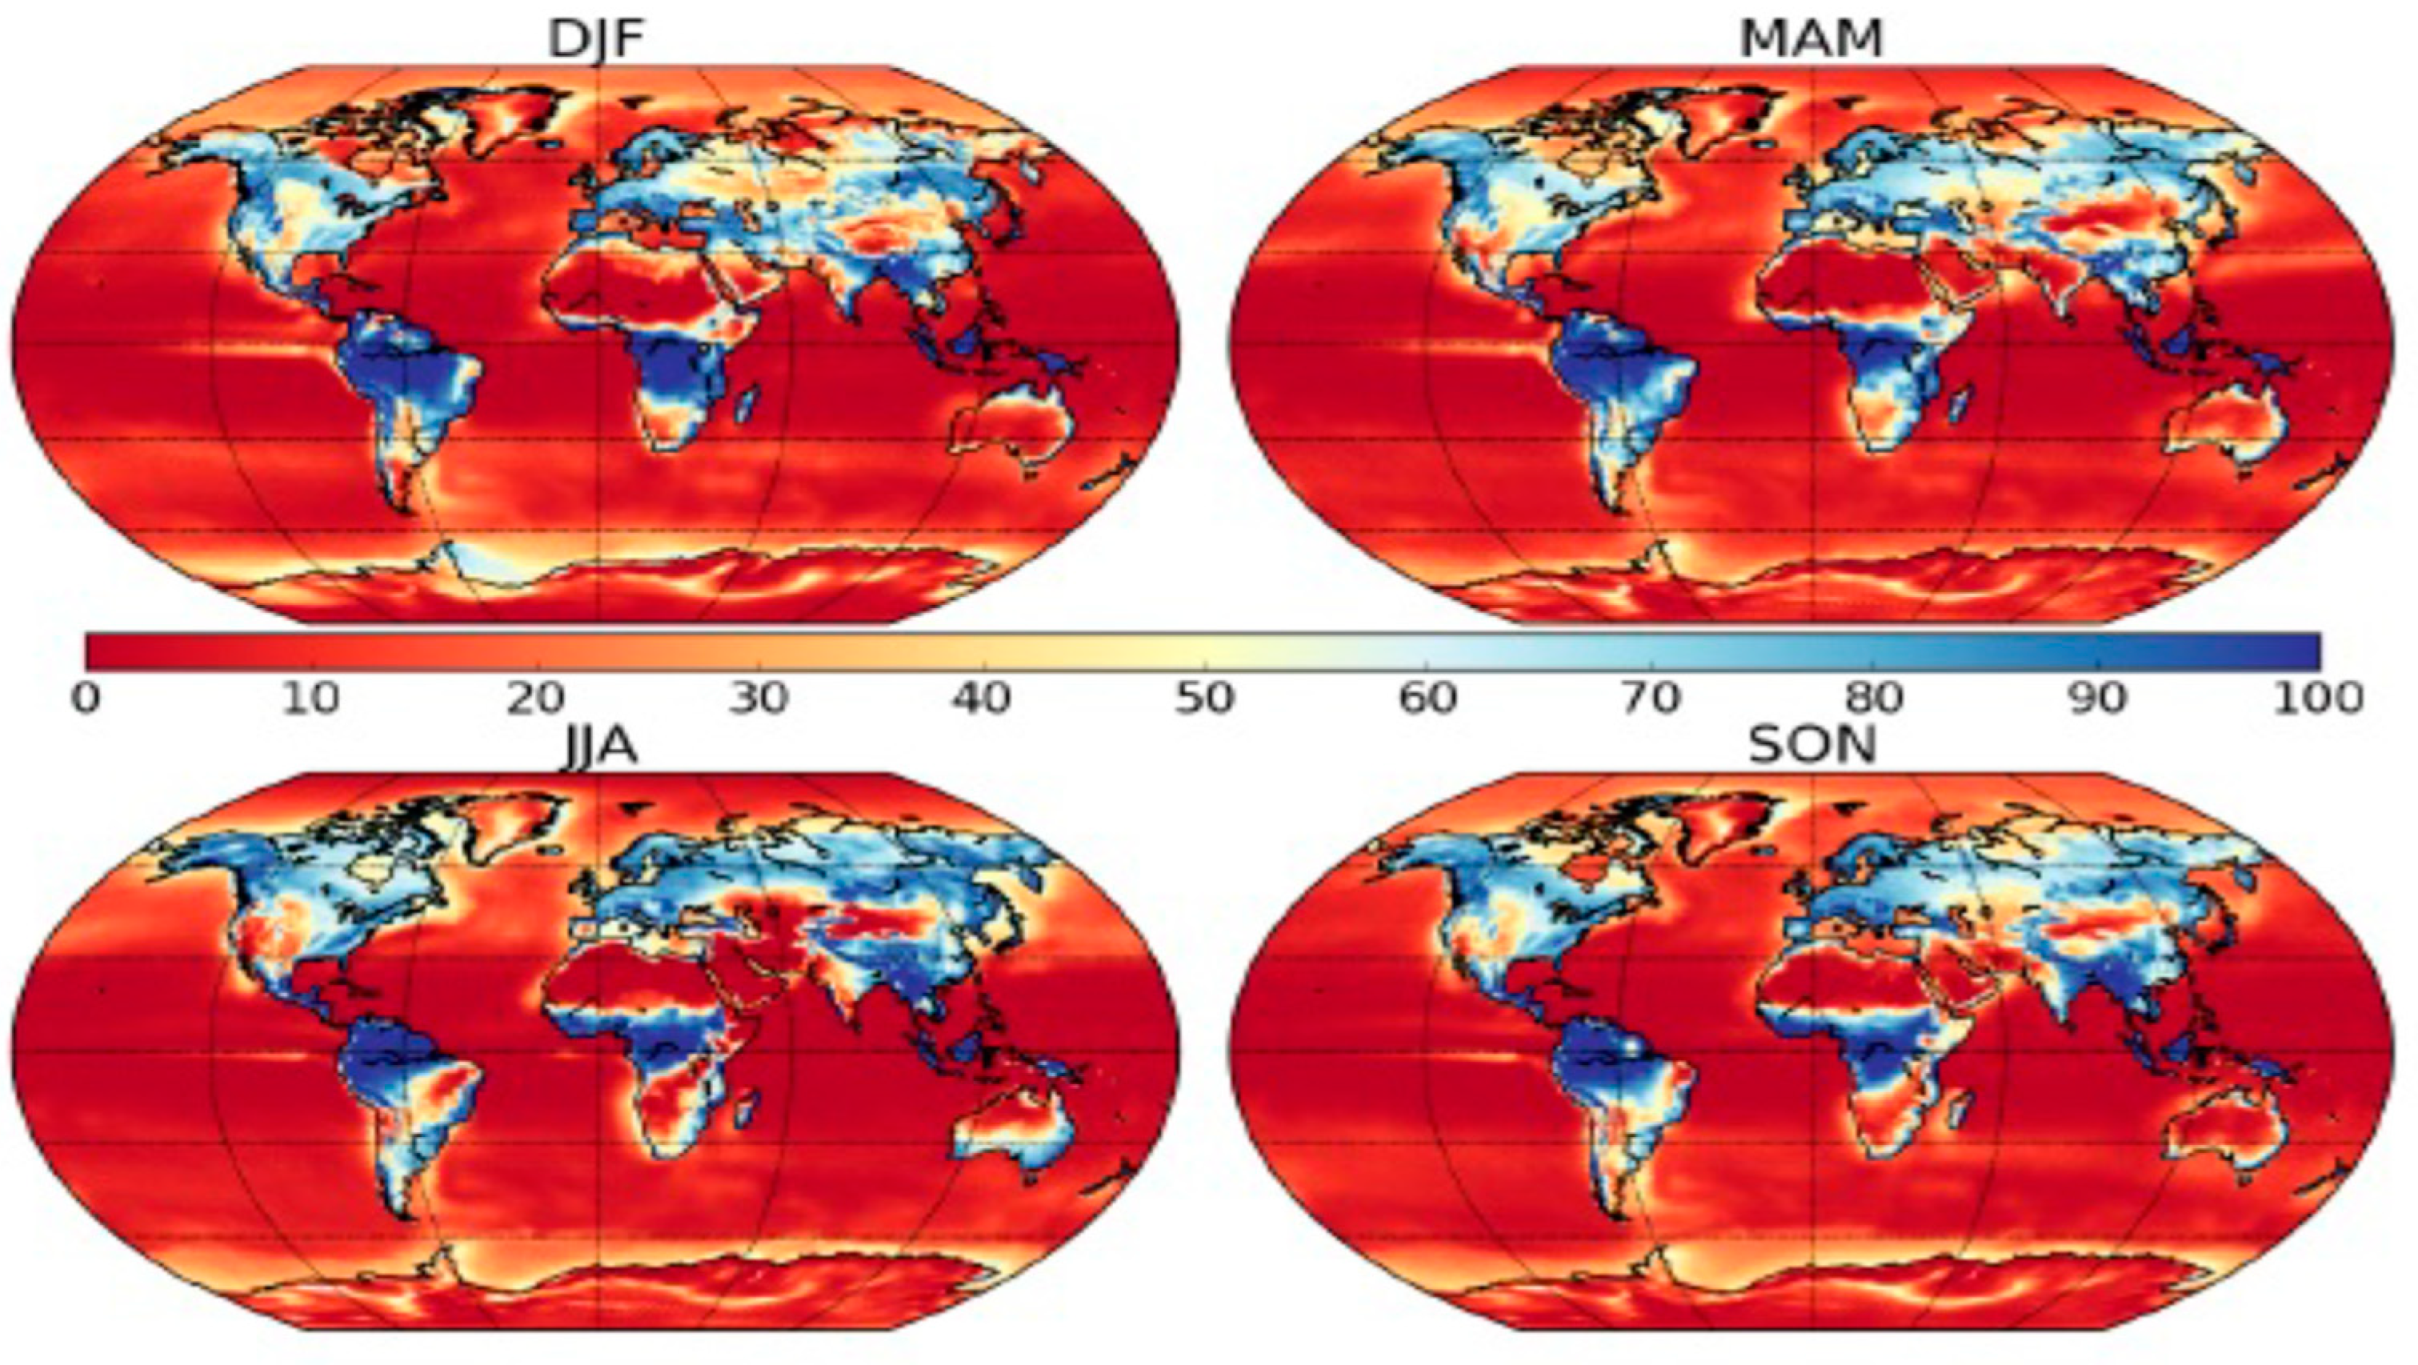
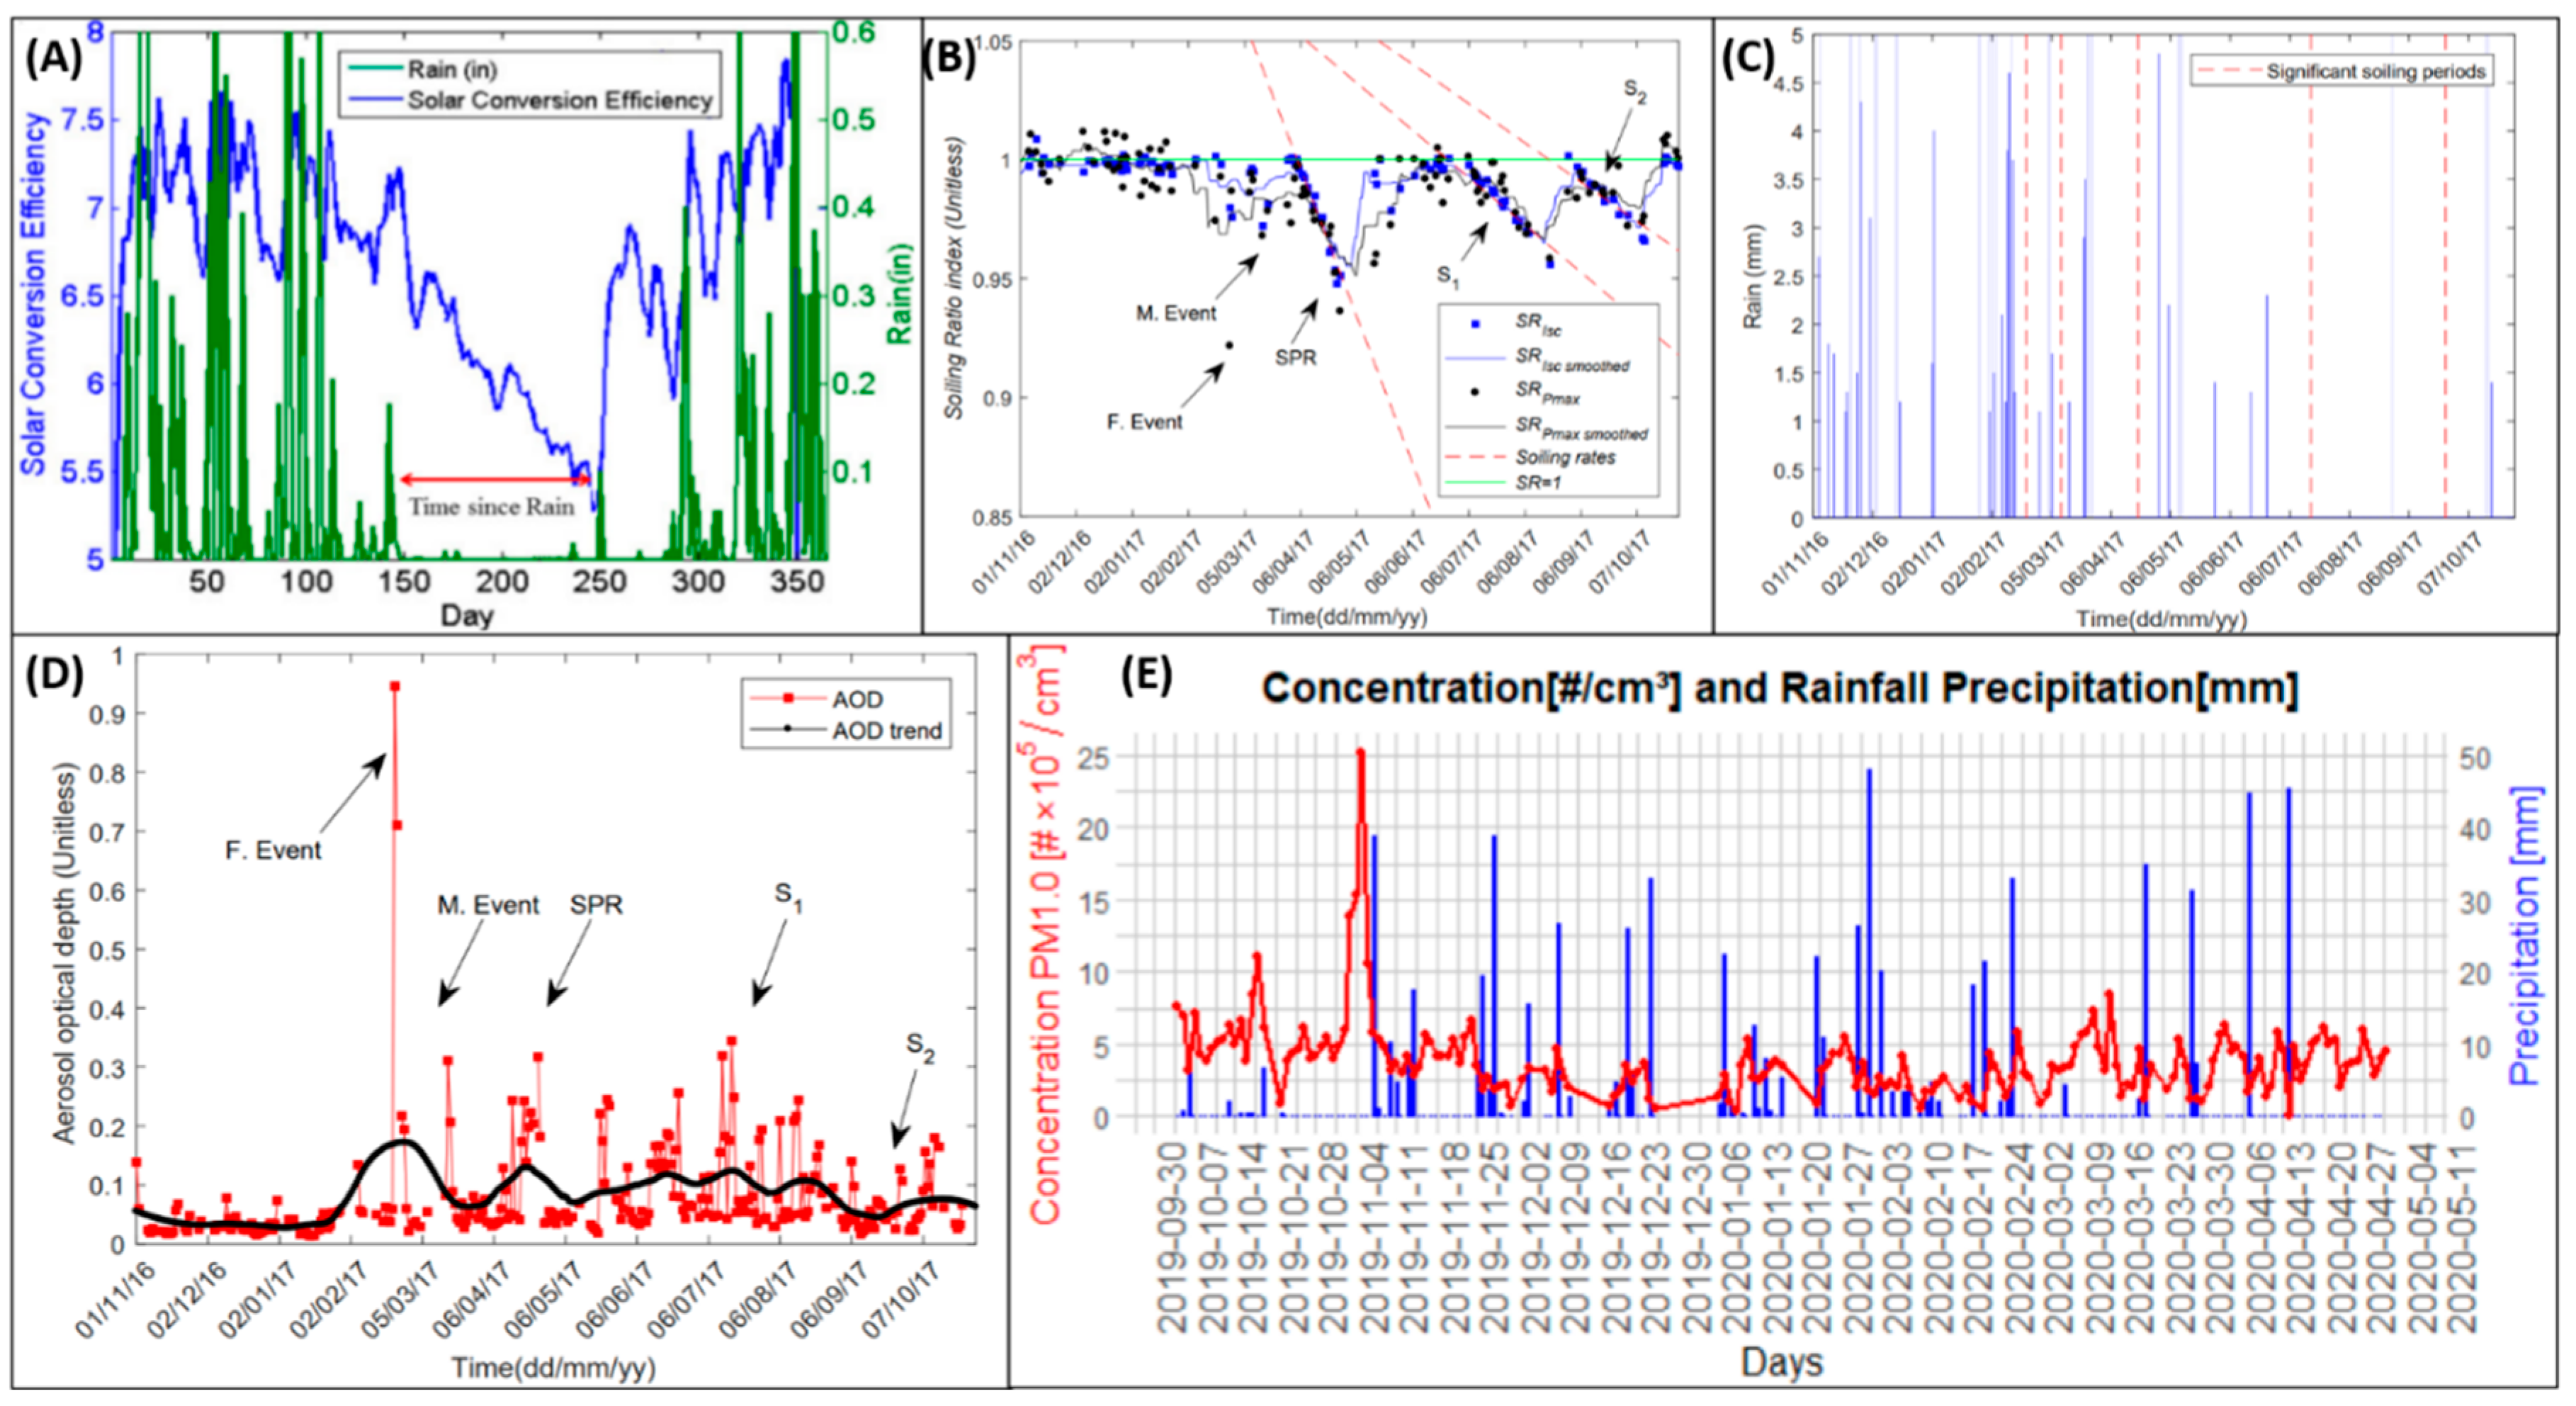
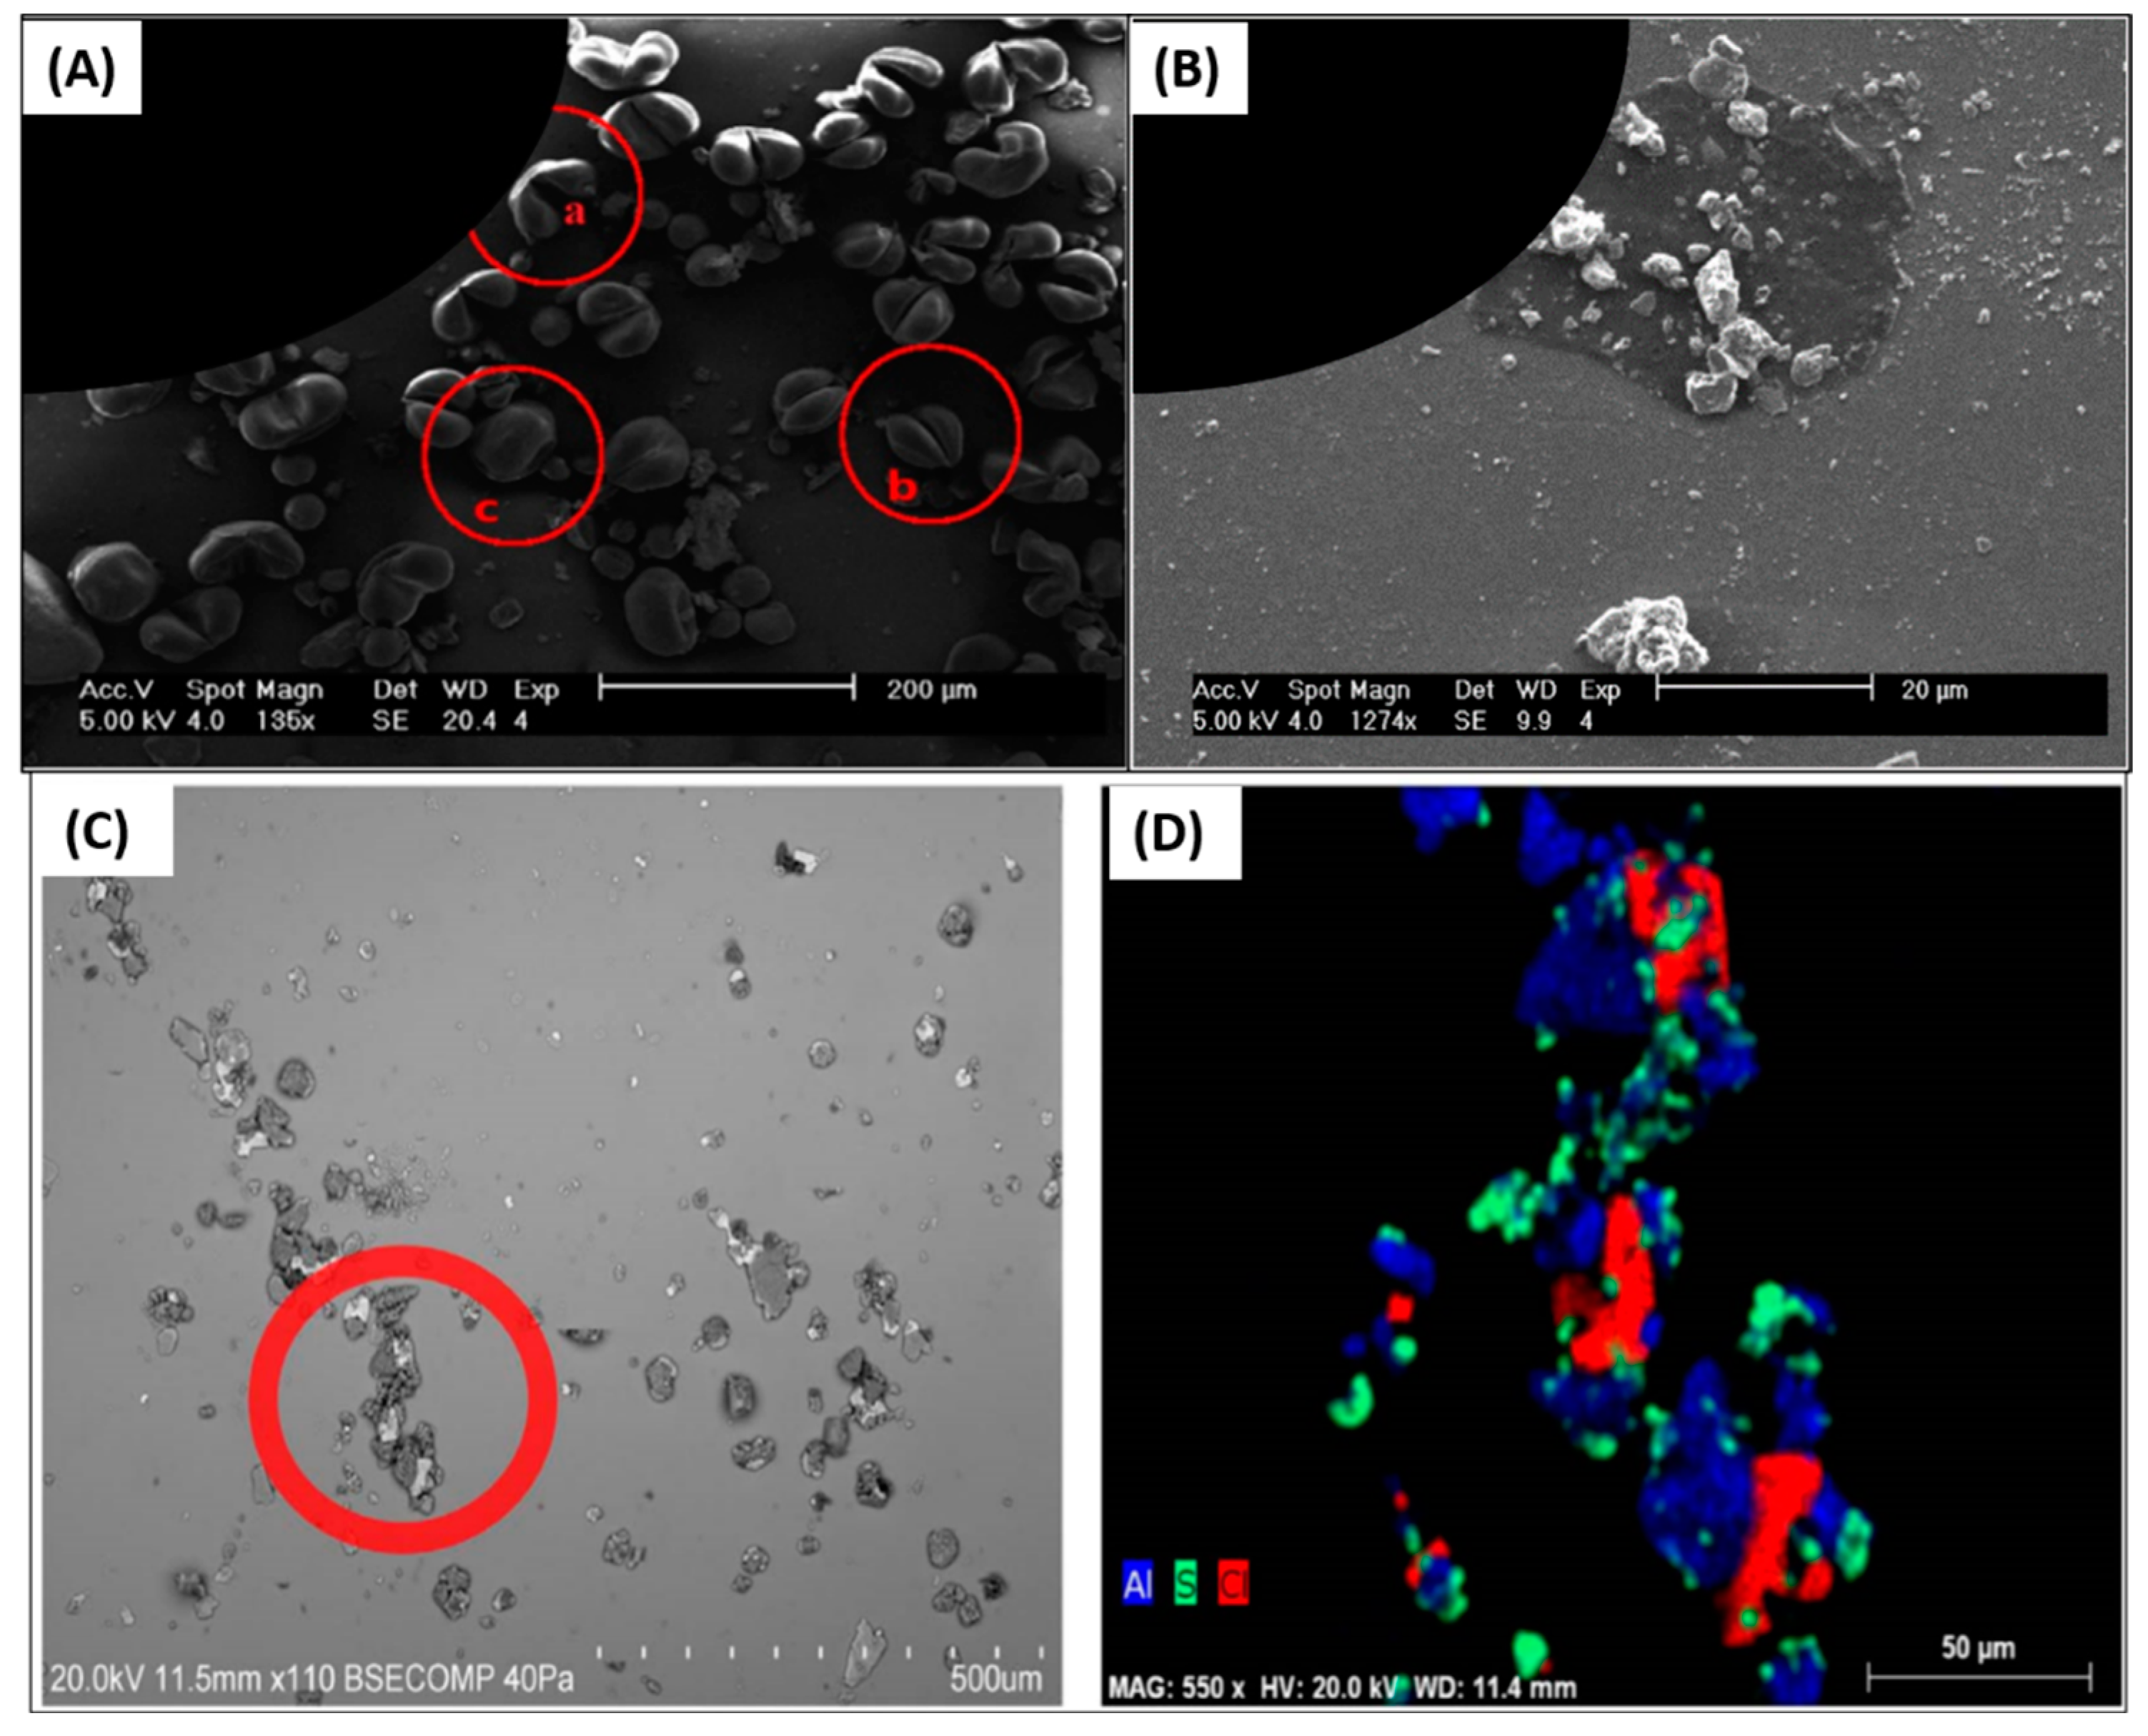

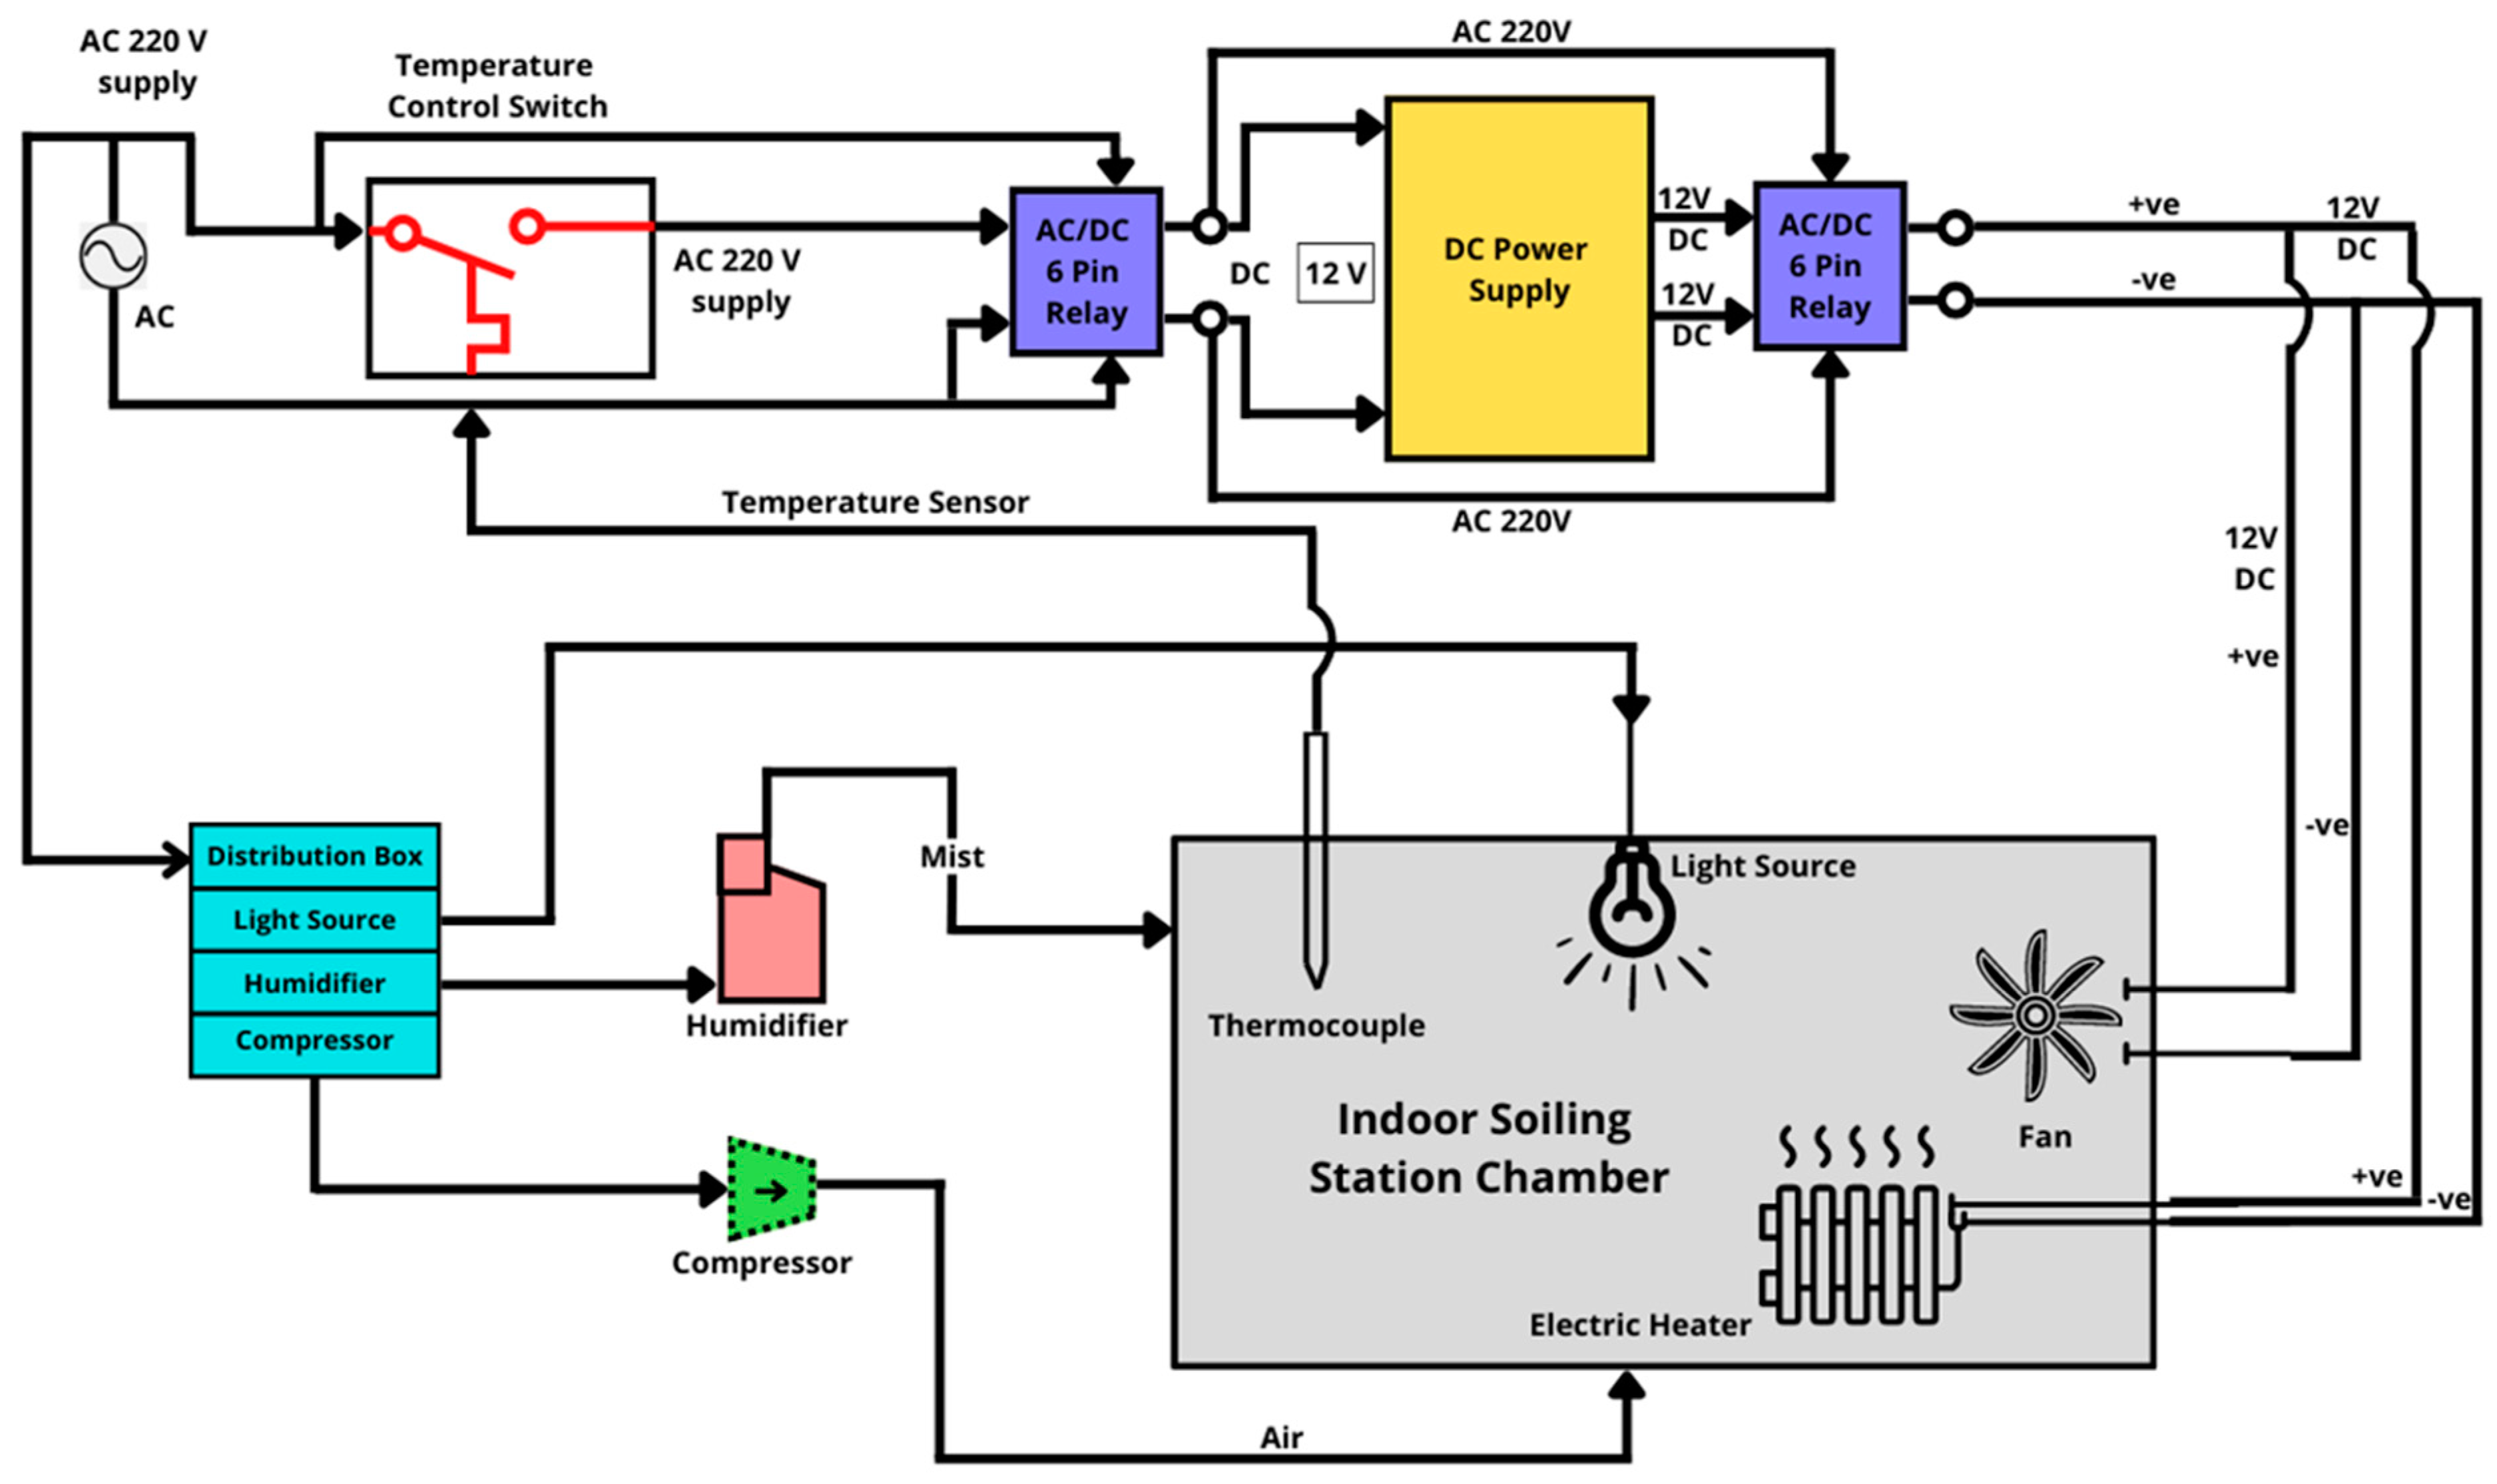
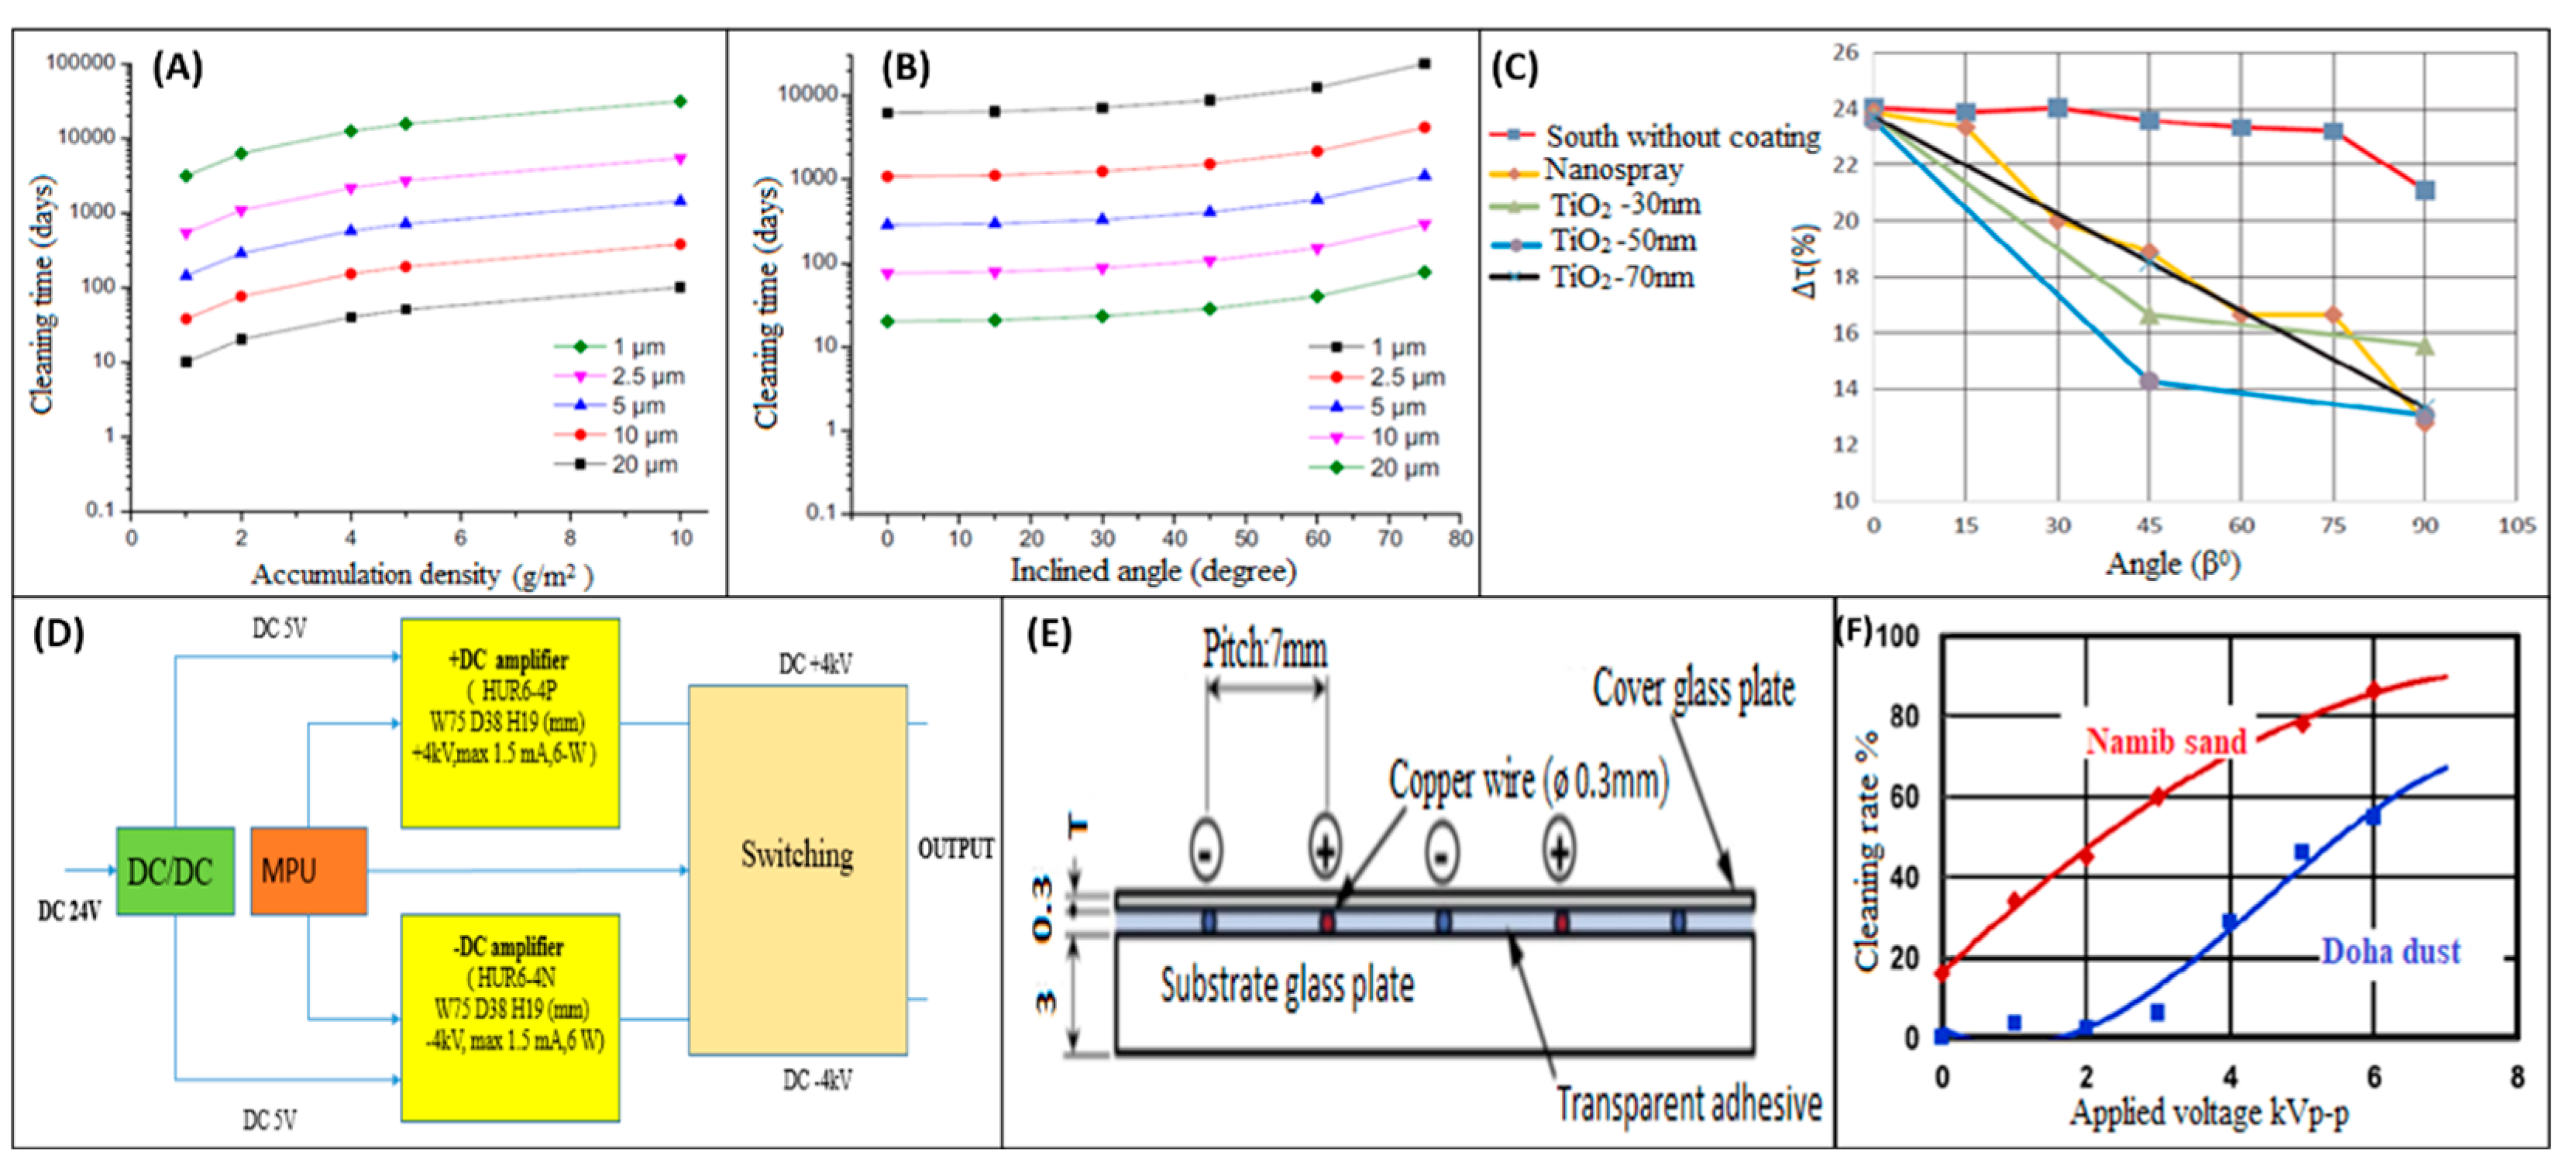
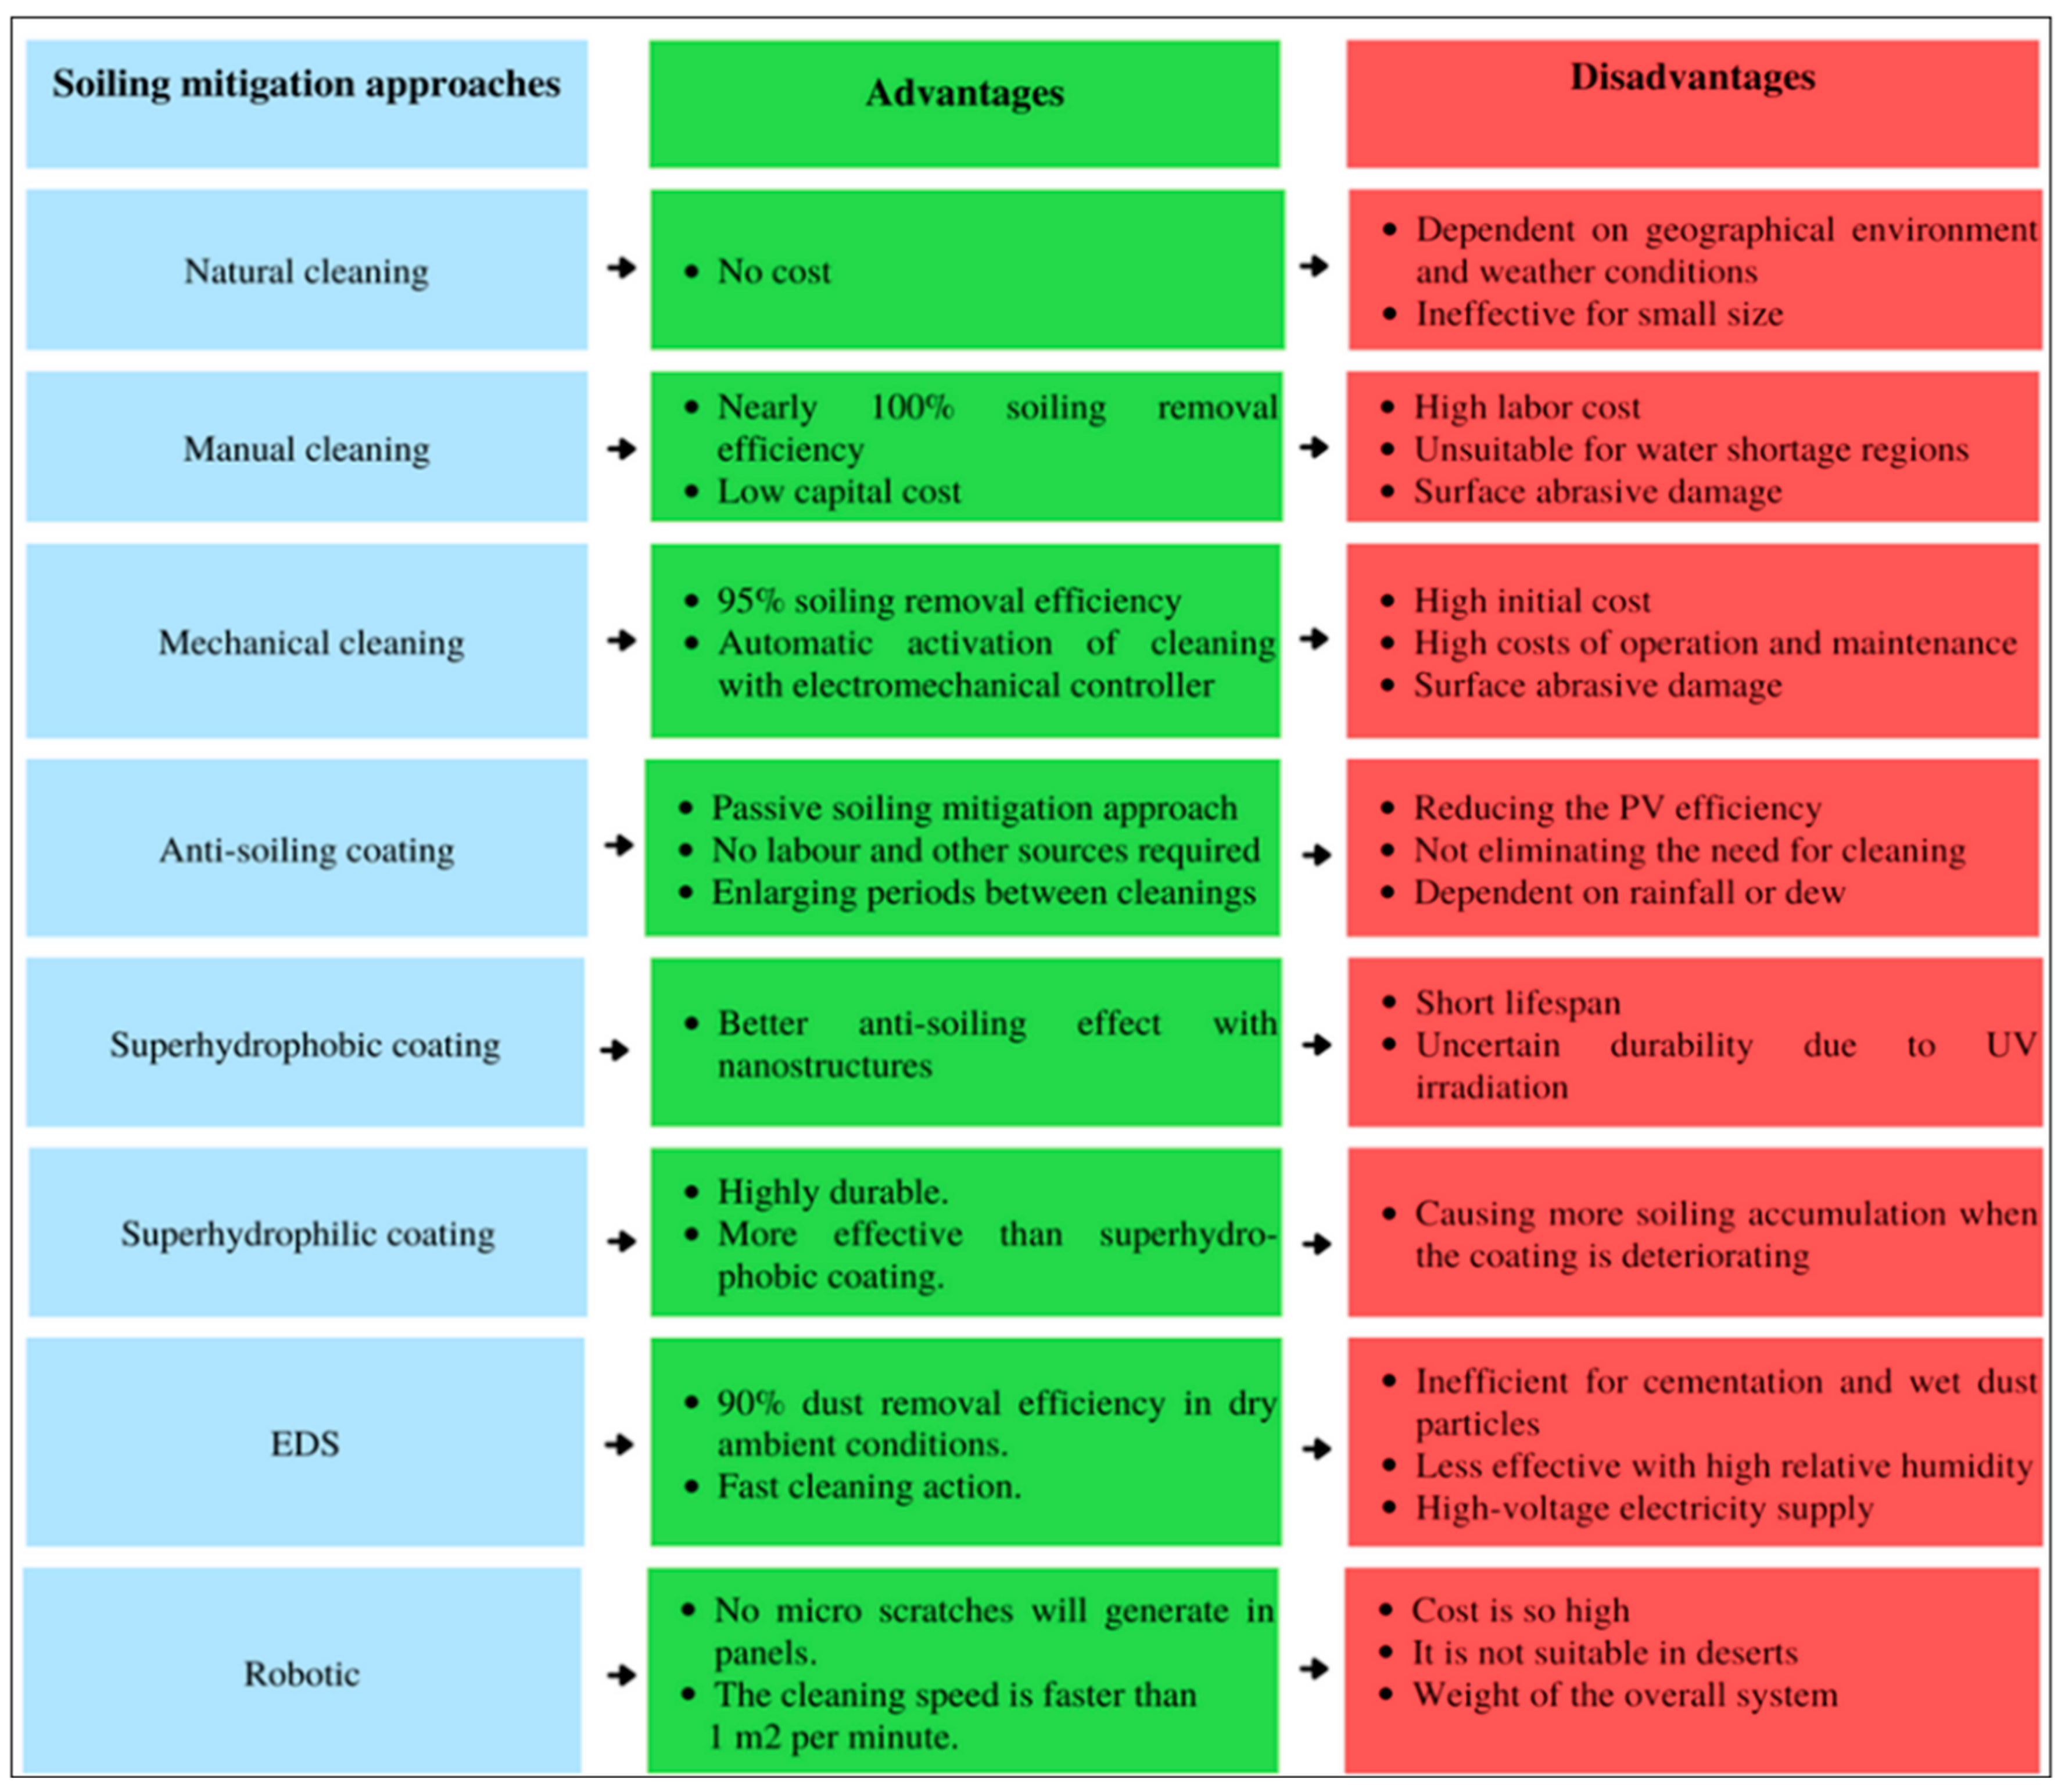
Disclaimer/Publisher’s Note: The statements, opinions and data contained in all publications are solely those of the individual author(s) and contributor(s) and not of MDPI and/or the editor(s). MDPI and/or the editor(s) disclaim responsibility for any injury to people or property resulting from any ideas, methods, instructions or products referred to in the content. |
© 2023 by the authors. Licensee MDPI, Basel, Switzerland. This article is an open access article distributed under the terms and conditions of the Creative Commons Attribution (CC BY) license (https://creativecommons.org/licenses/by/4.0/).