Abstract
In this paper, we analyze the relationship between the Chinese government’s Strategic Emerging Industry Support Program and the innovation level of strategic emerging industry firms. We use panel data of A-share-listed firms from 2007 to 2017 and apply a difference-in-difference model. We obtain evidence that firms exhibit strategic innovation behavior in response to the Strategic Emerging Industry Support Program, as evidenced by firms focusing solely on increasing their research and development (R&D) input and number of patent outputs, neglecting innovation efficiency and quality, and failing to convert patent results into firm profitability. Moreover, we observe that the aforementioned support program, through the provision of subsidies, tax incentives, and easy access to credit, as well as the reduction in stock liquidity, prompts increases in firm R&D input and, consequently, the number of patents firms are granted. Our results also indicate that for state-owned enterprises in strategic emerging industries, government support in the form of subsidies and tax incentives has the strongest effect on innovation; by contrast, for private firms, innovation is more strongly stimulated through convenient credit support, tax incentives, and reduced stock liquidity. This paper provides empirical evidence on whether industrial policy promotes firm innovation and argues more generally whether government industrial policy is effective.
1. Introduction
Innovation is a key driver of firm performance. Innovation is also a major factor in the profitability of industries and the economic prosperity of countries (Schettino et al., 2013) [1]. Innovation enables firms to distinguish themselves and remain competitive in a complex international environment, which benefits both the firm itself and the country as a whole. In the context of the international division of labor, China is in a difficult position at the low end of the industrial chain; to overcome this and improve the country’s international competitiveness, the Chinese government has proposed a Strategic Emerging Industry Support Program to drive industrial upgrading. The most crucial factor in industrial upgrading is developing an ability to consistently innovate to overcome technological bottlenecks caused by weak development of basic disciplines and immature existing technologies. Therefore, in this paper, we investigate the impact of China’s Strategic Emerging Industry Support Program on enterprise innovation to provide the international community with empirical evidence of the impact of industrial policy on enterprise innovation in a developing country.
China defines strategic emerging industries as next-generation information technology, high-end equipment manufacturing, new material, biotechnology, new-energy vehicles, new energy, energy conservation and environmental protection, digital creative, and related service industries and other industries. On 8 September 2010, China’s State Council issued the “State Council Decision on Accelerating the Cultivation and Development of Strategic Emerging Industries” action plan and introduced several supporting policies to promote industrial upgrading and facilitate industrial transformation in China (Wang and Sawur, 2022) [2].
From the perspective of the research direction of strategic emerging industries, the impact of government subsidies on R&D and innovation of enterprises in strategic emerging industries, the impact of tax incentives on R&D and innovation of enterprises in strategic emerging industries, and the existence of overcapacity in strategic emerging industries have been studied in the past (Lu et al., 2014; Yu and Lv, 2015; Wu, 2017; Xia et al., 2022) [3,4,5,6]. Although the conclusions of these studies are that government subsidies promote R&D and innovation of enterprises in strategic emerging industries, and tax incentives promote R&D and innovation in such industries, such studies tend to be based on quantitative analysis of sample data of strategic emerging industries, and the conclusions reached are only specific cases of government subsidies and tax incentives on enterprise innovation, and it is not possible to draw conclusions on the effectiveness of industrial support policies. At the same time, the estimation results may be endogenous, the conclusions drawn may not be objective, and these studies do not address innovation efficiency and innovation quality. Another strand of the literature, similar to the main body of this paper, is on the question of whether industrial policy is efficient. There is no consensus on whether industrial policy is effective. According to neoclassical economic theory, government intervention through policy can effectively alleviate economic market failures caused by market forces such as externalities, information asymmetry, monopoly, etc., and, therefore, industrial policy is useful to some extent; however, the neoliberal Hayek argued that new technologies and innovations are unpredictable, and in such a situation, the government’s industrial policy may not achieve the desired results and may even distort the market, thus limiting the effectiveness of the policy.
Therefore, it is innovative for this paper to examine whether the support policies for strategic emerging industries induce strategic emerging enterprises to increase R&D investment and innovation output and improve innovation efficiency and innovation quality based on previous studies.
With reference to the aforementioned literature, we systematically assess the development of strategic emerging industries in China by considering the introduction of the Strategic Emerging Industry Support Program to be an exogenous shock and using the difference-in-difference method and A-share data of Chinese listed companies. This work contributes to the literature by (i) providing the international community with empirical evidence of state industrial intervention, with China used as a case study; (ii) systematically assessing the current state of the development of strategic emerging industries and evaluating the effect of the Strategic Emerging Industry Support Program as an industrial policy; and (iii) innovatively identifying strategic innovation in Chinese strategic emerging industry firms. Strategic innovation is an inefficient form of innovation in which firms respond to government regulations with a focus on the quantity of R&D expenditure and patent output rather than innovation efficiency and quality. In this model, innovation is evaluated at the quantitative level, and the results of innovation do not influence the firm’s performance or improve its profitability.
The remainder of the paper is organized as follows. In Section 2, we review the literature related to the subject of the study. In Section 3, we present the hypotheses to be tested, and in Section 4, we describe the data and methods used in the work. In Section 5, we present and discuss the results, and in Section 6, we provide some conclusions.
2. Theoretical Background
The Strategic Emerging Industry Support Program is a key industrial policy proposed by the Chinese government (Su et al., 2023) [7]. Industrial policy is a decision-making and implementation mechanism in which government agents collect and process information and then output information and instructions to enterprises and markets (Farla, 2015) [8]. According to neoclassical economic theory, government intervention through policies can effectively mitigate market failures in the economy resulting from market forces such as externalities, information asymmetries, and monopolies. On the basis of their own investigations of the current situation of regional industrial development and forecasts regarding the trend of industrial structure changes, relevant government agencies issue targeted signals or planning instructions to specific industries according to the macroeconomic development of the region; in this manner, the allocation of resources among and within industrial sectors can be adjusted, and transformation of the industrial scale and structure of a certain target state can be achieved. However, the neoliberal Hayek holds that new technologies and innovations are unpredictable; in this context, the government’s industrial policy might not achieve the desired effect and could even distort the market, thus limiting the effectiveness of said policy.
As a key industrial policy to transform China’s economic development, the Strategic Emerging Industry Support Program was formally introduced in September 2010, and after 2012, this support program was included in the 12th Five-Year Plan, indicating that the Strategic Emerging Industry Support Program has become a top priority for China’s future development. The specific initiatives of the support plan for strategic emerging industries include setting up special funds for industrial development, providing government subsidies and tax concessions to strategic emerging industries, stimulating financial institutions to increase credit support, encouraging the capital market to play a multilevel financing role, and vigorously developing venture capital and equity investment funds (Hou et al., 2019) [9]. Under this program, government support is provided for strategic emerging industry enterprises. For example, Bai and Li (2011) [10], based on data from Chinese medium and large industrial enterprises, use a stochastic frontier model to study the impact of government R&D subsidies on firms’ technological innovation; they report that government subsidies enhance the efficiency of firms’ technological innovation, and the increase in firms’ own R&D investment facilitates further utilization of government subsidies. The introduction of policies for strategic emerging industries will provide government subsidies and tax incentives to specific enterprises, which will help increase R&D investment by enterprises and promote innovation.
Although the aforementioned studies conclude that government subsidies or tax incentives can promote firm R&D, whether government subsidies or tax incentives can prompt innovation output and the achievement of innovation efficiency and quality improvement remains unclear. The Strategic Emerging Industry Support Program includes not only government subsidies and tax incentives but also financial support to reduce enterprises’ financing constraints; therefore, no consensus has been reached on how to evaluate the effect of this program. With reference to the aforementioned studies, we conduct a systematic evaluation of the Strategic Emerging Industry Support Program to determine whether this industrial policy has promoted the innovation level of enterprises and to analyze the channels through which this policy functions.
3. Hypotheses
Government subsidies and tax incentives are fundamental elements of strategic new-industry support programs. Government subsidies can be regarded as a redundant resource that can enhance the risk-taking ability of enterprises and thus help them to innovate and develop (Nohria and Gulati, 1996; Hu et al., 2023) [11,12]. The Strategic Emerging Industry Support Program is an industrial support policy that allows for the provision of tax benefits and government subsidies to strategic emerging industry enterprises, and these forms of support act as a redundant resource that increases the book assets of enterprises, enhances their risk-taking capacity, and motivates them to engage in technological innovation (Lu et al., 2014; Li and Zheng, 2016; Lee and Beom, 2010; Bronzini and Iachini, 2014; Huergo and Moreno, 2017) [3,13,14,15,16].
Government subsidies can serve as indications of institutional legitimacy (Wu and Liu, 2011; Feldman and Kelly, 2006) [17,18]. Not all firms have access to government subsidies, and for those that do, such subsidies imply a link between the firm and the government; that is, the firm has special support from the government (Guo et al., 2016) [19]. This potentially increases the firm’s access to credit in the capital market and reduces the firm’s financing constraints, which ultimately improves the firm’s ability to innovate (Garcia-Macia et al., 2019; Wang et al., 2019; Chundakkadan and Sasidharan, 2023) [20,21,22]. The Strategic Emerging Industry Support Program may also prompt investors to have positive expectations for companies in strategic emerging industries and be more bullish on the company’s stock in the long term; they thus avoid selling the company’s stock, which may limit the ability of other investors to buy the stock and reduce stock liquidity. Fang and Tian (2014) report that stock liquidity has a positive relationship with short-term speculative pressure and the threat of a hostile takeover [23]. Moreover, because the wealth of major shareholders and management is often tied to shareholdings, share prices, and option incentives, excessive stock liquidity can be damaging to these stakeholders, leading managers to adopt short-sighted management behavior that focuses on short-term operations at the expense of long-term innovation.
The preceding analysis suggests that the Strategic Emerging Industry Support Program, by providing government subsidies, tax incentives, and credit support, as well as reducing stock liquidity, can increase firm innovation R&D (Zúñiga-Vicente et al., 2012) [24]. However, high-quality innovation is a long-term process that depends on national science and technology capabilities and the robustness of basic academic disciplines. Whether direct incentives and capital injections can promote the innovation quality of enterprises remains unclear. Therefore, the following hypotheses are proposed in this paper:
Hypothesis 1.
The Strategic Emerging Industry Support Program stimulates enterprises’ R&D investment and innovation output.
Hypothesis 2.
The Strategic Emerging Industry Support Program stimulates R&D investment and innovation output by providing government subsidies, tax incentives, and credit support and by reducing the stock liquidity of enterprises.
Moreover, when receiving support from programs, state-owned enterprises (SOEs) and private enterprises exhibit distinct responses in terms of enterprise R&D and innovation. Scholars investigate the effects of government subsidies on various strategic emerging industries, with some concluding that government subsidies have a greater incentive effect on innovative R&D in private enterprises than in SOEs (Bronzini and Piselli, 2016; Yang et al., 2015; Jeong et al., 2021) [25,26,27], although the effect is relatively weak. Other studies indicate that policies can promote corporate innovation in SOEs, whereas this effect is nonsignificant for non-SOEs (Lu and Zhu, 2018) [28]. Government subsidies for strategic emerging industry firms in different industries may also have heterogeneous effects on R&D innovation (Boeing, 2016) [29]. Therefore, we propose the following hypothesis:
Hypothesis 3.
The Strategic Emerging Industry Support Program has distinct effects on R&D and innovation output in firms with different ownership structures.
4. Methodology
We consider the State Council Decision on Accelerating the Cultivation and Development of Strategic Emerging Industries to be a quasi-natural experiment and regard enterprises engaged in strategic emerging industries as an experimental group and other enterprises as a control group. We use a difference-in-difference method to test the relationship between the Strategic Emerging Industry Support Program and enterprise innovation levels.
The data of this study are mainly listed companies’ data, which are obtained from the CSMAR database, Peking University CCER database, and RISET database. To maximize the accuracy of the conclusions, the sample is processed as follows: (1) exclusion of financial companies and special-treatment companies; (2) exclusion of insolvent companies, that is, companies with asset-liability ratios greater than 1; and (3) exclusion of companies with data available only after the experimental period. Companies in strategic emerging industries are selected from the Strategic Emerging Industries Composite Index and Strategic Emerging Industries Component Index issued by CSI Index Co. (Shanghai, China) and SSE Index Co. Enterprises (Shanghai, China) on the Emerging Composite Index or Emerging Adult Index are regarding as strategic emerging industry enterprises. A total of 1371 enterprises were obtained, including 382 from strategic emerging industries.
In terms of the explained variables, we use the enterprise’s R&D to measure innovation input, the number of patents granted to measure innovation output, the number of patents per unit of R&D to measure innovation efficiency, and the number of invention patents granted as a proportion of the number of patents granted to measure innovation quality. We use the proportion of invention patents granted as a proportion of total patents granted to measure the technology and quality of patents because invention patents have the most technological content among patents and are the most difficult to obtain.
In terms of the explanatory variables, the treatment group dummy variable takes a value of 1 if the enterprise belongs to a strategic emerging industry and 0 otherwise. Because the Strategic Emerging Industry Support Program of the State Council was adopted in late 2010, we set the experimental period as all years starting from 2011 and the control period as all years before 2011; that is, if the time is later than or is 2011, the value is 1, and if the time is earlier than 2011, the value is 0. The explanatory variable in this paper is the interaction term between the experimental group and the experimental period, which is used to measure the Strategic Emerging Industry Support Program. If the enterprise is part of a strategic emerging industry and is active in the experimental period, it is assigned a value of 1; if not, it is assigned a value of 0.
With reference to the literature (Li and Xu, 2011; Gu et al., 2018) [30,31], the control variables related to the firm itself used in this study are as follows: intangible asset rate, firm size, gearing ratio, equity structure, total return on assets, and age and ownership structure of the firm. The channel variables related to the impact of the Strategic Emerging Industry Support Program on innovation levels are government subsidies, tax incentives, credit, and stock liquidity; the aforementioned variables are defined in Table 1.

Table 1.
Variable definitions and descriptive statistics.
To test the impact of the Strategic Emerging Industry Support Program on firm innovation, we use the following difference-in-difference model for simulation:
where is the core explanatory variable for the interaction term between the strategic emerging industries experimental group and the strategic emerging industries experimental period, with indicating that enterprise i is in year t of the experimental period and is part of the strategic emerging industries enterprise policy pilot sample and indicating otherwise. In addition, indicates the innovation level, with innovation efficiency measured using enterprise R&D investment, number of patents granted to enterprises, and patent output per R&D investment and innovation quality measured using the ratio of granted invention patents to the total number of granted patents. Furthermore, X represents the following firm-level control variables: intangible asset rate, firm age, firm size gearing ratio, Tobin’s Q, shareholding structure, and total asset margin. is the individual firm fixed effect, which controls for all firm-level factors that do not vary over time, and is the year fixed effect, which controls for all time-level factors that do not vary over time. In the model presented in Equation (1), we focus on the coefficient of β. If the obtained estimate of , the industrial support policy significantly promotes the innovation level of firms.
5. Results and Discussion
In this section, we analyze the relationship between government support programs and firms’ innovation levels.
5.1. Strategic Emerging Industry Support Program and Innovation Level
Table 2 presents the regressions with panel data from different dependent variables (R&D, patent, innovation efficiency, and innovation quality) on the explanatory variable, namely the Strategic Emerging Industry Support Program. As an explanatory variable, this variable is central to our focus and is the core variable of the difference-in-difference measure of the Strategic Emerging Industry Support Program.
Table 2.
Impact of the Strategic Emerging Industry Support Program on enterprise innovation level.
The control variables in this study are intangible asset ratio, firm age, firm size, gearing, Tobin’s Q, majority shareholder ownership, return on investment (ROA), time fixed effects, and firm fixed effects. Firm age has a negative and significant effect on firm R&D input but a positive and significant effect on firm innovation efficiency. Firm size has a positive effect on patents, Tobin’s Q has a positive effect on firm R&D input, and gearing has a negative effect on firm R&D input.
Regarding the relationship between the support policies for strategic emerging industries and the innovation level of enterprises, we observe that the government support policy stimulates an increase in firm R&D and an increase in the number of patents awarded because the coefficient estimation results are significant. However, innovation efficiency, measured by innovation output per unit of R&D input, is not significantly related to the government support policy, suggesting a lack of innovation efficiency in the process of enterprises’ response to government incentives. Similarly, innovation quality, measured by the number of patents for inventions with the highest technological content as a percentage of the total number of patents, has no significant relationship with the government support policy, indicating that the government policy does not motivate firms to improve innovation quality (Wu et al., 2022) [32].
China Baoan Group (Shenzen, China) is a strategic emerging industry enterprise, with high-tech industry as the leading industry, supplemented by medicine and health, urban operation and development, and equity investment as the industry cluster. In 2008, China Security Group’s real estate industry for the first time was rated as “China real estate project brand value TOP 10”, with a brand value of CNY 648 million, which was the first time China Security Group was rated “China real estate project brand value TOP 10”. In 2008, China Baoan Group’s real estate industry was ranked as “China Real Estate Project Brand Value Top 10” for the first time, with a brand value of CNY 648 million. The company’s innovation ability at that time was obviously still insufficient, and it mainly relied on the real estate industry as its core industry. In 2015, China Baoan Group transferred 15% of the shares of Baoan Real Estate to Dongxu Group Co. (Beijing, China). The number of patent outputs of this company increased significantly during this period. This indicates that the strategic support policy for emerging industries has promoted the transformation of the supported enterprise, which is conducive to the increased R&D investment of the enterprise to improve its innovation output.
Daheng Science & Technology (Beijing, China) is a strategic emerging industry enterprise whose main business is optical mechatronics products, information technology and office automation products, digital TV network editing and playback systems, and semiconductor components. The enterprise’s R&D expenditure in 2015 was about CNY 140 million, and the enterprise’s R&D expenditure in 2017 was CNY 177 million, indicating that the enterprise has increased its R&D investment under the support of the policy. Therefore, it can be further proved that the strategic support policy for emerging industries promotes the R&D innovation of the enterprise.
Next, we analyze the relationship between the Strategic Emerging Industry Support Program and firms’ return on equity and ROA (Table 3). The regression results reveal that the program does not promote the profitability of enterprises, and it fails to improve the profitability of enterprises in strategic emerging industries, regardless of whether profitability is measured by the return on total assets or the return on net assets. This indicates that the enterprises are unable to convert awarded patents into profits and that problems may be present in the use of patents. Thus, the program may have created distortions in the process of stimulating innovation, causing a type of strategic innovation that emphasizes quantity over quality.
Table 3.
Impact of the Strategic Emerging Industry Support Program on corporate performance.
The aforementioned results suggest a direct relationship between the Strategic Emerging Industry Support Program and innovation levels. The program stimulates firms’ R&D investment and increases innovation output; however, this program can result in strategic innovation in firms in which firms emphasize the quantity of innovation but neglect the efficiency and quality of innovation (Marra et al., 2015) [33]. These results support H1.
5.2. Robustness Tests
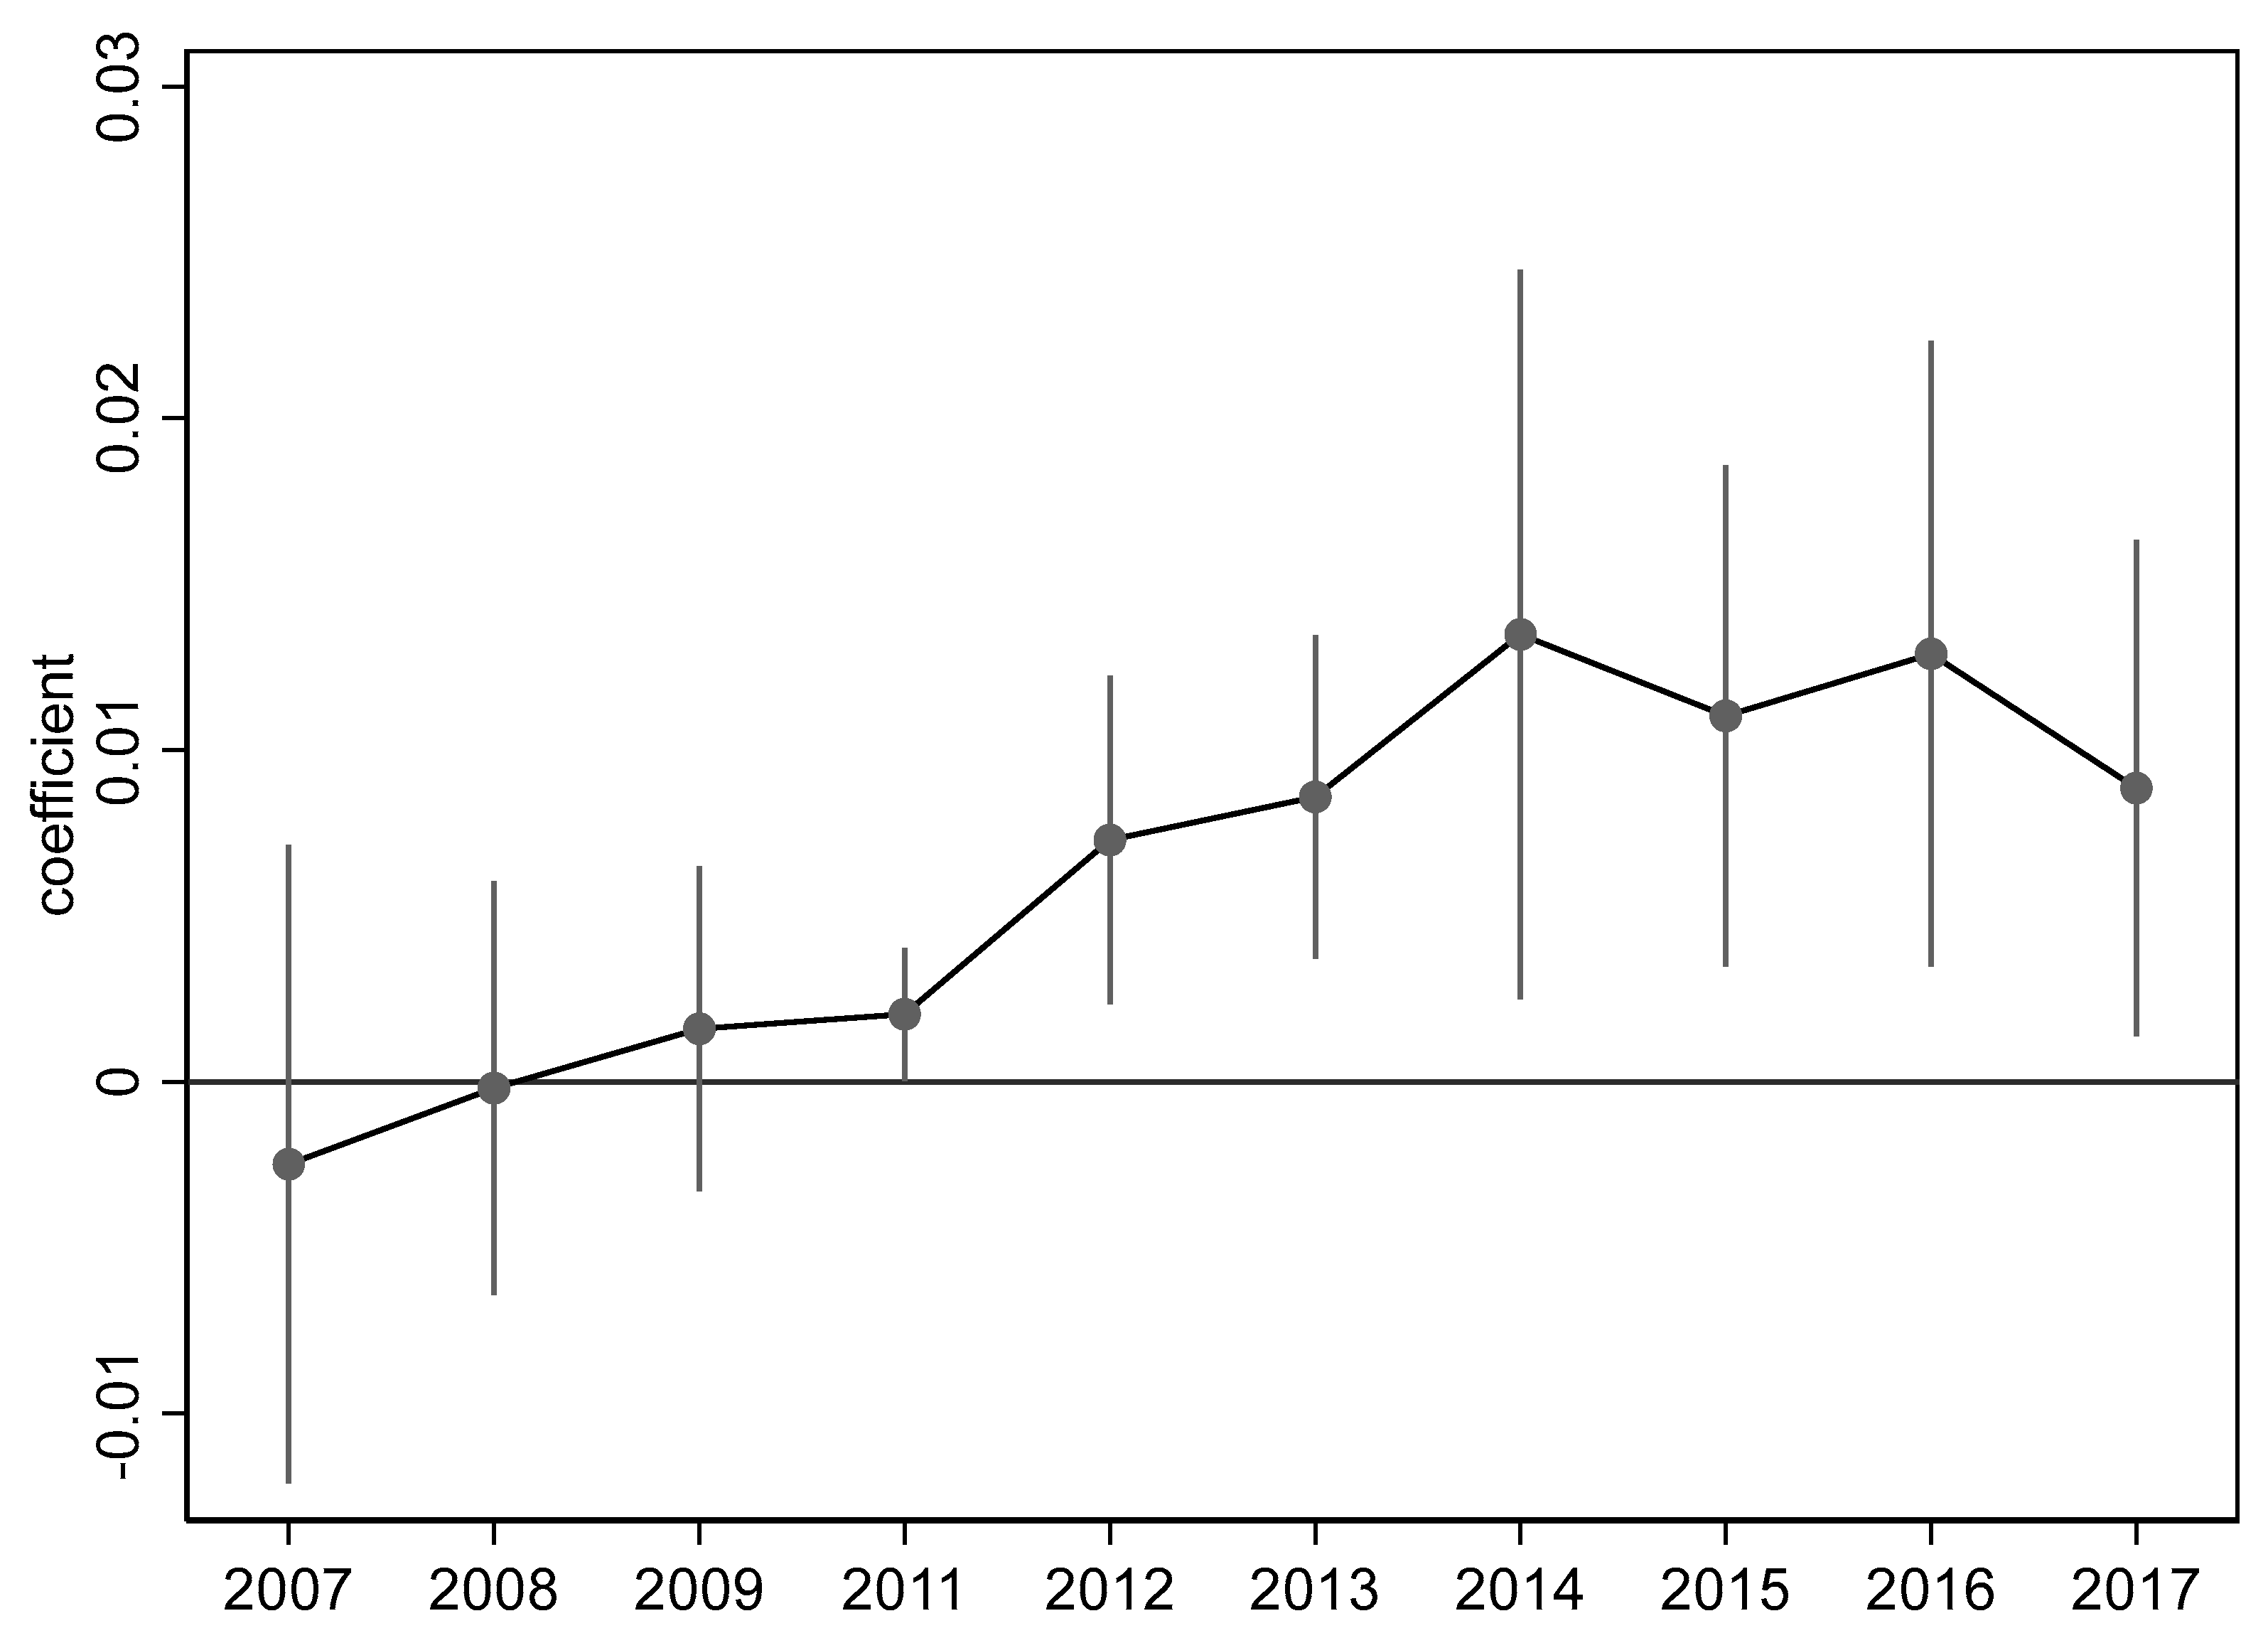
A key premise of using difference-in-difference analysis is that the trend over time between the experimental and control groups is consistent and not systematically different ex ante in the absence of shocks from the Strategic Emerging Industry Support Program. Therefore, we use the event study method to verify parallel trends by constructing the interaction term between the time dummy variable and the treatment group dummy variable from 2007 to 2017, as shown in Equation (2). To avoid complete multicollinearity, the year before the initiation of the Strategic Emerging Industry Support Program (2010) is used as a benchmark. If the coefficients of the interaction terms do not have significant differences before 2011 but have significant differences after 2011, the innovation levels of the experimental group and the control group have parallel trends before the promulgation of the policy and satisfy the premise of the difference-in-difference hypothesis.
In Equation (2), is a year-by-year dummy variable, and the other variables are the same as those in Equation (1); if the coefficients are not significantly different before 2011 but significantly different after 2011, then the parallel trend assumption is satisfied.
Figure 1 plots the statistical results of the regression coefficient β of the shock of the policy on enterprise R&D at 95% confidence intervals; the coefficient of β is not significant during 2007–2011, indicating the absence of a systematic difference between the experimental group and the control group before the implementation of the policy, which satisfies the parallel trend assumption. Furthermore, the effect of the policy shock on enterprise R&D was significantly positive during the 6 years from 2012 to 2017, indicating that the policy has a positive incentive effect on the R&D of enterprises in strategic emerging industries. From Figure 1, it can be seen that the utility of strategic policies to support emerging industries for firms’ R&D increases and then decreases over time.
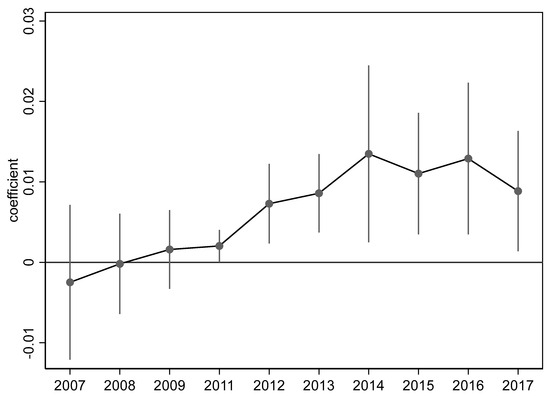
Figure 1.
Parallel trend test of policy shocks on corporate R&D.
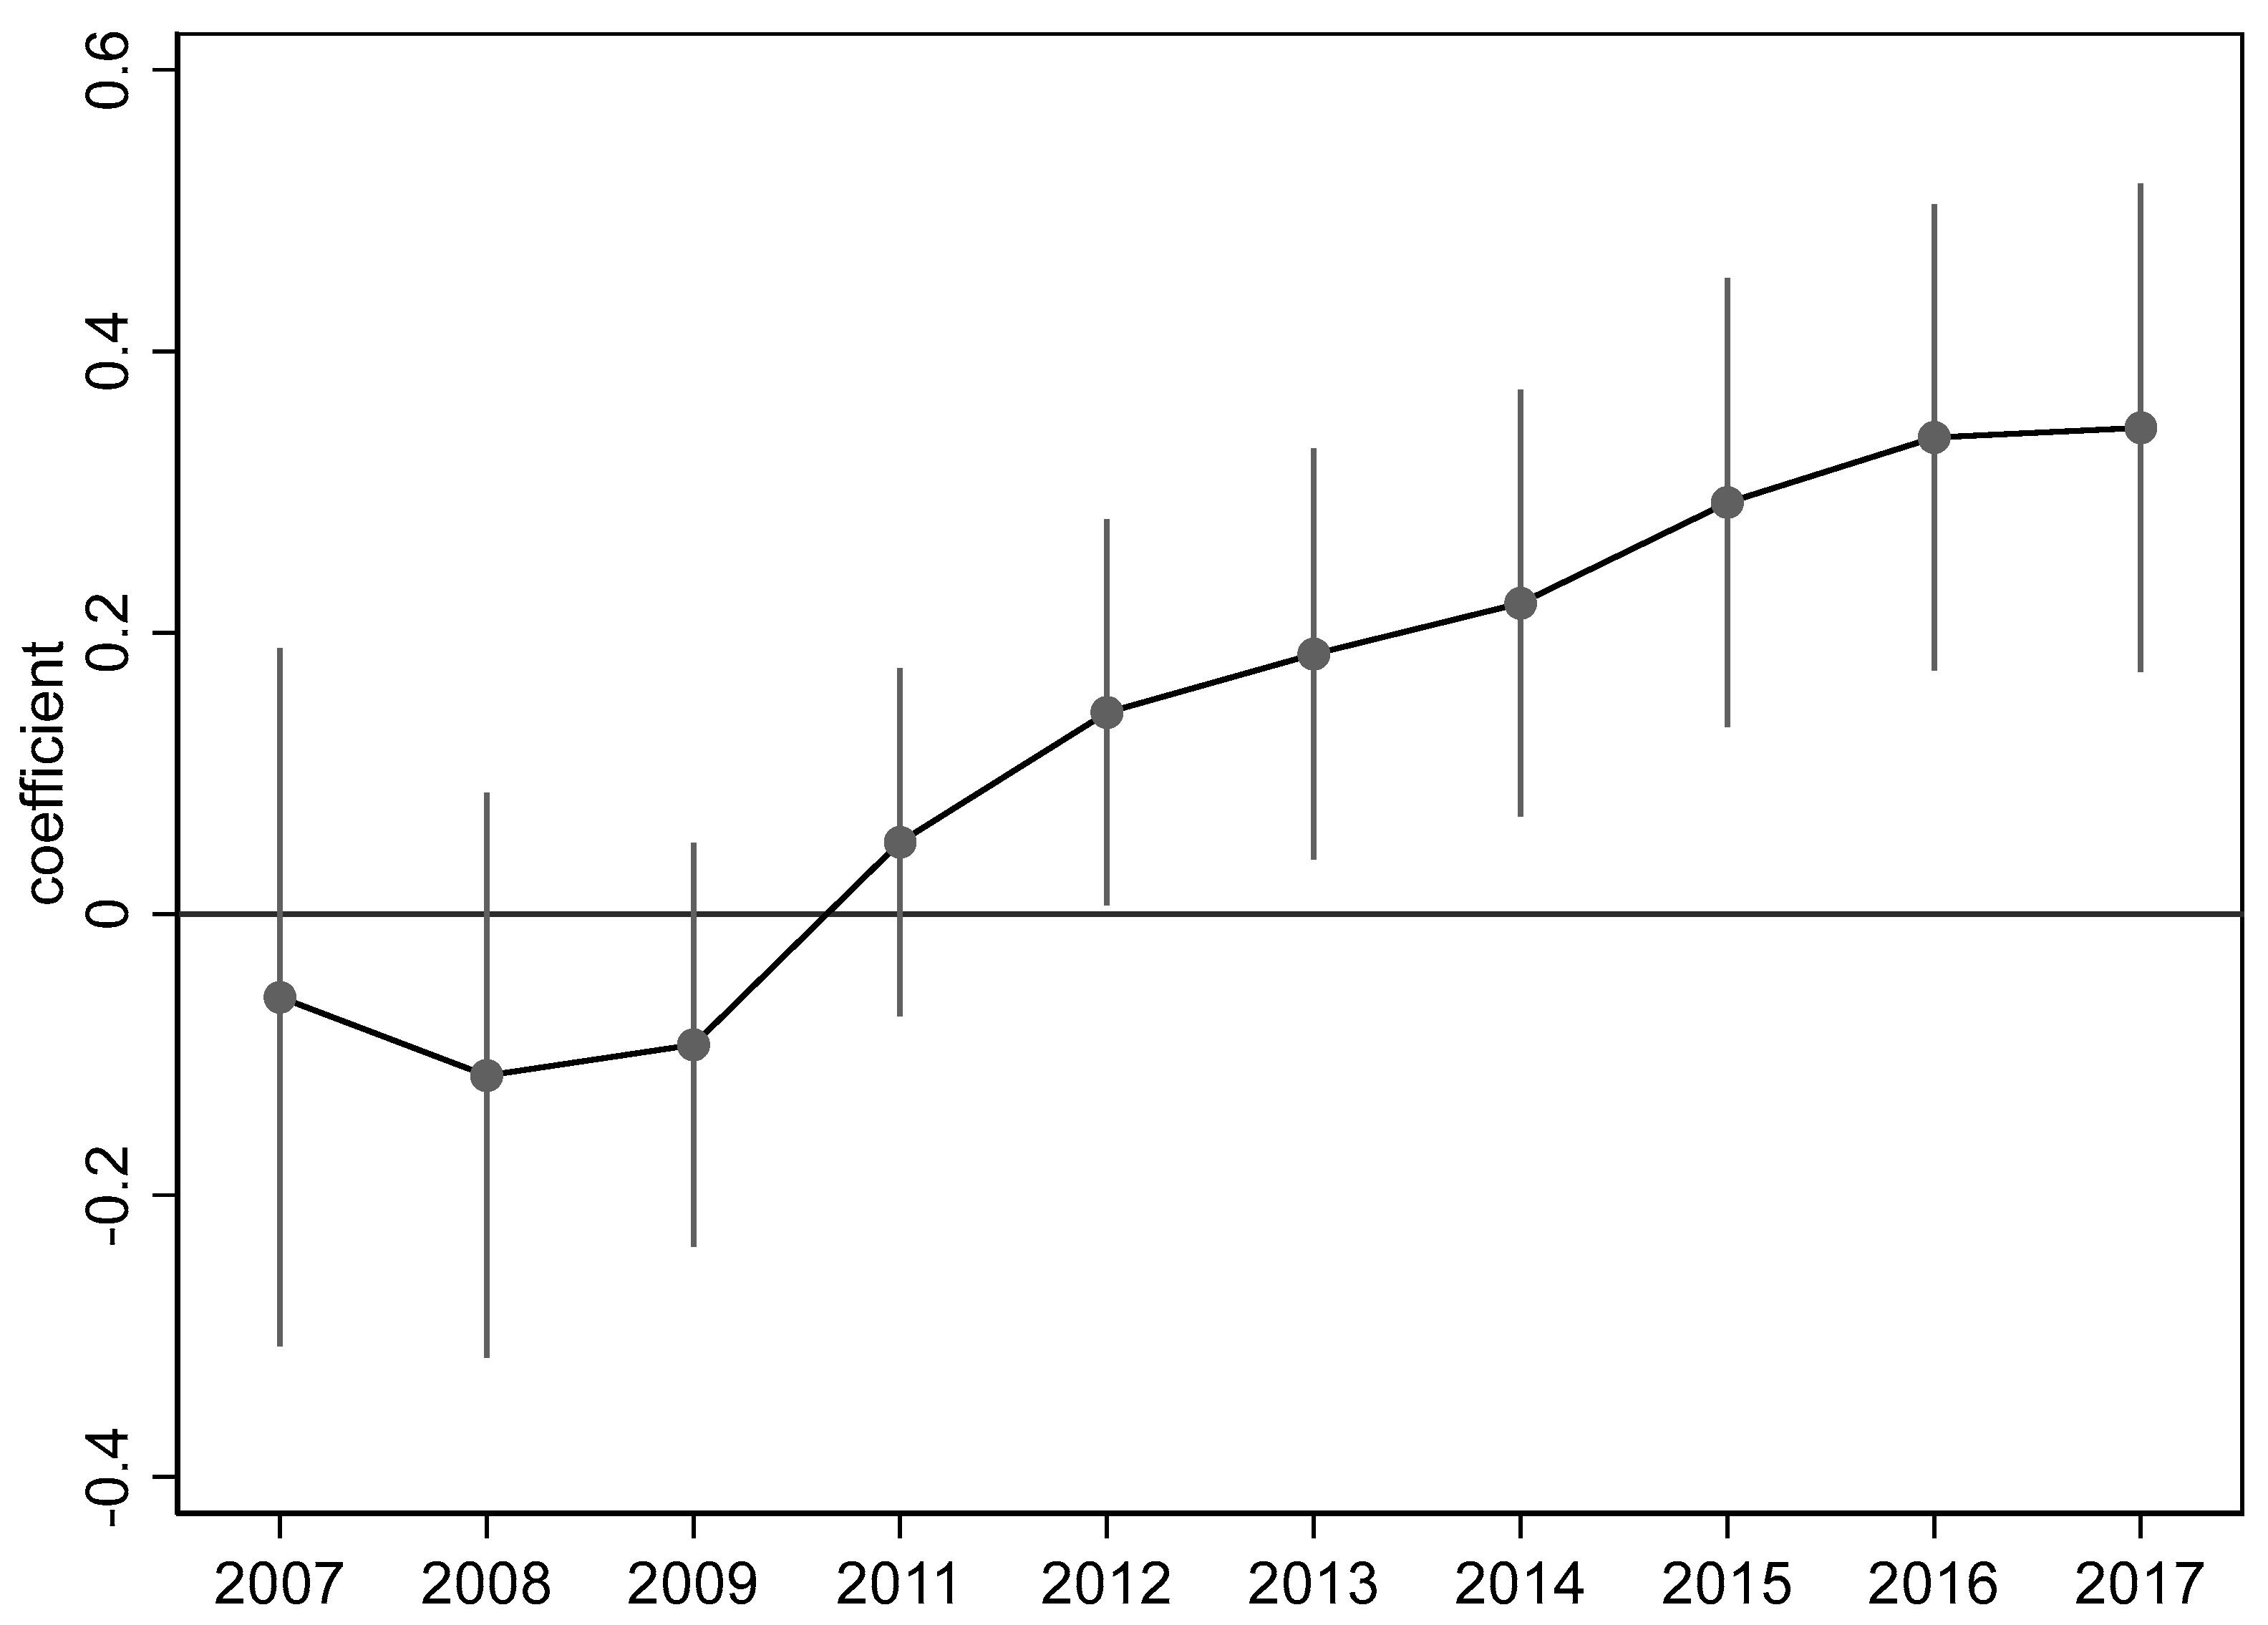
Figure 2 plots the statistical results of the regression coefficient β of the policy shock on firm innovation at a 95% confidence interval; the coefficient of β is not significant during 2007–2011, indicating the absence of a systematic difference between the experimental group and the control group before the implementation of the policy, which satisfies the parallel trend assumption. Furthermore, the effect of the policy shock on patents was significantly positive during the 6 years from 2012 to 2017, indicating that the policy has a positive incentive effect on the patent output of strategic emerging industry firms. From Figure 2, it can be seen that there is a dynamic effect of policies to support strategic emerging industries on firms’ innovation output, with the promotion of strategic emerging industries on firms’ innovation increasing over time.

Figure 2.
Parallel trend test of policy shocks on granted patents.
Previously, when we considered the impact of the Strategic Emerging Industry Support Program on enterprise innovation clustering at the enterprise level, we suggested the presence of correlations within enterprises but not between enterprises. However, enterprises in the same industry in strategic emerging industries may engage in exchanges and learn from each other; the same is true for enterprises in strategic emerging industries in the same region. Therefore, correlations are highly likely to exist between enterprises in strategic emerging industries within the same industry and between enterprises in strategic emerging industries within the same region; for this reason, the previous clustering approach may not be realistic. Therefore, we further conduct a robustness analysis on the different clustering levels to ensure the clustering levels conform to reality; generally, the higher the clustering level is, the larger the corresponding clustering robustness standard error is. As indicated in Table 4, regardless of whether clustering is completed at the industry level or at the province and city levels, the findings are consistent with the aforementioned findings, indicating that the Strategic Emerging Industry Support Program stimulates increases in firm R&D investment and innovation output.
Table 4.
Robustness tests.
The Chinese stock market experienced a crash in 2015 that affected thousands of stocks. Such unusual events can affect the innovation level of listed firms; thus, to identify whether the sample is disturbed by the presence of outliers, we further conduct a robustness test by excluding the 2015 sample of firms. The empirical results are presented in Model 3 in Table 5. Even after the 2015 sample is excluded, the results pass the robustness test and support the aforementioned findings.
Table 5.
Competitive hypothesis exclusion.
We also perform competing hypothesis exclusion using robustness testing to verify that the omission of other policies affecting innovation during the sample period does lead to significant findings. In 2009, China adopted the High-Tech Development Zones Policy; in 2013, 2014, and 2016, the state established three pilot free-trade zones (FTZs); in 2014, 2015, and 2016, the state implemented the Broadband China Policy in different localities in three batches to strengthen Internet infrastructure; in 2008, the state released the “Management Measures for the Identification of High-tech Enterprises” to establish support policies for high-tech enterprises; in 2014, the Program on the Establishment of Intellectual Property Courts was launched, heralding the beginning of judicial exploration of intellectual property rights (IPRs) in Beijing, Shanghai, and Guangdong (except Shenzhen). These policies likely affected innovation, and the policies are all active during the sample period; therefore, in the robustness checks, we exclude, in turn, the High-Tech Development Zone Policy, Pilot Free-Trade Zone Policy, High-Tech Enterprise Support Policy, and Intellectual Property Court Establishment Policy, as indicated in Table 6, to consider their effects.
Table 6.
Impact channels of the Strategic Emerging Industry Support Program on enterprise innovation.
According to Table 5a,b, even after the FTZ, high-tech development zone, high-tech enterprise support policy, and intellectual property court policy control variables are added in turn, the Strategic Emerging Industry Support Program continues to have a significant positive effect on the R&D investment of firms and the number of patents granted to enterprises (significant at the 1% level), indicating that our conclusion is robust. Moreover, the results indicate that FTZs hinder firm innovation, with a possible reason being that firms located in FTZs have access to resources at lower prices, prompting them to favor the purchase of technologically advanced international products over investment in independent R&D innovation. The high-tech development zones, by contrast, significantly promote corporate R&D and innovation, and high-tech enterprise support significantly promotes corporate innovation. By contrast, the impact of IPR judicial protection policies on corporate innovation output is nonsignificant.
5.3. Channel Analysis
After the investigation of the increases in firm R&D investment and innovation output driven by the Strategic Emerging Industry Support Program is completed, we investigate the channels through which the policy functions. The Strategic Emerging Industry Support Program may increase firms’ book assets because the firms receive government subsidies and tax incentives, which contribute to an increase in the firms’ R&D input and innovation output. The program may also indicate to banks or financial institutions that strategic emerging enterprises have a certain level of political capital; the institutions may then facilitate these firms’ access to credit. This easy access to credit is conducive to firm R&D investment and increased innovation output (Busom, 2000) [34]. Furthermore, the Strategic Emerging Industry Support Program may enhance investors’ long-term expectations of strategic emerging industry enterprises, prompting these investors to hold the stocks of strategic emerging industry enterprises over the long term, which reduces the stock liquidity of such enterprises and thus indirectly motivates them to invest in R&D and innovation output.
In the following analysis, we analyze the aforementioned channels that may be responsible for the increased R&D input and patents of enterprises (Table 6). The results reveal that the Strategic Emerging Industry Support Program increases firms’ book assets through government subsidies and tax benefits. The support policy sends positive signals to banks, thus increasing enterprises’ access to convenient credit. The support policy also sends positive signals to investors, reducing stock liquidity. The fourth column in Table 7 has an alias explanatory variable named stock liquidity, and we use the annual average daily turnover index calculated by the Amihud measure to measure stock liquidity (Su and Xiong, 2013) [35]; the results reveal that the policy has a significant negative effect on stock liquidity at the 5% level, which indicates that the policy significantly reduces the stock liquidity of firms in strategic emerging industries, thus reducing the likelihood of potential hostile takeovers as well as that of corporate executives engaging in short-sighted behavior, thus favoring long-term investment activities such as corporate innovation R&D, which, in turn, stimulates innovation output. H2 is thus supported.
Table 7.
Heterogeneous impact of Strategic Emerging Industry Support Program on enterprises.
To summarize, first, the establishment of strategic emerging industries promotes sufficient funds for R&D and innovation by providing government subsidies and tax incentives to supported enterprises. Second, the policy sends signals to banks to lend cheaply to supported enterprises, which helps them obtain loans at low interest rates. Finally, the policy sends a signal to investors to hold the companies’ shares for a longer period of time, which reduces the risk of malicious takeovers and helps the company focus on R&D and improve its level of innovation.
5.4. Heterogeneity Analysis
Considerable differences exist between state-owned and private enterprises in China, and thus, the implementation of policies may have heterogeneous effects depending on the ownership structure of the enterprise. For heterogeneity analysis, we divide the sample into private enterprises and SOEs (Table 7). The results indicate that the Strategic Emerging Industry Support Program promotes R&D investment in both SOEs and private enterprises. However, this incentive effect is stronger on private enterprises than on SOEs. In terms of patent output, the incentive effect of the support policy is greater for SOEs, probably because SOEs tend to be more technologically advanced than private enterprises, and some SOEs have a monopoly position in technology accumulation, thus providing them with unparalleled advantages relative to private enterprises. Regarding innovation efficiency and innovation quality, the Strategic Emerging Industry Support Program does not benefit SOEs or private enterprises, suggesting that enterprises neglect efficiency and quality under national support programs. In terms of government subsidies, the support policy has significant effects on SOEs but not on private enterprises, and we note some subsidy discrimination. In terms of tax incentives, the support policy allows for tax incentives for both SOEs and private enterprises. However, the effect of these incentives is stronger for SOEs. Regarding credit and stock liquidity, the effect of the support program on SOEs is nonsignificant, whereas the effect on private enterprises is significant, which may be attributed to SOEs being more likely to obtain bank loans than private enterprises; thus, the marginal utility of the policy transmission signal is weak. Because private enterprises have difficulty in obtaining bank loans, the marginal utility of the policy transmission signal to banks is strong. Regarding stock liquidity, for SOEs, the support program has a limited effect because of the unique ownership nature of such firms. By contrast, private firms have clear property rights and are self-sustaining; thus, the program affects the stock liquidity of private firms.
6. Conclusions and Policy Implication
In this paper, we analyze the impact of the National Strategic Emerging Industry Support Program on the innovation level of enterprises and consider its channels of action using data from A-share-listed enterprises from 2007 to 2017.
The results reveal that the program stimulates R&D investment among firms in strategic emerging industries, consequently increasing the number of patents granted. However, patent efficiency, measured by patent output per unit of R&D investment, and innovation quality, measured by the ratio of granted invention patents to the total number of granted patents, did not improve significantly as a result of the program’s support, indicating a lack of improvement in innovation efficiency and innovation quality among the enterprises in strategic emerging industries who benefited from the program. In conclusion, strategic emerging industry enterprises exhibit strategic innovation in response to the government support program, with the innovation focusing on increases in R&D investment and the number of patents at the expense of improvements in innovation efficiency and quality.
In addition, the Strategic Emerging Industry Support Program encourages enterprise innovation through subsidies and tax benefits, which increase enterprises’ book assets, thus stimulating R&D investment and improvements in patent quantity. The government’s support program prompts banks to facilitate access to credit for enterprises in strategic emerging industries, which is conducive to their R&D and innovation. The government support program also results in investors forming long-term expectations and holding the company’s stock for a longer period of time, which reduces the liquidity of the company’s stock. This reduces the risk of hostile takeovers and supports a managerial focus on R&D and innovation. Further heterogeneity analysis reveals that, in terms of R&D investment, the government support program has a stronger incentive effect on private enterprises than on SOEs in strategic emerging industries; in terms of patent output, the support program has a stronger incentive effect on SOEs than on private enterprises in strategic emerging industries. Finally, for SOEs in strategic emerging industries, the program has the greatest effect on R&D and innovation through subsidies and tax incentives; for private enterprises in strategic emerging industries, tax incentives, convenient credit, and reduced stock liquidity have the strongest effects.
The conclusion suggests that national industrial support policies do not lead to substantial innovation by supported firms but rather to strategic innovation, i.e., this strategic innovation achieves the government’s goal by increasing R&D investment to produce new patents and design patents with low technological content. In a general sense, this paper uses Chinese data to provide a history of national industrial support policies that are not always efficient.
With reference to the present findings, we provide some practical guidance for the implementation of the Strategic Emerging Industry Support Policy. First, the government should continue to strengthen its support for strategic emerging industries, standardize and improve relevant supporting policies, and provide a favorable environment for enterprises to further enhance their innovation output. Second, the focus of the policies should gradually shift from incentivizing enterprises to increase their innovation output to achieving transformation as a result of innovation; firm innovation should enhance profitability and make firms self-reliant and sustainable. In the future, we can further investigate why the policy of supporting strategic emerging industries has not led to an increase in the innovation efficiency and quality of the supported firms.
Author Contributions
Conceptualization, R.M.; Methodology, R.M.; Formal analysis, X.H.; Investigation, R.M.; Resources, X.H.; Writing—original draft, R.M.; Writing—review & editing, J.Y. and X.H.; Supervision, J.Y.; Project administration, J.Y. All authors have read and agreed to the published version of the manuscript.
Funding
This research was funded by Major Program of National Social Science Foundation of China, grant number: 15ZDB133 and National Natural Science Foundation of China, grant number: 42071213.
Data Availability Statement
The data presented in this study are available on request from the corresponding author.
Conflicts of Interest
The authors declare no conflict of interest.
References
- Schettino, F.; Sterlacchini, A.; Venturini, F. Inventive productivity and patent quality: Evidence from Italian inventors. J. Policy Model. 2013, 35, 1043–1056. [Google Scholar] [CrossRef]
- Wang, H.; Sawur, Y. The relationships between government subsidies, innovation input, and innovation output: Evidence from the new generation of information technology industry in China. Sustainability 2022, 14, 14043. [Google Scholar] [CrossRef]
- Lu, G.; Wang, Z.; Zhang, C. A study on the performance of government innovation subsidies in strategic emerging industries in China. Econ. Res. J. 2014, 36, 44–55. (In Chinese) [Google Scholar]
- Wu, A. The signal effect of government R&D subsidies in China: Does ownership matter? Technol. Forecast. Soc. Chang. 2017, 117, 339–345. [Google Scholar]
- Xia, L.; Gao, S.; Wei, J.; Ding, Q. Government subsidy and corporate green innovation: Does board governance play a role? Energy Policy 2022, 161, 112720. [Google Scholar] [CrossRef]
- Yu, D.; Lv, Y. Improper government intervention and overcapacity in Strategic Emerging Industries-A case study of China’s photovoltaic industry. China Ind. Econ. 2015, 45, 53–68. (In Chinese) [Google Scholar]
- Su, W.; Wang, Z.; Zhang, C.; Balezentis, T. Determinants of the innovation efficiency of strategic emerging enterprises: Evidence from the robust frontiers. Econ. Chang. Restruct. 2023, 56, 1433–1465. [Google Scholar] [CrossRef]
- Farla, K. Industrial policy for growth. J. Ind. Compet. Trade 2015, 15, 257–282. [Google Scholar] [CrossRef]
- Hou, B.; Hong, J.; Wang, H.; Zhou, C. Academia-industry collaboration, government funding and innovation efficiency in Chinese industrial enterprises. Technol. Anal. Strateg. Manag. 2018, 31, 692–706. [Google Scholar] [CrossRef]
- Bai, J.; Li, J. Government R&D funding and enterprise technological innovation: An empirical analysis from the perspective of efficiency. J. Financ. Res. 2011, 24, 181–193. (In Chinese) [Google Scholar]
- Hu, L.; Chen, Y.; Fan, T. The influence of government subsidies on the efficiency of technological innovation: A panel threshold regression approach. Sustainability 2023, 15, 534. [Google Scholar] [CrossRef]
- Nohria, N.; Gulati, R. Is slack good or bad for innovation? Acad. Manag. J. 1996, 39, 1245–1264. [Google Scholar] [CrossRef]
- Bronzini, R.; Iachini, E. Are incentives for R&D effective? Evidence from a regression discontinuity approach. Am. Econ. J. Econ. Policy 2014, 6, 100–134. [Google Scholar]
- Huergo, E.; Moreno, L. Subsidies or Loans? Evaluating the impact of R&D support programmers. Res. Policy 2017, 46, 1198–1214. [Google Scholar]
- Lee, E.; Cin, B. The effect of risk-sharing government subsidy on corporate R&D investment: Empirical evidence from Korea. Technol. Forecast. Soc. Chang. 2010, 77, 881–890. [Google Scholar]
- Li, W.; Zheng, M. Substantive or strategic innovation? The impact of macro-industrial policy on micro-firm innovation. Econ. Res. J. 2016, 36, 60–73. (In Chinese) [Google Scholar]
- Feldman, M.; Kelly, M. The extant assessment of knowledge spillovers: Government R&D policy, economic incentives and private firm behavior. Research Policy 2006, 35, 1509–1521. [Google Scholar]
- Wu, J.; Liu, M. The impact of managerial political connections and quality on government subsidies: Evidence from Chinese listed firms. Chin. Manag. Stud. 2011, 5, 207–226. [Google Scholar] [CrossRef]
- Guo, D.; Guo, Y.; Jiang, K. Government-subsidized R&D and firm innovation: Evidence from China. Res. Policy 2016, 45, 1129–1144. [Google Scholar]
- Chundakkadan, R.; Sasidharan, S. The role of government support on E-commerce and firm innovation during pandemic crisis. Econ. Anal. Policy 2023, 78, 904–913. [Google Scholar] [CrossRef]
- Garcia-Macia, D.; Hsieh, C.; Klenow, P. How destructive is innovation? Econometrica 2019, 87, 1507–1541. [Google Scholar] [CrossRef]
- Wang, K.; Li, Y.; Li, J.; Zhao, Y. What makes incubators promote firm innovation? Micro evidence from Haidian Science and Technology Park in Zhongguan village. Manag. World 2019, 69, 102–118. (In Chinese) [Google Scholar]
- Fang, V.; Tian, X.; Tice, S. Does stock liquidity enhance or impede firm innovation? J. Financ. 2014, 69, 2085–2125. [Google Scholar] [CrossRef]
- Zúiga-Vicente, J.; Alonso-Borrego, C.; Forcadell, F.; Galán, J. Assessing the effect of public subsidies on firm R&D investment: A survey. J. Econ. Surv. 2014, 28, 36–67. [Google Scholar]
- Bronzini, R.; Piselli, P. The impact of R&D subsidies on firm innovation. Res. Policy 2016, 45, 442–457. [Google Scholar]
- Jeong, H.; Shin, K.; Kim, S.; Kim, E. What types of government support on food SMEs improve innovation performance? Sustainability 2021, 13, 9461. [Google Scholar] [CrossRef]
- Yang, Y.; Wei, J.; Luo, L. Who is using government subsidies for innovation? Joint regulatory effects of ownership and factor market distortions. Manag. World 2015, 12, 75–188. (In Chinese) [Google Scholar]
- Lu, D.; Zhu, L. The degree of marketization, strategic emerging industries policy and firm innovation. Ind. Econ. Res. 2018, 65–77. (In Chinese) [Google Scholar]
- Boeing, P. The allocation and effectiveness of china’s R&D subsidies: Evidence from listed firms. Res. Policy 2016, 45, 1774–1789. [Google Scholar]
- Gu, X.; Chen, Y.; Pan, S. Economic policy uncertainty and innovation: An empirical analysis based on listed companies in China. Econ. Res. J. 2018, 35, 109–123. (In Chinese) [Google Scholar]
- Li, K.; Xu, L. Financing constraints, debt capacity and firm performance. Econ. Res. J. 2011, 25, 61–73. (In Chinese) [Google Scholar]
- Wu, Z.; Fan, X.; Zhu, B.; Xia, J.; Zhang, L.; Wang, P. Do government subsidies improve innovation investment for new energy firms: A quasi-natural experiment of China’s listed companies. Technol. Forecast. Soc. Chang. 2022, 175, 121418. [Google Scholar] [CrossRef]
- Marra, A.; Antonelli, P.; Dell’Anna, L.; Pozzi, C. A network analysis using metadata to investigate innovation in clean-tech: Implications for energy policy. Energy Policy 2015, 86, 17–26. [Google Scholar] [CrossRef]
- Busom, I. An empirical evaluation of the effects of R&D subsidies. Econ. Innov. New Technol. 2000, 9, 111–148. [Google Scholar]
- Su, D.; Xiong, J. Stock liquidity, stock price information content and CEO compensation contracts. Econ. Res. J. 2013, 55, 56–70. (In Chinese) [Google Scholar]
Disclaimer/Publisher’s Note: The statements, opinions and data contained in all publications are solely those of the individual author(s) and contributor(s) and not of MDPI and/or the editor(s). MDPI and/or the editor(s) disclaim responsibility for any injury to people or property resulting from any ideas, methods, instructions or products referred to in the content. |
© 2023 by the authors. Licensee MDPI, Basel, Switzerland. This article is an open access article distributed under the terms and conditions of the Creative Commons Attribution (CC BY) license (https://creativecommons.org/licenses/by/4.0/).