Abstract
This study builds upon deterministic evaluations of the extensive cumulative rainfall thresholds associated with shallow landslides in the Gaoping River Basin, with a specific focus on the necessary response times during typhoon and intense rainfall events. Following the significant impact of Typhoon Morakot on the Liugui area, our investigation enhances previous research by employing a downscaled approach. We aim to establish early warning models for village-level, intermediate-scale landslide cumulative rainfall thresholds and to create action thresholds for small-scale, key landslide-prone slopes. Our inquiry not only combines various analytical models but also validates their reliability through comprehensive case studies. Comparative analysis with the empirical values set by the Soil and Water Conservation Bureau (SWCB) and the National Center for Disaster Reduction (NCDR) provides a median response time of 6 h, confirming that our findings are consistent with the response time frameworks established by these institutions, thus validating their effectiveness for typhoon-related landslide alerts. The results not only highlight the reference value of applying downscaled cumulative rainfall thresholds at the village level but also emphasize the significance of the evaluated warning thresholds as viable benchmarks for early warnings in landslide disaster management during Taiwan’s flood and typhoon seasons. This research offers a refined methodological approach to landslide early warning systems and provides scientific support for decision making by local governments and disaster response teams.
1. Introduction
Over the past 20 years, Taiwan has been repeatedly impacted by typhoons. Rainfall statistics have consistently broken historical records. In particular, in August 2009 Typhoon Morakot brought consecutive periods of heavy rainfall to Southern Taiwan, resulting in severe flooding and triggering over 20,000 new landslides and debris flow disasters of varying sizes. This event caused significant casualties and economic losses. Therefore, it has become crucial to effectively estimate the occurrence potential of slope disasters of various scales before such disasters occur. These estimations can provide a reference for relevant authorities at all levels to implement effective disaster prevention and mitigation measures [1].
In the past, there have been two main types of analysis models for large-scale watershed areas: statistical methods and deterministic methods [2,3,4]. Traditional landslide susceptibility analysis methods mostly rely on statistical approaches, which often fail to incorporate the physical mechanisms and mechanical behavior of landslides within the watershed. As a result, factors such as soil cohesion, friction angles, and rainfall intensity are often considered less relevant to landslides. Moreover, the current early warning systems for natural disasters in Taiwan primarily use statistical methods [5,6], where warning values are based on statistical data derived from past disaster cases. However, this approach does not consider the actual physical characteristics of the soil at the specific site. TRIGRS (Transient Rainfall Infiltration and Grid-Based Regional Slope-Stability Model) is a deterministic tool created for forecasting surface and shallow landslides induced by rainfall. This model excels in combining different kinds of geological data, such as live or past rainfall data, as well as details about topography, soil properties, and groundwater states. It assesses how rainwater infiltration affects the stability of the ground and estimates the likelihood and spread of landslides, providing a thorough analysis of landslide hazards.
This research evaluates the soil’s physical properties and conditions across regions to determine TRIGRS’s suitability for slope stability analysis, selecting it as the main assessment tool. It aims to create mid-to-large-scale rainfall warning thresholds for widespread shallow landslides and focuses on key areas to study small-scale slope stability. The results facilitate early risk identification for slope failures, aiding in prompt evacuation and reducing landslides’ risks to life and property.
2. Literature Review
2.1. Landslide Detection
Landslide detection in Taiwan involves a series of preliminary steps that are critical in ensuring accurate and reliable results. Given the region’s susceptibility to landslides due to its frequent seismic activity and heavy rainfall, the pre-processing steps are tailored to handle diverse and complex environmental conditions. Below is an overview of the typical pre-processing steps in landslide detection studies.
- (1)
- Data Collection: This includes gathering historical landslide records, weather data, seismic data, and satellite imagery. Synthetic Aperture Radar (SAR) data are particularly valuable due to their ability to penetrate through cloud cover and the ability to collect data regardless of weather conditions or daylight [7,8,9].
- (2)
- Data Pre-Processing: For SAR data, this step may involve noise reduction, radiometric calibration, and orthorectification. For optical data, this might include atmospheric correction, cloud masking, and normalization [7,8,9].
- (3)
- Topographic and Geological Analysis: Analyzing digital elevation models (DEMs) to assess the slope, aspect, and curvature of the terrain, as well as studying geological maps to understand the lithological aspects of the region [10].
- (4)
- Creation of Baseline Inventory Maps: Using past landslide inventories to create baseline maps that help in identifying changes and predicting future landslide-prone areas.
- (5)
- Image Analysis and Processing: Applying methodologies, such as object-based image analysis (OBIA), and deep learning models, such as the U-Net or ResU-Net architectures, to detect changes in the landscape indicative of landslides [11,12,13,14,15].
- (6)
- Transferability Evaluation: For methods utilizing machine learning, this involves assessing the transferability of models trained on data from different regions (such as other parts of Taiwan, China, or Japan) to the area of study [11].
- (7)
- Ground Truthing and Validation: Conducting field surveys to validate and refine the results obtained from remote sensing and image analysis [12].
- (8)
- Benchmark Data and Model Refinement: Utilizing benchmark datasets such as landslide4Sense to train and test deep learning models and comparing the outcomes with established results to gauge performance and accuracy [15,16].
- (9)
- Literature Review: Reviewing the existing literature and methodologies to ensure that the study is building on the state of the art and to acknowledge the work that has contributed to the understanding and technology of landslide detection.
These steps form the foundation of a comprehensive approach to landslide detection in Taiwan and are critical in preparing the data and models for accurate landslide prediction and assessment.
2.2. Landslide Prediction and Hazard Analysis
To enhance the early warning capability for rainfall-induced landslides, researchers have developed distributed, physically based models such as the Shallow Landslides Instability Prediction (SLIP) model. This model simplifies the analytical process and validates its predictive accuracy against historical landslide events to accurately forecast the spatial and temporal probabilities of shallow landslides [17].
The Fast Shallow Landslide Assessment Model (FSLAM) was created for the quick analysis of landslide risks in large mountainous areas. It uses a basic hydrological model and slope stability analysis to stochastically assess key soil parameters. With inputs, such as soil, vegetation, and rainfall data, FSLAM produces a map indicating the Probability of Failure (PoF). Efficiently processing large datasets, as demonstrated in Andorra, the model enables rapid calibration and enhances prediction accuracy [18].
Furthermore, to address the operational limitations of pixelated probability outputs, the Double-Threshold Validation Tool (DTVT) has been crafted. DTVT automates the transformation of raw instability maps from a pixel scale to watershed-level warnings through systematic GIS operations, rendering the early warning information more comprehensible and actionable for management authorities. The integrated application of these tools, through the selection of appropriate failure probability thresholds (FPTs) and instability diffusion thresholds (IDTs), significantly improves the performance of early warning systems. This synergy provides scientific support for decision making by local governments and disaster response teams [19].
Currently, landslide hazard analysis methods can generally be classified into four categories: expert rating methods, statistical analysis methods, artificial intelligence methods, and deterministic analysis methods. The deterministic method used in this study is briefly described as follows.
Deterministic analysis is based on physical and mechanical concepts. Physical models, founded on the infinite slope method based on the Mohr–Coulomb failure criterion, reveal the landslide potential [20,21,22]. The plane sliding model represents these methods, assuming that slope instability can extend indefinitely. Safety factors and the potential location of surface failures can be obtained using the limit equilibrium method.
The above four categories are commonly used methods for landslide hazard analysis. For broad-scale landslide analysis, statistical methods and probability analysis methods are more widely used. The Geological Survey of Taiwan has also compared these two methods in the Geological Investigation and Database Establishment Project for Flood-Prone Areas in Upstream Watersheds, as shown in Table 1 [2]. From the comparison, it can be seen that the probability analysis method has the advantage of considering the physical characteristics of the study area and obtaining accurate results at a larger scale.

Table 1.
Comparison of Statistical Methods and Deterministic Methods (CG S, [2]).
Deterministic analysis involves using the Richards equation, which is based on Darcy’s law and the principle of mass conservation, to derive changes in water pressure in unsaturated pores resulting from rain infiltration. The Richards equation is a crucial control equation in understanding fluid movement in unsaturated soil layers [23,24,25,26,27]. By employing an analytic solution approach, Iverson simplified the Richards equation to assess the impact of rainfall infiltration in terms of increasing groundwater pressure and to evaluate the stability changes of infinite slopes over the course of rainfall events [28]. This modified approach accommodates complex boundary conditions associated with rainfall events, leading to the development of the Transient Rainfall Infiltration and Grid-Based Regional Slope-Stability (TRIGRS) model. TRIGRS employs automated analysis to evaluate the landslide potential of all slope units within a wide-ranging catchment, considering rainfall infiltration conditions [29].
TRIGRS currently stands as the most representative model for the transient analysis of landslide disasters and has been widely utilized by researchers in landslide analysis and case studies [30,31,32,33]. Validation studies conducted by Bisanti et al. confirm the efficacy of the TRIGRS model using survey data from landslide-prone areas [34]. These studies highlight rainfall-induced soil slips as one of the most hazardous types of slope disasters [28,35,36]. Shallow and translational slippages, often occurring with minimal warning, are common when intense rainfall triggers a failure in saturated soil.
In a comparative study by Huang [4], the Stability Index MAPping (SINMAP), the Shallow Slope Stability Model (SHALSTAB), and the TRIGRS evaluation models for shallow landslides were assessed. It was found that only the TRIGRS model considers the temporal aspect, allowing for the transient analysis of rainfall-induced landslides. Moreover, this approach comprehensively considers the terrain, rainfall infiltration, and transient groundwater pressure, as well as the thickness, mechanical characteristics, and hydro-geological properties of the regolith, along with spatial and temporal variations in rainfall distribution. Consequently, it provides a highly effective description of shallow landslides caused by rainfall infiltration.
The literature suggests that the deterministic method is best in evaluating shallow landslides, taking into consideration the actual physical conditions on site. This study uses this method, along with the TRIGRS model, to assess slope stability and determine warning thresholds for rainfall-induced landslides. The findings are intended to facilitate disaster warnings by authorities and the public.
The TRIGRS model is a grid-based slope stability analysis model that considers the influence of transient rainfall infiltration. It simulates the variations in pore water pressure and safety factors at different depths within the slope soil layer in response to different rainfall events. Based on the concept of soil saturation caused by rainfall, the mechanism of rainfall infiltration in TRIGRS is derived from the linear solution of the Richards equation proposed by Iverson [28]. The US Geological Survey (USGS) improved this mechanism to handle more complex rainfall events and boundary conditions, implementing it in the Fortran programming language.
By using automated analysis, TRIGRS calculates the potential for landslide occurrence for all slope units within a watershed under rainfall infiltration conditions. It takes into account the soil and hydrological characteristics specific to the study area and accepts various geo-hydrological parameters as input. Combining these inputs with the infinite slope theory, TRIGRS computes the safety factor (referred to as FS) for each grid to assess the slope stability over a large area.
The formula for the calculation of the grid safety factor (FS) in the TRIGRS model is given by Equation (1):
where c denotes soil cohesiveness, φ is the effective friction angle, θ represents the angle of the slope, γw and γs indicate the unit weight of water and soil, respectively, and Ψ(Z,t) denotes changes in pore pressure at various times and depths. Using Equation (1), the TRIGRS model calculates the FSs corresponding to water pressure at various depths within a given grid at different times.
Equation (1) shows that an FS below 1 signifies unstable soil conditions, with driving forces overpowering resistance, while an FS above 1 denotes stability. This study correlates safety factors with slope instability post-rainfall to map unstable zones and set warning thresholds for soil mass stability in the area.
3. Modeling the Study Region
Using geological data and rainfall simulations for the research area, the TRIGRS model calculates safety factors during rainfall events. Calibration against actual disasters, such as Typhoon Morakot, refines the geological parameters. Post-calibration, alert safety factors are estimated under the design rainfall scenario. These values, alongside alert cumulative rainfall values, are tested against real-world events, such as Typhoon Fanapi, to confirm their effectiveness.
3.1. Selection of Study Area
The study area was selected by analyzing historical disaster data from 2008 to 2015, provided by the Soil and Water Conservation Bureau (SWCB), and mapping the distribution of these events across Taiwan’s watersheds. The Gaoping River Basin, with its high incidence of historical disasters, was chosen for this study to facilitate comparisons with the large-scale research of Chien et al. [1].
Building on the insights of Chien et al. [1], who recommended township-level rainfall thresholds for landslide warnings, this study proposes a refined approach by scaling down to village-level units to enhance precision in disaster prevention. Focusing on Liugui District within the Gaoping River Basin, identified as a high-risk area in Figure 1, we delineated 12 villages as the new analytical units for a tailored, site-specific landslide risk assessment using rainfall data. This finer granularity allowed for a more nuanced analysis and targeted disaster response strategies.
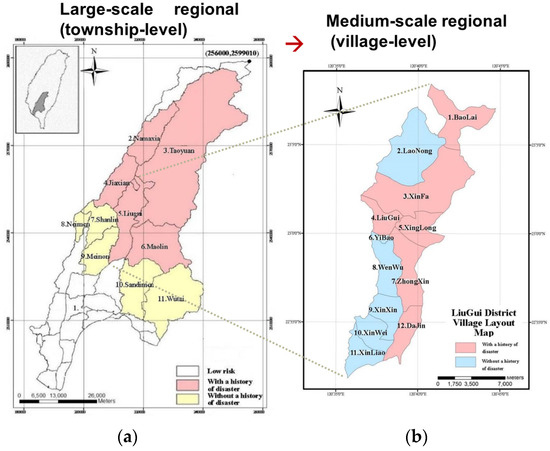
Figure 1.
Classification diagram for landslide susceptibility assessment at different scales in this study. (a) Large-scale; (b) Medium-Scale.
This study refers to the 98 Major Soil and Debris Disaster Rapid Report by the Soil and Water Conservation Bureau as a reference for historical disaster cases [37]. By overlaying the disaster points from the 2009 Typhoon Morakot event, the study area was divided into two categories, areas with disaster cases and areas without disaster cases, resulting in a total of 12 zones. Each zone was assigned a number as shown in Table 2. The geographical locations of the study area zones are depicted in Figure 1b.
Table 2.
The zone numbers and categories for the study area.
3.2. Model Parameter Processing
3.2.1. Soil Slope and Thickness
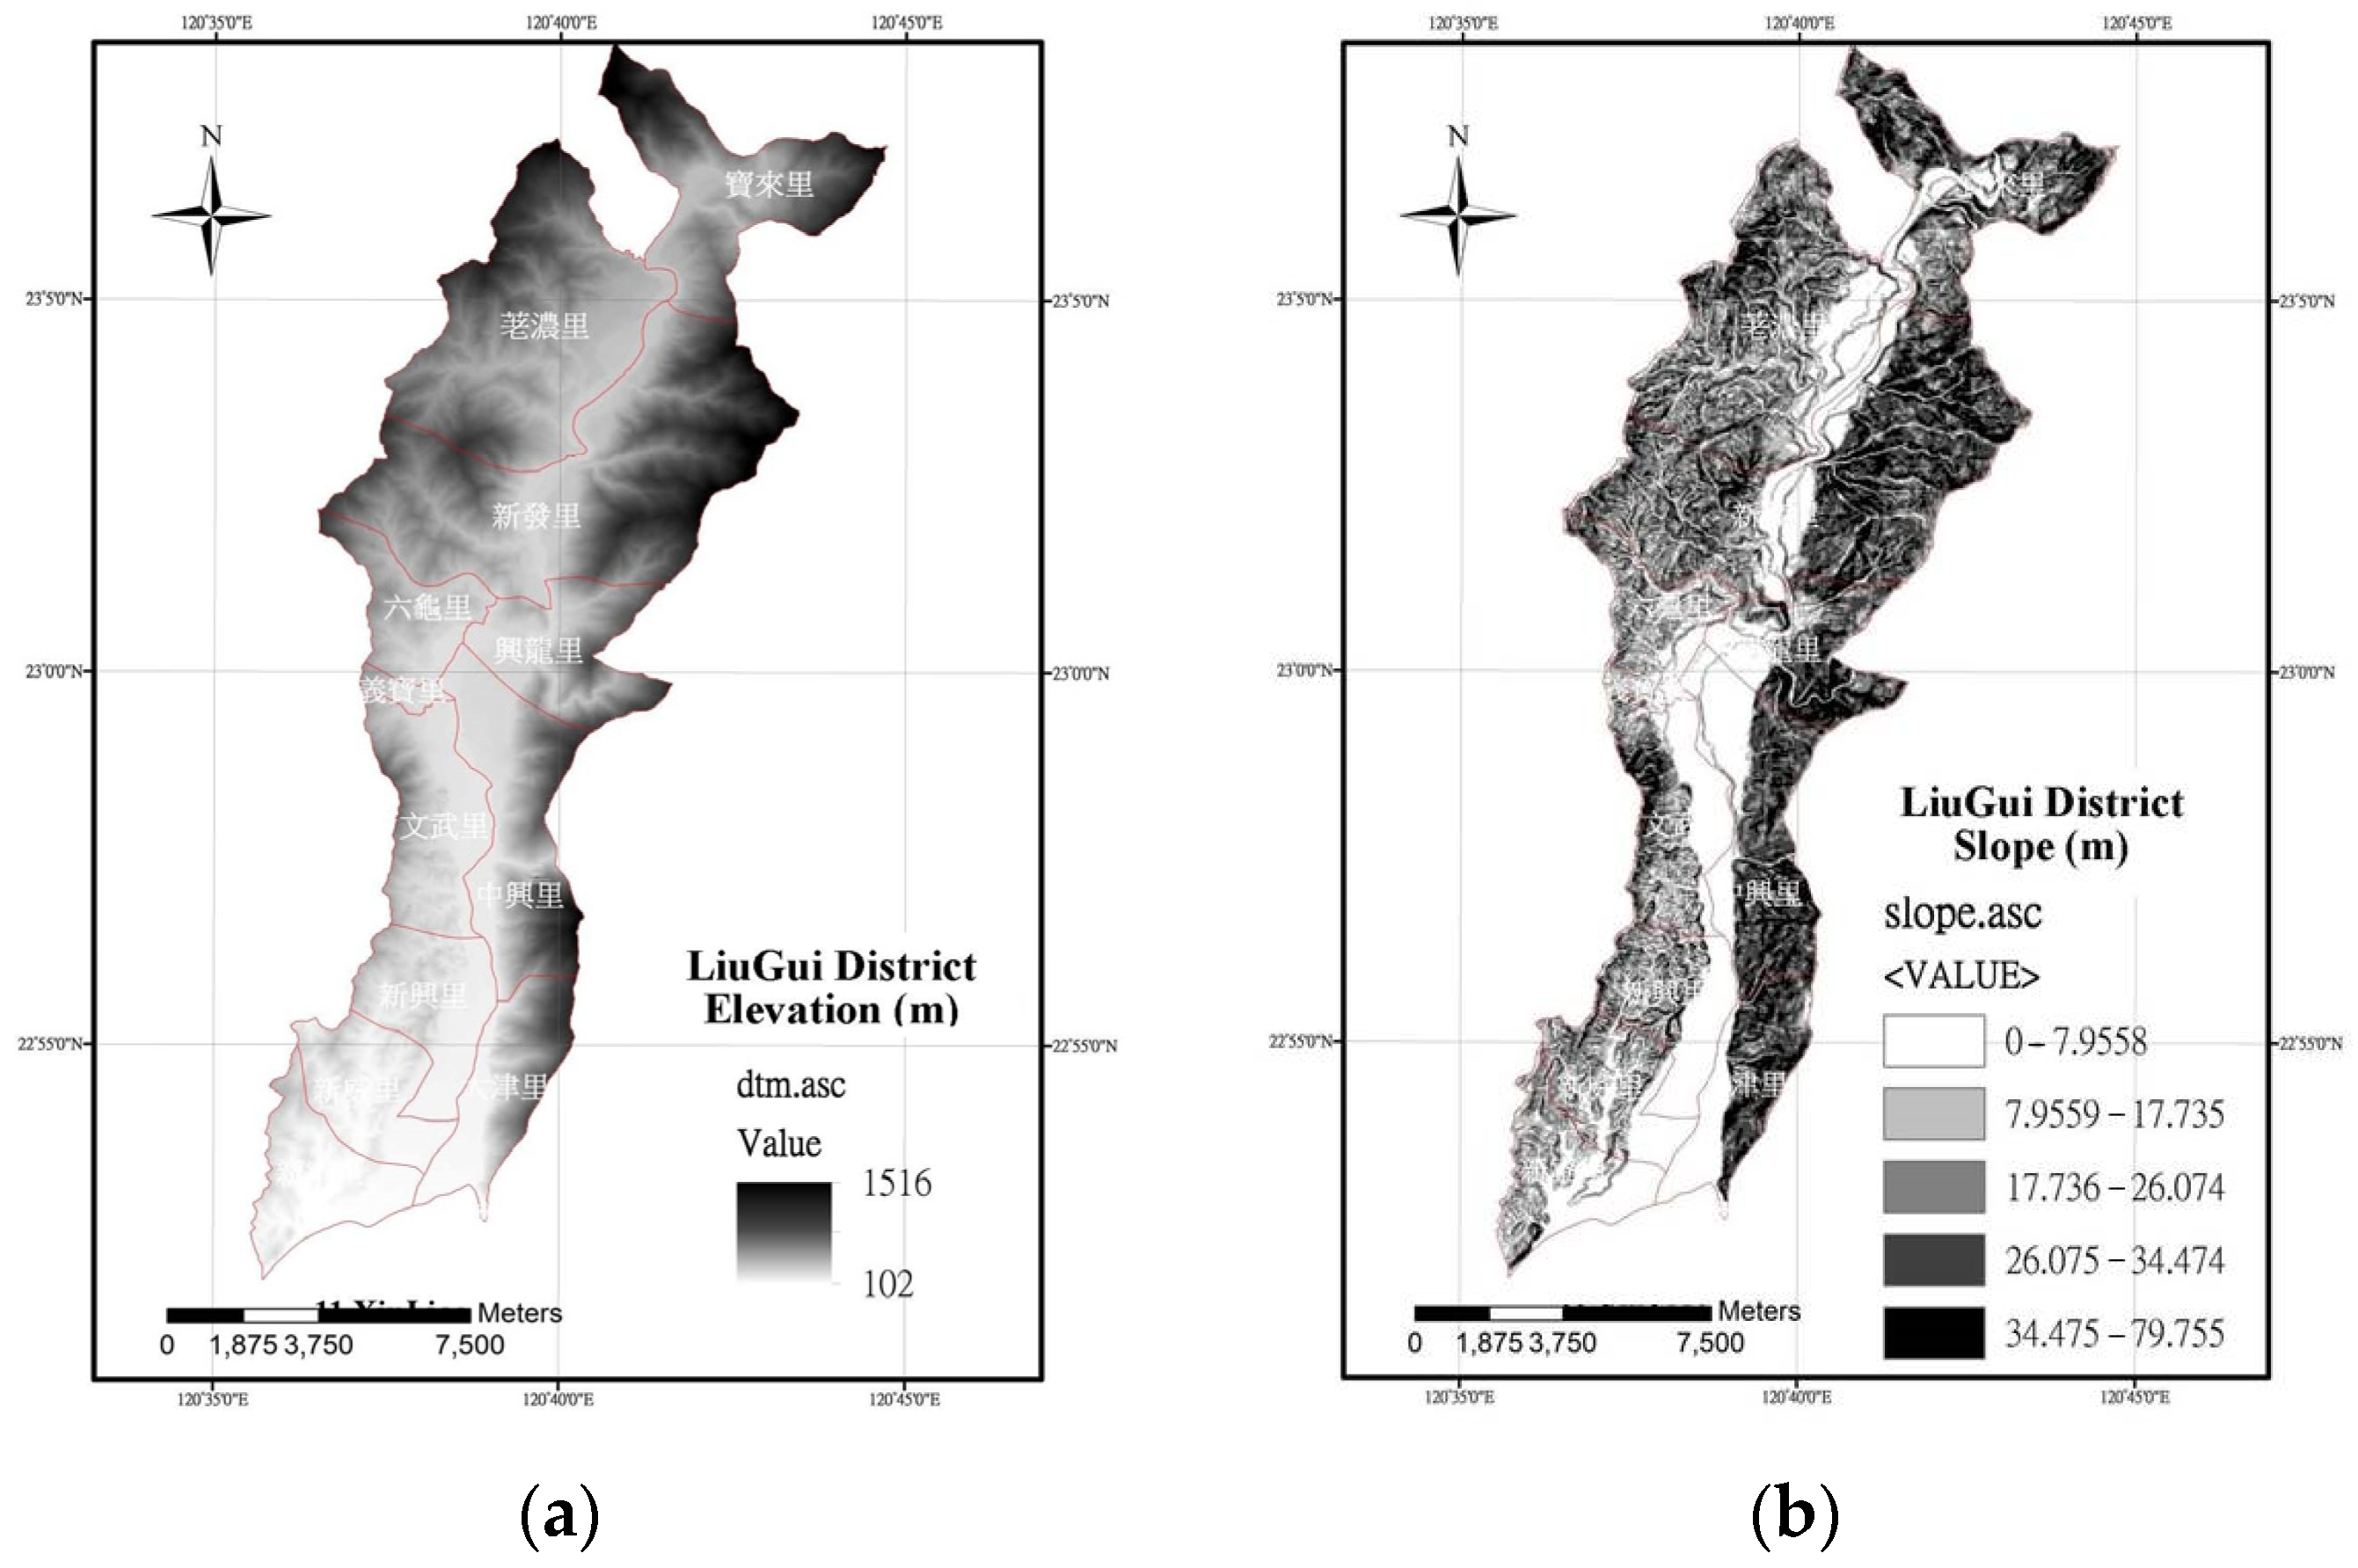
In this study, a 40 m by 40 m square grid (Raster) reflecting the elevation of the terrain of the Liugui area in the Gaoping River Basin was used for model computation. Figure 2a depicts the elevation map of the Liugui District in this study. There are two methods to obtain slope data in current regional-scale areas: field surveys and the calculation of the slope using Digital Elevation Models (DEMs). According to the research compiled by Wang et al. [38], both methods have their advantages and disadvantages. In this study, a DEM was chosen to calculate the slope. By utilizing the elevation data of the DEM itself and employing spatial analysis tools in a GIS platform, the elevation data of the numerical grid reflecting the elevation of the terrain were converted into the average slope. Degrees (°) were chosen as the slope classification unit for subsequent analyses, in conjunction with the physical model. The distribution of the slope in the Liugui area of this study is illustrated in Figure 2b.

Figure 2.
(a) Elevation Map. (b) Slope Map of the Liugui District in the Gaoping River Basin. (Please refer to Figure 1 for the English name of the village.)
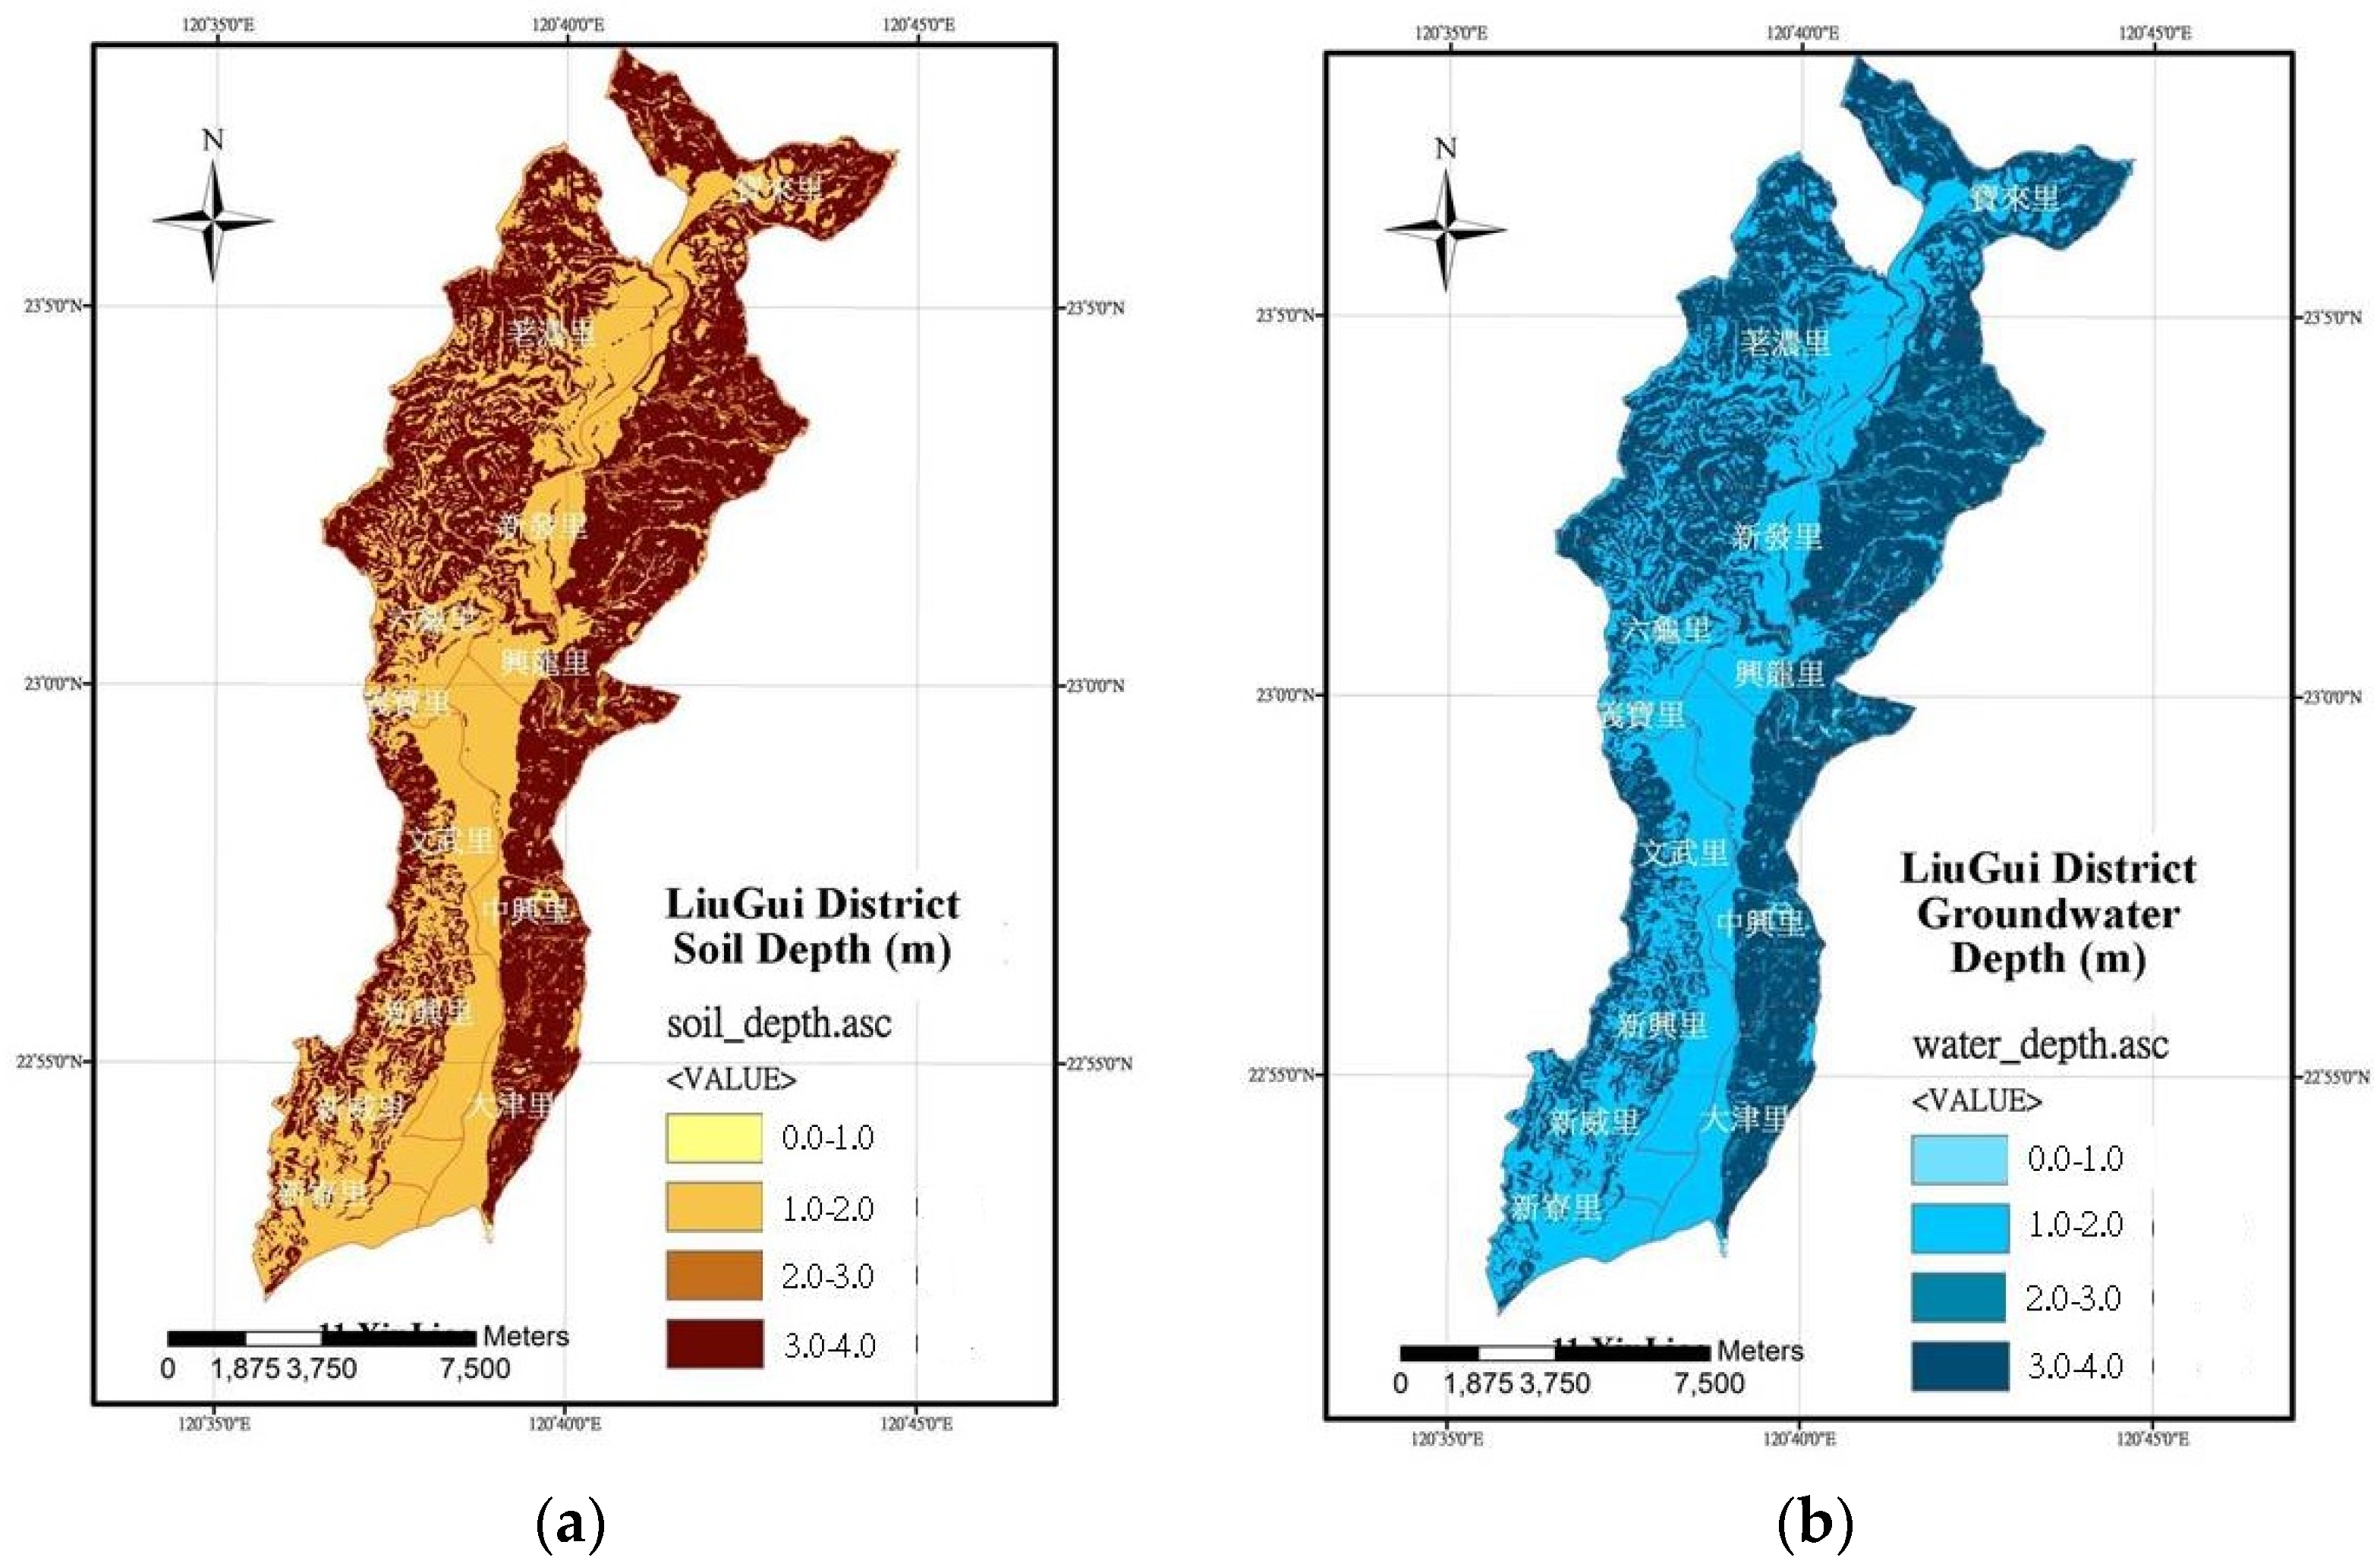
In terms of soil thickness, since the focus of this study was on slope failures occurring in the superficial weathered soil of mountainous areas, it was necessary to estimate the possible thickness of the topsoil. According to a survey conducted by the Central Geological Survey, Ministry of Economic Affairs (MOEA), the soil depth in mountainous regions varies from 0.25 to 3.6 m, with a concentration between 0 and 2 m [4].
Chen et al. used an empirical formula based on the product of the landslide area and depth to estimate the landslide volume in a watershed [39]. The National Science and Technology Center for Disaster Reduction (NCDR) applied the results derived by Chen et al. and tabulated them in integer format, as shown in Table 3 [40]. Taking into account suitability for Taiwan’s conditions, this study subsequently used the depth table corresponding to each slope class from the NCDR to estimate the slope. The distribution of the soil depth in the Liugui area of this study is illustrated in Figure 3a.
Table 3.
Slope and depths used by NCDR.

Figure 3.
(a) Elevation Map. (b) Slope Map of the Liugui District in the Gaoping River Basin.
3.2.2. Groundwater Depth and Flow Direction
Considering that the soil covering mountainous areas is mostly composed of colluvium, rainfall events lead to infiltration and a subsequent rise in the groundwater level. The fresh bedrock beneath the surface soil has very low permeability, causing the infiltrated rainwater to accumulate and increase at the soil–rock interface [41,42,43]. Reviewing the methods for the estimation of regional initial groundwater levels, reference was made to the data compiled by Chien et al. [1], as shown in Table 4. Therefore, in this study, the initial groundwater depth was set to be the same as the soil depth. The distribution of the groundwater depth in the study area, Liugui District of the Gaoping River Basin, is illustrated in Figure 3b.
Table 4.
Compilation of Initial Groundwater Level Depth Estimation Methods (Chien et al. [1]).
The TRIGRS model also includes the capability to simulate surface runoff. In this study, the flow direction analysis tool within the GIS platform was utilized to process the Digital Terrain Model (DTM) layer and generate surface flow direction data for the study area. The resulting data were encoded in the Arc/Info format. Figure 4 represents the flow direction map of the Liugui District in the Gaoping River Basin, which is the focus area of this section.
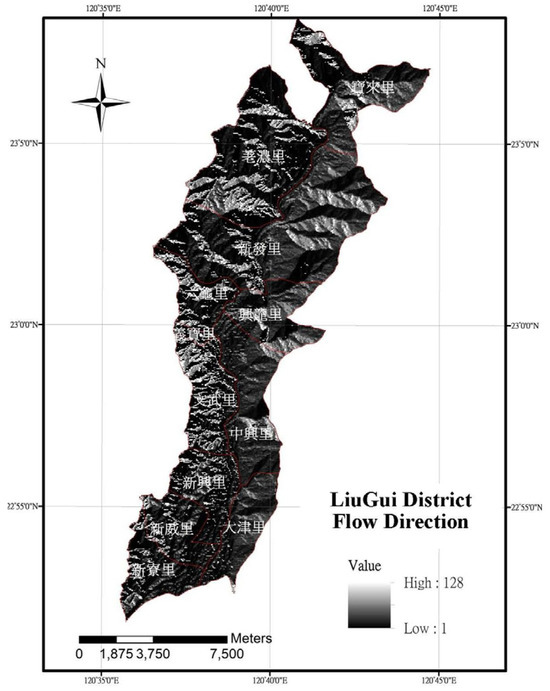
Figure 4.
Flow Direction Map of the Liugui District in the Gaoping River Basin.
3.2.3. Soil Parameter Processing
For the initial setting of soil parameters such as the cohesion, friction angle, unit weight, permeability coefficient, diffusion coefficient, and infiltration coefficient in the study area, the CGS watershed investigation and assessment program were referred to [2]. Various soil property parameter layers were overlaid with the distribution characteristics of the study area (see Figure A1). The average values of the soil parameters within each zone were used to set the initial soil mechanical parameters. However, subsequent calibration procedures are required to obtain parameter sets that better match the actual physical properties on-site. Please note that these initial values serve as a starting point, and further calibration is necessary to obtain more accurate soil parameter values that reflect the actual conditions in the field.
3.2.4. Execution Process of the TRIGRS Model for Slope Stability
In the TRIGRS model’s root directory, there are several subfolders. Parameters needed for the study, once organized and converted to ASCII format, are stored in the “data” folder. Rainfall data files, if available, go into the “data2” folder, or they can be input manually in the execution document. The process starts with running the TopoIndex.exe tool, which converts flow direction data from Arc/Info format to TRIGRS’s format and ensures correct parameter and output data setup in the “tr_in.txt” file. After this setup, the TRIGRS model can be executed as outlined in Figure 5. For visual references like Figure 6 and Figure 7, consulting the original research or study materials is recommended, as they are not present in this text-based explanation.
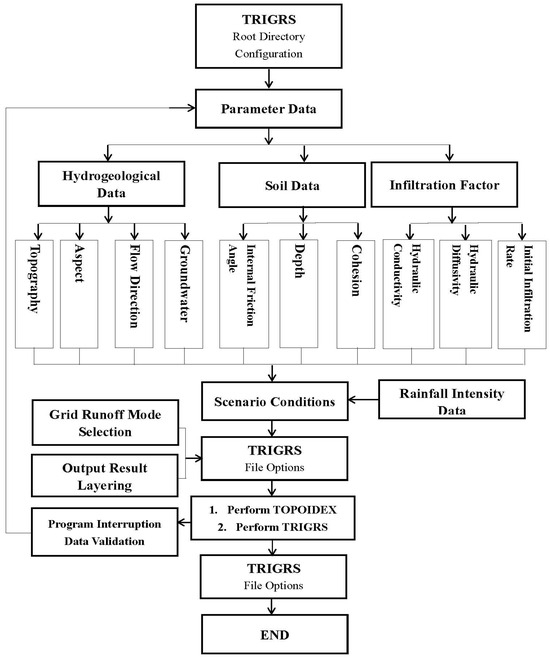
Figure 5.
Flowchart of the TRIGRS Model Execution Process.
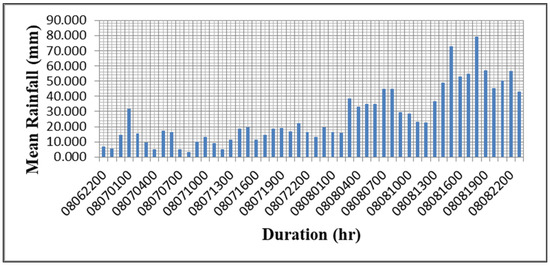
Figure 6.
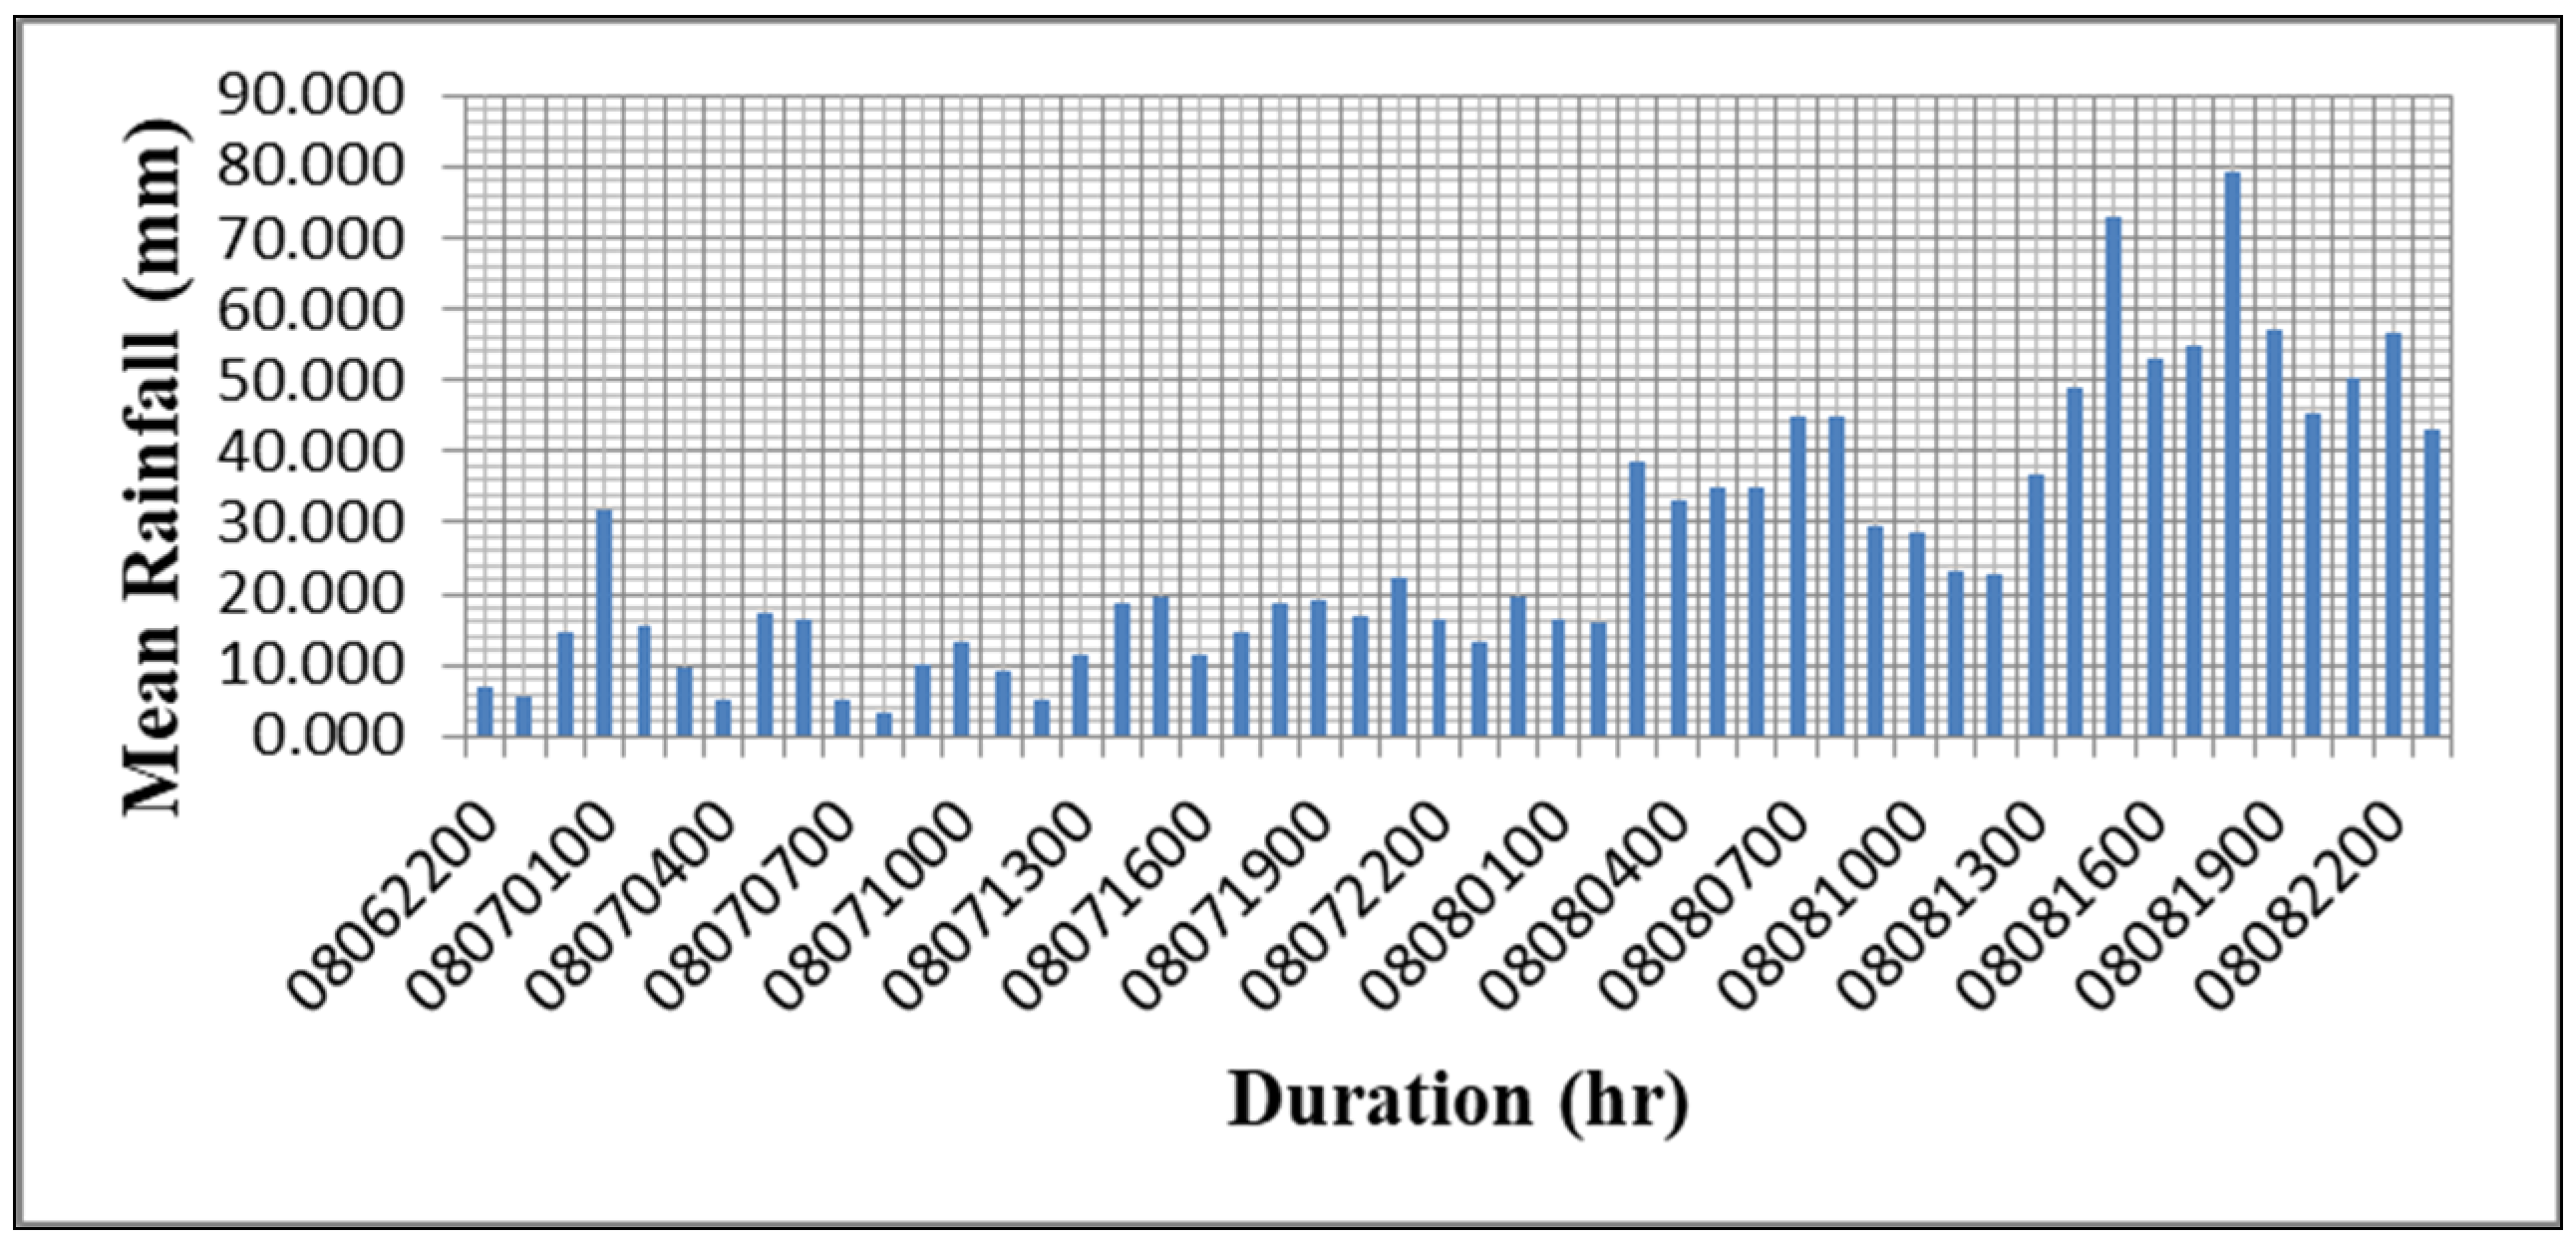
Rainfall Statistics in the Liugui Area of the Gaoping River Basin during Typhoon Morakot.

Figure 7.
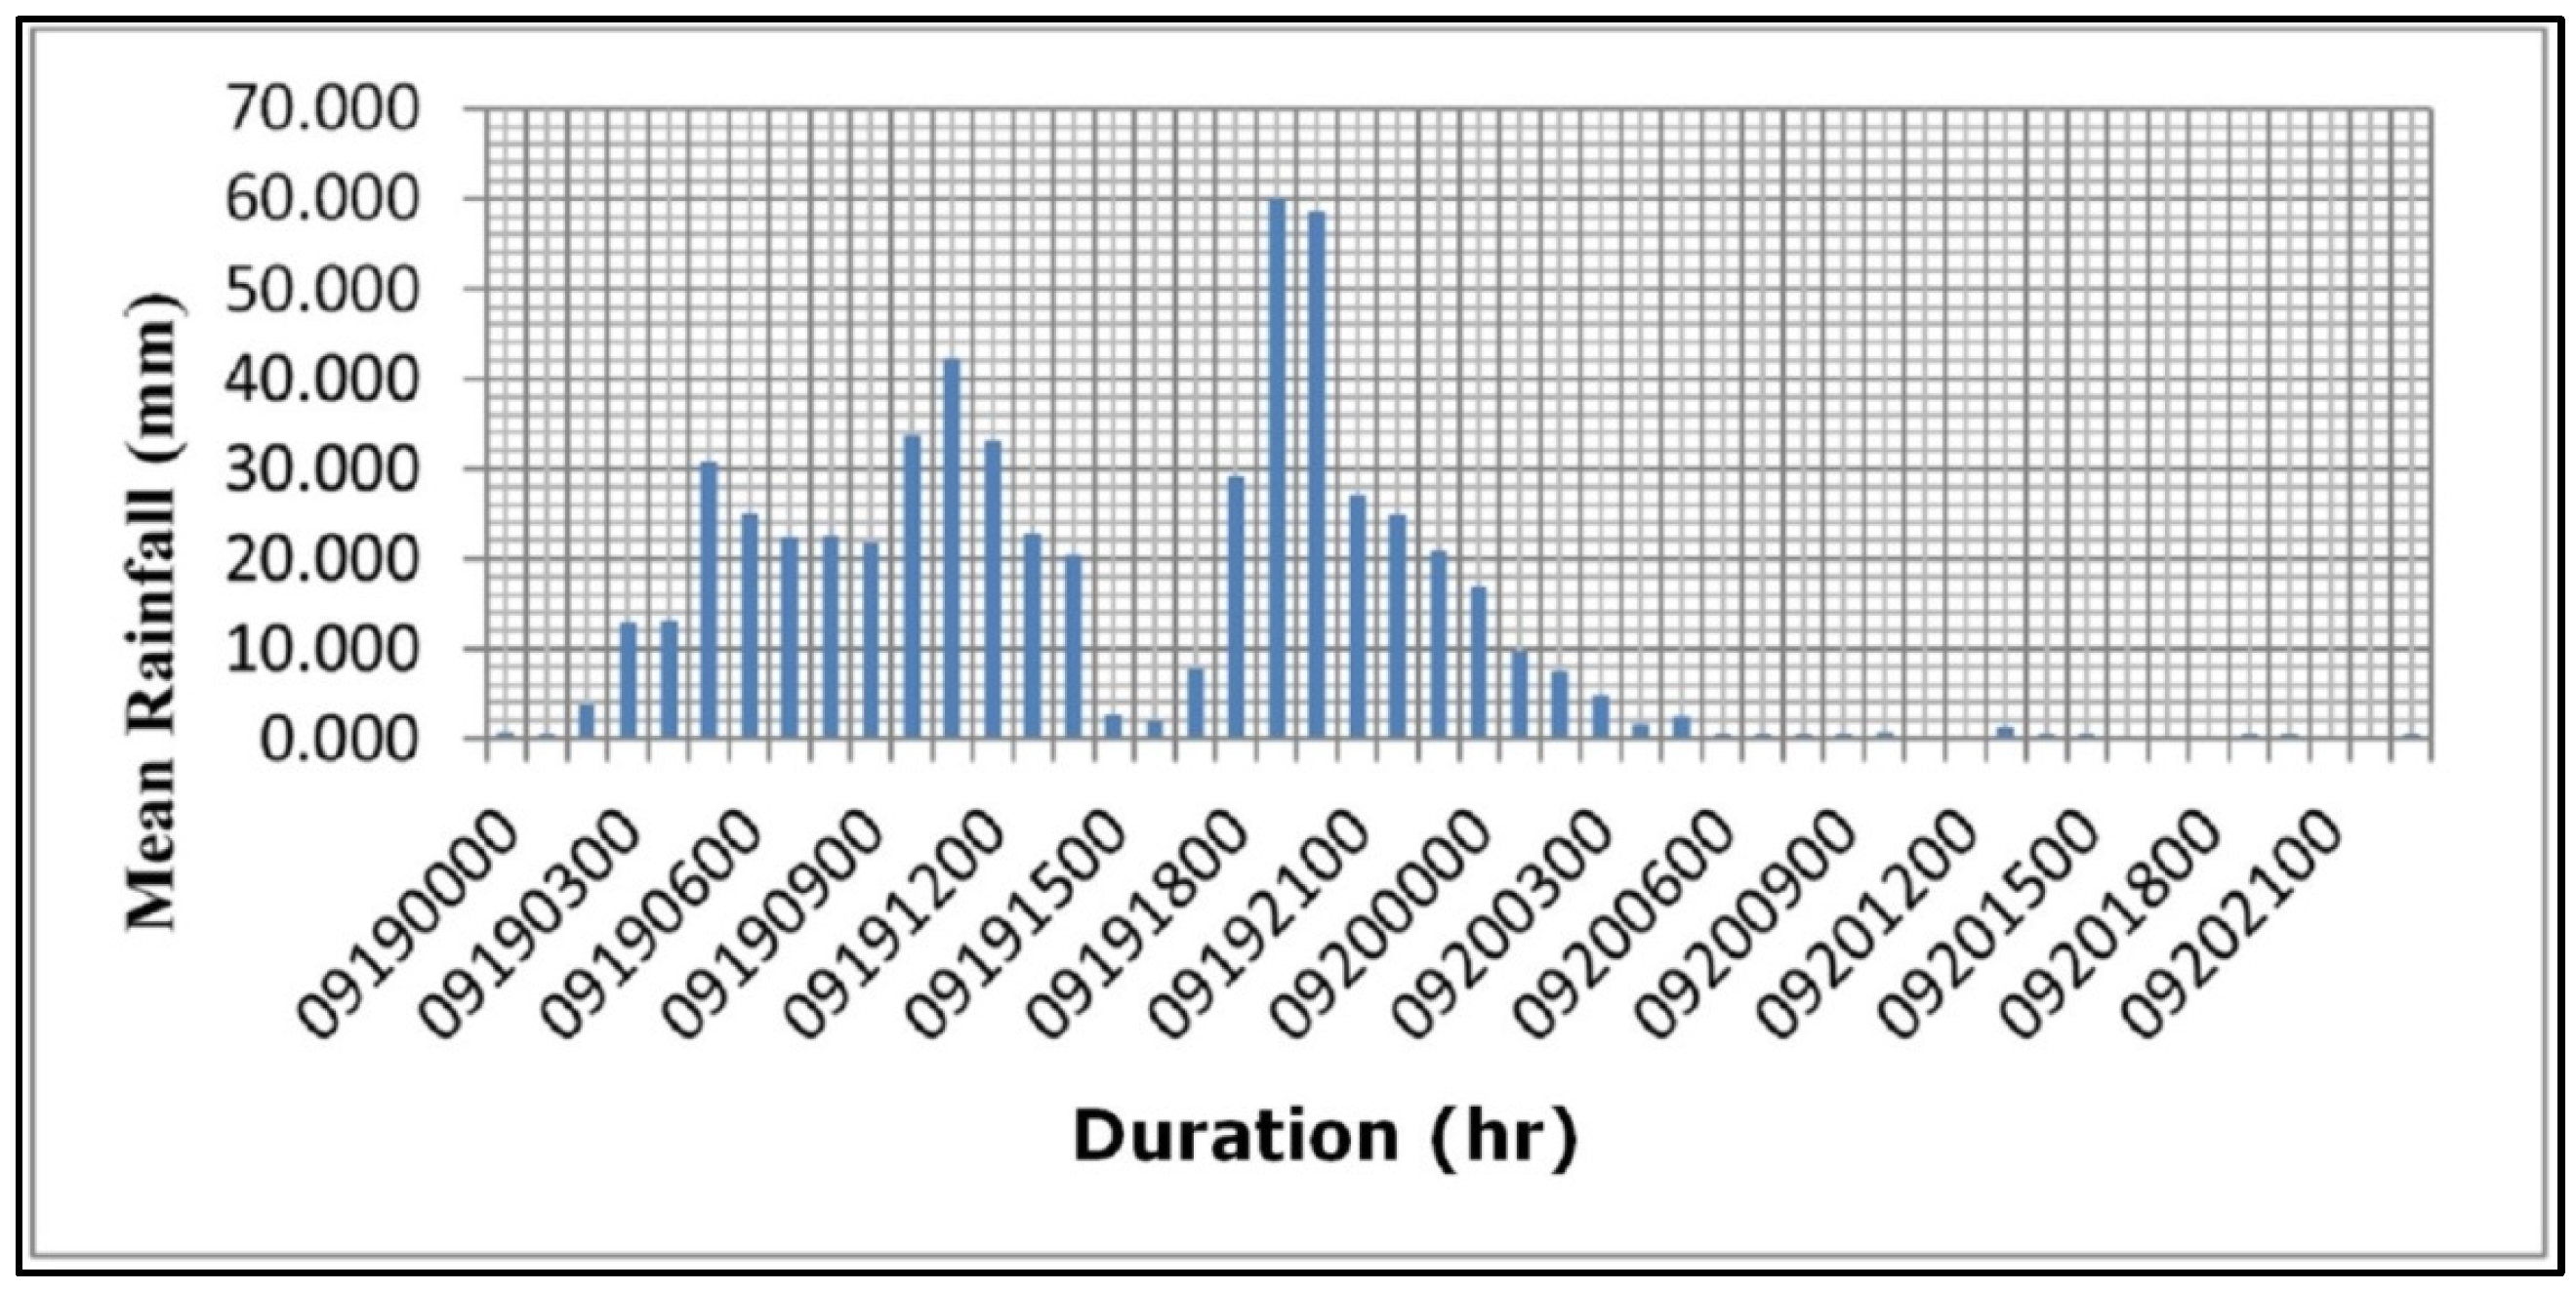
Rainfall statistics of No. 05 Liugui District (during Typhoon Fanapi scenario).
3.3. Calibration of Rainfall Data
In this study, rainfall data collected during Typhoon Morakot were obtained using the QPESUMS system, which provides rainfall distribution information. The rainfall data were overlaid on the areas with and without landslide occurrences in the study area of the Gaoping River Basin to simulate the rainfall variations during Typhoon Morakot. The spatial distribution of rainfall was then obtained by calculating the average rainfall for all grid cells in each zone. Figure 6 illustrates the statistical representation of the average rainfall in the Liugui area of the Gaoping River Basin.
3.4. Suitability Assessment of Alert Thresholds: Rainfall Data Case Study
In this study, a demonstration scenario was used to assess the suitability of the alert thresholds. The rainfall data from Typhoon Fanapi in 2010 were selected for study. Through the simulation of the second typhoon scenario, it was possible to evaluate the reasonableness of the estimated safety factor and cumulative rainfall thresholds proposed in this study. The QPESUMS system was again used to simulate the rainfall distribution, and the average rainfall for all grids in Liugui District during the typhoon period was taken to simulate the rainfall variation in the study area during Typhoon Fanapi. The results are shown in Figure 7.
4. Analysis and Evaluation of Landslide Area
4.1. Model Calibration
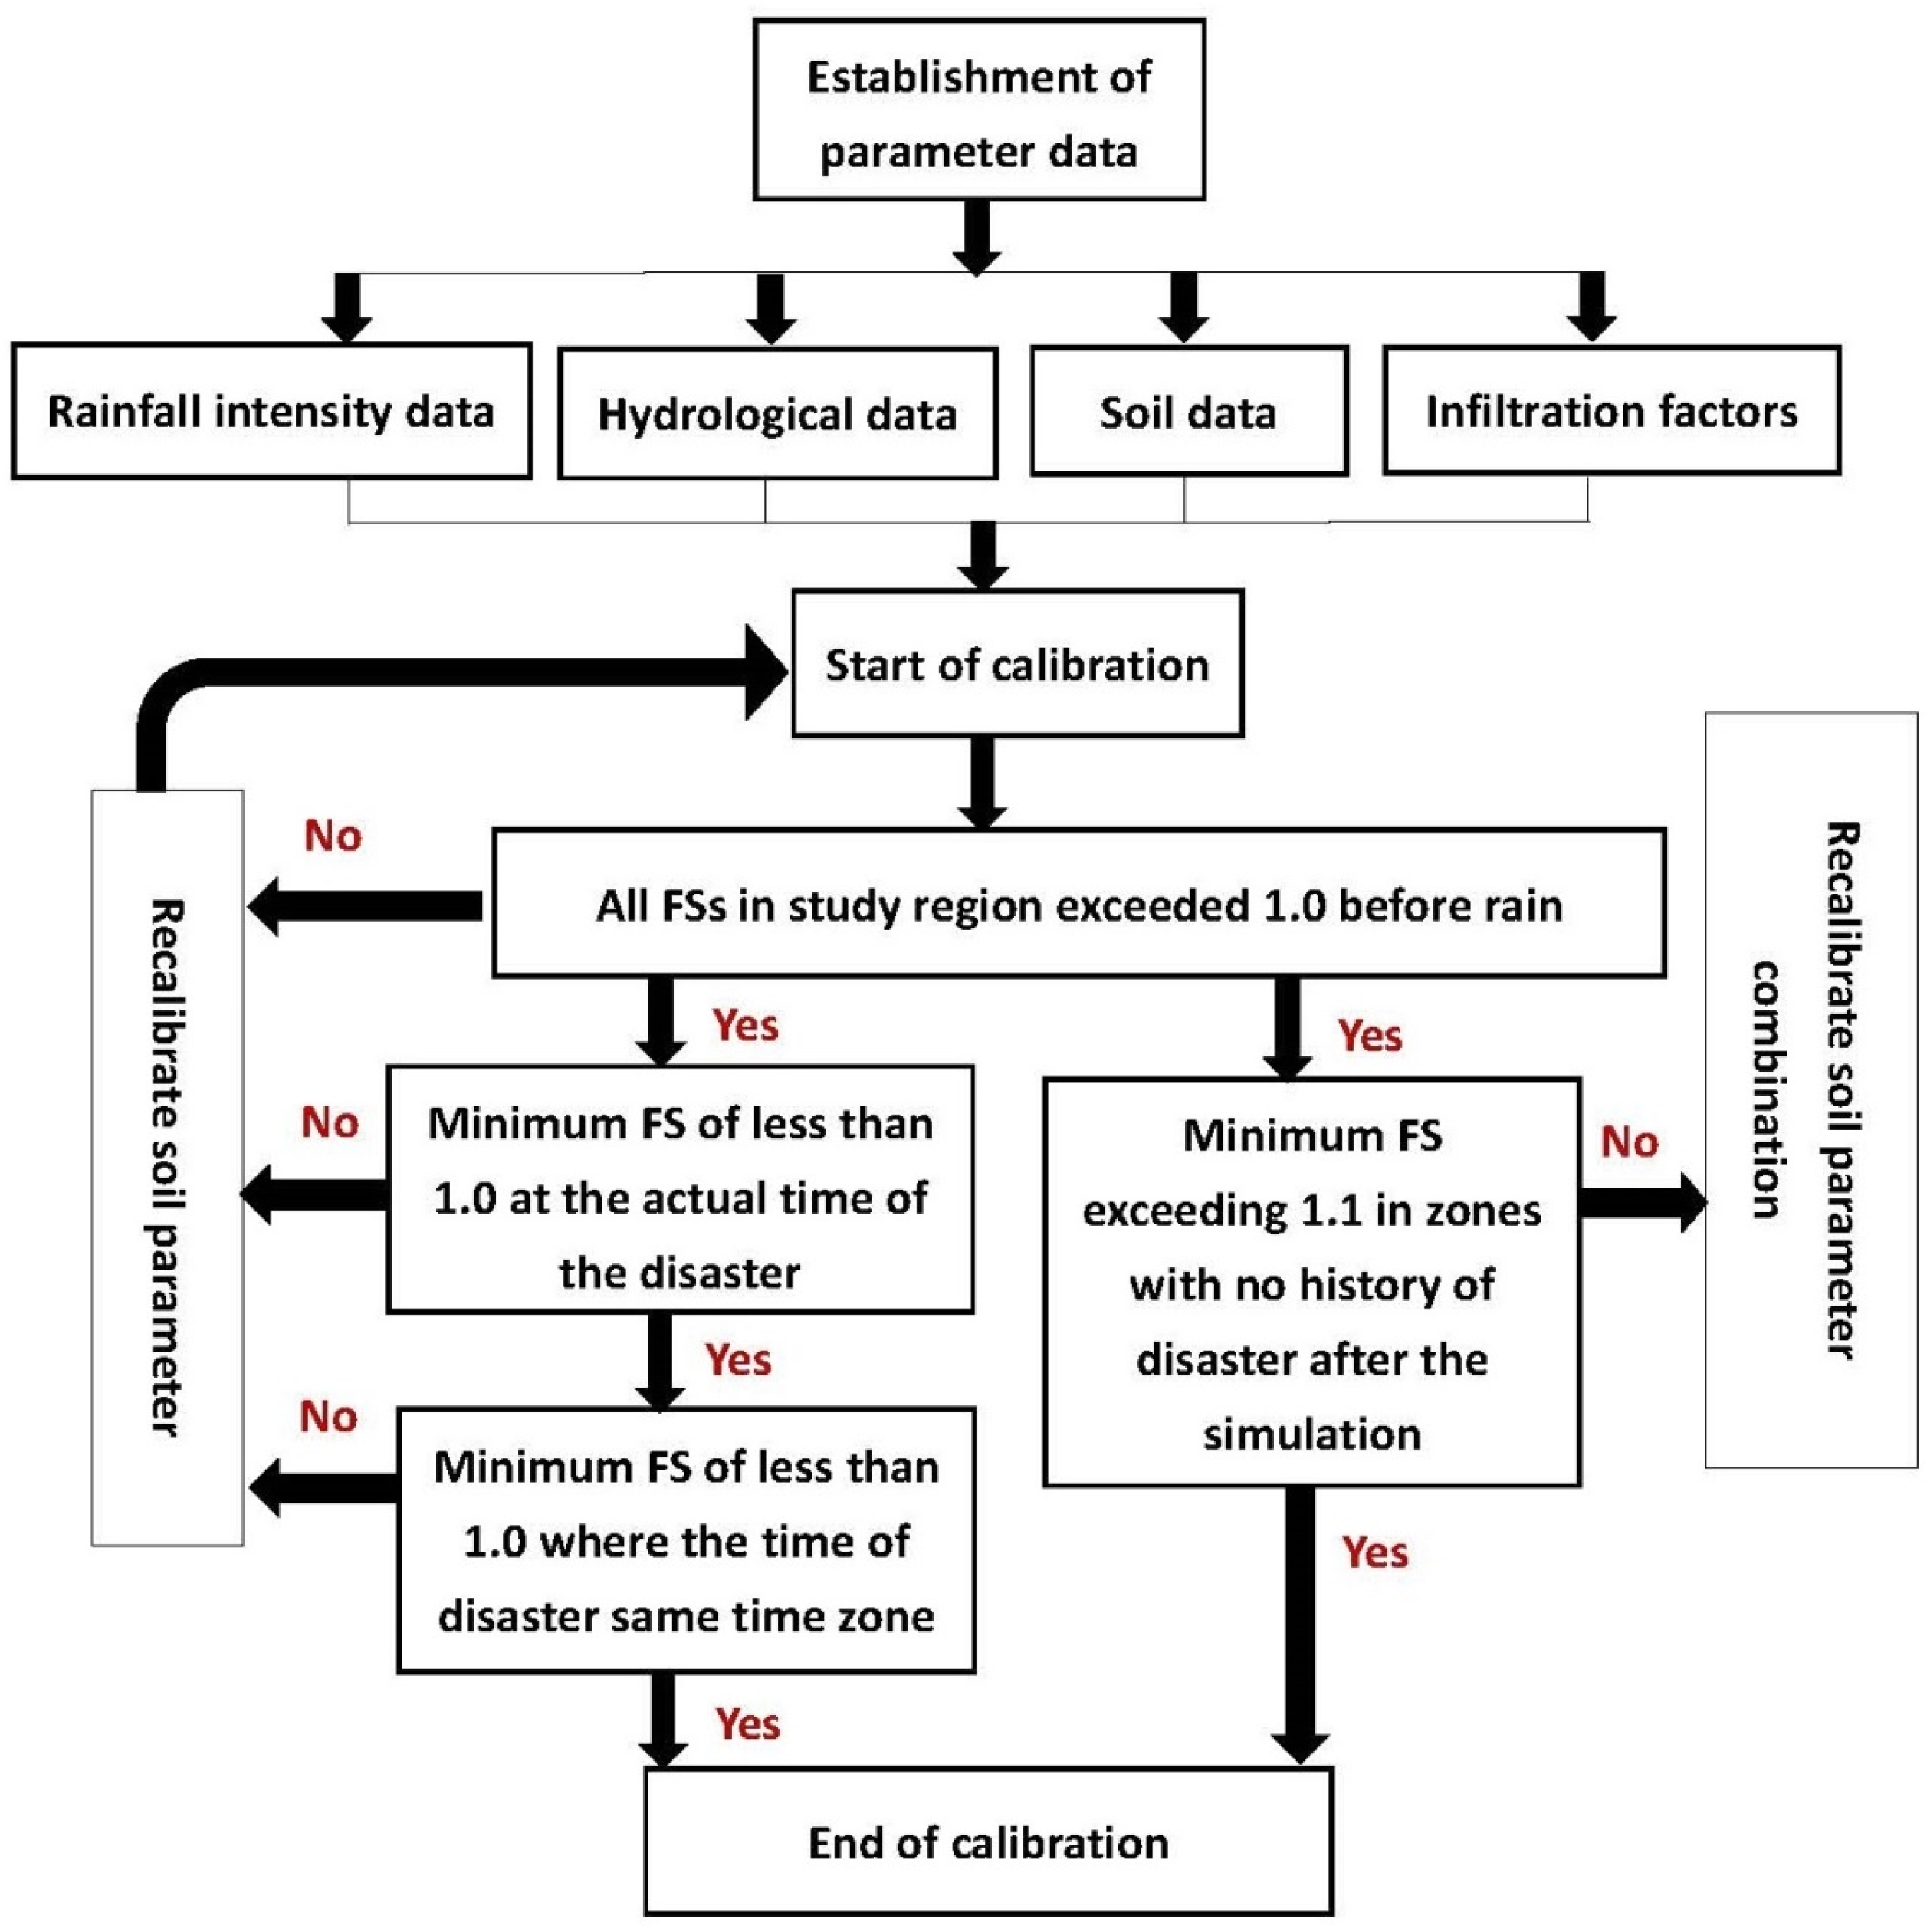
In the current research, the calibration of parameters was carried out by aligning the timing of actual landslide incidents with that of the simulation outputs. Geological parameters were fine-tuned through multiple iterations to align with a minimum safety factor (FS) falling below the threshold of 1.0, coinciding with the actual timing of slope collapses. The calibration methodology employed here was informed by the protocols established in the investigation and assessment program of the Central Geological Survey [2]. The calibration process is illustrated in Figure 8. By following these calibration principles, the geological parameters for each study area were calibrated, resulting in a set of mechanical parameters that approximated the in situ soil conditions.
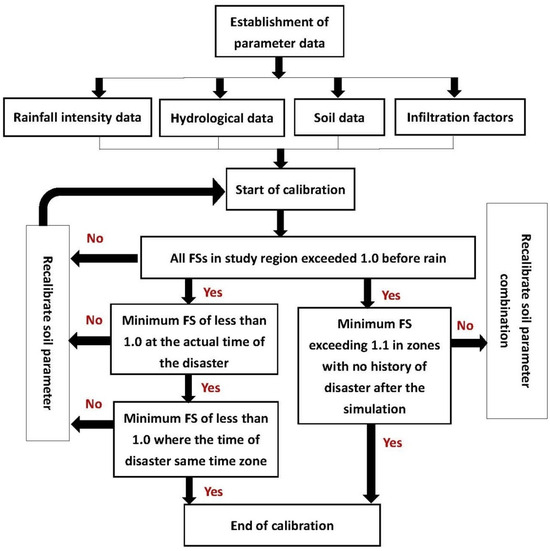
Figure 8.
Parameter calibration procedure used in the Transient Rainfall Infiltration and Grid-Based Regional Slope-Stability (TRIGRS) model [1].
In addition, this study also referred to the results of previous sensitivity analyses conducted on the geological parameters in the study area, and the soil parameters were iteratively adjusted during the calibration process. The Ministry of the Interior’s Construction and Planning Agency has conducted sensitivity analyses on various parameters of shallow landslide models [47]. The results indicated that the effective cohesion of the soil had the most significant influence on the variation in the factor of safety (FS) after rainfall infiltration. Therefore, in the subsequent parameter calibration process, this study focused on iteratively adjusting the effective cohesion of the soil as the main parameter, with other parameters as secondary considerations.
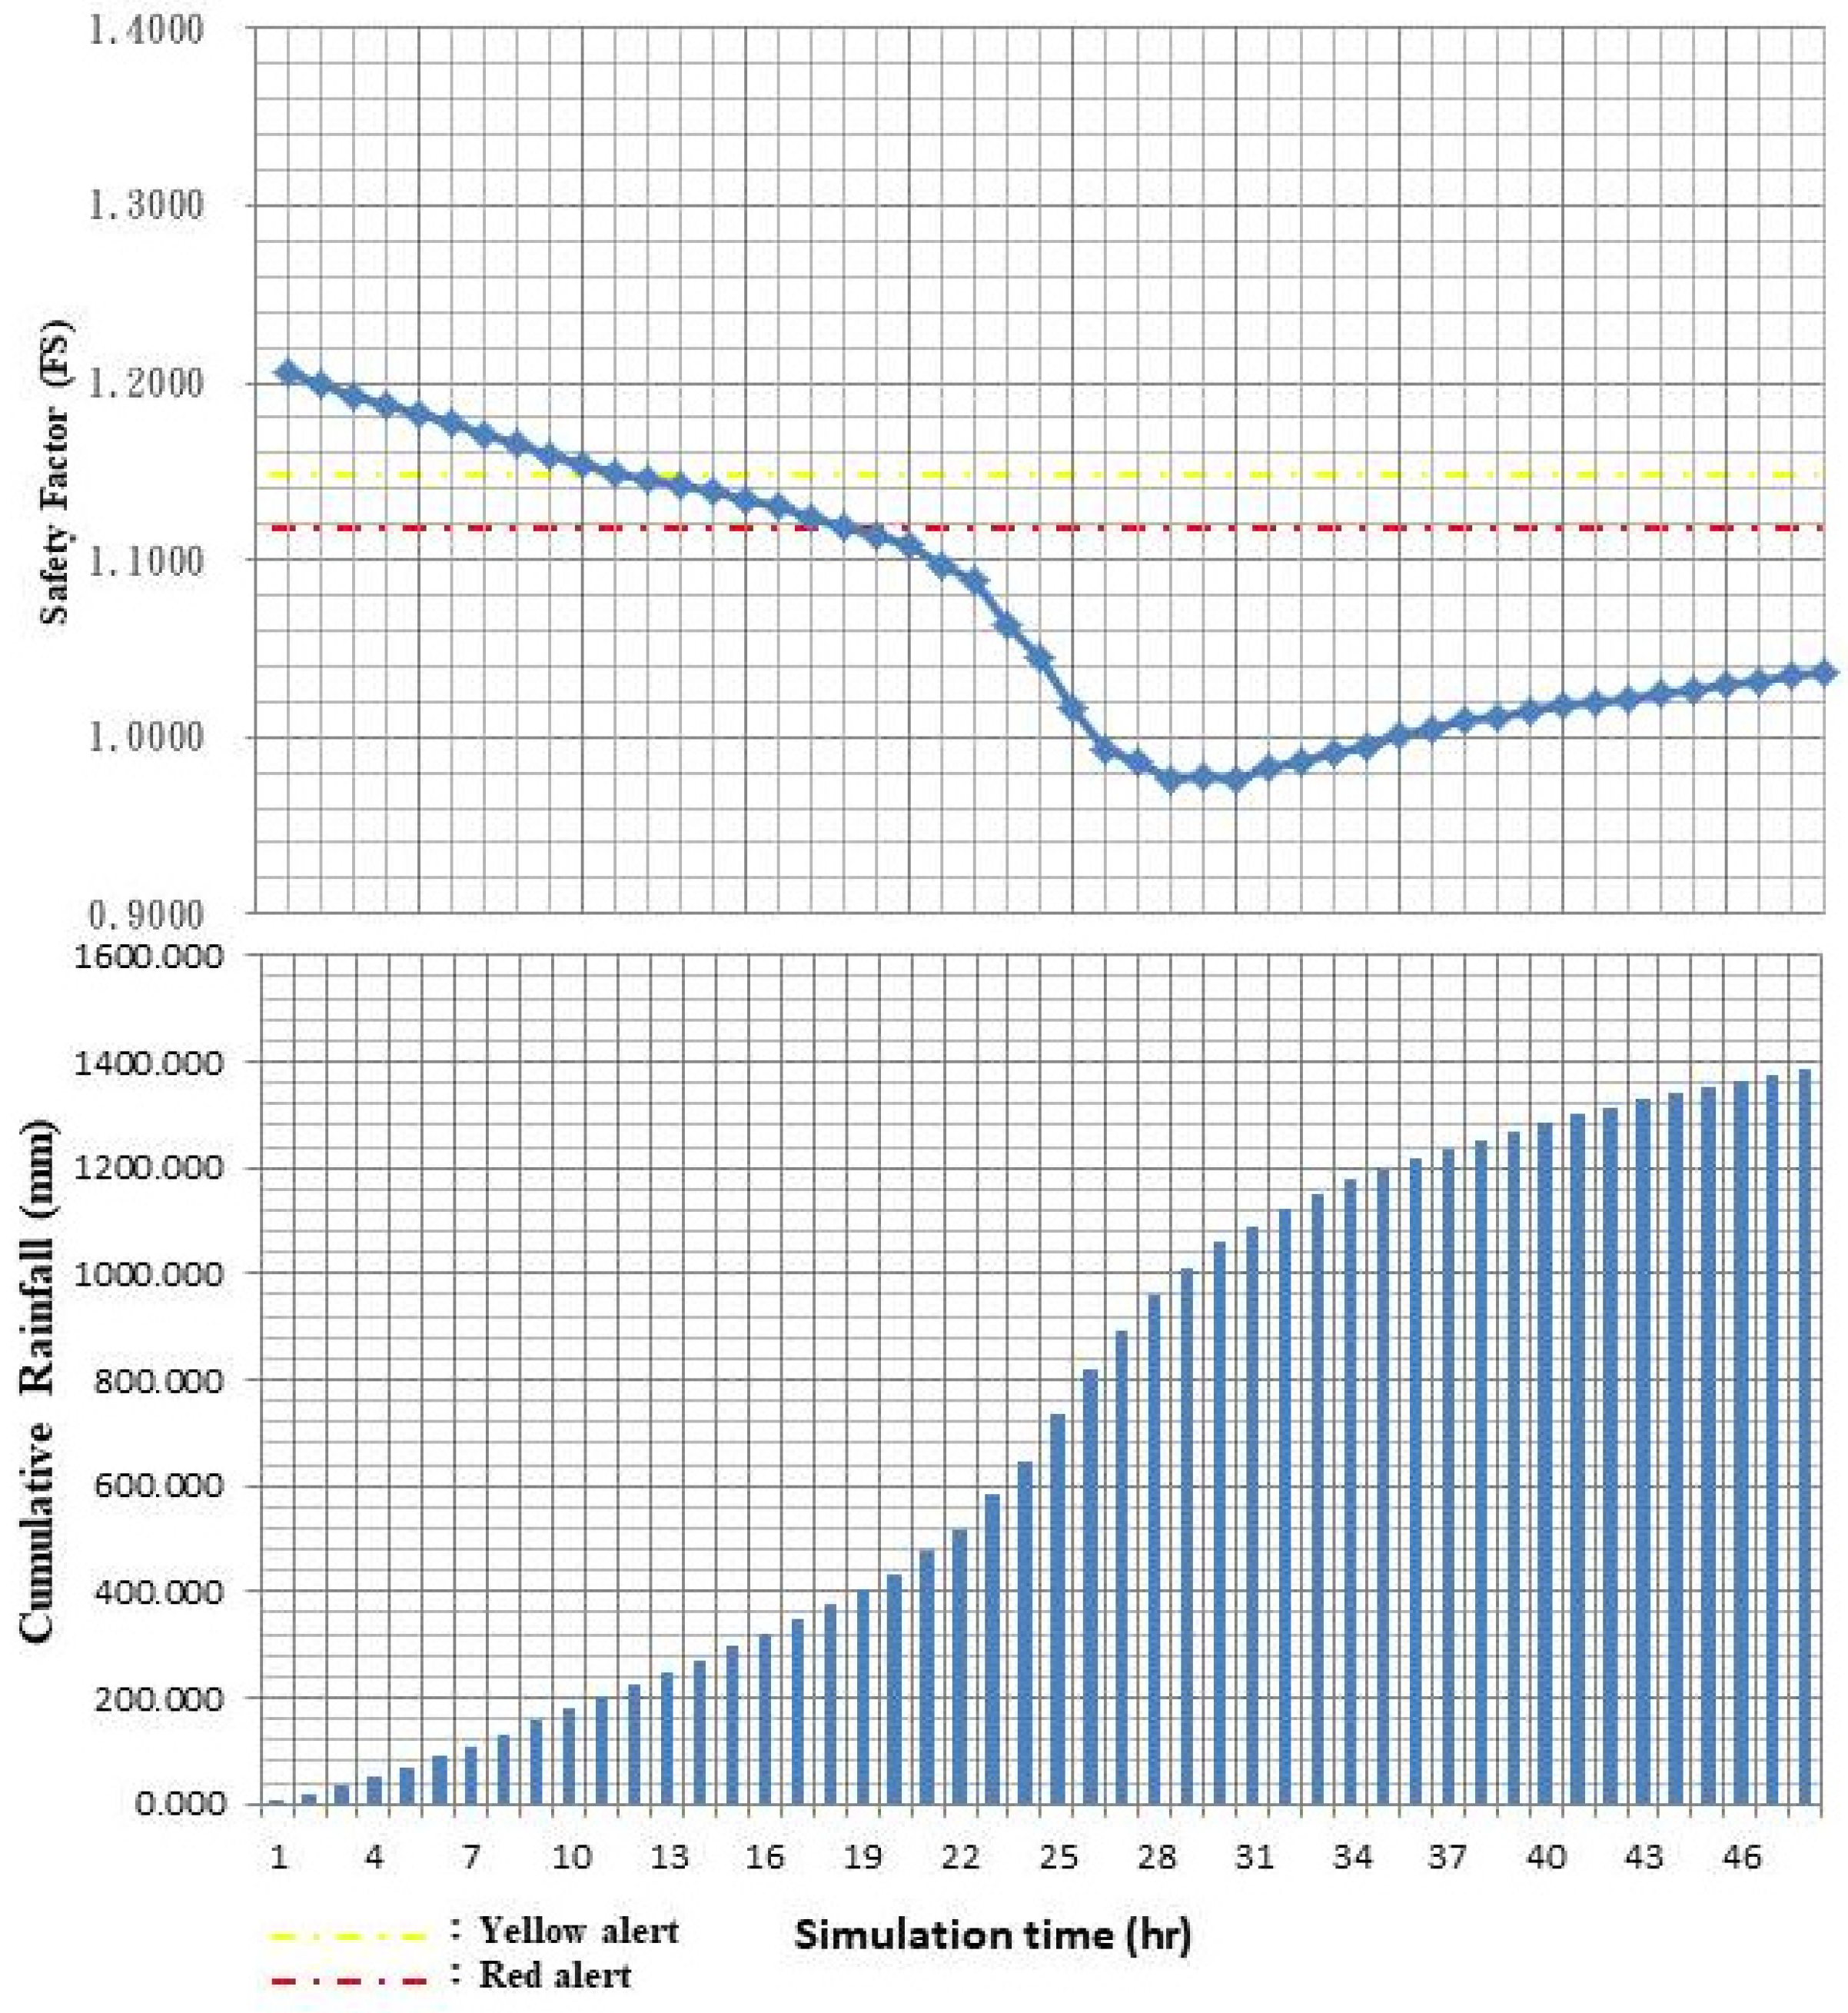
This research involves calibrating soil physical parameters for different study areas, with a focus on assessing landslide risks during Typhoon Morakot. The calibration results, summarized in Figure 9, generally meet the requirements, except for Yibao Village (Zone 06). This area’s small size and moderate slope limit the model’s sensitivity, leading to less accurate calibration. As a workaround, Yibao Village’s parameters were assumed to be the same as the adjacent Wenwu Village. The calibrated parameters effectively reflect the in situ geological conditions, as indicated in Table 5. These calibrated parameters, along with variations in the Factor of Safety (FS) over time and their correlation with cumulative rainfall, are crucial for evaluating landslide warning safety factors in the study areas.
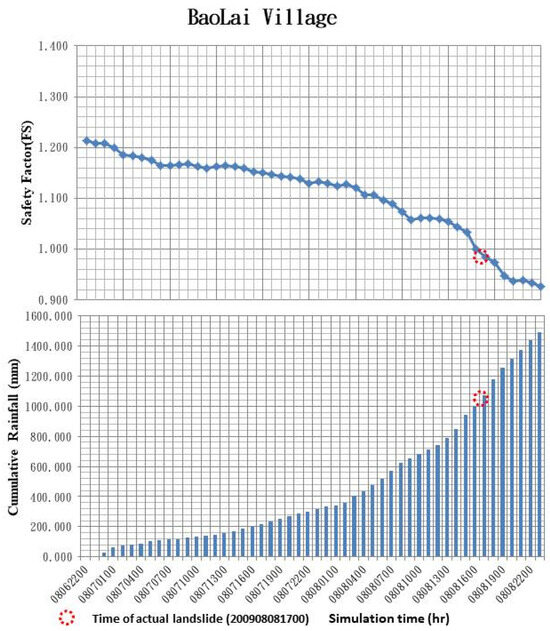
Figure 9.
Variation in Factor of Safety in Baolai Village (#01 Parameter Zone) in Liugui District.
Table 5.
Parameters Used for Calibration in Baolai Village (#01 Parameter Zone) in Liugui District.
Through the aforementioned calibration steps, soil physical parameter sets that closely resemble in situ conditions in each research zone can be obtained. The variations in the FS over time and their relationships with the cumulative rainfall can be used to assess the landslide warning safety factors within the study area, as described in this section.
4.2. Thresholds for Landslide Warnings
Taking into account the response time required for each level of warning FS, it is recommended to retain the red alert for approximately 12 h and the yellow alert for approximately 24 h. Therefore, based on the statistical results obtained from the above model execution, this study suggests that the red alert FS for the Liugui area in the Gaoping River Basin should be set at 1.12, while the yellow alert FS should be set at 1.15, as determined through the deterministic approach. These warning FS values can be used by central or local disaster response units to assess the safety of the Liugui area in the Gaoping River Basin during rainfall events. Different response measures can be implemented based on the different alert levels. Table 6 presents the timeline during Typhoon Morakot in which the study area’s Factor of Safety (FS) dropped to various levels, as simulated for the typhoon. Table 7, on the other hand, compiles the time intervals between each FS level and the actual occurrence of landslides in the disaster area.
Table 6.
Simulation time between various factor of safety (FS) levels and thresholds for zones with a history of disasters (simulating the scenario of Typhoon Morakot).
Table 7.
Simulation time between various FS variations for zones with a history of disasters (simulating the scenario of Typhoon Morakot).
Taking into account the response time required for each level of warning FS, it is recommended to retain the red alert for approximately 12 h and the yellow alert for approximately 24 h. Therefore, based on the statistical results obtained from the model execution, this study suggests using the deterministic approach to evaluate the red alert FS for the Liugui area in the Gaoping River Basin, which is 1.12, and the yellow alert FS, which is 1.15.
The assessed warning FS values can be utilized by central or local disaster response units to assess the safety of the Liugui area in the Gaoping River Basin following the onset of rainfall events. Different levels of response measures can be implemented based on the designated alert levels.
4.3. Cumulative Rainfall Thresholds for Landslide Warnings
In this study, the assessment of landslide warnings during rainfall was conducted by using design rainfall patterns that were representative of the rainfall characteristics in the Gaoping area. The TRIGRS model was employed to simulate continuous 48 h rainfall in areas affected by landslides. The variation in the FS over time was observed, and the accumulated rainfall corresponding to the red and yellow alert FS values was identified as the cumulative rainfall warning value for each specific area.
4.3.1. Assessment Results of Cumulative Rainfall Warning
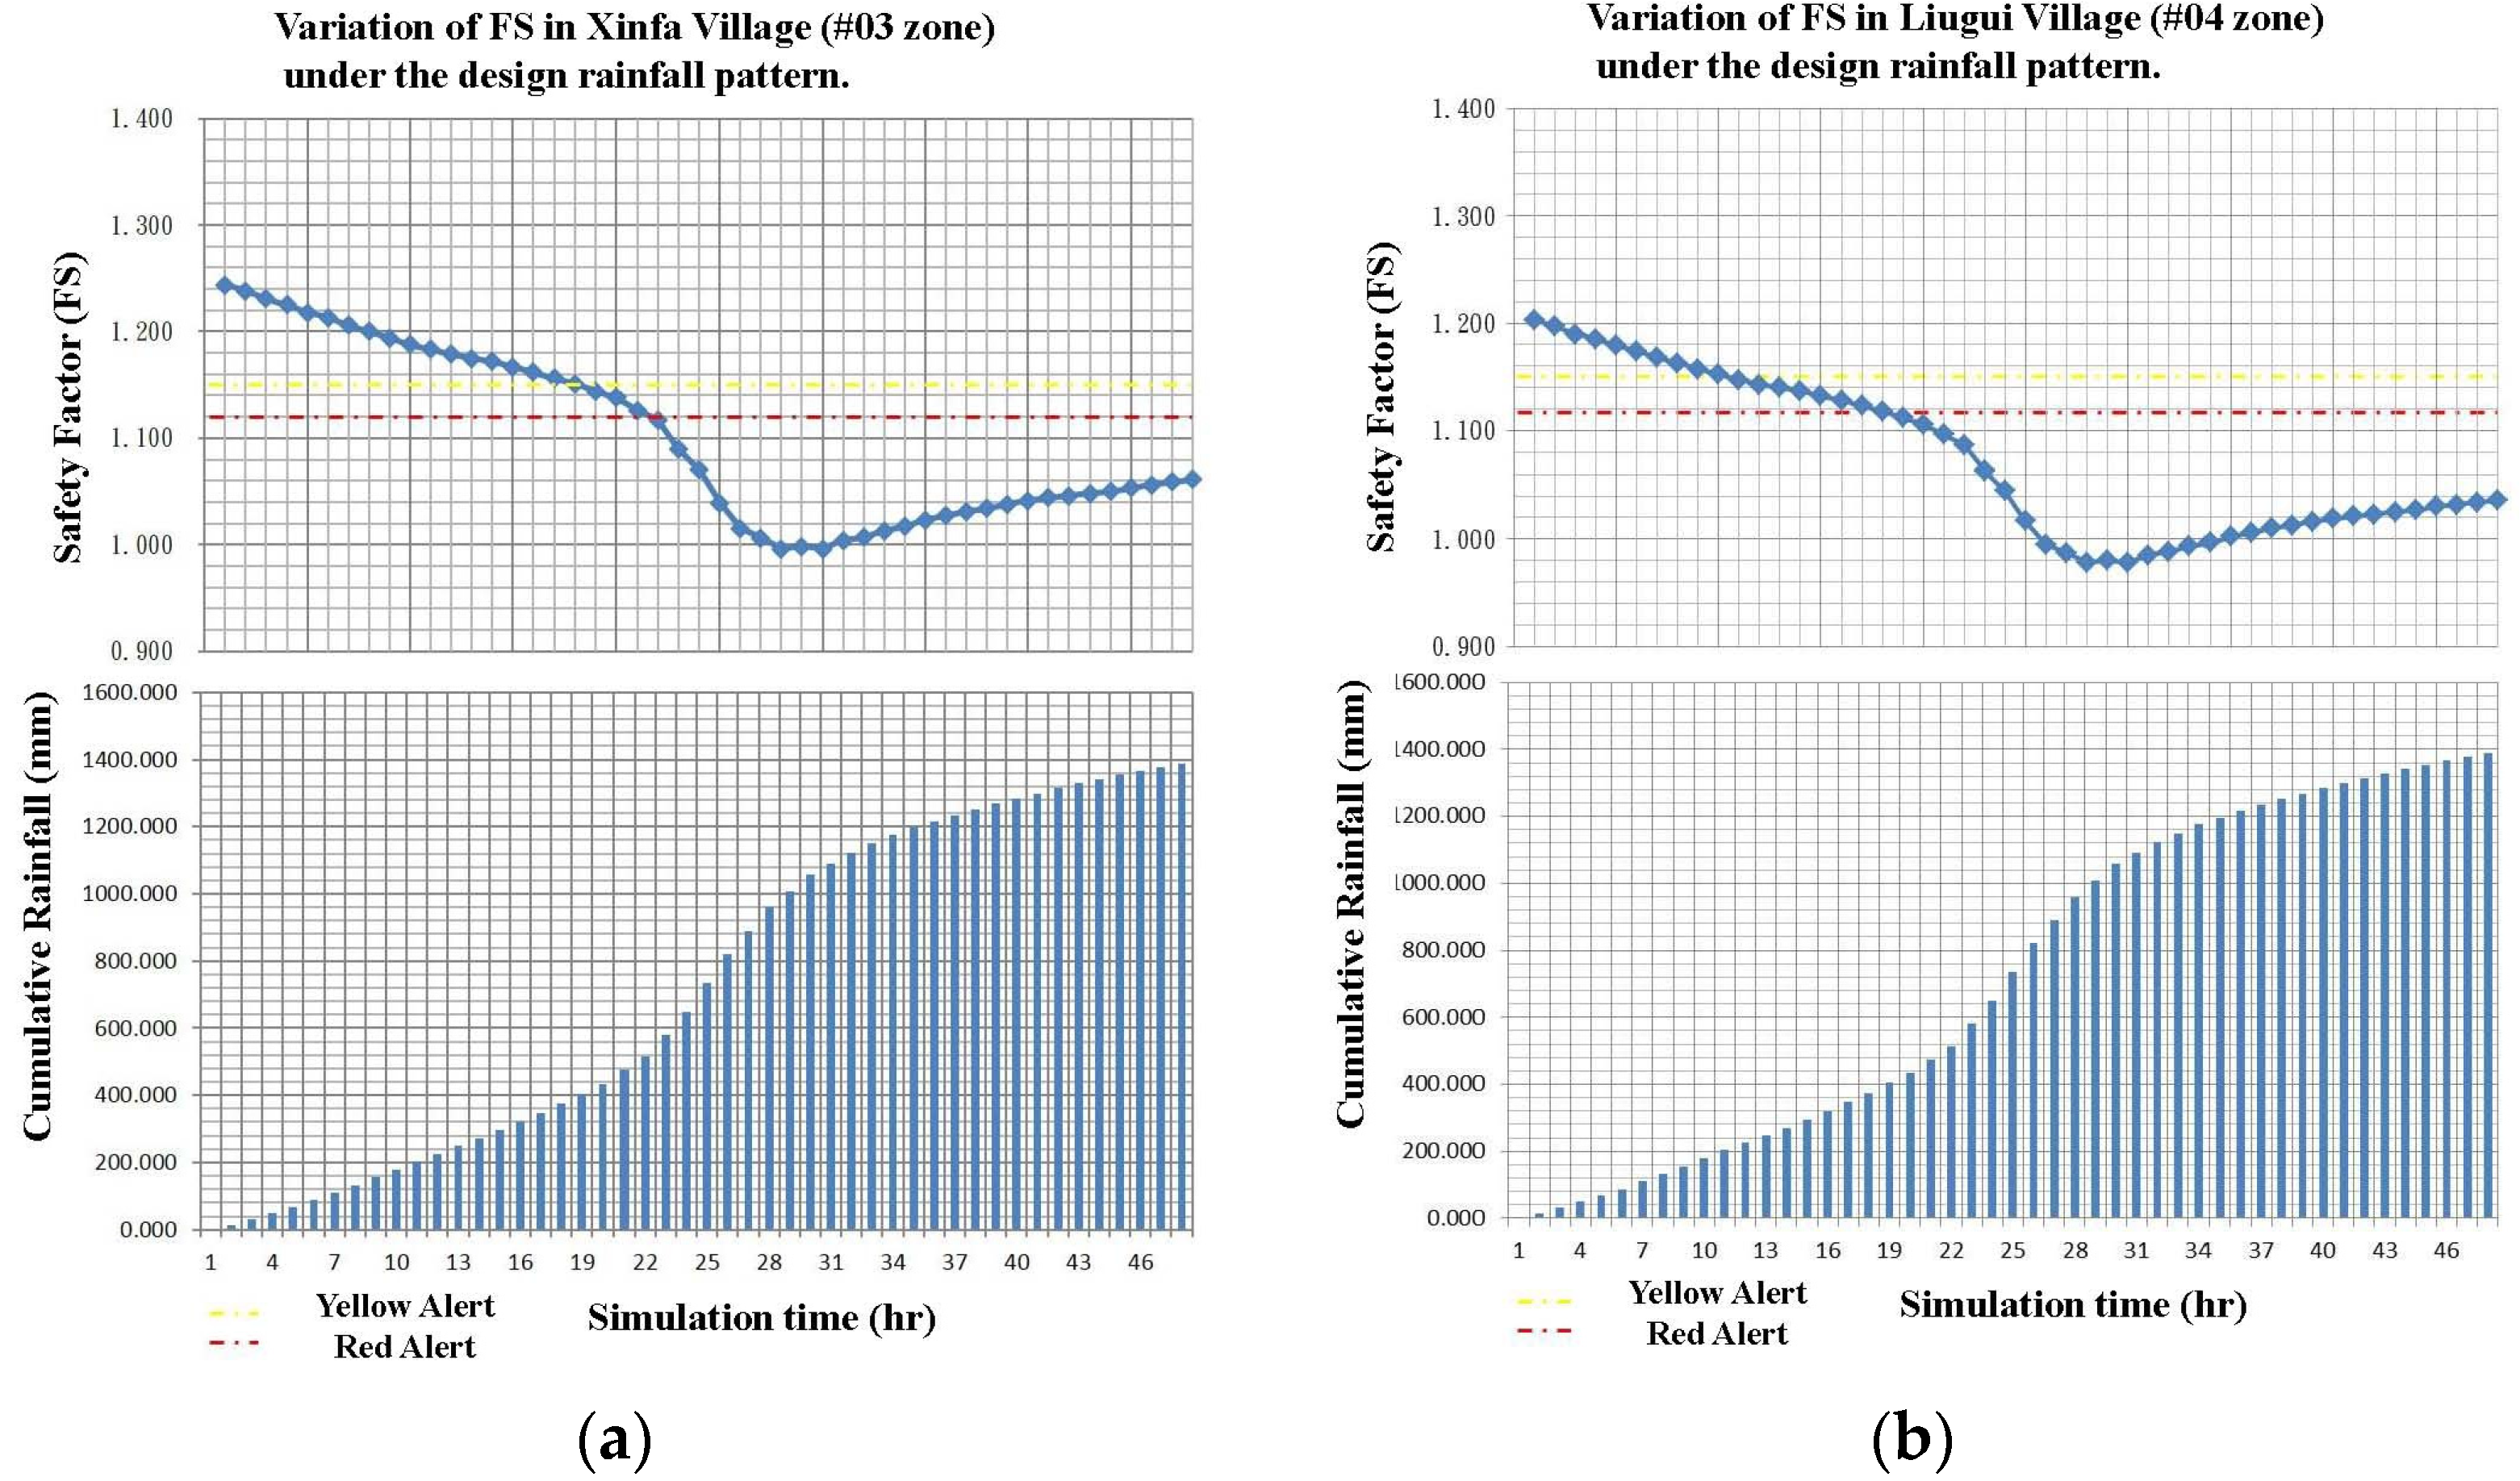
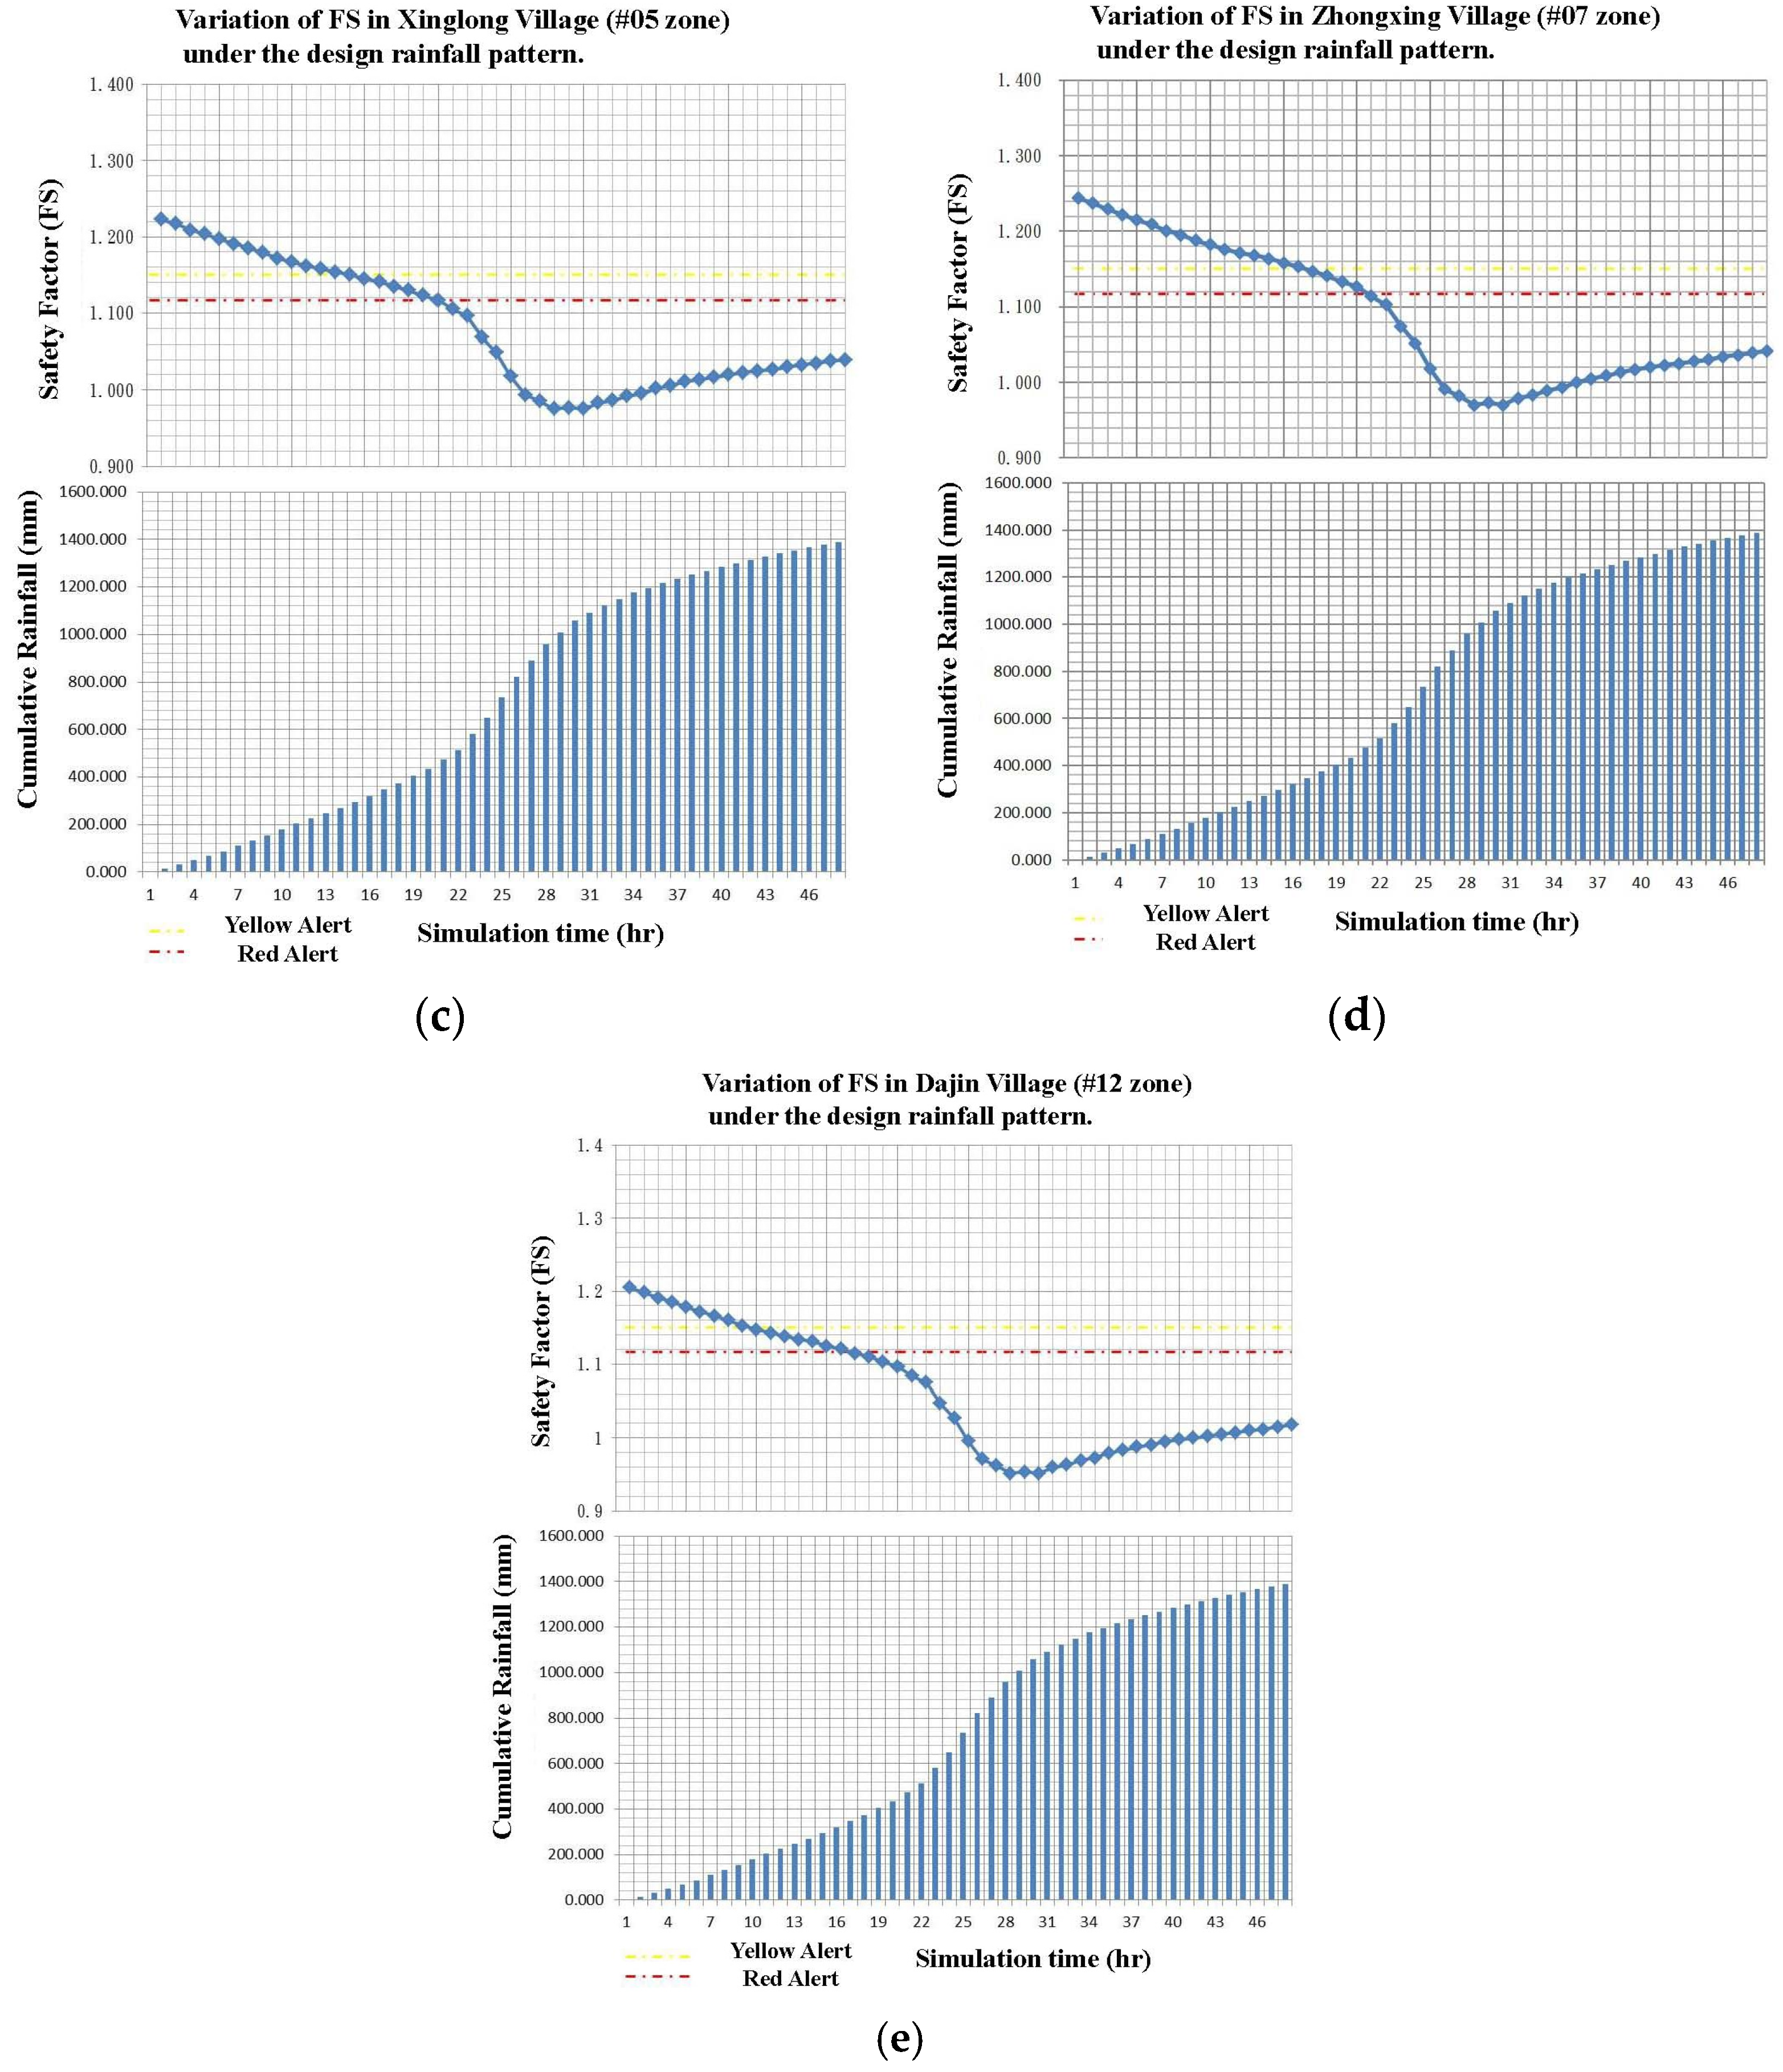
After establishing the design rainfall patterns, the TRIGRS model was executed again for the areas affected by landslides. The variation in the FS and the corresponding accumulated rainfall at the red and yellow alert FS values were observed to assess the cumulative rainfall warning. The design rainfall pattern used for the Gaoping area was a simulation of 700 mm of rainfall over 24 h for a total duration of 48 h. The variation in the FS over time and the corresponding accumulated rainfall for the #01 subzone were analyzed as representative examples, as shown in Figure 10. By observing Figure 10 and Figure A2a–e in the Appendix A for each village and subzone in the Liugui area of the Gaoping River Basin, the minimum FS values and their variations can be determined. Furthermore, when the FS decreases to the red or yellow alert FS value as the accumulated rainfall increases, the corresponding accumulated rainfall from the design rainfall pattern is calculated. Thus, the cumulative rainfall warning values for each subzone are obtained through the simulation using the design rainfall pattern.
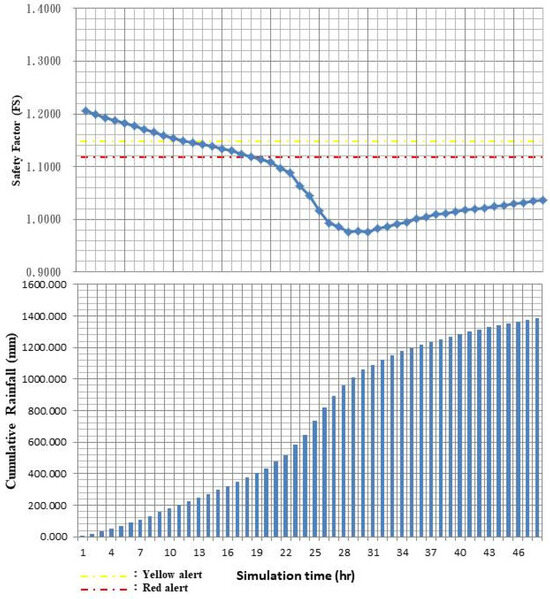
Figure 10.
Variation in FS in Baolai Village (#01 subzone) in Liugui area under the design rainfall pattern.
Under the simulated design rainfall pattern, Daotu Village (ID 12) within the Liugui area of the Gaoping River basin is identified as reaching the yellow alert factor of safety (FS) threshold quickest, followed in order by Liugui Village (04), Baolai Village (01), Xinglong Village (05), Zhongxing Village (07), and Xinfa Village (03). This sequence allows for a preliminary ranking of the landslide disaster potential across the Liugui area.
Table 8 collates the time taken for each village to reach the red or yellow FS alert levels under the simulated rainfall conditions. Using these timings, alongside the design rainfall pattern, it is evident that certain subzones in the Liugui area are quicker to reach these alert thresholds, highlighting the areas where attention should be prioritized regarding the landslide risk.
Table 8.
Time statistics of FS for yellow and red alerts in zones with a history of disasters (under the simulated scenario of the design rainfall pattern).
In the designed rainfall scenarios, we calculated the cumulative rainfall for red and yellow alert levels over time. These values, listed in Table 9, indicate proposed cumulative rainfall thresholds for warnings. Once the actual cumulative rainfall meets these thresholds, they could be used to guide warning issuances in Liugui’s villages during typhoon events. As per Table 8, the landslide warning value for cumulative rainfall from lowest to highest is for Villages 12, 04, 01, 05, 07, and 03. These findings suggest that villages with a greater landslide risk should be prioritized during typhoons, with timely measures and warnings implemented as the rainfall reaches the set alert levels.
Table 9.
Cumulative rainfall thresholds for yellow and red alerts in zones with a history of disasters (under the simulated scenario of the design rainfall pattern).
For areas lacking disaster histories, we derived cumulative rainfall warning values by adapting the SWCB’s debris flow criteria, assigning a 100 mm interval for these zones. Compared with disaster-affected areas, the highest yellow alert value from Maolin served as a benchmark, adding intervals to determine the red and yellow thresholds for non-disaster zones, as shown in Table 10. The projected values for areas without landslide histories are higher, indicating a need for more data collection and simulation to refine these warnings.
Table 10.
Cumulative rainfall thresholds for yellow and red alerts in zones without a history of disasters.
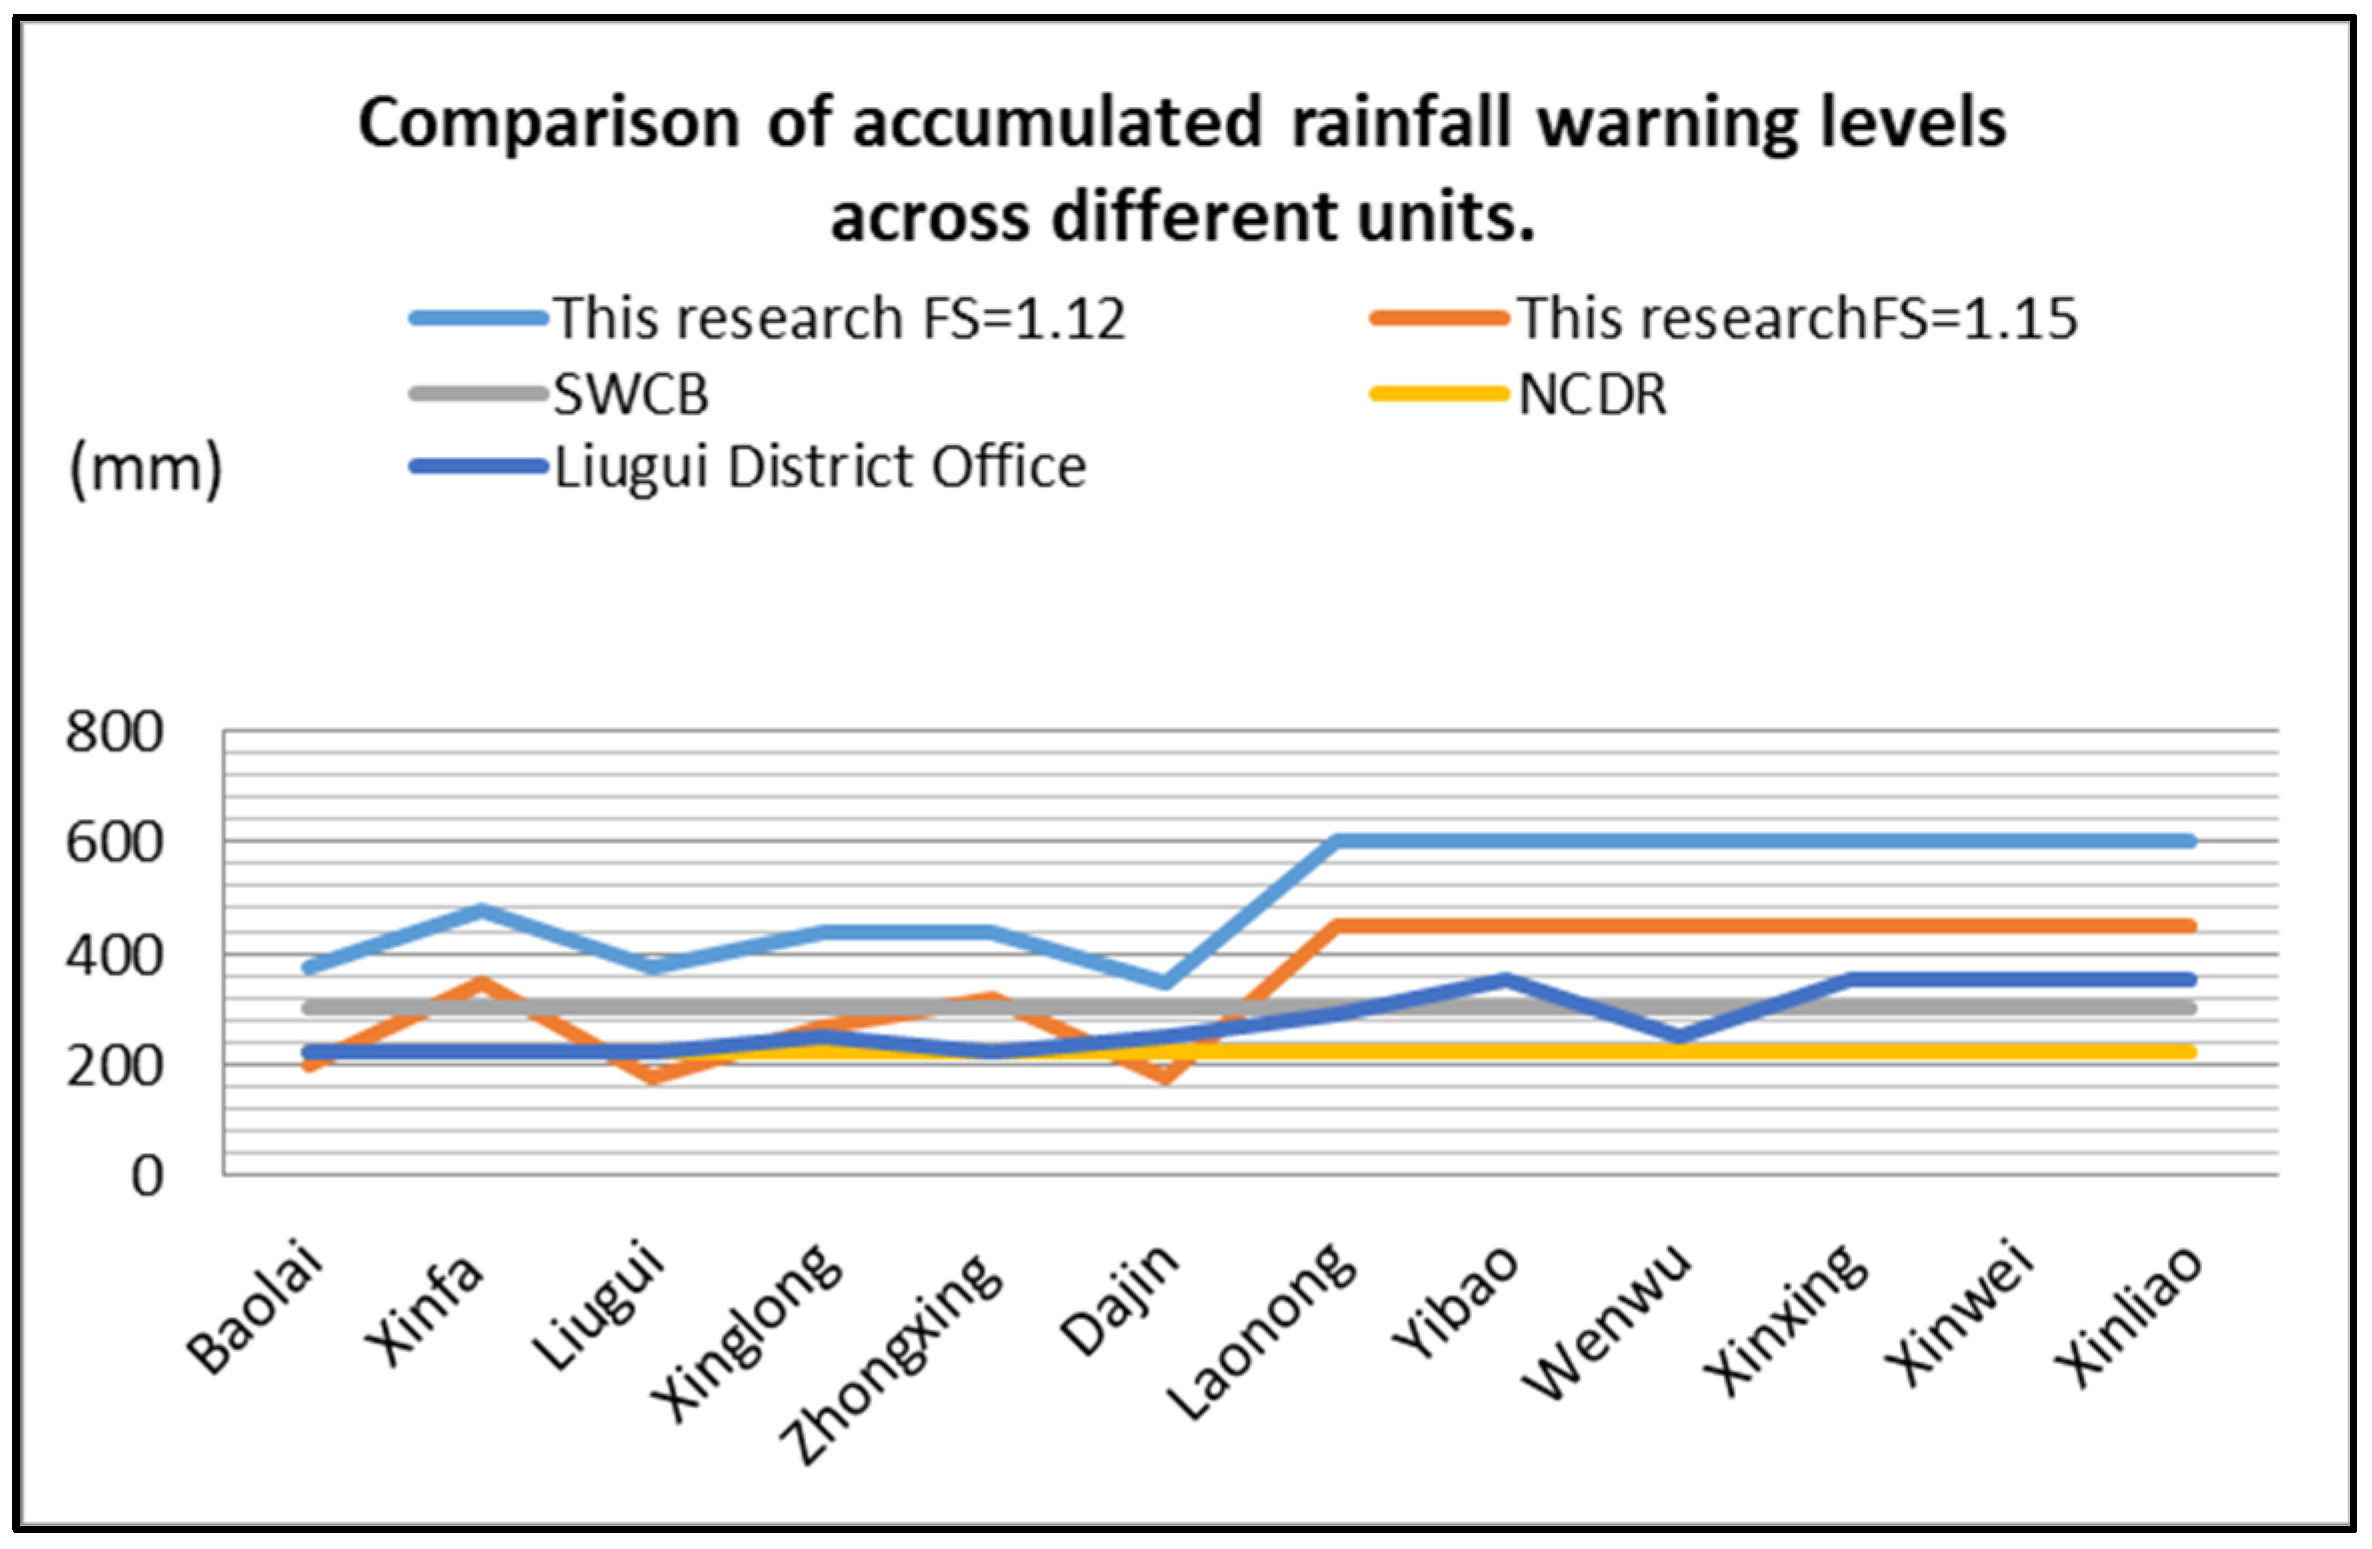
4.3.2. Comparisons of Slope Warning Cumulative Rainfall
This research defines warning zones at the village level and employs a deterministic approach to determine cumulative rainfall thresholds for shallow landslides in Liugui, within the Gaoping River Basin. This is particularly noteworthy as it contrasts the township-level and specific area thresholds set by the SWCB and NCDR for debris flows and slope disasters. The study underscores the utility of a deterministic method to set village-specific rainfall warning thresholds, with outcomes detailed in Table 11 and Figure 11.
Table 11.
Comparison of cumulative rainfall thresholds for village-level slope hazards.
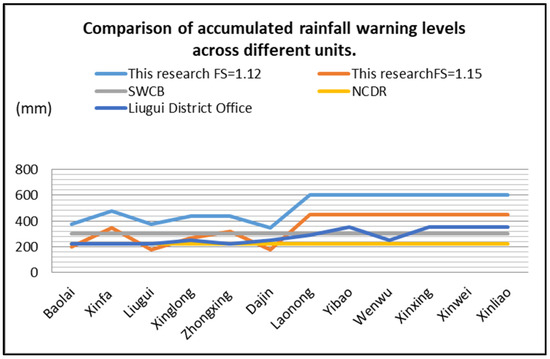
Figure 11.
Comparison of cumulative rainfall thresholds for slope hazards (village level) among different units.
Table 11 shows that the cumulative rainfall thresholds for yellow alerts in disaster-prone villages such as 01 Baolai, 04 Liugui, and 12 Datsun, determined through this deterministic method, align closely with those of the NCDR, while the red alert threshold for Datsun Village parallels the SWCB’s threshold.
For areas without prior disasters, thresholds are set referencing the SWCB’s method, with defined red and yellow alert levels based on cumulative rainfall intervals. Figure 11 indicates that the cumulative rainfall thresholds for these non-disaster areas generally follow the SWCB’s thresholds and are higher than those for disaster-prone villages.
To summarize, this part of the research employed a deterministic method that integrated the response time to establish village-specific cumulative rainfall thresholds for landslide warnings. These thresholds were then benchmarked against those set by the SWCB and NCDR, with the latter having included village-level thresholds since their 2013 revision. The study’s results, when compared with the Liugui District Office’s slope hazard warning values, demonstrate a congruent trend, underscoring the heterogeneous nature of the rainfall distribution and providing a more tailored decision-making foundation for disaster prevention during extreme weather events.
For non-disaster regions, the study’s proposed warning values are notably higher—nearly double—than those from other agencies. This arises from the addition of an interval to the cumulative rainfall in these areas, resulting in maximum alert values at later hours for places such as Xinfali Village. The elevated interval surpasses the total 24 h rainfall, suggesting that the study’s estimated values for non-disaster zones, potentially exceeding 24 h, are logically higher than those of agencies such as the NCDR. Future updates could recalibrate these thresholds in the light of increased disaster occurrences, ensuring more accurate and practical warning levels for these areas.
4.4. Evaluation of Thresholds for Early Warnings
4.4.1. Evaluation of Thresholds for Early Warnings: Case Study
In order to validate the alert thresholds proposed in this study, a demonstration scenario was chosen using rainfall data from Typhoon Fanapi in 2010, as there have been no major disasters in the Liugui area of the Gaoping River watershed since 2011. Datsun Village, which experienced a disaster, was selected as the demonstration area, and the second typhoon scenario was simulated to assess the reasonableness of the estimated alert factor of safety (FS) and cumulative rainfall thresholds.
After selecting the disaster case for comparison with the verification case results, the TRIGRS model was executed again for Datsun Village in the Liugui area of the Gaoping River watershed. The variations in the FS were observed after the simulation to examine whether there was sufficient response time when the FS decreased to approximately 1.12 for the red alert and 1.15 for the yellow alert, ensuring subsequent disaster response and mitigation measures. The overall minimum FS for Zone 12, Datsun Village, during Typhoon Fanapi, along with the variations over time and cumulative rainfall, are shown in Figure 12. The statistics of the FS for different levels in Datsun Village, Gaoping River, Liugui area, under this verification case are summarized in Table 12, and the statistics for the FS variations for different levels are presented in Table 13.
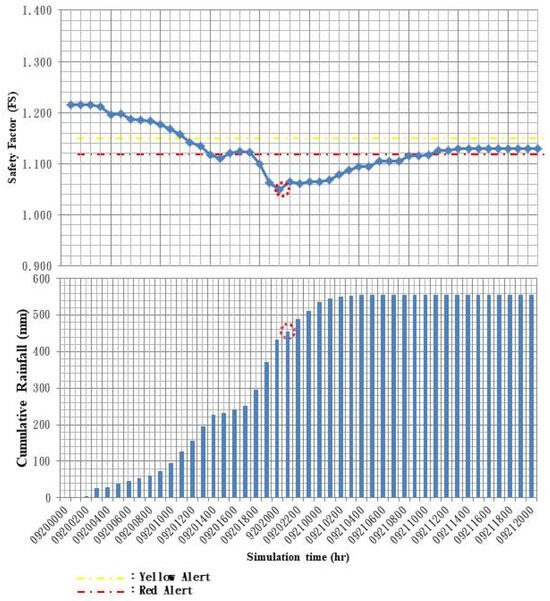
Figure 12.
FS Variation in Zone #12 Dajin Village, Liugui Area (Typhoon Fanapi).
Table 12.
FS Time Statistics in Zone #12 Dajin Village, Liugui Area (Typhoon Fanapi).
Table 13.
FS Variation Time Statistics in Zone #12 Datsun Village, Liugui Area (Typhoon Fanapi).
Under the scenario of Typhoon Fanapi, the cumulative rainfall values for village-level slope hazard warnings, as established by the SWCB and NCDR using statistical methods (equivalent to township-level values), were analyzed. Table 14 provides statistics on the time taken for the actual cumulative rainfall to reach the warning threshold, while Table 15 presents statistics on the time elapsed until actual landslide disasters occurred.
Table 14.
Warning Release Time by SWCB and NCDR.
Table 15.
Time Interval between Warning Release and Occurrence of Disaster by SWCB and NCDR.
Based on the statistics from Table 12 and Table 13, it is evident that the warning thresholds established by the SWCB and NCDR, following their release, provided approximately 3 h and 7 h, respectively, for evacuation in the red alert areas. On the other hand, the warning thresholds proposed in this section, using the frequency ratio method, allowed for approximately 6 h of response time in the red alert areas, which falls between the timeframes established by the SWCB and NCDR. This provides an important reference for disaster prevention and response in the region during typhoon and flood periods.
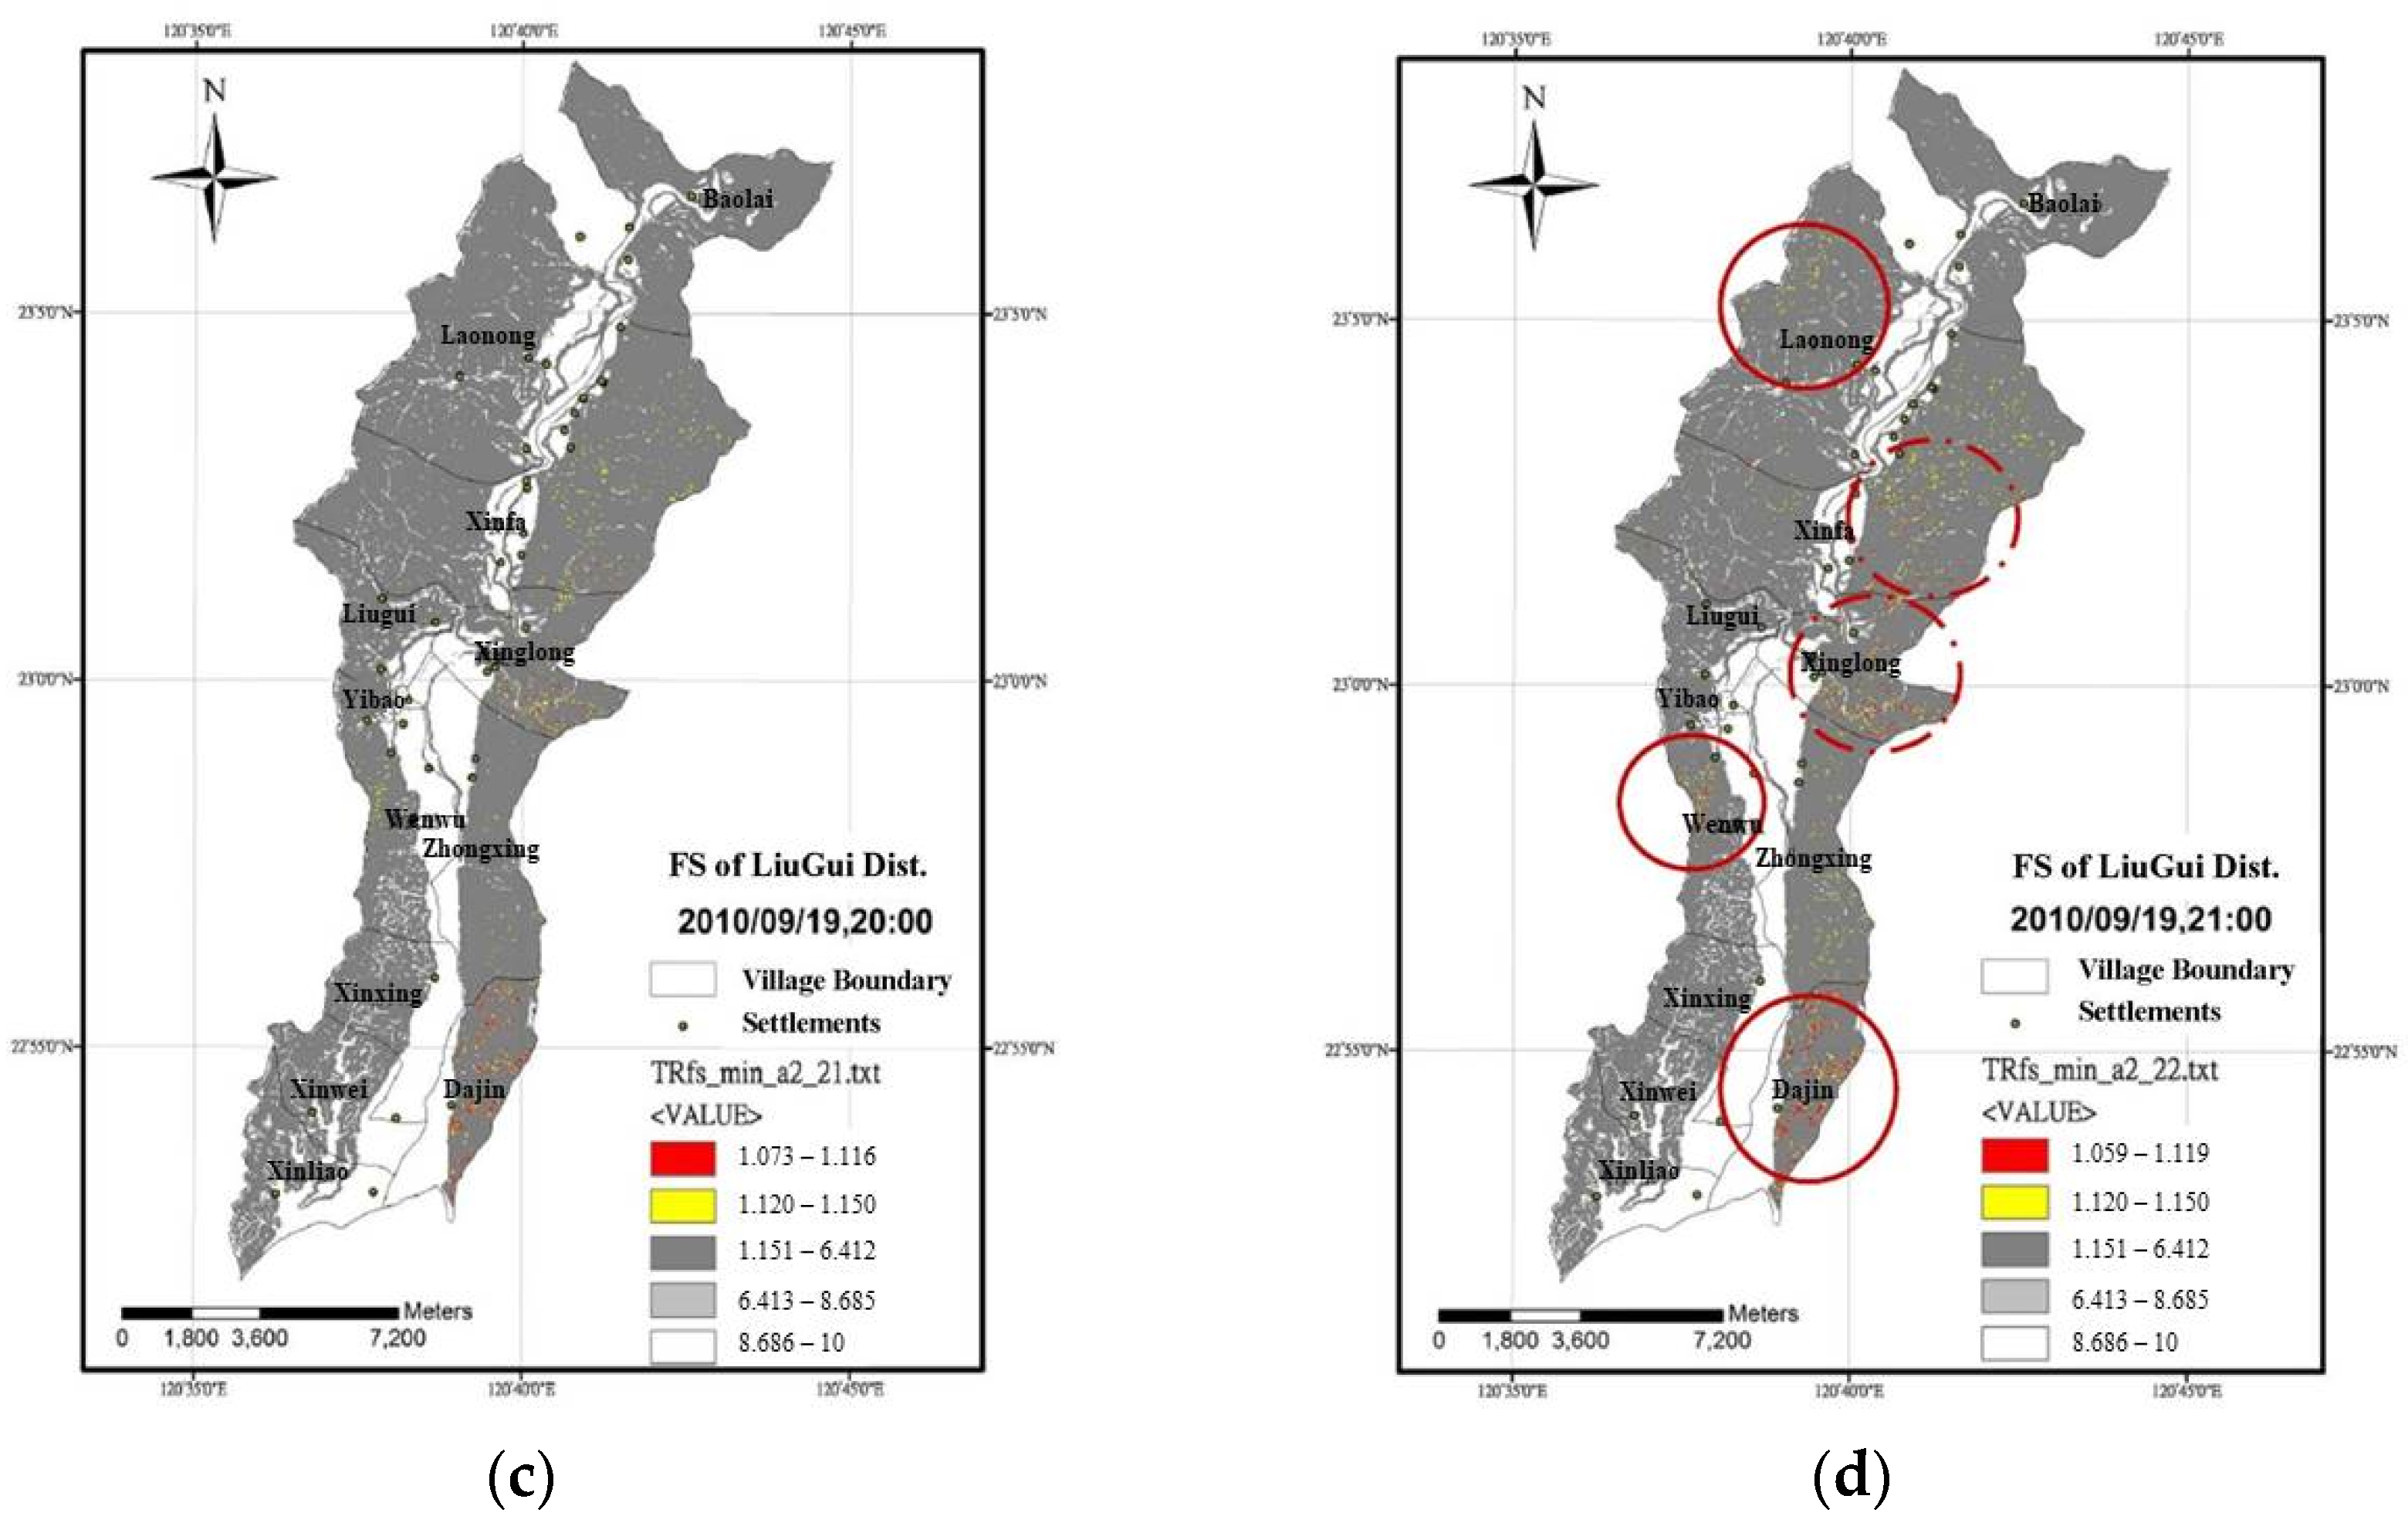
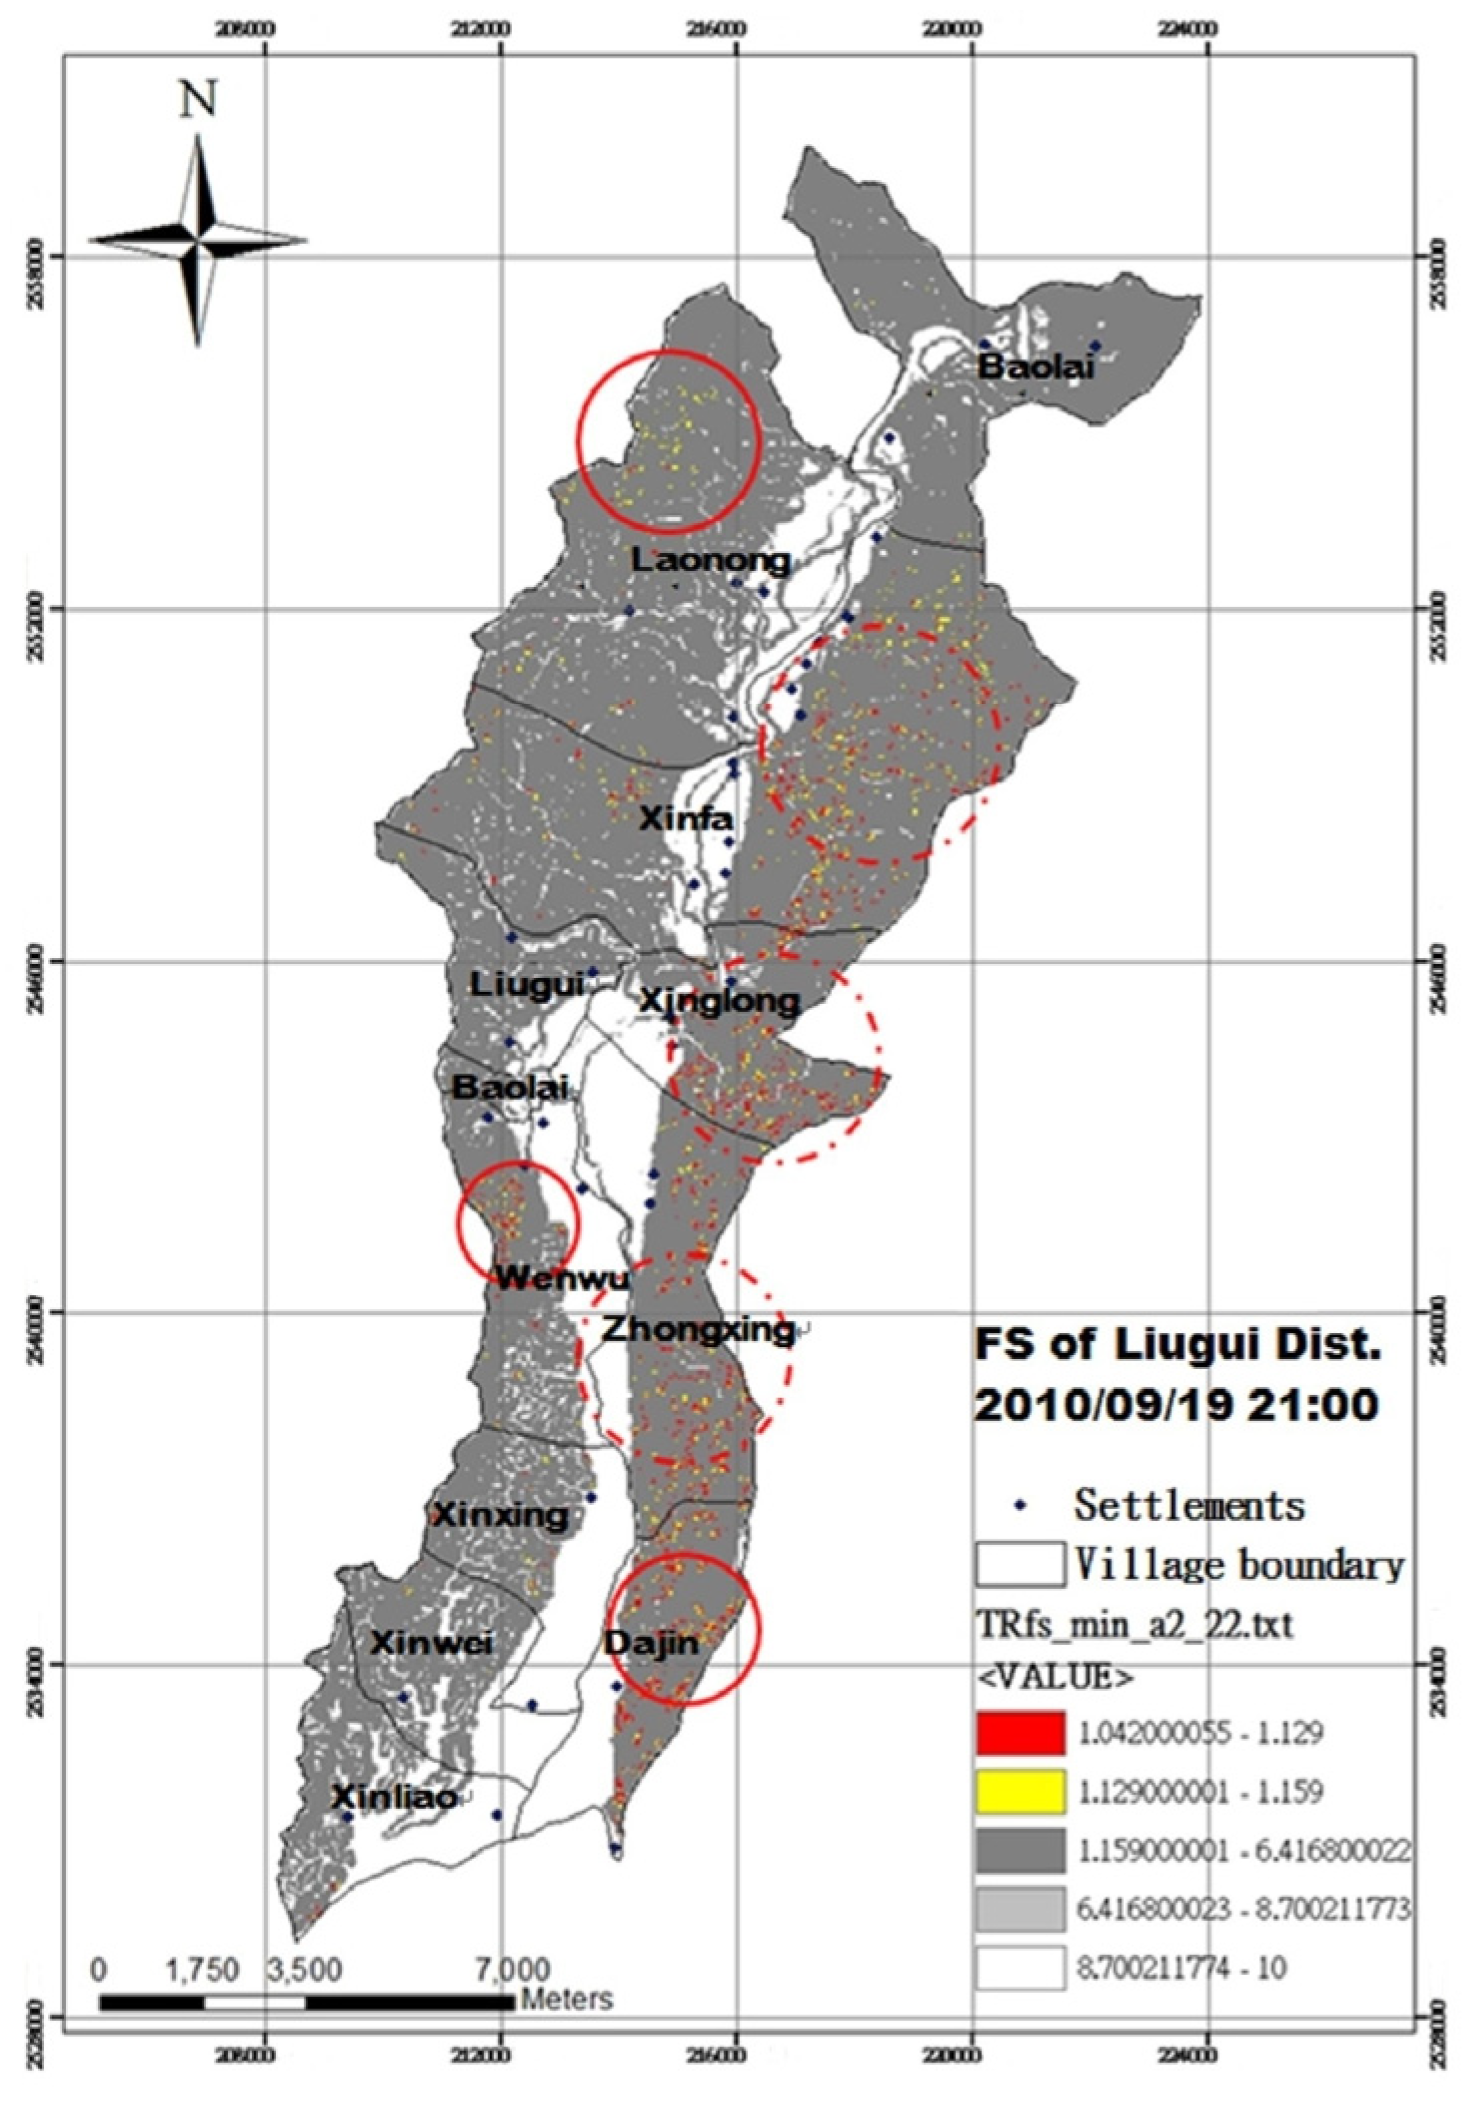
In this study, the rate-based method for the setting of landslide rainfall warning thresholds considers site-specific soil properties and regional-scale safety factor calculations, distinguishing it from traditional statistical approaches. This method pinpoints areas at risk of landslides. The NCDR has identified 42 settlement areas in Liugui District. Figure 13a–d illustrate the factor of safety (FS) spatial distribution across Liugui’s villages during the 10 h period leading to actual landslides during Typhoon Fanapi.
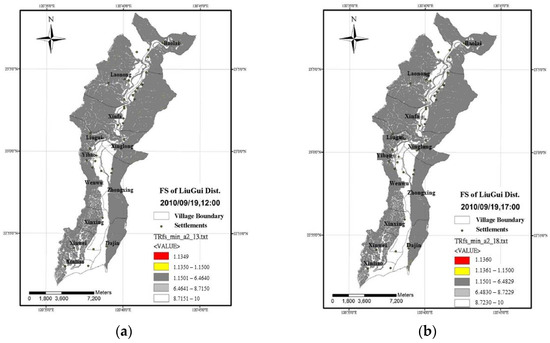
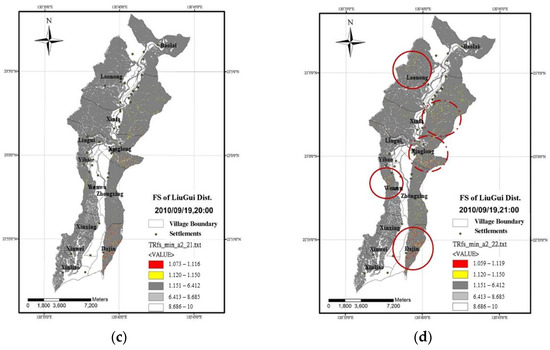
Figure 13.
(a) Unstable sites in region of study; (b) unstable sites in region of study; (c) unstable sites in region of study; (d) unstable sites in region of study (Time: 19 September 2010 21:00).
The data for the FS distribution across each village can inform disaster response decisions, such as when and where to evacuate. Figure 13d identifies five particularly unstable areas. These insights allow for the prioritization of 14 key settlements for disaster prevention, optimizing resource allocation and response efforts.
The traditional approach used by disaster prevention agencies relies on statistical methods for setting rainfall warning thresholds, resulting in only township-level alerts without specific focus on individual villages. This lack of specificity can mask the true extent of unstable areas, making it difficult to identify which settlements need urgent evacuation and thereby impeding effective disaster response. In contrast, the rate-based method allows for more precise identification of areas needing evacuation, improving the allocation of resources and manpower. For example, in the Liugui District case, the model recommended evacuating only 14 out of 42 settlements, thus avoiding unnecessary evacuations and enhancing disaster response efficiency.
Furthermore, during Typhoon Fanapi, the Liugui District experienced five landslide incidents as reported by the SWCB, precisely within the model-predicted unstable areas (marked by solid red lines in Figure 13d). This underlines the effectiveness of the proposed method in pinpointing at-risk areas and refining evacuation directives for settlements, offering critical insights for disaster management teams during extreme weather events.
4.4.2. Comparison with Previous Research Findings
Chien et al. [1] previously applied the rate-based method at the township level and identified six relatively unstable areas and settlements: the northwest side of Laonong Village, the east side of Xinfa Village, the east side of Xinglong Village, the west side of Wenwu Village, the east side of Zhongxing Village, and the east side of Dajin Village (as shown in Figure 14). By comparing the spatial distribution of the settlements, they selected 17 settlements that required targeted disaster prevention measures. In this study, the assessment of rainfall-induced landslide susceptibility in the Liugui area was conducted at the village level, using a finer resolution. When comparing the results with the study conducted by Chien at the township level, it was found that there was an increase of three locations requiring non-essential evacuation. The overall efficiency of disaster prevention was estimated to be improved by approximately 7.14%.

Figure 14.
Visualization of unstable areas in the study region after applying the analysis at the township level (Chien et al. [1]).
The main reason for this is that the analysis at the township level, as conducted in the previous study, tends to overestimate the safety factor and overall warning level for the entire Liuqi region, as it is controlled by the parameter settings based on the rapid reporting of major disasters in the Daotian area. On the other hand, the use of village-level zoning provides a more detailed description of the different characteristics within each village, allowing for the more effective allocation of support manpower and the arrangement of evacuation routes by response units, thereby enhancing the overall effectiveness of the disaster response.
The rate-based method used in this study for the Liuchi area of the Kaoping River Basin effectively validates the shallow landslide warning levels, considering the response time. It offers a reliable tool enabling disaster response units to assess the landslide risk during typhoon and flood seasons. By integrating the FS values and settlement distribution, resources can be allocated more efficiently, enhancing the disaster response and protecting residents in hilly regions from landslides.
5. Conclusions
This study applies the rate-based analysis method to consider the geological and physical characteristics of the Gaoping River Basin and the response time required for disaster mitigation. It proposes the division of the Liugui District into village units and calculates the cumulative rainfall warning values for each village through simulated design rainfall patterns. The specific conclusions of this study are as follows.
- This study employs a rate-based method to simulate and compare rainfall-induced landslides with actual events, determining village-specific red and yellow warning thresholds. By applying design rainfall patterns, village-level cumulative rainfall values are calculated to guide landslide warnings, enhancing the disaster response.
- The proposed method surpasses traditional statistical approaches by incorporating local geophysical data, reducing unnecessary evacuations and aiding in disaster management planning and budgeting based on single historical events per village.
- The study’s warning values correlate with existing thresholds set by the SWCB and NCDR, offering a median 6 h response window, thus validating its utility for typhoon-related landslide alerts.
- Considering the response times for emergency procedures, the study’s red and yellow warnings enable proactive landslide alerts, allowing the timely deployment of resources and evacuations, with the physical model providing a detailed safety factor distribution for improved alert precision.
- Merging the research outcomes with live rainfall data and updates from the Meteorological Bureau enhances the identification of critical areas, supports simulations of slope behavior under rainfall, and provides benchmark data for future landslide guidelines and interventions.
- Integrating the findings with local geology offers invaluable insights for government entities in refining Landslide Hazard Maps and aids grassroots units in Regional Disaster Prevention Map production.
Funding
This research received no external funding.
Institutional Review Board Statement
Not applicable.
Informed Consent Statement
Not applicable.
Data Availability Statement
Data are contained within the article.
Acknowledgments
I would like to extend my heartfelt thanks to Chien Lien Kwei for his invaluable guidance and supervision during the course of my doctoral dissertation.
Conflicts of Interest
The authors declare no conflict of interest.
Appendix A

Figure A1.
Distribution of geological in Gaoping River catchment: (a) parameter C; (b) parameter Ø t; (c) parameter γt; (d) parameters k; (e) parameters d; (f) parameters iz (CGS [2]).
Figure A1.
Distribution of geological in Gaoping River catchment: (a) parameter C; (b) parameter Ø t; (c) parameter γt; (d) parameters k; (e) parameters d; (f) parameters iz (CGS [2]).
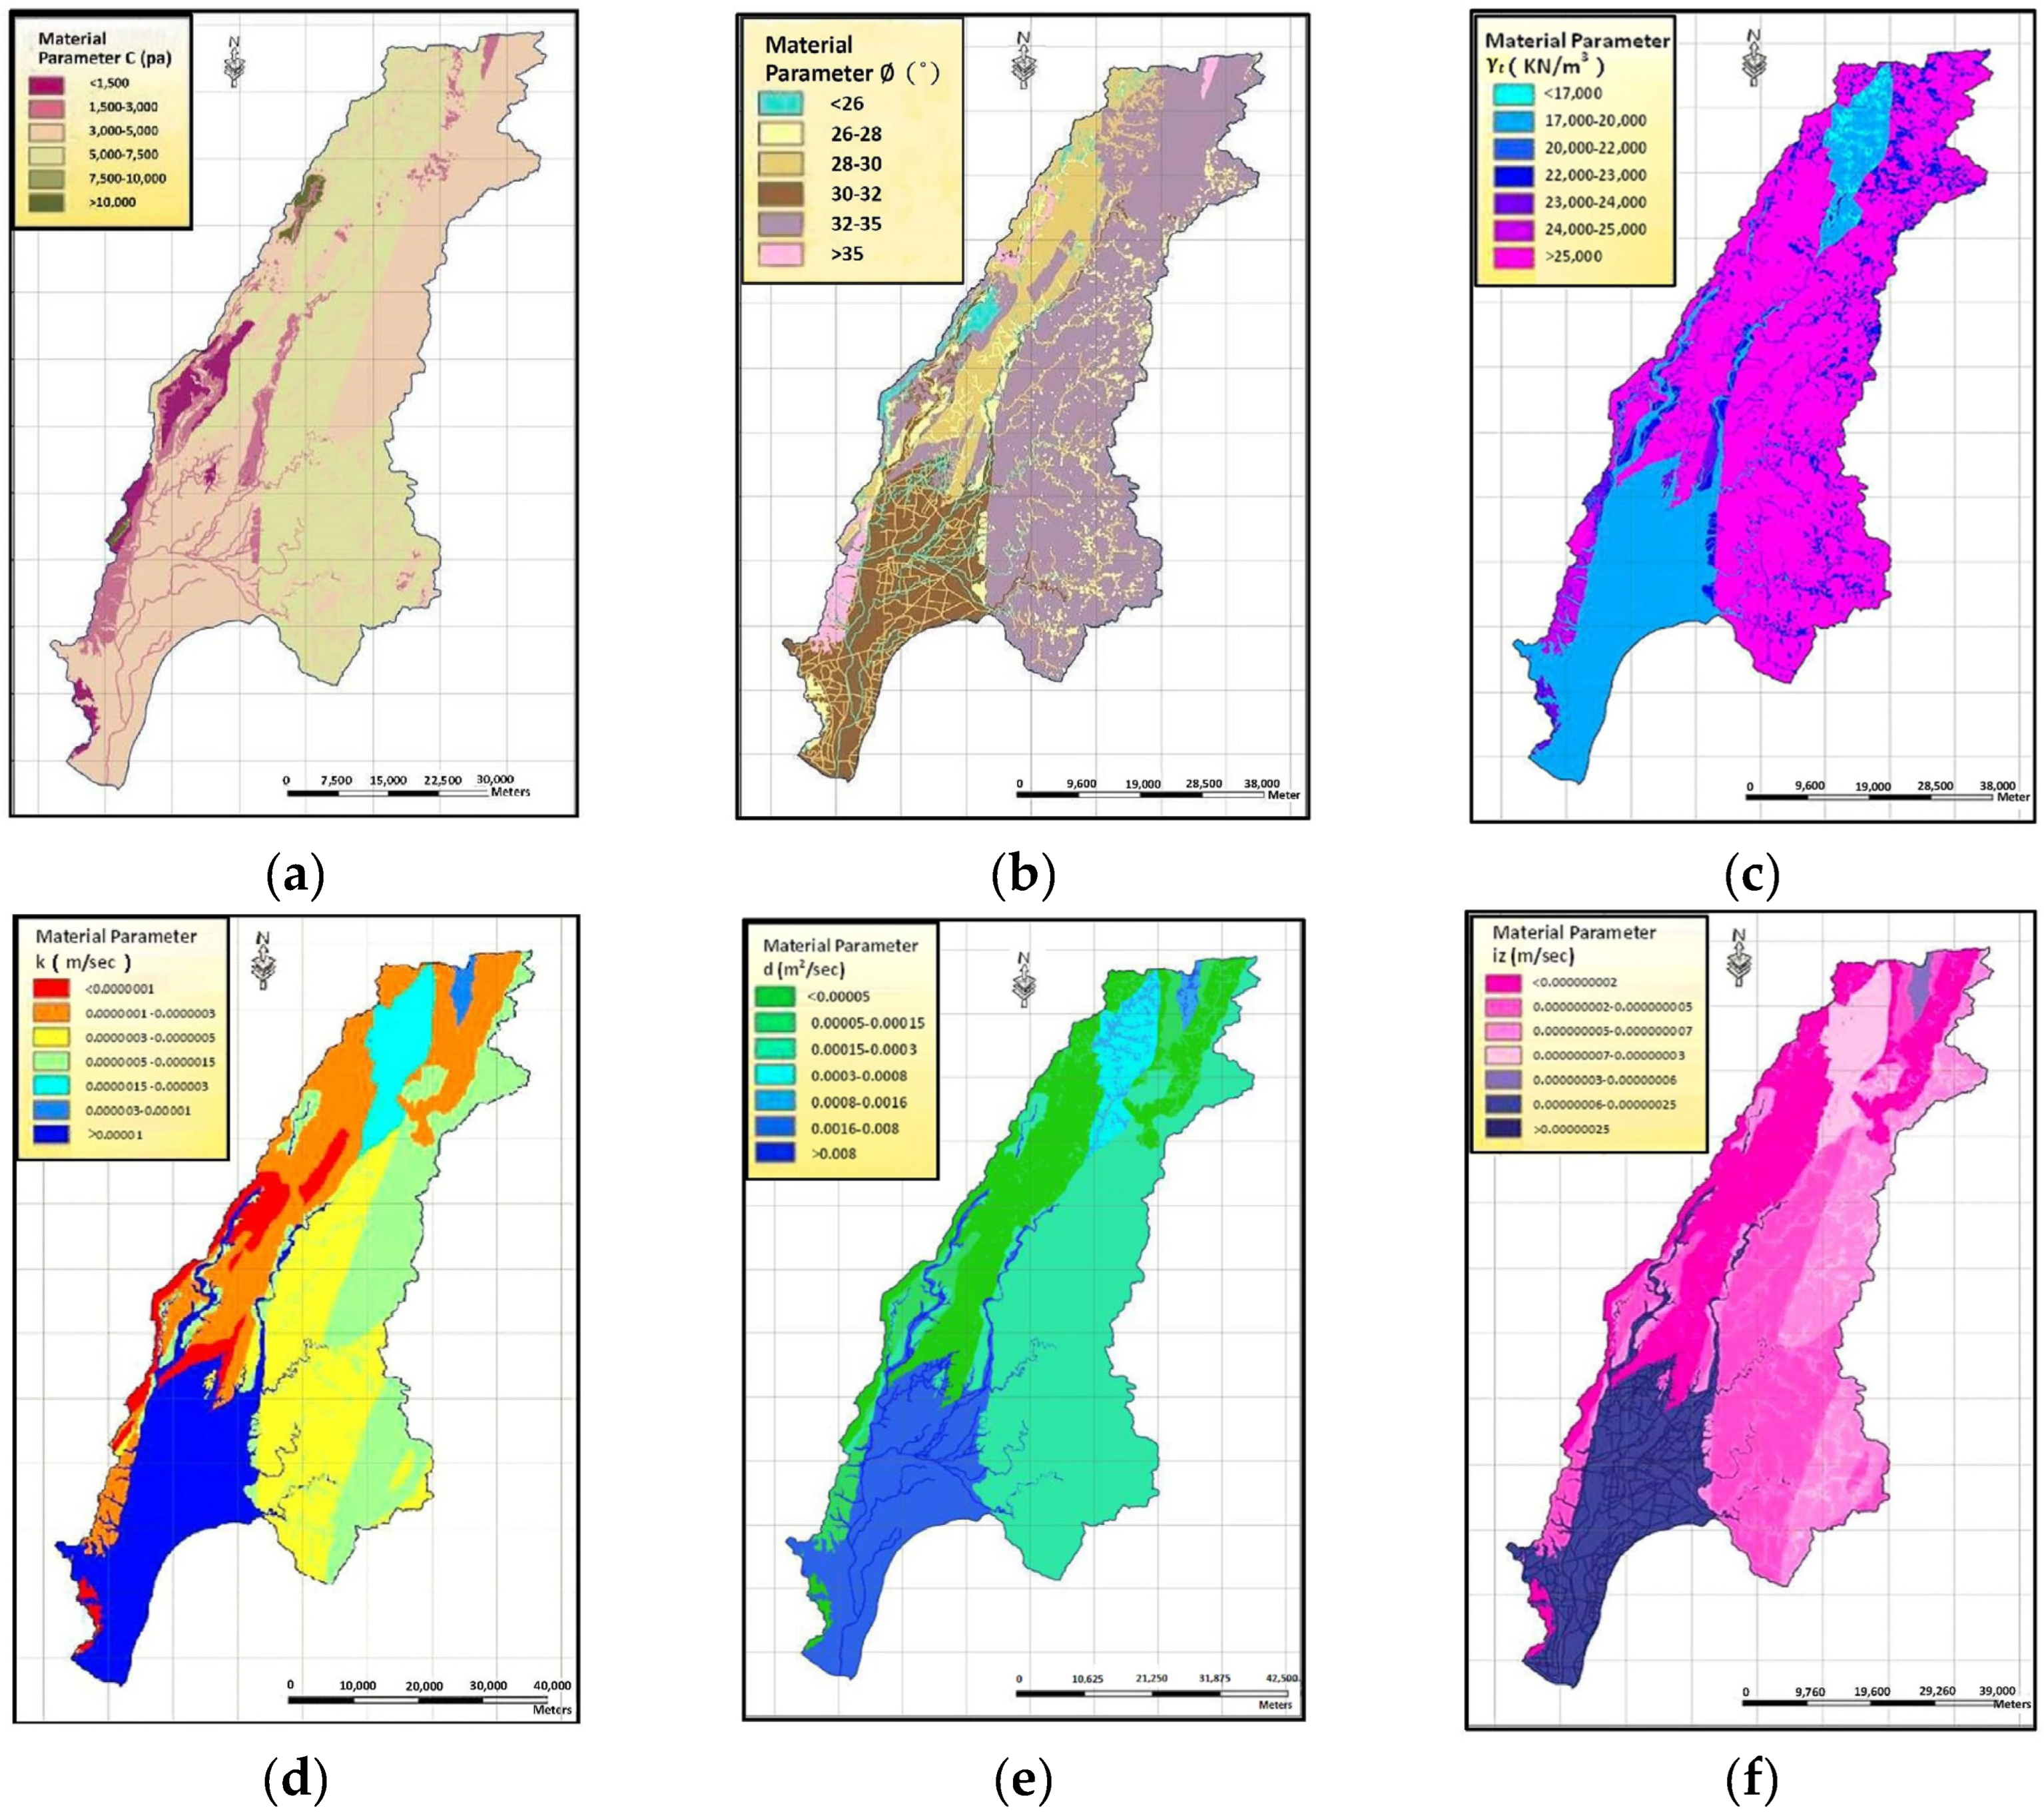
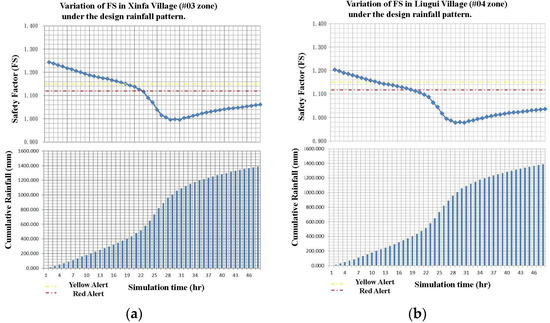
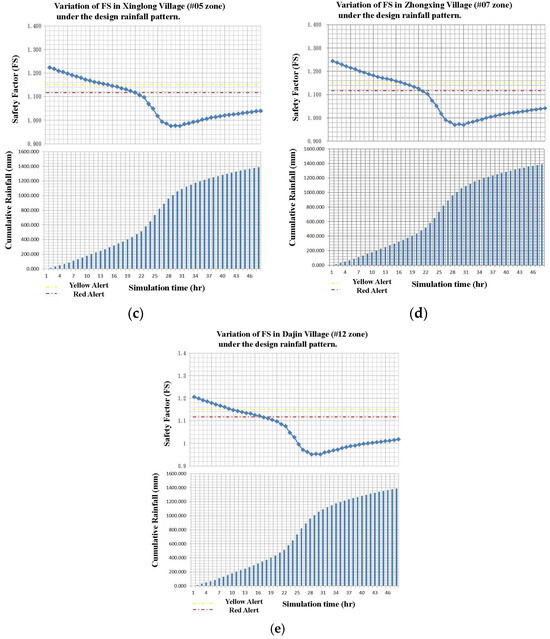
Figure A2.
Variation of FS in Liugui area under the design rainfall pattern. (a) Xinfa Village (#03 subzone) (b) Liugui Village (#05 subzone). (c) Xinglong Village (#05 subzone). (d) ZhongXing Village (#07 subzone). (e) Dajin Village (#12 subzone).
Figure A2.
Variation of FS in Liugui area under the design rainfall pattern. (a) Xinfa Village (#03 subzone) (b) Liugui Village (#05 subzone). (c) Xinglong Village (#05 subzone). (d) ZhongXing Village (#07 subzone). (e) Dajin Village (#12 subzone).
References
- Chien, L.-K.; Hsu, C.-F.; Yin, L.-C. Warning Model for Shallow Landslides Induced by Extreme Rainfall. Water 2015, 7, 4362–4384. [Google Scholar] [CrossRef]
- Sinotech Engineering Consultants, Inc. Geological Survey and Database for Upstream Watersheds of Flood-Prone Areas (Phase 2, 2009)—Effect of Hydrogeology on Slope Stability (2/3) Result Report; S.E.C. Inc.: Taipei, Taiwan, 2009. [Google Scholar]
- Chung, M.C.; Tan, C.H.; Chen, M.M.; Su, T.W. Deterministic approach for estimating critical rainfall threshold of rainfall-induced landslide. In Proceedings of the Annual Meeting and Academic Seminar of the Chinese Society of Soil and Water Conservation, Taichung, Taiwan, 7 December 2011. [Google Scholar]
- Huang, S.W. Vulnerability Assessment of Rainfall-Induced Shallow Landslide under Extreme Climate; National Taiwan Ocean University: Keelung, Taiwan, 2012. [Google Scholar]
- NCDR. National Science and Technology Center for Disaster Reduction. 2014. Available online: http://satis.ncdr.nat.gov.tw/dmap/102rule.aspx (accessed on 10 October 2023).
- SWCB. Soil and Water Conservation Bureau, Council of Agriculture (COA), Executive Yuan. 2014. Available online: http://246.Swcb.Gov.Tw/index.Html?Pk=7cc09f308450a08a0b73ae712a5275ae (accessed on 10 October 2023).
- Huang, M.-H.; Hu, J.-C.; Ching, K.-E.; Rau, R.-J.; Hsieh, C.-S.; Pathier, E.; Fruneau, B.; Deffontaines, B. Active deformation of Tainan tableland of southwestern Taiwan based on geodetic measurements and SAR interferometry. Tectonophysics 2009, 466, 322–334. [Google Scholar] [CrossRef]
- Deffontaines, B.; Chang, K.-J.; Champenois, J.; Fruneau, B.; Pathier, E.; Hu, J.-C.; Lu, S.-T.; Liu, Y.-C. Active interseismic shallow deformation of the Pingting terraces (Longitudinal Valley–Eastern Taiwan) from UAV high-resolution topographic data combined with InSAR time series. Geomat. Nat. Hazards Risk 2017, 8, 120–136. [Google Scholar] [CrossRef]
- Tsukahara, K.; Takada, Y. Aseismic fold growth in southwestern Taiwan detected by InSAR and GNSS. Earth Planets Space 2018, 70, 52. [Google Scholar] [CrossRef]
- Chang, K.-T.; Merghadi, A.; Yunus, A.P.; Pham, B.T.; Dou, J. Evaluating scale effects of topographic variables in landslide susceptibility models using GIS-based machine learning techniques. Sci. Rep. 2019, 9, 12296. [Google Scholar] [CrossRef]
- Ghorbanzadeh, O.; Crivellari, A.; Ghamisi, P.; Shahabi, H.; Blaschke, T. A comprehensive transferability evaluation of U-Net and ResU-Net for landslide detection from Sentinel-2 data (case study areas from Taiwan, China, and Japan). Sci. Rep. 2021, 11, 14629. [Google Scholar] [CrossRef] [PubMed]
- Shahabi, H.; Rahimzad, M.; Tavakkoli Piralilou, S.; Ghorbanzadeh, O.; Homayouni, S.; Blaschke, T.; Lim, S.; Ghamisi, P. Unsupervised Deep Learning for Landslide Detection from Multispectral Sentinel-2 Imagery. Remote Sens. 2021, 13, 4698. [Google Scholar] [CrossRef]
- Ghorbanzadeh, O.; Gholamnia, K.; Ghamisi, P. The application of ResU-net and OBIA for landslide detection from multi-temporal Sentinel-2 images. Big Earth Data 2022, 1–25. [Google Scholar] [CrossRef]
- Lacroix, P.; Bièvre, G.; Pathier, E.; Kniess, U.; Jongmans, D. Use of Sentinel-2 images for the detection of precursory motions before landslide failures. Remote Sens. Environ. 2018, 215, 507–516. [Google Scholar] [CrossRef]
- Manasi, P.; Rojasree, G.; Jahnavi, G.; Yojitha, U.; Saha, A.; Pal, T. U-Net Deep Neural Network-Based Landslide Detection Method. In Proceedings of the Intelligent Systems and Sustainable Computing, Hyderabad, India, 16–17 December 2022; Springer Nature: Singapore, 2023; pp. 469–477. [Google Scholar]
- Ghorbanzadeh, O.; Xu, Y.; Zhao, H.; Wang, J.; Zhong, Y.; Zhao, D.; Zang, Q.; Wang, S.; Zhang, F.; Shi, Y.; et al. The Outcome of the 2022 Landslide4Sense Competition: Advanced Landslide Detection From Multisource Satellite Imagery. IEEE J. Sel. Top. Appl. Earth Obs. Remote Sens. 2022, 15, 9927–9942. [Google Scholar] [CrossRef]
- Schilirò, L.; Montrasio, L.; Mugnozza, G.S. Prediction of shallow landslide occurrence: Validation of a physically-based approach through a real case study. Sci. Total Environ. 2016, 569, 134–144. [Google Scholar] [CrossRef] [PubMed]
- Medina, V.; Hürlimann, M.; Guo, Z.; Lloret, A.; Vaunat, J. Fast physically-based model for rainfall-induced landslide susceptibility assessment at regional scale. Catena 2021, 201, 105213. [Google Scholar] [CrossRef]
- Bulzinetti, M.A.; Segoni, S.; Pappafico, G.; Masi, E.B.; Rossi, G.; Tofani, V. A tool for the automatic aggregation and validation of the results of physically based distributed slope stability models. Water 2021, 13, 2313. [Google Scholar] [CrossRef]
- Lambe, T.W.W.; Whitman, R.V. Soil Mechanics; Wiley: New York, NY, USA, 1979; p. 553. [Google Scholar]
- Jibson, R.W.; Harp, E.L.; Michael, J.A. A method for producing digital probabilistic seismic landslide hazard maps. Eng. Geol. 2000, 58, 271–289. [Google Scholar] [CrossRef]
- Keefer, D.K. Statistical analysis of an earthquake-induced landslide distribution—The 1989 Loma Prieta, California event. Eng. Geol. 2000, 58, 231–249. [Google Scholar] [CrossRef]
- Fredlund, D.; Morgenstern, N.R.; Widger, R. The shear strength of unsaturated soils. Can. Geotech. J. 1978, 15, 313–321. [Google Scholar] [CrossRef]
- Anderson, M.; Howes, S. Development and application of a combined soil water-slope stability model. Q. J. Eng. Geol. 1985, 18, 225–236. [Google Scholar] [CrossRef]
- Tarantino, A.; Mongiovì, L.; Bosco, G. An experimental investigation on the independent isotropic stress variables for unsaturated soils. Géotechnique 2000, 50, 275–282. [Google Scholar] [CrossRef]
- Collins, B.D.; Znidarcic, D. Stability analyses of rainfall induced landslides. J. Geotech. Geoenvironmental Eng. 2004, 130, 362–372. [Google Scholar] [CrossRef]
- Tsai, T.-L. The influence of rainstorm pattern on shallow landslide. Environ. Geol. 2008, 53, 1563–1569. [Google Scholar] [CrossRef]
- Iverson, R.M. Landslide triggering by rain infiltration. Water Resour. Res. 2000, 36, 1897–1910. [Google Scholar] [CrossRef]
- Lee, C.T. Review and Prospect on Landslide and Debris Flow Hazard Analysis. J. Taiwan Soc. Public Work 2009, 5, 1–29. [Google Scholar]
- Baum, R.L.; Savage, W.Z.; Godt, J.W. TRIGRS—A Fortran program for transient rainfall infiltration and grid-based regional slope-stability analysis. US Geol. Surv. Open-File Rep. 2002, 424, 38. [Google Scholar]
- Salciarini, D.; Godt, J.W.; Savage, W.Z.; Conversini, P.; Baum, R.L.; Michael, J.A. Modeling regional initiation of rainfall-induced shallow landslides in the eastern Umbria Region of central Italy. Landslides 2006, 3, 181–194. [Google Scholar] [CrossRef]
- Kim, D.; Im, S.; Lee, S.H.; Hong, Y.; Cha, K.-S. Predicting the rainfall-triggered landslides in a forested mountain region using TRIGRS model. J. Mt. Sci. 2010, 7, 83–91. [Google Scholar] [CrossRef]
- Vieira, B.C.; Fernandes, N.F. Shallow landslide prediction in the Serra do Mar, São Paulo, Brazil. Nat. Hazards Earth Syst. Sci. 2010, 10, 1829–1837. [Google Scholar] [CrossRef]
- Bisanti, B.; Molnar, P.; Burlando, P. Predicting rainfall triggered soil slips: A case study in the Emmental Region (Switzerland). Water Resour. Res. 2005, 36, 1897–1910. [Google Scholar]
- Khalili, N.; Khabbaz, M. A unique relationship for χ for the determination of the shear strength of unsaturated soils. Geotechnique 1998, 48, 681–687. [Google Scholar] [CrossRef]
- Conte, E.; Troncone, A. A method for the analysis of soil slips triggered by rainfall. Géotechnique 2012, 62, 187–192. [Google Scholar] [CrossRef]
- Soil and Water Conservation Bureau, Council of Agriculture, Executive Yuan. Major Landslide Disaster Bulletin for Typhoon Morakot of 2009; Soil and Water Conservation Bureau, Council of Agriculture, Executive Yuan: Taipei, Taiwan, 2009.
- Wang, C.Z.; Hsu, S.M.; Ke, C.C.; Su, T.W.; Lee, J.F. The relationship between soil thickness and slope gradient in taiwan mountain area. In Proceedings of the 13th Conference on Current Researches in Geotechnical Engineering, Ilan, Taiwan, 2–28 August 2009. [Google Scholar]
- Chen, S.C.; Wu, C.H.; Wang, Y.P. The discussion of the characteristic of landslides caused by rainfall or earthquake. J. Chin. Soil Water Conserv. 2010, 41, 94–112. [Google Scholar]
- National Science and Technology Center for Disaster Reduction. 2011 Sediment Disasters Impact Assessment in Slopeland; National Science and Technology Center for Disaster Reduction: Taipei, Taiwan, 2011.
- Chen, T.Y. An Application of the Point Estimate Method and Trigrs to Analyze Failure Probability of the Roadside Slopes in Aowanda; National Chung Hsing University: Taichung, Taiwan, 2011. [Google Scholar]
- Shih, H.J. The Topographical and Rainfall Characteristics of the Landslide-Triggered Debris Flow in Laofou Village; National Chung Hsing University: Taichung, Taiwan, 2012. [Google Scholar]
- Architecture and Building Research Institute, M.o.t.I.M (Ministry of the Interior, Architecture and Building Research Institute). Study on the Assessment of Regional Rainfall-Induced Landslide Hazards under Extreme Climate Conditions; Architecture and Building Research Institute, MOI (Ministry of the Interior, Architecture and Building Research Institute): Taipei, Taiwan, 2010.
- Ku, C.Y.; Chen, J.Z.; Zhang, Y.W.; Hsu, S.M.; Chen, N.J.; Wen, H.Y. Study on Assessment Techniques for Widespread Slope Disasters Induced by Extreme Rainfall Under Climate Change; Cooperative Report of the Architectural Institute of the Ministry of the Interior: New Taipei City, Taiwan, 2010. [Google Scholar]
- Chen, Y.H.; Tan, Z.H.; Ji, S.Y. Discussion on the Application of Different Regional Rainfall-Induced Landslide Analysis Models for Landslide Early Warning. In Proceedings of the 14th Geotechnical Engineering Conference, Taoyuan, Taiwan, 23–27 May 2011. [Google Scholar]
- Chen, J.X.; Tan, Z.H.; Ji, S.Y.; Su, T.W. Establishment and Application of Regional Rainfall and Landslide Induction Model—A Case Study of the Kaoping River Basin. J. Chin. Soil Water Conserv. 2011, 42, 1–11. [Google Scholar]
- Soil and Water Conservation Bureau, Council of Agriculture, Executive Yuan. Major Landslide Disaster Bulletin for Typhoon Fanabi of 2010; Soil and Water Conservation Bureau, Council of Agriculture, Executive Yuan: Taipei, Taiwan, 2010.


Disclaimer/Publisher’s Note: The statements, opinions and data contained in all publications are solely those of the individual author(s) and contributor(s) and not of MDPI and/or the editor(s). MDPI and/or the editor(s) disclaim responsibility for any injury to people or property resulting from any ideas, methods, instructions or products referred to in the content. |
© 2023 by the author. Licensee MDPI, Basel, Switzerland. This article is an open access article distributed under the terms and conditions of the Creative Commons Attribution (CC BY) license (https://creativecommons.org/licenses/by/4.0/).